Article

The Dynamics of Cyclical Convergence and Decoupling in the Environmental Performance of Spanish Regions

by
Alfredo Cabezas-Ares
1,*,
María Jesús Delgado-Rodríguez
1 and
Sonia de Lucas-Santos
2
1
Department of Business Administration (ADO), Applied Economics II and Fundaments of Economic Analysis, Universidad Rey Juan Carlos de Madrid, Pº Artilleros s/n, 28670 Madrid, Spain
2
Department of Applied Economics (Statistics), Ciudad Universitaria de Cantoblanco, Universidad Autónoma de Madrid, 28049 Madrid, Spain
*
Author to whom correspondence should be addressed.
Sustainability 2020, 12(20), 8569; https://doi.org/10.3390/su12208569
Submission received: 8 September 2020 / Revised: 8 October 2020 / Accepted: 12 October 2020 / Published: 16 October 2020
(This article belongs to the Section Air, Climate Change and Sustainability)

Abstract

:
Spain is aiming at moving towards a low-carbon economy. The success of this task will depend on the capacities of Spanish regions to follow the national energy and climate strategy and decarbonize their economies. In this paper, we analyze the CO2 fluctuations and links with economic activity, throughout the period 1990 to 2018, using dynamic factor and recursive estimation models. We confirm the robustness of our results by testing the stability of the estimated parameters. Our findings show that the dynamics of the pattern of synchronization and decoupling of the regions are quite similar. Nonetheless, there are significant differences regarding the comparison of levels and trajectories across regions, emphasizing the need to intensify efforts to achieve national objectives. This study highlights interest in utilizing the proposed approach for the analysis of the short-run dynamics of environmental performance.

1. Introduction

The European Union (EU) has launched important initiatives, focused on the supply aspect of the energy system, aimed at achieving the goal of reducing greenhouse gas (GHG) emissions by 80–90% by 2050 (2050 long-term strategy). This objective is at the heart of the European Green Deal and in line with the EU’s commitment to global climate action under the Paris Agreement. Although the EU pressured their member countries to implement energy and carbon reducing policies, there are differences in the involvement of the state members. This has generated interest in the assessment of environmental efficiency and comparison of performance across EU member states [1,2,3]. However, these works may conceal differences at the regional level that could be key to addressing the reduction in carbon emissions. Not taking these differences into account in the design of a sustainable environmental policy may make it difficult to reach the proposed targets. Thus, regional studies have recently sparked interest and spurred researchers to evaluate the efforts made by member states to achieve a sustainable economic system ([4,5,6,7,8,9]).
Most of these works have focused on the long-run approach, while the short-term analysis of the energy variables has been ignored. The short-run approach can be of interest as regards supplementing and improving research on the topic of the decoupling relationship between GDP and CO2 emissions. If regions are cyclically converging, this can enhance the effectiveness of the policy measures adopted to decouple CO2 emissions from economic activity. The main purpose of this paper is to fill this gap in the literature and propose the study of the cyclical convergence and decoupling patterns for greenhouse gas emissions. In line with this aim, we focus on the case of the Spanish regions. In Spain, national commitment was set out in the Strategic Energy and Climate Framework (3) (Spanish Ministry of Ecological Transition, 2019), which includes the Integrated National Energy and Climate Plan 2021-30 (PNIEC). This plan lays the foundation for a carbon-neutral economy by 2050 and it has been supported by preceding environmental legislation (see Table 1). Spain’s 2030 target for greenhouse gas (GHG) emissions not covered by the EU Emissions Trading System (non-ETS), is −26% compared to 2005, as established in the Effort Sharing Regulation (ESR), while the emissions target covered by the ETS is −43%. The assessment of environmental performance by regions will allow us to understand better the possibilities of achieving national objectives.
There are quite a few studies that have delved into the CO2 emissions for Spain. Apergis and Garzón [11] examined the convergence of greenhouse gas emissions per capita over the period 1990 to 2017. They found evidence of four clubs which involve different regions. In their research, García-Gusano et al. [12] employed dynamic econometric models to project the electricity demand in Spain and introduce the projections as input for the Spanish energy model, created using the LEAP framework. Their result, for the period 2010–2015, shows the existence of decoupling and proves that industry demand is overestimated, whereas residential demand is undervalued. Cansino et al. [13] estimated a structural decomposition of changes in CO2 emissions by using an enhanced structural decomposition analysis (SDA) for the period 1995–2009. In this paper, the authors conclude that the implementation of renewable energy sources (RES) appears to have a positive impact on CO2 emissions trends in Spain. Ruiz-Fuensanta [14] calculated the inefficiency levels of Spanish regions during the period 2003–2008 and estimated an environmental directional distance function using different sources. The results confirmed the existence of significant differences in the behavior and evolution of regional energy efficiency. The work of Quesada-Rubio et al. [15] reflects a detailed study of emissions and allowances of the industries by regions to test efficiency and compliance with requirements and conditions prescribed in their regulations. Results highlight significant differences across regions.
Unlike the above-mentioned papers, this paper focuses on the assessment of the trajectories of the Spanish regions by studying the dynamics of the synchronization of the cycles, cyclical convergence, and of relative decoupling. Synchronization of emission cycles means similar movements of the region´s growth rates over time. We can relate this analysis to the advance towards a common national environmental strategy. In the design of this strategy, we consider the decoupling of emissions from economic activity to be one of the main objectives. Relative decoupling occurs when resource use or emissions increase less than the GDP does. Such a study should be a valuable complement to the work done on energy efficiency and the convergence characteristics. To this end, in this analysis, we employ the dynamic factor model to parametrically estimate the Spanish cyclical performance of CO2 emissions and also utilize a recursive estimation model to assess the dynamics of the cyclical convergence of the CO2 emissions fluctuations and decoupling effectiveness at the regional level. Additionally, the parametric approach offers the significant test of correlation alongside the sample, which is not usually conducted and which allows us to monitor the dynamics of cyclical convergence and decoupling across the Spanish regions throughout the 1990–2018 period. Consequently, we can evaluate the efforts that each Spanish region makes to improve environmental efficiency and convergence concerning their CO2 emissions. Furthermore, we applied the robustness check proposed by Cendejas et al. [16], to confirm the stability of our results. Finally, this paper provides an analysis of the cyclical characteristics of the national CO2 emission cycle in terms of duration, amplitude, and intensity, using the Harding and Pagan method [17]. This is the first study, to the best of our knowledge, that assesses both types of concepts in the same evaluation analysis and for the Spanish regions.
The article is structured as follows. The next section describes the methodology and data utilized for our analysis. In Section 3, we evaluate and discuss the results obtained for the Spanish regions. The final section presents the conclusions and policy implications of the paper.

2. Methods and Data

The assessment of the cyclical environmental performance of Spanish regions is rooted in the application of business cycle analysis methods, and in our analysis, we resort to synchronization and decoupling concepts. Firstly, synchronization implies an increase in the level of similarity between the regional CO2 emissions cycles, that is, the existence of cyclical convergence. Next, the decoupling concept is used to reflect the asynchronous changes in the relationship between environmental pressures and economic activity. In this analysis, it is necessary to first obtain the cyclical component of CO2 emissions. Accordingly, the annual series on per capita carbon dioxide emissions at the regional level have been log-transformed and differentiated ( Δ = 1 L , being L the lag operator) to obtain the regional carbon emission cycles. To this end, the dataset spans from 1990 to 2018 and covers the 17 Spanish Autonomous Communities and the two Autonomous Cities of Ceuta and Melilla. Greenhouse gas emissions data by regions are obtained from the Spanish Informative Inventory System. GHG per capita are measured in thousands of tons of carbon dioxide equivalents (ktCO2eq). Data on population are obtained from the Spanish Regional Accounts database published by the Spanish Statistical Office (INE). Real GDP data by region are expressed in thousands of constant 2010 euros [18].
To investigate the dynamics of short-run CO2 emission fluctuations in Spain, the estimation of the national cycle is performed or carried out with a multivariate unobserved component model. To that end, we model the degree of co-movements in CO2 emissions using a dynamic factor model by Stock and Watson [19]. The dynamic factor model is based on the assumption that a small number of unobserved latent factors, f t , generate the observed time series through a stochastically perturbed linear structure. Formally, it is assumed that the pattern of observed co-movements of a high-dimensional vector of time series states, X t = Δ ln C O 2 i . t , can be represented by a few unobserved latent common dynamic factors. The latent factors follow time series processes, which are commonly taken to be a vector autoregressive model (VAR). The dynamic factor model can be summarized as
X t = Λ f t + e t f t = ψ ( L ) f t 1 + η t
where there are N Spanish regions, so X t and e t are N × 1; there are m dynamic factors, so f t and η t are m × 1, Λ = ( β 1 , β 2 , , β m ) is N × m, L is the lag operator, and the lag polynomial matrix ψ ( L ) is m × m. The i-th β i are called factor loadings for the i-th regions, that offer the level of participation of each region regarding co-movements captured by the common factor or factors. The idiosyncratic disturbances, e t = ( e 1 , t , e 2 , t , , e N , t ) , are the specific elements of each series contained in a vector. They are assumed to be uncorrelated with the factor innovations at all leads and lags, that is, E e t η t k = 0 for all k . The standard estimation is via the model in state-space form using the Kalman filter programmed in GROCER’s Econometric Toolbox [20], assuming that all the processes in (1) are stationary and not cointegrated.
We can confirm the existence of a national cycle of CO2 emissions, f ^ C O 2 , t , by employing the statistical criterion proposed by Bai and Ng [21]. If we obtain only one common factor, this factor can represent the Spanish cyclical performance of CO2 emissions. For a better identification of this fluctuation pattern, we also employ the Harding and Pagan [17] dating method. This method enables us to examine the turning points (the peaks and troughs) of the Spanish cyclical performance of CO2 emissions, with contractions or declining phases designated as peak-to-trough (PT) and expansions or increasing phases as trough-to-peak (TP). It also enables us to estimate their characteristics regarding the duration, amplitude, and intensity of phases and complete cycles:
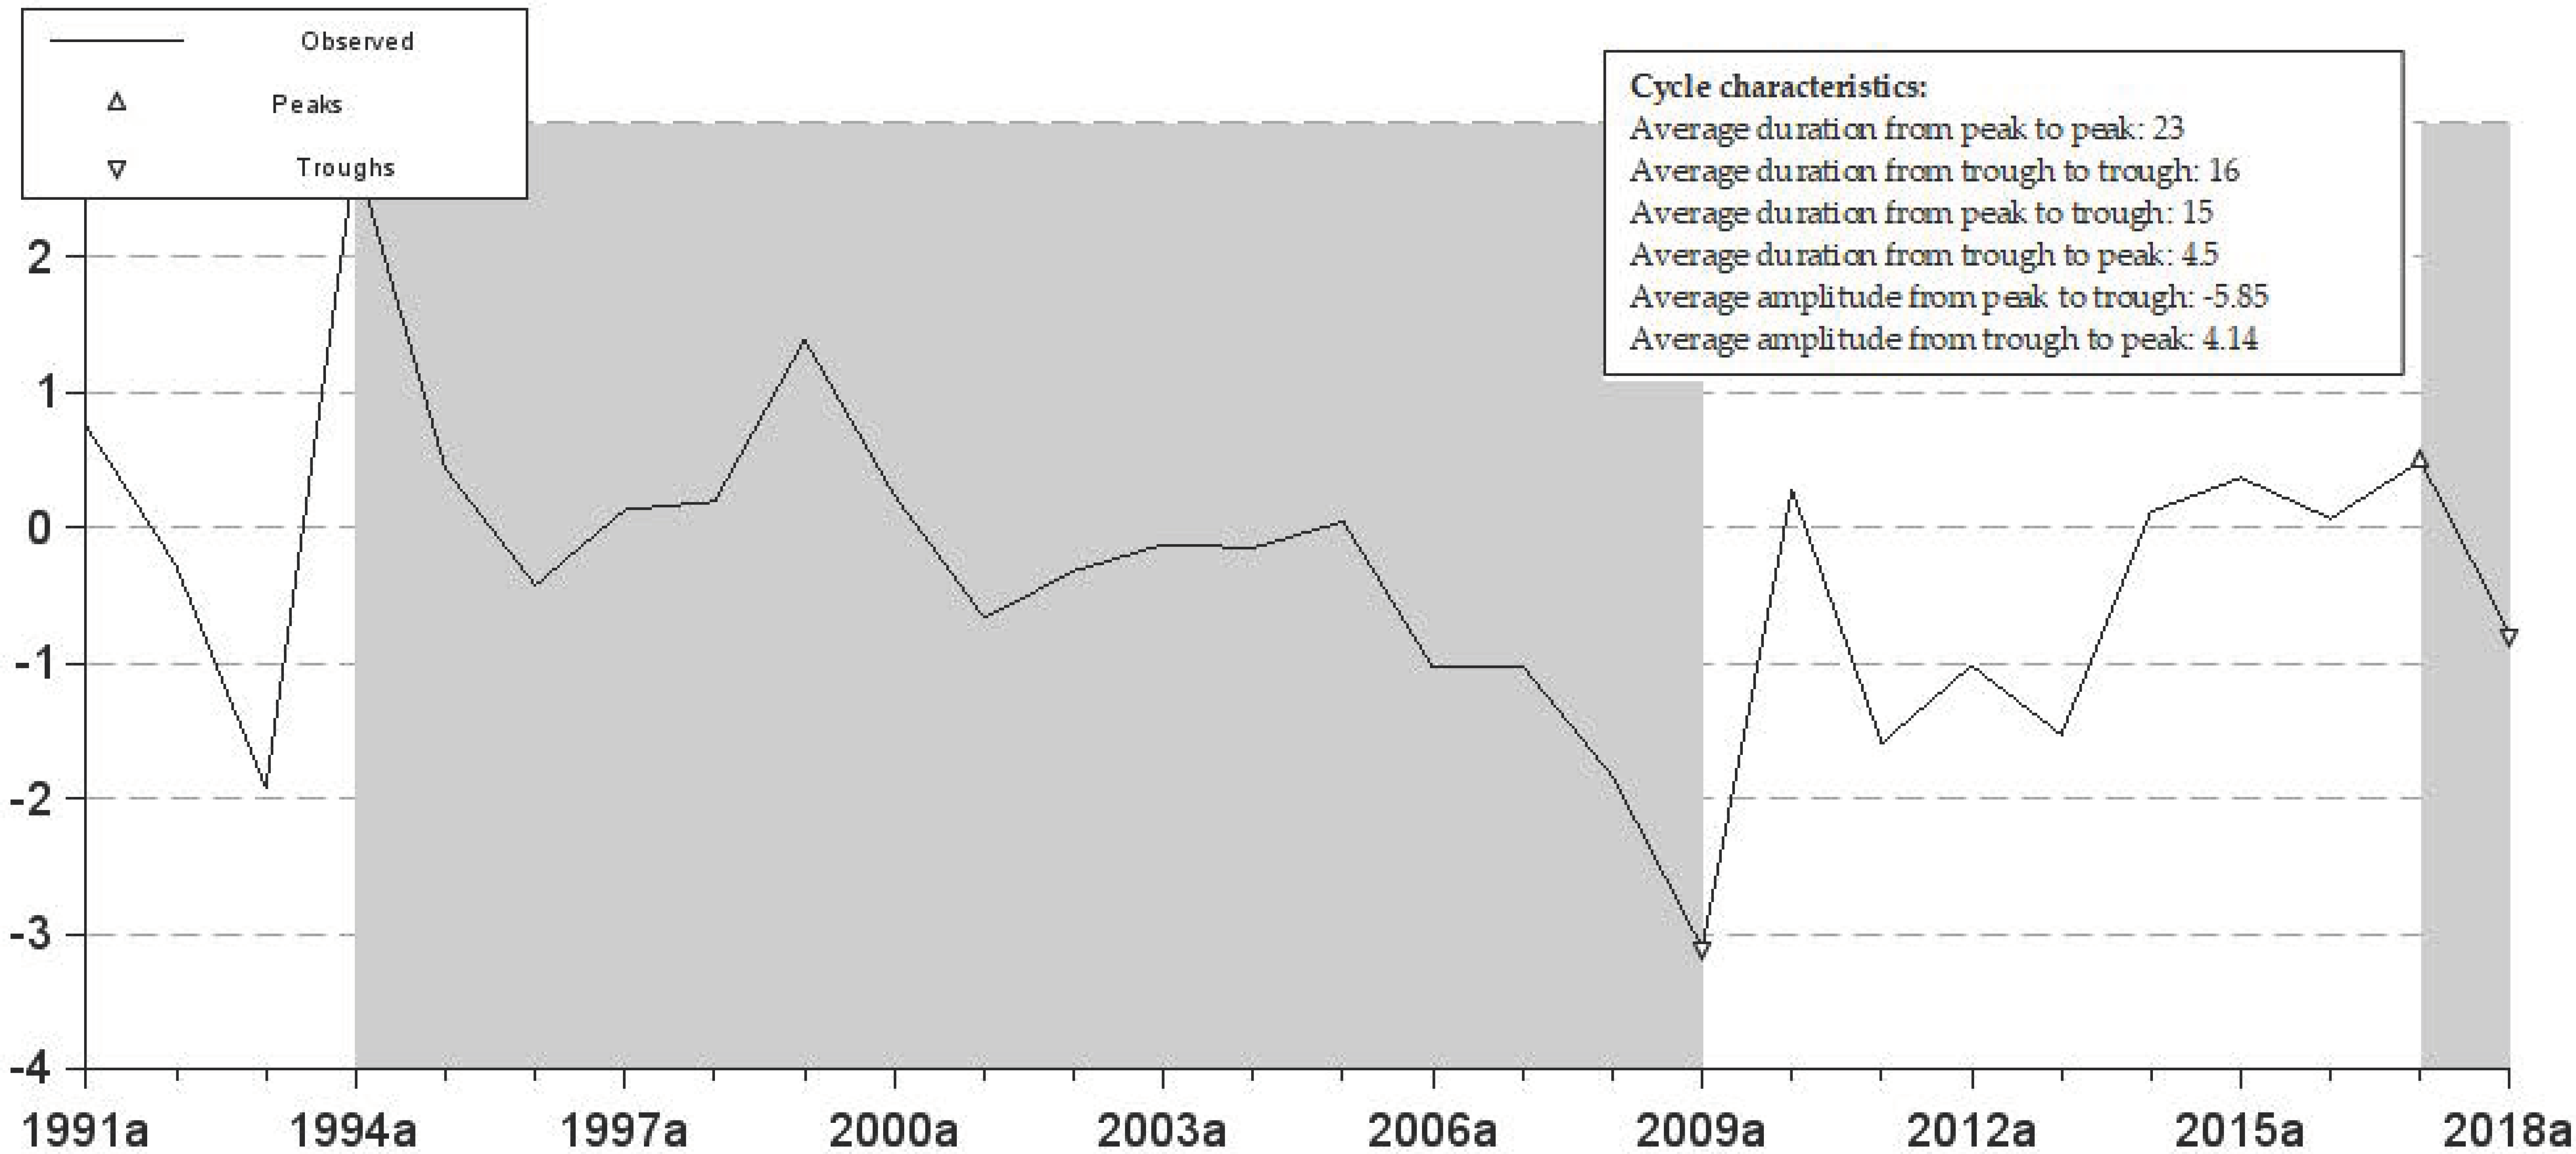
  • Duration of the phase is observed according to its length along the abscissa axis.
  • Amplitude would be the height of the phase, which is observed as it increases or decreases on the ordinate axis.
  • Intensity relates to the amplitude and duration of each phase, such that if the phase has more amplitude and shorter duration, it is more intense and more pronounced graphically.
The study of the dynamics in the cyclical behavior of the national CO2 emissions enables assessment of the trajectory of the cyclical convergence of the regions. In line with this objective, we propose the use of a recursive estimation model put forward by Andrews [22] to test parametrically the degree of cyclical convergence of the Spanish regions with respect to national behavior throughout the period. Accordingly, we recursively estimate:
x i , t = β i ( τ ) f ^ C O 2 , t + v i , t ( τ )
where the moving index τ = τ 0 , τ 0 + 1 , , T excludes some portions (trimming) of the sample at the beginning, where τ 0 = π T (the integer part), and π , the proposed trimming, is a minimum sample percentage excluded at the beginning of the sample.
This procedure allows us to extract information on how the Spanish regions are synchronizing their emissions cycles following a common national environmental strategy by offering additional graphic information on their evolution as a continuum of results and their t-statistics.
A relevant aspect to consider in this analysis is whether the advances towards a national common behavior are linked to the decoupling of their economies from energy. With this aim, we also assess the relationship between the CO2 emissions fluctuation of each region with their own business cycle. We apply the recursive estimation model to evaluate the progress in dissociation between CO2 emissions from economic activity. Until now, the “Tapio decoupling model” by Tapio [23] has been widely adopted by many investigators, such as Jiang et al. [24], and Qiu et al. [25]. In this paper, we use an alternative method in line with the correlation analysis of Doda [26], who evaluates the relationship of the cycles of the CO2 emissions and GDP across countries through contemporaneous cross-country correlation. For this study, we propose the following model:
x i , t = ρ i ( τ ) ln G D P i , t + ξ i , t ( τ )
The results obtained for the recursive coefficients ρ i ( τ ) of model (3) show the dynamics of the Spanish regions regarding decoupling their CO2 emissions from their GDP over the period.
By integrating the results obtained in the recursive estimations of (2) and (3), we can check whether the regions are converging towards a common national cyclical behavior, β ^ i ( τ ) , and if this behavior is followed by relative decoupling, ρ ^ i ( τ ) .
Finally, we confirm the robustness of our results by testing the stability of the estimated parameters to check the existence of structural or temporal breaks. If the date of a possible break is unknown, a recursive testing procedure could be employed [16]. The null hypothesis H 0 of the parameters’ stability of each model is H 0 : β i ( τ ) = 0 and H 0 : ρ i ( τ ) = 0 , respectively.
Recursive estimations β ^ i ( τ ) and ρ ^ i ( τ ) are obtained from (2) and (3) and the F-type statistic (Wald-type statistic) to test for a break of an unknown date is
F S u p W a l d , i = m a x [ F i ( τ 0 ) , F i ( τ 0 + 1 ) , , F i ( T 1 ) , F i ( T ) ]
The asymptotic distribution of the F S u p W a l d , i statistic is not standard because the break date appears only under the alternative hypothesis. In this work, empirical critical values with no asymptotic sample sizes and autocorrelated errors have been calculated by Monte Carlo simulation according to our data characteristics, that is, by assuming autocorrelation disturbances in (2) and (3) and for the available sample sizes [16].

3. Analysis Results

3.1. Spanish Cyclical Performance of CO2 Emissions

We estimate the Spanish cyclical performance of CO2 emissions over the period 1991–2018. The information on the national cycle of CO2 emissions in Spain is valuable information with respect to the study of the short-run main characteristics of its behavior. The results from (1) are shown in Table 2. The AR idiosyncratic parameter and noise ratio confirm the suitability of the model. The significance of the loading factors indicates which regions’ emissions are co-moving, following a national cycle, and which are not. We find that all the regions have significant and statistically similar factor loadings with the exceptions of the Autonomous Cities of Ceuta and Melilla. These territories are then excluded from the estimation and therefore they do not appear in Table 2. Ceuta and Melilla follow an independent emissions pattern.
The results concerning the national cycle of CO2 emissions allow us to provide an analysis of its cyclicality properties. Figure 1 shows the evolution of the CO2 emission cycle from 1991 to 2018. Upon examination of the three decades, we identify a phase from peak to trough (1994–2009) where a decline in the growth emissions occurs. In the course of those years, the United Nations Framework Convention on Climate Change (UNFCCC) 1992, and the subsequent Kyoto Protocol 1997 took place. To this is also added the EC´s decision to set long-term objectives, based on the 1990 emissions, which has contributed positively to moderate growth in CO2 emissions. The year 2009 witnessed a phase of increase in emission growth that spanned 2009–2017 (from trough to peak). During this phase, the recovery of the Spanish economy contributed to this rise in the emissions. Analysis of the national emission cycle shows a clear asymmetry in their behavior, with the average duration of the declining phase being longer than that of the expansions. In addition, the declining of emissions is on average steeper or more intense than the expansions when the amplitude is studied.

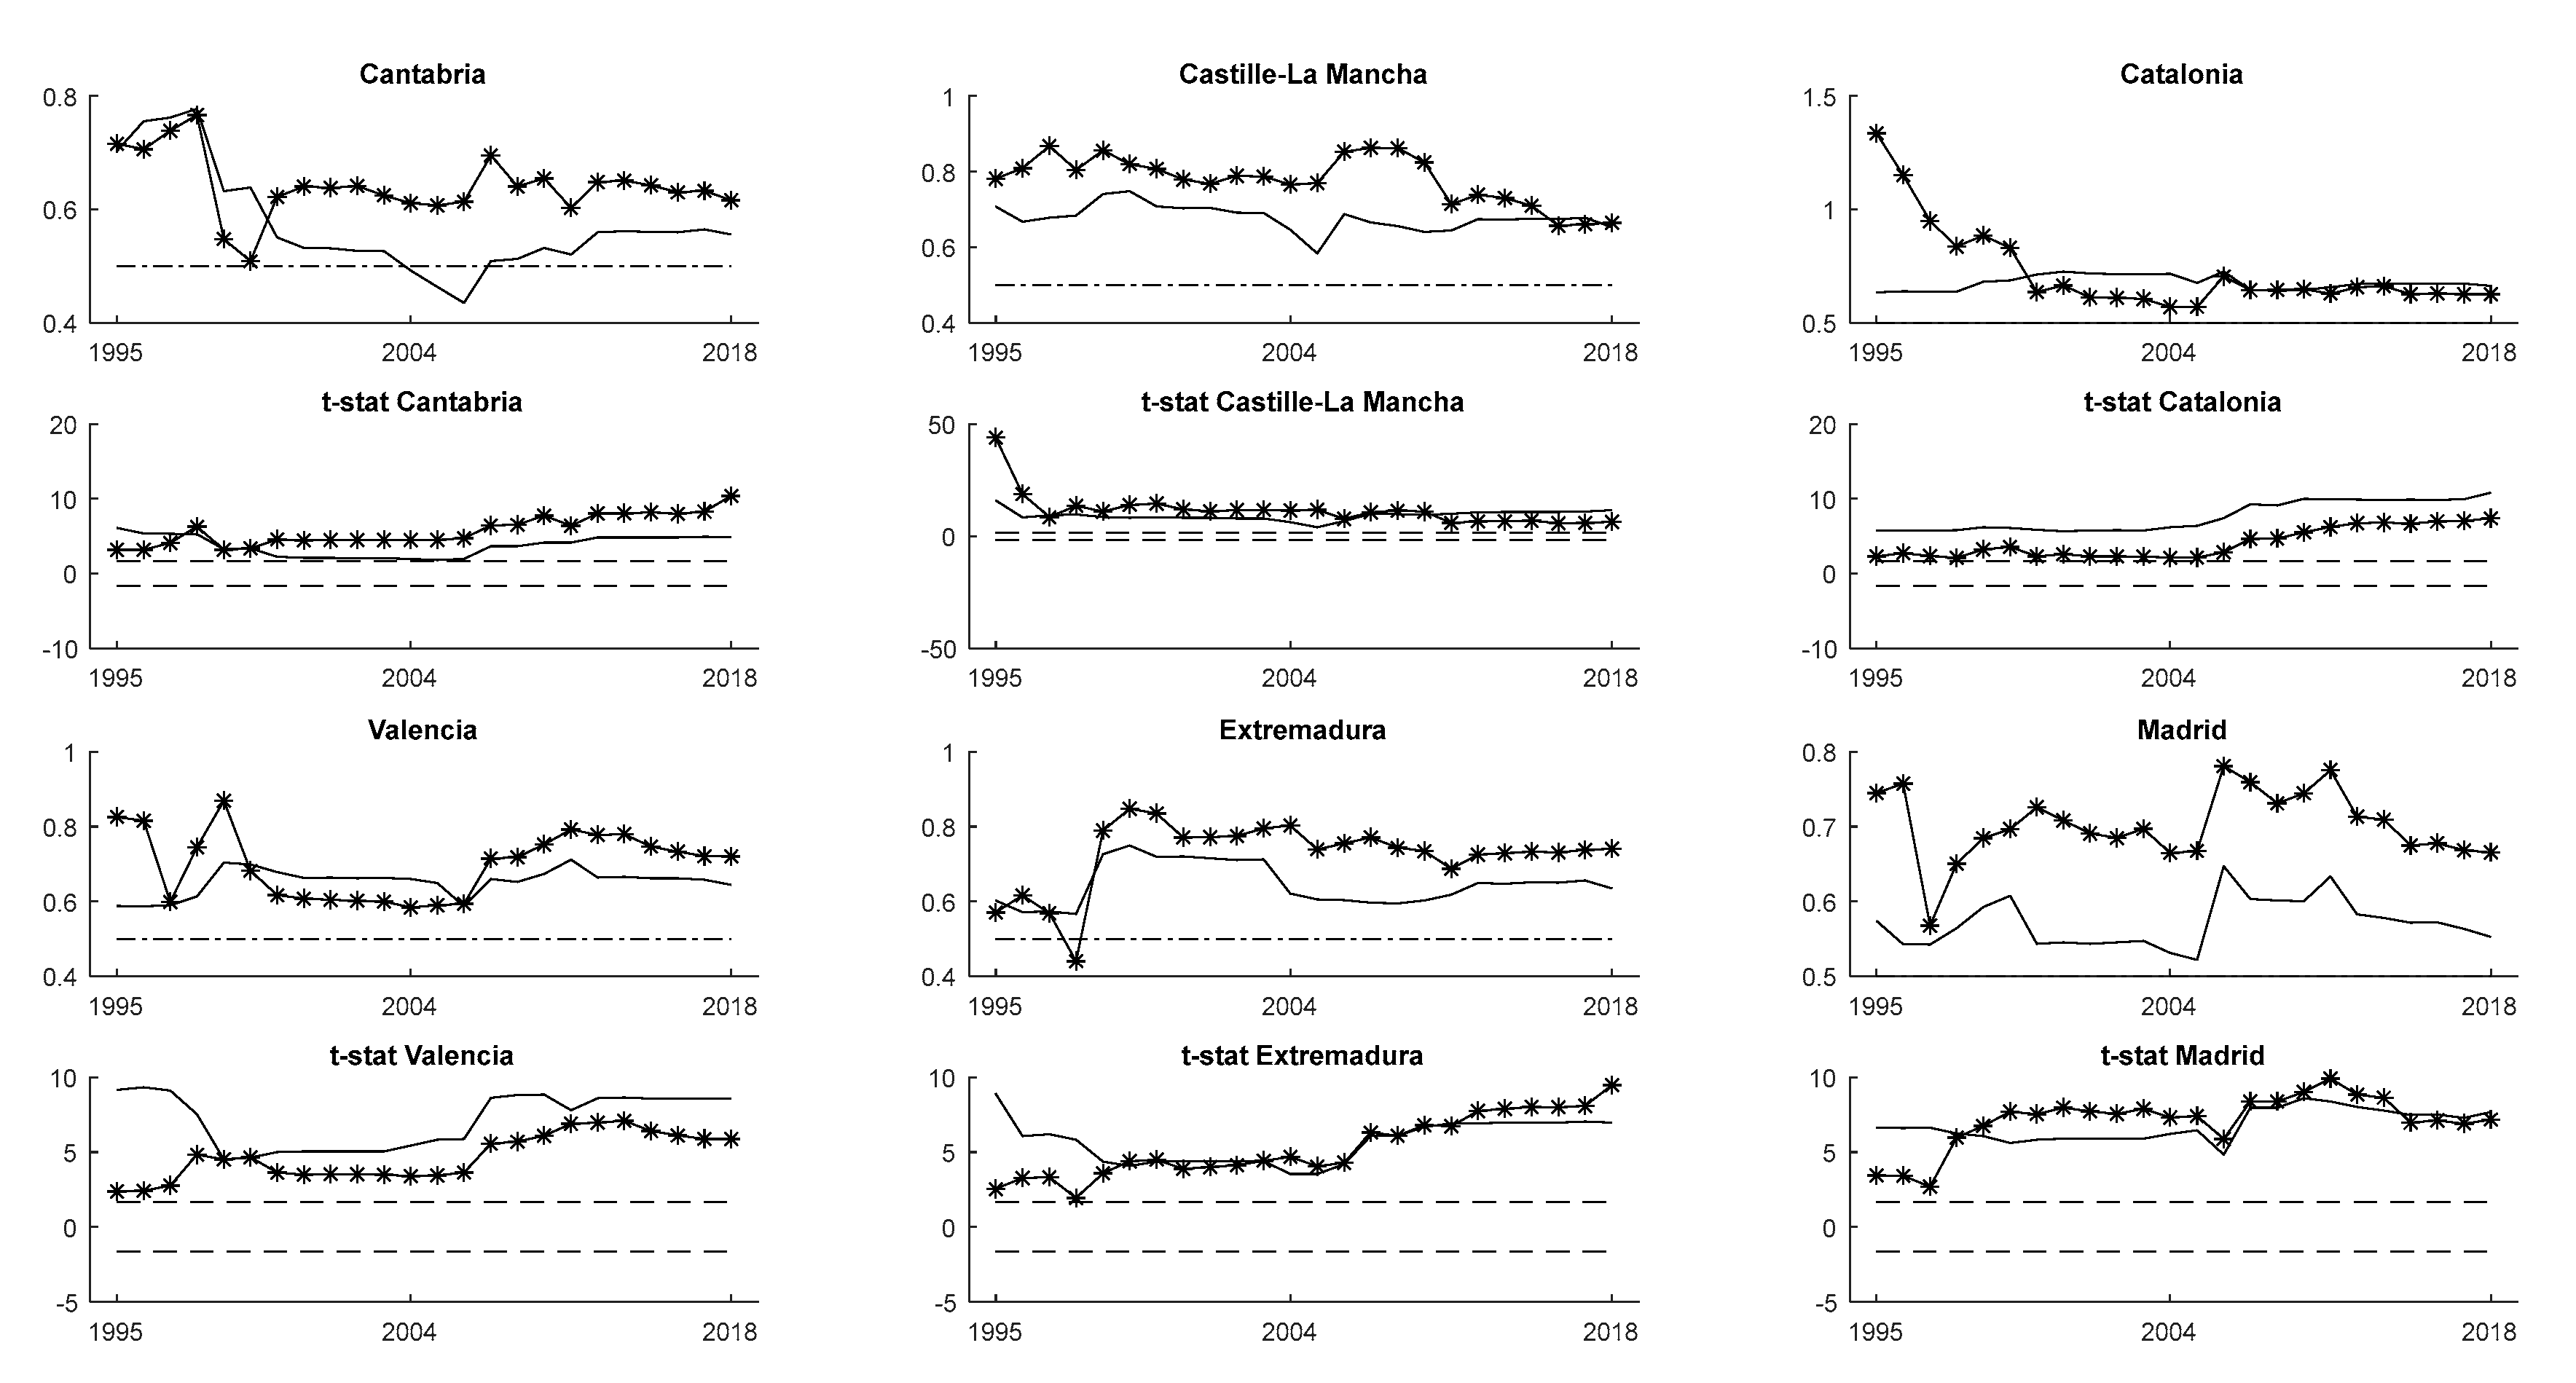
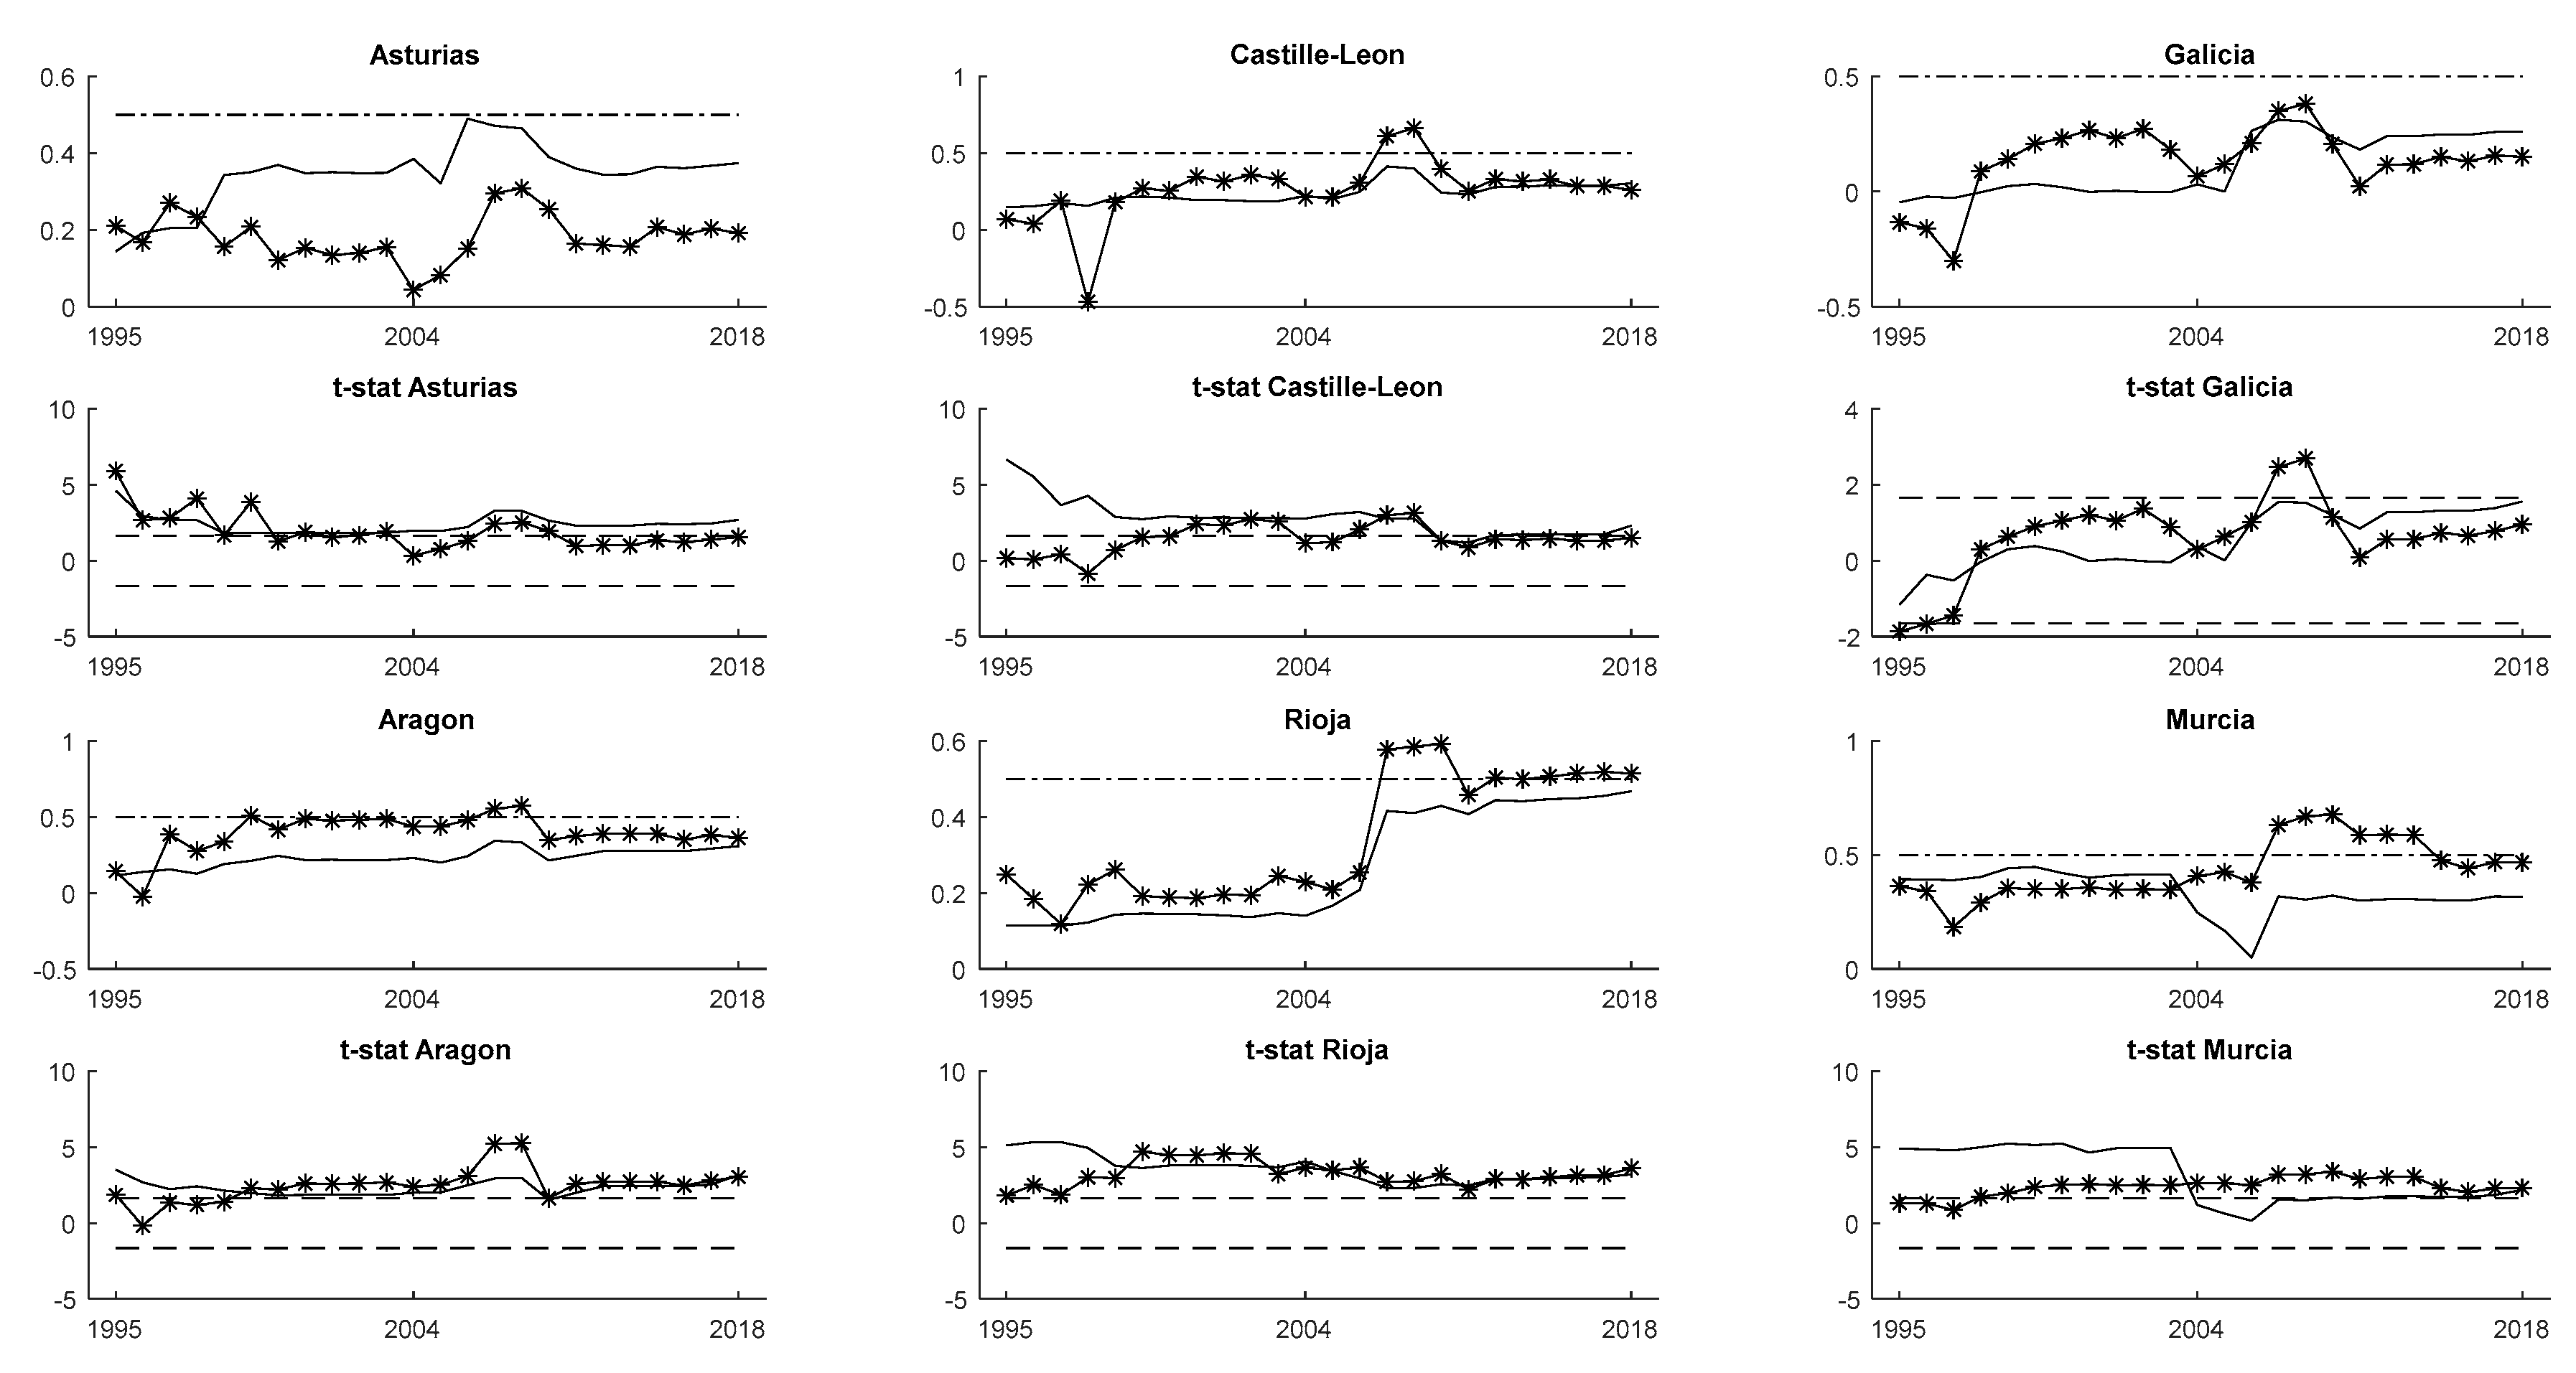
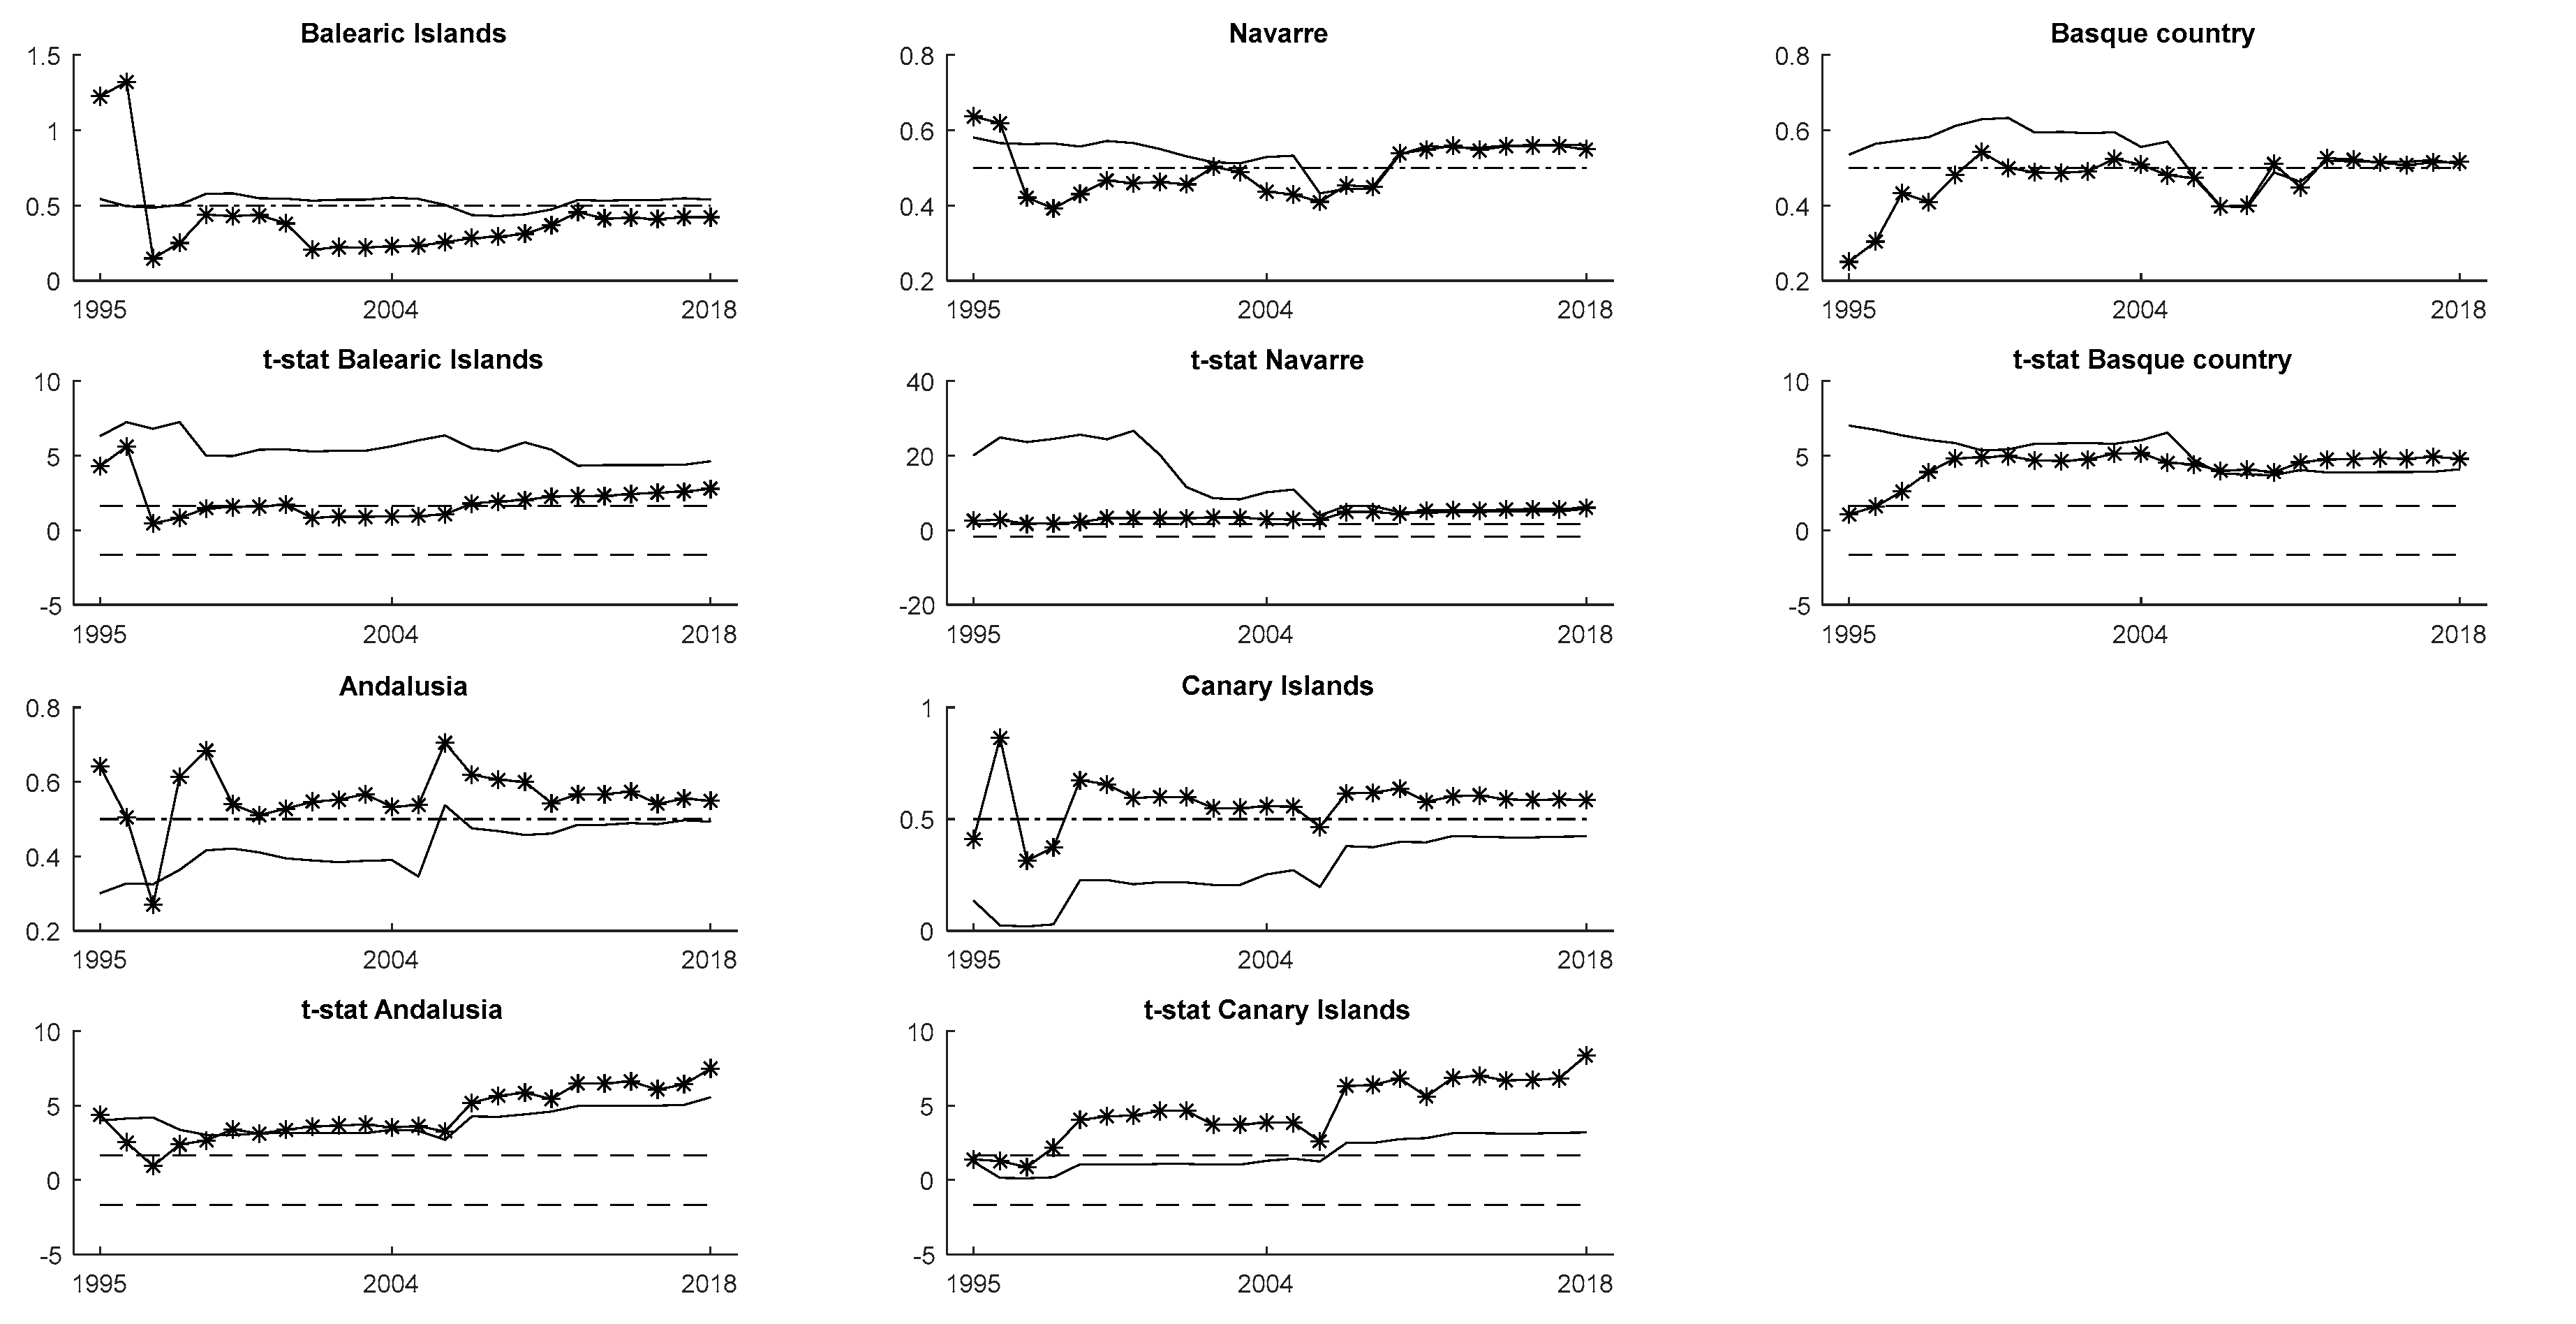
3.2. The Dynamics of Cyclical Convergence and Decoupling

The recursive estimation model proposed in the methodological section is employed to evaluate the dynamics of cyclical convergence and track the efforts made to decouple CO2 emissions from the GDP. Our proposal allows us to assess and compare, on a yearly basis, the efforts made by the Spanish regions. By integrating both analyses, we can check whether the regions are converging towards a common national cyclical behavior, β ^ i ( τ ) , and if this behavior is followed by relative decoupling, ρ ^ i ( τ ) . The continuum of results obtained in both estimations and their t-statistics are shown in Figure 2, Figure 3, Figure 4 and Figure 5.
We monitored the results for each Spanish region, thereby allowing us to comparatively evaluate the dynamics of the patterns of synchronization and decoupling. As it is standard in the empirical literature, we can consider that the correlation is high if β ^ i ( τ ) or ρ ^ i ( τ ) take on values >0.5. Following these criteria, it is possible to differentiate three main groups of regions.
In the first group (Figure 2), we include regions that show high correlation of emissions with national behavior and with the GDP. The group includes Cantabria, Castille-La Mancha, Catalonia, Valencia, Extremadura, and Madrid. For these regions, an important result is that the trajectories of synchronization and decoupling are quite similar throughout the period, except for Cantabria. In the study of the cyclical convergence, the Spanish regions show quite stable patterns. Nonetheless, in cases like Madrid, we observe that after a strong increase, since 2005, it has become negative. Cantabria also shows a decrease in the synchronization below 0.5 in 2005, but it recovers again the following year. These regions, in general, show positive trajectories in their decoupling of CO2 emissions from the GDP, especially at the end of the period studied. However, this is not enough to reach correlations below 0.5 over the period. We can highlight Catalonia with the most intense decoupling results that happen during the national declining phase of CO2 emissions (1994–2009). In Valencia, Castille-La Mancha, and Madrid, this process is not stable but, approximately since the mid-2000s, we observe a positive trajectory in its decoupling. In the case of Extremadura, this region decreases slightly concerning the correlation between GDP and CO2 emissions throughout the period studied. The results show the difficulties experienced by these regions in implementing efficient environmental policies, as evidenced by the difficulties to reduce the correlation results below 0.5.
In the second group (Figure 3), we include regions with correlation close to or <0.5. We also observe that the patterns of synchronization and decoupling are quite similar. Within this group, we find regions that clearly maintain the correlation results for synchronization and decoupling below 0.5. This subgroup comprises the regions of Asturias, Castille-Leon, and Galicia. These regions show a slight increase in their cyclical convergence towards the national emissions cycle which can facilitate the coordination of environmental performance. The regions in this subgroup maintain, in general, their level of decoupling below 0.5 throughout the period, except Castille-Leon which shows a few years in which it increases, reaching the value of 0.5. These regions should intensify their efforts to improve results.
We can identify another subgroup that includes Aragon, Murcia, and Rioja with results closer to 0.5. Aragon and Rioja show a positive trajectory in their cyclical convergence, but they have also experienced an increase in correlations in the process of decoupling their emissions from the GDP. This result is cause for concern regarding these regions. In Rioja, a significant increase in the correlation between emissions and GDP is observed in 2004, although it slows down in subsequent years. In the case of Aragon, this increase occurred in the mid-1990s and was slightly reduced by the economic crisis. Lastly, we observe in Murcia an upward trajectory for the correlation between CO2 emissions and GDP, reaching values above 0.5 after 2005, although soon after it shows a downward evolution during the crisis, returning to values below 0.5. In this region, the convergence with the national cycle reaches values below 0.5, with a decreasing trend during this period.
The third group (Figure 4) includes regions with differences in the initial levels and trajectories obtained in the synchronization and decoupling analysis. However, an important approximation in these patterns is observed at the end of the period in all the regions. In this group, we find Andalusia, Basque Country, Balearic Islands, Murcia, and Canary Islands. First, we examine the cases of Balearic Island, Navarre, and Basque Country. In these regions, we observe an increase in correlation in the decoupling process, reaching correlation levels close to 0.5. On the other hand, they show a decrease in the synchronization with the national emission cycle. For these regions, it is important to control the negative evolution of these variables. Next, we identify the cases of Andalusia and Canary Island with levels of decoupling correlation above 0.5, with slight decreases during the period studied. For these two regions, we find a positive evolution for the synchronization of their emissions, showing a cyclical convergence with a correlation under 0.5, that increases during the years studied. This is a promising trajectory for both regions. In general, we can consider that these regions only made moderate efforts in decoupling, not taking advantage of the starting lower correlation.
Finally, in the case of Ceuta and Melilla, their analysis allows us to verify that these Autonomous Cities follow an independent path in their emissions (Figure 5).
The results obtained in the analysis highlight the differences that exist across the Spanish regions, which are in line with previous works cited for the Spanish economy using different methodologies. The difficulties found to increase cyclical convergence in their carbon emission cycles may be a problem with respect to achieving the mitigation commitment and advance in the implementation of the Strategy Energy and Climate Framework.

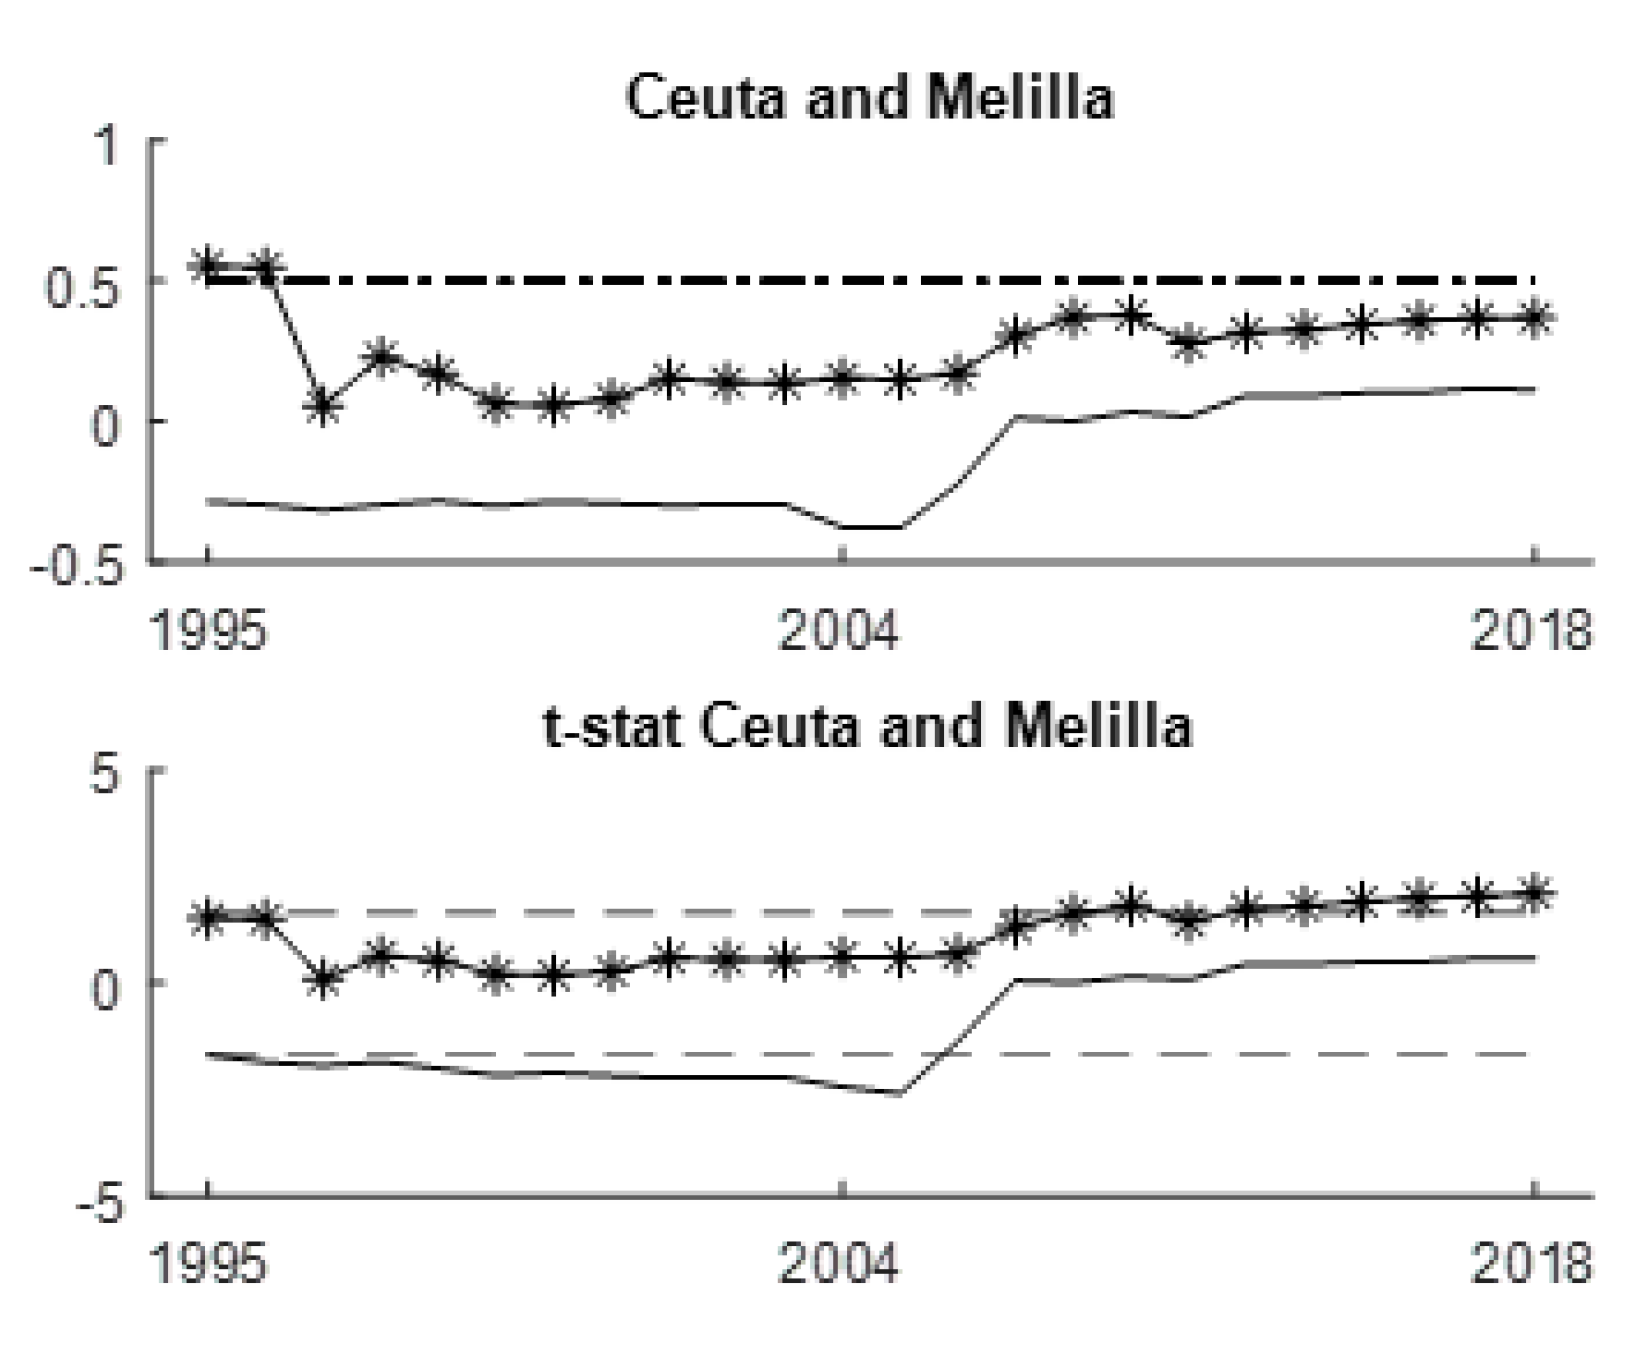
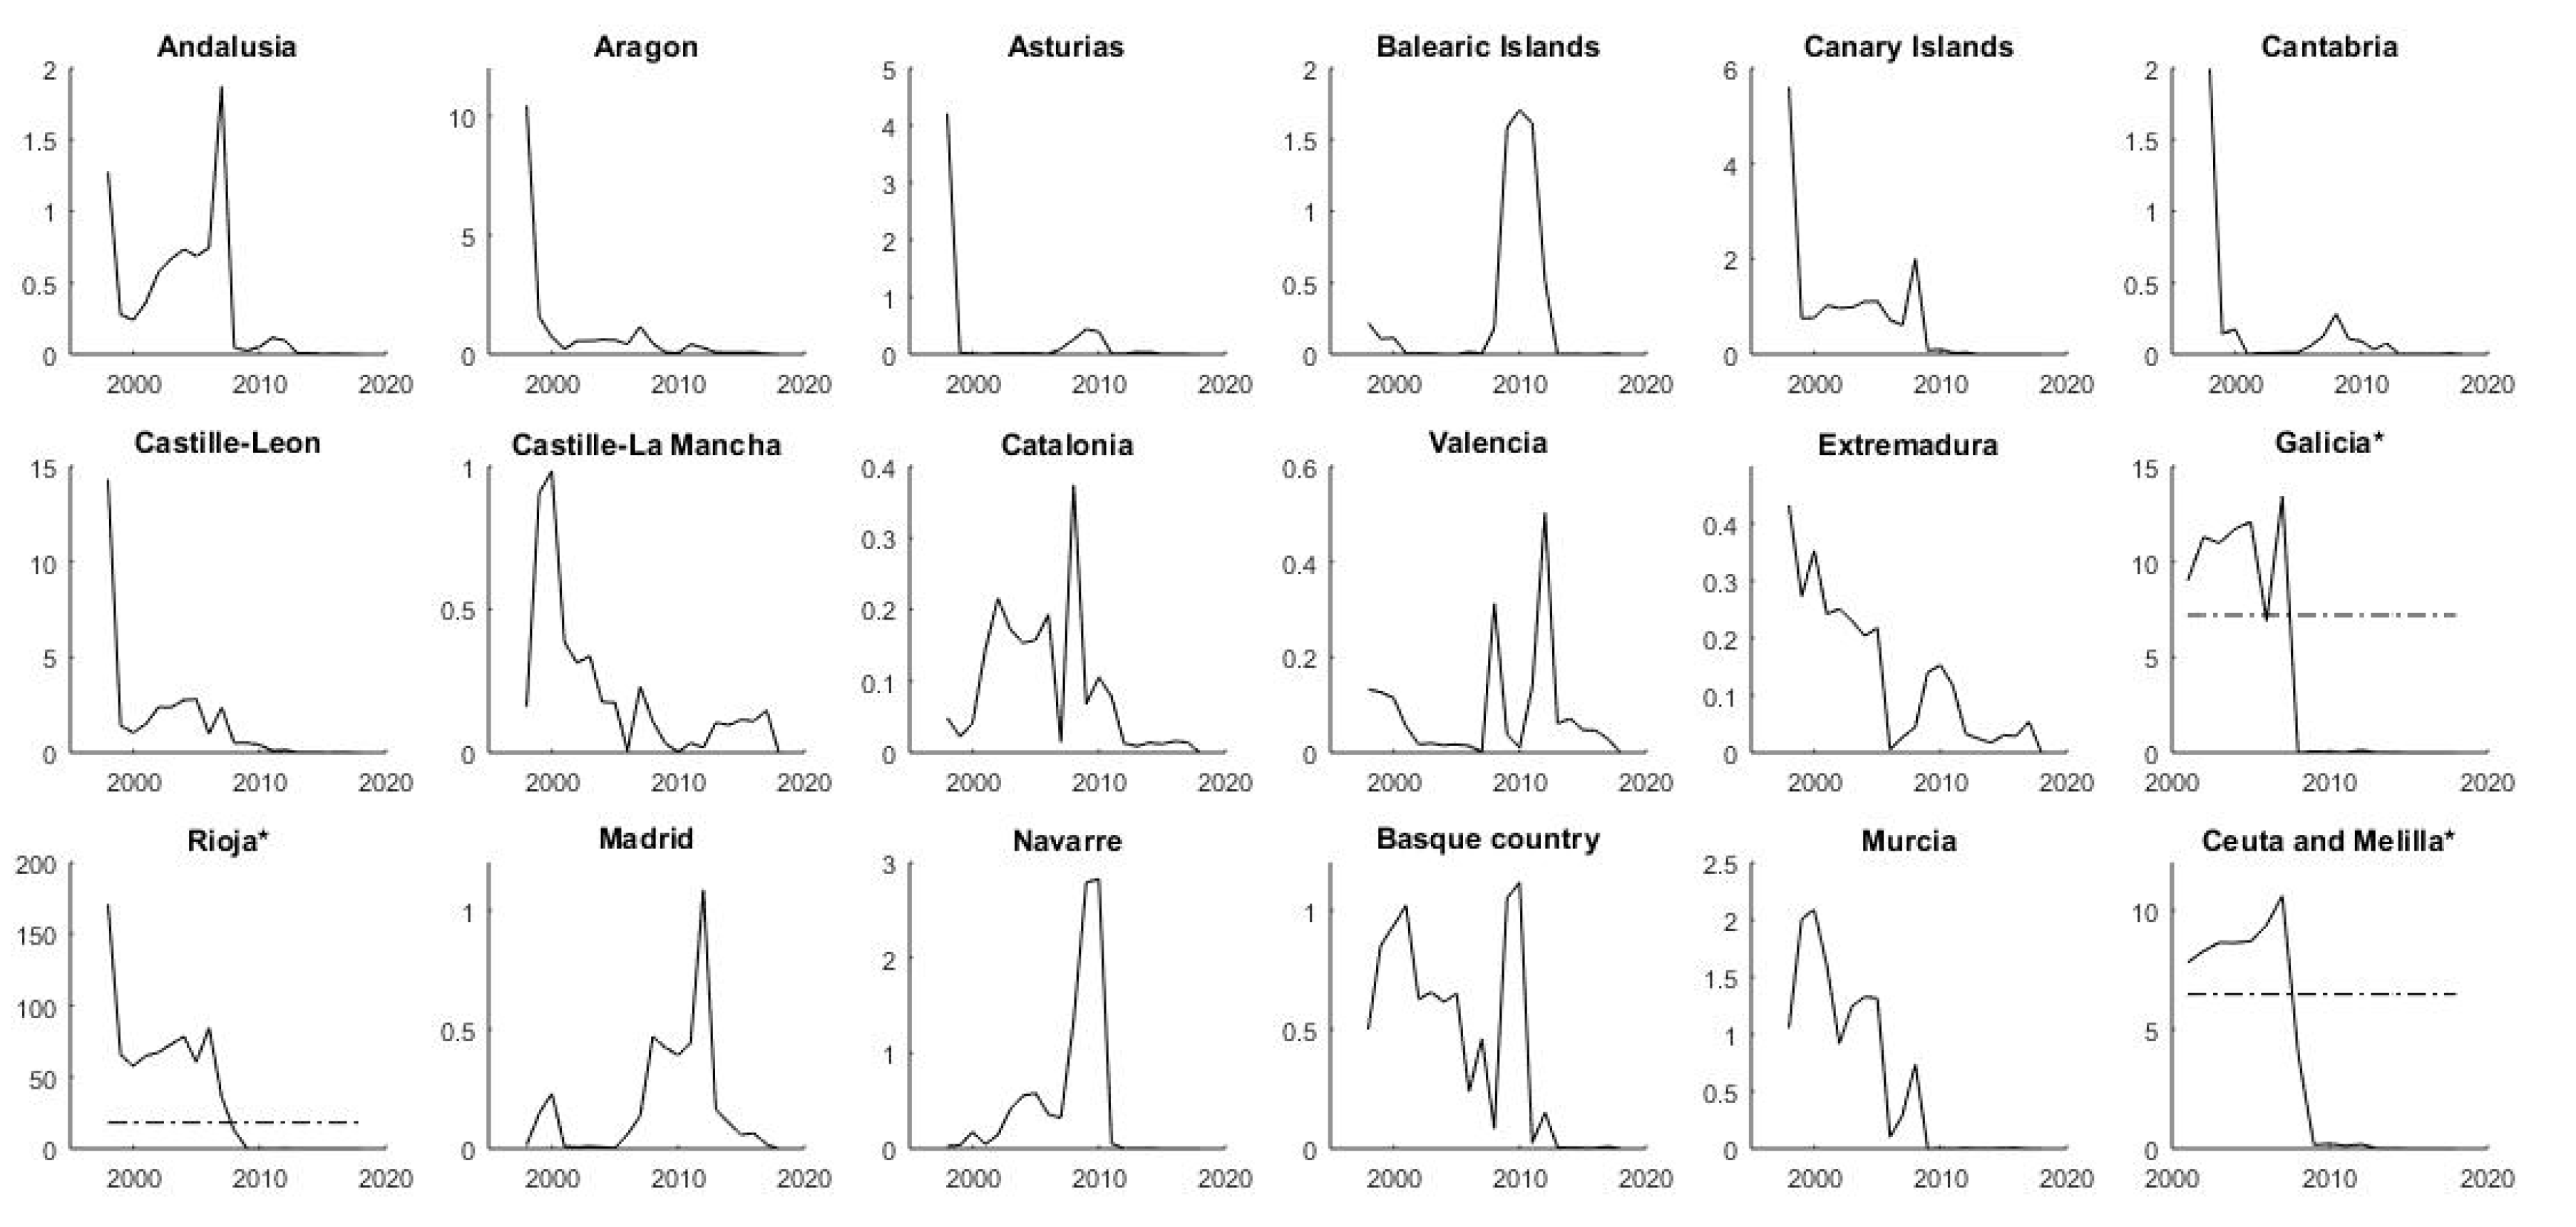
3.3. Robustness Checks

We performed a number of robustness checks to test the validity of our results. First, we confirmed the existence of only one common factor, f ^ S S , t , by employing the statistical criterion proposed by Bai and Ng [21]. The number of dynamic factors, p , following [21], is p r , where r is the number of static factors determined by Bai and Ng [27], where p = 1 since r = 1 according to the following criteria:
I C p 1 ( q ) = log ( det ( ) ) + q ( N + T ) n T + log ( n T N + T ) I C p 2 ( q ) = log ( det ( ) ) + q ( N + T ) n T + log ( min ( n , T ) ) I C p 3 ( q ) = log ( det ( ) ) + q log ( min ( n , T ) ) ( min ( n , T ) )
where = v a r i a n c e   m a t r i x   o f   r e s i d u a l   e t .
Next, we confirmed the stability of the parameters and verified the non-existence of structural or temporal breaks in models (2) and (3). In line with this aim, we applied the robustness check proposed by Cendejas et al. [16] to observe changes in the estimated parameters. First, we apply the robustness check for the recursive estimations β ^ i ( τ ) from (2) to detect any possible breaks that reflect changes in regional behaviors related to difficulties to adhere to national environmental policies. We show results for the estimation breaks and the F-type statistic (Wald-type statistic) in Table 3 and Figure 6. Some temporal breaks were found in Galicia in 2007 and Rioja in 2006, which can be linked to the beginning of the economic crisis in Spain. A third break, this time structural, was found in Ceuta and Melilla, confirming that these Autonomous Cities follow independent patterns.
Then, we applied the robustness check for the recursive estimations ρ ^ i ( τ ) from (3) to detect any possible breaks that reflect changes in the regional behaviors associated, this time, with the possibility of decoupling emission growth from economic activity. We show results for the estimation breaks and the F-type statistic (Wald-type statistic) in Table 4 and Figure 7. The results reveal only temporal breaks in 2010 in Castille-la Mancha and in 2000 in Rioja.

4. Discussion and Conclusions

Spain faces the challenge of fulfilling the commitments set out in the Integrated National Energy and Climate Plan 2021-30 (PNIEC). With respect to this challenge, the Spanish regions have an important role that must be considered. The purpose of our research is to contribute to the understanding of regional environmental performance by offering a short-run dynamics analysis of CO2 emissions. There is no paper that uses this approach in the literature on the environmental behavior of the Spanish regions. Therefore, the present study is highly significant from the practical viewpoint. The short-run approach could be of interest regarding supplementing and improving research on the subject matter of the decoupling relationship between GDP and CO2 emissions. It is important to understand whether Spanish regions are cyclically converging so as to implement the most adequate policy measures. Thus, our research is the first to estimate the national cyclical pattern for Spanish CO2 emissions over the period 1990–2018 by applying the dynamic factor model. The information on the CO2 emissions cycle makes it possible to track the progress of each region towards a national synchronized pattern of emissions and a stronger decoupling from economic growth. For this analysis, we use a recursive estimation model, which allows us to compare the estimations obtained, on a yearly basis. Through the integration of the technical methods employed, we have carried out a comprehensive study that allows us to show whether the regions that are cyclically converging have experienced improvements in decoupling CO2 emissions from economic activity. The paper is an important supplement and improvement regarding existing research on energy convergence, as well as an important contribution to the research field of decoupling.
Based on the evidence obtained, we identify the declining and expansionary phases of CO2 in Spain. The analysis has shown that 2009 marked the beginning of a phase where there was an increase in emission growth from 2009 to 2017, confirming that the recovery of the Spanish economy contributed to the said rise in emissions. Results also reveal that the dynamics of the pattern of synchronization and decoupling of the regions are quite similar. The EU and the Spanish government have launched environmental policies to mitigate CO2 emissions and promote environmental efficiency. Although the Spanish regions share objectives, there is a risk that regional governments are not focused on decoupling their emissions growth from the business cycle, which can reduce the chances of linking their emissions to the national fluctuation pattern. We also find that there are significant differences upon comparing levels and trajectories across regions. Results reveal a contrasting picture with Madrid, Catalonia, and Valencia among the regions with high levels of correlation for cyclical convergence and GDP and synchronization analysis. They show a positive trajectory in their results, but the levels of decoupling are still cause for concern. We also observe a favorable evolution in their cyclical convergence process. On the other hand, we find regions, like Asturias and Galicia, showing low levels in the cyclical convergence and decoupling analysis, but which undergo a negative trajectory for decoupling during the last years of the period. Given the diversity in performance within the Spanish regions, there is ample scope for improving these processes. The results obtained reveal insufficient efforts towards dissociating emissions from the economic cycle, and this may pose a problem regarding achieving a sustainable economic system in Spain. To reach a higher level of decoupling, the synchronization of emissions could be a way to facilitate this process.
This paper tackles the short-run dynamics of environmental performance with a methodological proposal that offers valuable information for policy-makers. Its application will allow policies to be modulated for each region, city, state, or even member state, according to the degree of synchronization of their CO2 emissions and their decoupling from economic activity. Further research on how to contribute to the understanding of this process is needed.

Author Contributions

All the authors have equally contributed to the final version of this paper. All authors have read and agreed to the published version of the manuscript.

Funding

This research was partially funded by the URJC Third Program to Promote Research by researchers and teaching staff of the Faculty of Legal and Social Sciences.

Acknowledgments

This article was written during the COVID-19 lockdown period. We dedicate it to all the people who, in the discharge of their duties, enabled us to be protected at home.

Conflicts of Interest

The authors declare no conflict of interest. The funders had no role in the design of the study; in the collection, analyses, or interpretation of data; in the writing of the manuscript, or in the decision to publish the results.

References

  1. Teng, X.; Chun Lu, L.; Chiu, Y. How the European Union reaches the target of CO2 emissions under the Paris Agreement. Eur. Plan. Stud. 2020, 28, 1836–1857. [Google Scholar] [CrossRef]
  2. Delgado Rodríguez, M.J.; Cabezas Ares, A.; de Lucas Santos, S. Cyclical fluctuation patterns and decoupling: Towards common EU-28 environmental performance. J. Clean. Prod. 2018, 175, 696–706. [Google Scholar] [CrossRef]
  3. Villar-Rubio, E.; Huete-Morales, M.D. Market Instruments for a Sustainable Economy: Environmental Fiscal Policy and Manifest Divergences. Rev. Policy Res. 2017, 34, 255–269. [Google Scholar] [CrossRef]
  4. González-Vallejo, P.; Muntean, R.; Solís-Guzmán, J.; Marrero, M. Carbon Footprint of Dwelling Construction in Romania and Spain. A Comparative Analysis with the OERCO2 Tool. Sustainability 2020, 12, 6745. [Google Scholar] [CrossRef]
  5. Borozan, D. Testing for convergence in electricity consumption across Croatian regions at the consumer’s sectoral level. Energy Policy 2018, 102, 145–153. [Google Scholar] [CrossRef]
  6. Bhattacharya, M.; Inekwe, J.N.; Sadorsky, P.; Saha, A. Convergence of energy productivity across Indian states and territories. Energy Econ. 2018, 74, 427–440. [Google Scholar] [CrossRef]
  7. Ivanovski, K.; Awaworyi Churchill, S.; Smyth, R. A club convergence analysis of per capita energy consumption across Australian regions and sectors. Energy Econ. 2018, 76, 519–531. [Google Scholar] [CrossRef]
  8. Cheong, T.S.; Li, V.J.; Shi, X. Regional disparity and convergence of electricity consumption in China: A distribution dynamics approach. China Econ. Rev. 2019, 58. [Google Scholar] [CrossRef]
  9. Apergis, N.; Payne, J.E. Per capita carbon dioxide emissions across U.S. states by sector and fossil fuel source: Evidence from club convergence tests. Energy Econ. 2017, 63, 365–372. [Google Scholar] [CrossRef]
  10. Actividad legislativa del Ministerio para la Transición Ecológica y el Reto Demogáfico de España. Available online: https://www.miteco.gob.es/es/ministerio/actividad-legislativa/default.aspx (accessed on 30 July 2020).
  11. Apergis, N.; Garzón, A.J. Greenhouse gas emissions convergence in Spain: Evidence from the club clustering approach. Environ. Sci. Pollut. Res. 2020, 27, 38602–38606. [Google Scholar] [CrossRef] [PubMed]
  12. García-Gusano, D.; Suárez-Botero, J.; Dufour, J. Long-term modelling and assessment of the energy-economy decoupling in Spain. Energy 2018, 151, 455–466. [Google Scholar] [CrossRef]
  13. Cansino, J.M.; Sánchez-Braza, A.; Rodríguez-Arévalo, M.L. Driving forces of Spain’s CO2 emissions: A LMDI decomposition approach. Renew. Sustain. Energy Rev. 2015, 48, 749–759. [Google Scholar] [CrossRef]
  14. Ruiz-Fuensanta, M.J. The region matters: A comparative analysis of regional energy efficiency in Spain. Energy 2016, 101, 325–331. [Google Scholar] [CrossRef]
  15. Quesada-Rubio, J.M.; Villar-Rubio, E.; Mondéjar-Jiménez, J.; Molina-Moreno, V. Carbon dioxide emissions vs. allocation rights: Analysis of the Spanish case. Int. J. Environ. Res. 2011, 5, 469–474. [Google Scholar] [CrossRef]
  16. Cendejas Bueno, J.L.; Lucas Santos S de Delgado Rodríguez, M.J.; Álvarez Ayuso, I. Testing for structural breaks in factor loadings: An application to international business cycle. Econ. Model. 2011, 28, 259–263. [Google Scholar] [CrossRef] [Green Version]
  17. Harding, D.; Pagan, A. Dissecting the cycle: A methodological investigation. J. Monet. Econ. 2002, 49, 365–381. [Google Scholar] [CrossRef]
  18. De la Fuente, A. Long Series of Some Regional Economic and Demographic Aggregates (RegData and RegData Dem Vers. 5.0-2018). 2019. Available online: https://www.bbvaresearch.com/tag/regdata/ (accessed on 31 August 2020).
  19. Stock, J.H.; Watson, M.W. Dynamic Factor Models. In The Oxford Handbook of Economic Forecasting; Oxford University Press: Oxford, UK, 2012. [Google Scholar] [CrossRef]
  20. Dubois, É.; Michaux, E. Grocer 1.72: An Econometric Toolbox for Scilab. Available online: https://atoms.scilab.org/toolboxes/grocer/1.72 (accessed on 1 September 2020).
  21. Bai, J.; Ng, S. Determining the number of primitive shocks in factor models. J. Bus. Econ. Stat. 2007, 25, 52–60. [Google Scholar] [CrossRef] [Green Version]
  22. Andrews, D.W.K. Estimation when a parameter is on a boundary. Econometrica 1999, 67, 1341–1383. [Google Scholar] [CrossRef]
  23. Tapio, P. Towards a theory of decoupling: Degrees of decoupling in the EU and the case of road traffic in Finland between 1970 and 2001. Transp. Policy 2005, 12, 137–151. [Google Scholar] [CrossRef] [Green Version]
  24. Jiang, R.; Zhou, Y.; Li, R. Moving to a Low-Carbon Economy in China: Decoupling and Decomposition Analysis of Emission and Economy from a Sector Perspective. Sustainability 2018, 10, 978. [Google Scholar] [CrossRef] [Green Version]
  25. Qiu, L.; Huang, J.; Niu, W. Decoupling and Driving Factors of Economic Growth and Groundwater Consumption in the Coastal Areas of the Yellow Sea and the Bohai Sea. Sustainability 2018, 10, 4158. [Google Scholar] [CrossRef] [Green Version]
  26. Doda, B. Evidence on business cycles and CO2 emissions. J. Macroecon. 2014, 40, 214–227. [Google Scholar] [CrossRef] [Green Version]
  27. Bai, J.; Ng, S. Determining the Number of Factors in Approximate Factor Models. Econometrica 2002, 70, 191–221. [Google Scholar] [CrossRef] [Green Version]
Figure 1. Dating the Spanish common cyclical environmental performance. Note: shaded areas correspond to the declining phases in Spanish CO2 emissions fluctuations. Source: own compilation using Harding and Pagan [17].
Sustainability 12 08569 g001
Figure 2. Spanish regions with correlation >0.5 in decoupling and synchronization. Note: initial Table 2 and Table 3 are at 20% and the bands of the t-stat are at 10% significance. The continuous line corresponds to the synchronization analysis, while the dotted line corresponds to the decoupling analysis. Source: own compilation using Matlab.
Sustainability 12 08569 g002
Figure 3. Spanish regions with correlation close to or <0.5 in decoupling and synchronization. Note: initial trimming to the estimation of models (2) and (3) is at 20% and the bands of the t-stat are at 10% significance. The continuous line corresponds to the synchronization analysis, while the dotted line corresponds to the decoupling analysis. Source: own compilation using Matlab.
Sustainability 12 08569 g003
Figure 4. Spanish regions with differences in the trajectories in decoupling and synchronization. Note: initial trimming to the estimation of models (2) and (3) is at 20% and the bands of the t-stat are at 10% significance. The continuous line corresponds to the synchronization analysis, while the dotted line corresponds to the decoupling analysis. Source: own compilation using Matlab.
Sustainability 12 08569 g004
Figure 5. Spanish regions that follow independent patterns. Note: initial trimming to estimation of models (2) and (3) is at 20% and the bands of the t-stat are at 10% significance. The continuous line corresponds to the synchronization results, while the dotted line corresponds to the decoupling values. Source: own compilation using Matlab.
Sustainability 12 08569 g005
Figure 6. The asymptotic distribution of the F S u p W a l d , i statistics of model (2) by Spanish regions at 30% of trimming. Note: * at 40% of trimming. Source: own compilation using Matlab.
Sustainability 12 08569 g006
Figure 7. The asymptotic distribution of the F S u p W a l d , i statistics of model (3) by Spanish regions at 30% of trimming. Note: * at 40% of trimming. Source: own compilation using Matlab.
Sustainability 12 08569 g007
Table 1. Evolution of the Spanish environmental policies, regulations, and initiatives.
UE LegislationSpanish Legislation
17/05/1993 Resolution No. 93/C 138/01 on a Community program of policy and action in relation to the environment and sustainable development. 5th Environmental Action Program (EAP) 1993–2000. The EC’s decision to stabilize CO2 emissions at the 1990 levels by 2000.
24/09/1996 Directive 96/61/EC of concerning integrated pollution prevention and control.
22/12/1972 Law 38/1972, on the protection of the atmospheric environment.
27/11/1997 Law 54/1997 on the electricity sector
21/04/1998 Law 10/1998 on waste.
29/04/1998 Spain signed the Kyoto Protocol, and ratified the Protocol on 31/05/2002
26/04/1999 Directive 1999/31/EC on the landfill of waste
27/09/2001 Directive 2001/77/EC on the promotion of electricity produced from renewable energy sources in the internal electricity market
23/10/2001 Directive 2001/80/EC on the limitation of emissions of certain pollutants into the air from large combustion plants
22/07/2002 Decision No. 1600/2002/EC laying down the Sixth Community Environment Action Program. 6th EAP 2002–2012 The EU-15 target is to reduce emissions by 8%, as compared to the 1990 levels.
13/10/2003 Directive 2003/87/EC establishing a scheme for greenhouse gas emission allowance trading within the Community and amending Council Directive 96/61/EC.
24/04/2004 Directive 2004/35/CE on environmental liability regarding the prevention and remedying of environmental damage. The polluter-pays principle.
11/04/2004 Directive 2004/08/EC on the promotion of cogeneration on the basis of the demand for useful heat in the internal energy market and amending Directive 92/42/EEC
27/10/2004 Directive 2004/101/EC amending Directive 2003/87/EC establishing a scheme for greenhouse gas emission allowance trading within the Community, in respect of the Kyoto Protocol’s project mechanisms
19/11/2008 Directive 2008/101/EC amending Directive 2003/87/EC to include aviation activities in the scheme for greenhouse gas emission allowance trading within the Community
23/04/2009 Directive 2009/29/EC amending Directive 2003/87/EC to improve and extend the greenhouse gas emission allowance trading scheme of the Community
23/04/2009 Decision No 406/2009/EC—Effort of Member States to reduce their greenhouse gas emissions to meet the Community’s greenhouse gas emission reduction commitments up to 2020
23/04/2009 Directive 2009/28/EC on the promotion of the use of energy from renewable sources and amending and subsequently repealing Directives 2001/77/EC and 2003/30/EC
23/04/2009 Regulation No. 443/2009 setting emission performance standards for new passenger cars as part of the Community’s integrated approach to reduce CO2 emissions from light-duty vehicles
12/10/2010 Regulation No. 1031/2010 on the timing, administration, and other aspects of auctioning of greenhouse gas emission allowances pursuant to Directive 2003/87/EC establishing a scheme for greenhouse gas emission allowances trading within the Community
03/11/2010 Decision laying down criteria and measures for the financing of commercial demonstration projects that aim at the environmentally safe capture and geological storage of CO2 as well as demonstration projects of innovative renewable energy technologies under the scheme for greenhouse gas emission allowance trading within the Community established by Directive 2003/87/EC.
11/05/2011 Regulation No. 510/2011 setting emission performance standards for new light commercial vehicles as part of the Union’s integrated approach to reduce CO2 emissions from light-duty vehicles
23/11/2011 Regulation No. 1210/2011 amending Regulation No 1031/2010 to determine the volume of greenhouse gas emission allowances to be auctioned prior to 2013.
24/04/2013 Decision No. 377/2013/EU derogating temporarily from Directive 2003/87/EC establishing a scheme for greenhouse gas emission allowance trading within the Community.
20/11/2013 Decision No. 1386/2013/EU on a General Union Environment Action Program to 2020 Living well, within the limits of our planet. 7th EAP 2013–2020. The EU-28 target is for a 20% reduction in emissions, compared to the 1990 levels.
25/11/2015 Directive 2015/2193 on the limitation of emissions of certain pollutants into the air from medium combustion plants
01/07/2002 Law 16/2002, on Integrated Pollution Prevention and Control. This is a transposition of Directive 96/61/EC into national law
27/08/2004 Royal Decree Law 5/2004, which regulates the gas emission allowance trading system greenhouse
09/03/2005 Law 1/2005, which regulates the regime of trade in greenhouse gas emission allowances swimmer. Transposition of the Directive 2003/87/CE
20/07/2007 Royal Decree 1031/2007 that develops the participation framework in the flexibility mechanisms of the Kyoto Protocol
23/10/2007 Law 26/2007 on Environmental Responsibility. Transposition of the Directive 2004/35/CE
15/11/2007 Law 34/2007 on air quality and protection of the atmosphere, upgrade Law 38/1972
05/07/2010 Law 13/2010, amending Law 1/2005, which regulates the greenhouse gas emission allowance trading system, to perfect and expand the general emission allowance trading system and include aviation in it.
04/03/2011 Law 2/2011 on Sustainable Economy, lays the foundations for a new energy model based on security of supply, economic efficiency and respect for the environment.
28/07/2011 Law 22/2011 of waste and contaminated soils
04/05/2012 Royal Decree Law 17/2012, of urgent measures in the matter of environment. Establish and regulation of the European emissions trading system.
28/12/2012 Royal Decree 1022/by develops aspects related to the free allocation of emission rights are developed as well as the regulation of the trading of greenhouse gas emission rights. Carbon leakage
12/06/2013 Law 5/2013by amending Law 16/2002, on integrated pollution prevention and control, and Law 22/2011, on waste and contaminated soils
11/12/2013 Law 21/2013 of environmental assessment
03/07/2014 Law 11/2014 amending Law 26/2007 on Environmental Responsibility
22/04/2016 Spain signed the Paris Agreement, and ratified the Agreement on 12/01/2017
19/03/2018—Directive (EU) 2018/410 amending Directive 2003/87/EC to enhance cost-effective emission reductions and low-carbon investments, and Decision 2015/1814
08/04/2018—Consolidated version of Directive 2003/87/EC of the European Parliament and of the Council establishing a scheme for greenhouse gas emission allowance trading within the Community and amending Council Directive 96/61/EC
30/05/2018—Regulation 2018/842—Binding annual greenhouse gas emission reductions by member states from 2021 to 2030 contributing to climate action to meet commitments under the Paris Agreement and amending Regulation (EU) No 525/2013
28/11/2018—Communication by the European Commission, COM/2018/773. A Clean Planet for all. A European strategic long-term vision for a prosperous, modern, competitive, and climate-neutral economy.
Should be adopted in the 4th quarter of 2020. 8th EAP 2021–2030. The EU-28 target aims at a cut of at least 40% below 1990 levels by 2030
06/07/2018 Royal Decree 818/2018 on measures to reduce national emissions of certain air pollutants.
22/02/2019 Strategic Energy and Climate Framework, which includes the National Integrated Energy and Climate Plan 2021–2030 (Spanish acronym: PNIEC)
Source: own elaboration with the information of Ecological Transition ministry Ministry [10].
Table 2. Estimation results from model (1). Sample period: 1991–2018.
CCAAFactor LoadingsAR ParametersResidual Variance
Andalusia0.51 (5.01) ***−0.35 (−1.81) *0.39 (3.45) ***
Aragon0.26 (3.01) ***−0.53 (−3.27) ***0.6 (3.69) ***
Asturias0.29 (2.89) ***−0.34 (−1.86) *0.69 (3.69) ***
Balearic Islands0.48 (4.16) ***−0.09 (−0.43)0.52 (3.55) ***
Canary Islands0.42 (4.03) ***−0.34 (−1.86) *0.59 (3.61) ***
Cantabria0.4 (3.49) ***−0.15 (−0.77)0.62 (3.64) ***
Castille-Leon0.27 (2.37) ***−0.22 (−1.16)0.8 (3.7) ***
Castille-La Mancha0.58 (6.03) ***−0.49 (−2.46) ***0.19 (2.85) ***
Catalonia0.52 (4.4) ***0.09 (0.44)0.43 (3.45) ***
Valencia0.54 (4.91) ***−0.1 (−0.47)0.38 (3.41) ***
Extremadura0.54 (5.11) ***−0.13 (−0.6)0.34 (3.36) ***
Galicia0.32 (2.89) ***−0.24 (−1.28)0.74 (3.68) ***
Rioja0.42 (3.5) ***0 (−0.01)0.61 (3.61) ***
Madrid0.54 (5.14) ***−0.34 (−1.77)0.39 (3.41) ***
Navarre0.43 (3.4) ***0.17 (0.84)0.58 (3.58) ***
Basque Country0.4 (3.83) ***−0.28 (−1.49)0.57 (3.62) ***
Murcia0.33 (2.43) ***0.12 (0.61)0.78 (3.68) ***
Note: In () t-statistics, * significant parameter at 90% and *** 99%. Ceuta and Melilla are not significant.
Table 3. Estimation breaks of model (2) for Spanish regions, 1990–2018.
RegionsTrimming90%95%99% F S u p W a l d , i Break DateBreaks
Andalusia30%18.732.681.11.92007
Aragon30%17.833.183.210.41998
Asturias30%15.625554.21998
Balearic Island30%19.328111.21.72010
Canary Island30%18.128.5745.61998
Cantabria30%15.625.459.121998
Castille-Leon30%16.827.677.714.31998
Castille-La Mancha30%17.327.357.512000
Catalonia30%15.323.965.50.42008
Valencia30%16.225110.70.52012
Extremadura30%16.728.799.70.41998
Galicia40%7.211.231.313.42007 **Temporal break
Rioja40%8.813.834.884.42006 ***Temporal break
Madrid30%15.127.9681.12012
Navarre30%17.628.974.32.82010
Basque Country30%16.129.265.61.12010
Murcia30%17.727.675.82.12000
Ceuta and Melilla40%6.59.121.310.62007 **Structural break
Note: significant F S u p W a l d , i statistic ** at 95%, and *** at 99%.
Table 4. Estimation breaks of model (3) by Spanish regions, 1990–2018.
RegionsTrimming90%95%99% F S u p W a l d , i Break DateBreaks
Andalusia30%7.313.229.40.52008
Aragon30%9.114.831.83.62010
Asturias30%14.524.167.11.22006
Balearic Island30%7.91223.90.72009
Canary Island30%813.144.71.41998
Cantabria30%6.912.625.11.31998
Castille-Leon30%18.330.589.93.52010
Castille-la Mancha40%6.39.718.56.52010 *Temporal break
Catalonia30%5.4815.90.81999
Valencia30%3.85.514.60.62006
Extremadura30%6.39.219.31.51998
Galicia30%13.221.356.62.52010
Rioja30%5.88.92355.82000 ***Temporal break
Madrid30%3.96.214.61.92012
Navarra30%4.86.915.61.12010
Basque Country30%4.67.714.11.32009
Murcia30%5.48.415.512011
Ceuta and Melilla30%5.38.619.30.92001
Note: * significant F S u p W a l d , i statistic at 90% and *** at 99%.
Publisher’s Note: MDPI stays neutral with regard to jurisdictional claims in published maps and institutional affiliations.

