Article

Scale-Up of Physics-Based Models for Predicting Degradation of Large Lithium Ion Batteries

1
Department of Mechanical & Aerospace Engineering, Seoul National University, Seoul 151-744, Korea
2
Department of Mechanical Engineering, Myongji University, Yongin 448-728, Korea
*
Author to whom correspondence should be addressed.
Current address: Chemical Sciences and Engineering Division, Argonne National Laboratory, Lemont, IL 60439, USA.
Sustainability 2020, 12(20), 8544; https://doi.org/10.3390/su12208544
Submission received: 17 September 2020 / Revised: 12 October 2020 / Accepted: 13 October 2020 / Published: 15 October 2020
(This article belongs to the Special Issue Sustainability and Transportation Systems)

Abstract

:
Large lithium-ion batteries (LIBs) demonstrate different performance and lifetime compared to small LIB cells, owing to the size effects generated by the electrical configuration and property imbalance. However, the calculation time for performing life predictions with three-dimensional (3D) cell models is undesirably long. In this paper, a lumped cell model with equivalent resistances (LER cell model) is proposed as a reduced order model of the 3D cell model, which enables accurate and fast life predictions of large LIBs. The developed LER cell model is validated via the comparisons with results of the 3D cell models by simulating a 20-Ah commercial pouch cell (NCM/graphite) and the experimental values. In addition, the LER cell models are applied to different cell types and sizes, such as a 20-Ah cylindrical cell and a 60-Ah pouch cell.

1. Introduction

LIBs are currently used in various systems, owing to their high energy and power density. Systems that use LIBs, such as hybrid electric vehicles (HEVs), electric vehicles (EVs), and energy storage systems (ESS), require high performance and long lifespans (over 10 years); hence, optimal design is becoming increasingly important in the development of LIBs. Although using experimental methods for fabricating and evaluating LIB cells is essential in battery design, it is difficult to fabricate cells of different sizes and shapes for optimal design. In particular, there are many limitations in time and cost while performing lifespan optimization, which requires operating and measuring batteries for long periods of time. Therefore, an approach to designing batteries along with numerical models that allow the prediction of their performance and lifespan is strongly demanded.
There are two types of LIB models, empirical and physics-based models. Empirical models calculate the behavior of batteries with mathematical expressions based on their experimental data. A typical example of empirical models is the equivalent circuit model (ECM) [1,2,3,4], which expresses batteries as simple electrical circuits consisting of resistors and capacitors. Moreover, fitting function models [5,6,7], which express the experimental results of batteries in a single equation using polynomial and power functions, are also used. As these models are simple and enable fast calculation, they are widely used in algorithms that control battery management systems (BMS) in real time [8,9]. However, because these models are developed based on data obtained from specific operating conditions of the target batteries, their accuracy abruptly decreases while performing calculations on other operating conditions or if the battery is replaced. In addition, it is difficult to provide insights into electrochemical or life-reduction phenomena occurring inside the battery [10,11]. In contrast, physics-based models, also known as first-principle-based models, calculate electrical, chemical, and electrochemical phenomena occurring inside the battery to predict its performance and lifespan. A typical physics-based model is the pseudo two-dimensional (P2D) model [12,13], also called the Newman model. This model includes governing equations of several complex partial differential equations, such as ion transport and electron conservation in porous electrodes. This model has been widely used because it accurately predicts battery performance by considering the material characteristics and the electrode design. However, since P2D models do not consider the non-uniformity of cell volumes, they are not accurate in predicting the behavior of large-size batteries that have been recently used.
To overcome these limitations, several studies on multi-dimensional physics-based models that are able to include the actual cell shape in the calculation were proposed. Kwon [14] and Kim [15] drew fitting parameters from the experimental data of large cells and used them to propose a 2D model that allows the analysis of electric potential fields, current density distribution, and temperature distribution of pouch cells. Kim et al. [16] set independent model domains for length scales and developed a multi-scale multi-dimensional (MSMD) model framework that calculates the impact of the cell shapes considered in a higher hierarchical model domain and the electrochemical reactions calculated in a lower hierarchical model domain in a coupled manner. This enabled first-principle-based calculations on large cells. Lee et al. [17] used an MSMD model framework to develop a three-dimensional cylindrical cell model. However, the number of calculation nodes of the highest hierarchy of the structure in MSMD model frameworks is large when the model analyzes the shapes of large cells with a full resolution, resulting in long calculation times. Thus, the analysis of cell lifespans, which requires long-time operating simulations, is challenging due to long computing times.
To improve the calculation speed of physics-based models, reduced order models (ROMs) that can decrease or simplify the PDEs of governing equations have been proposed. The state-variable model proposed by Smith et al. [18] was able to improve the calculation speed by transferring full-order physics-based models into frequency domains using analytical transfer functions and numerical transfer matrices. Cai et al. [19] proposed a simplified battery model with a reduced number of PDEs using a proper orthogonal decomposition method. Guo [20] proposed a ROM that simplifies full physics-based P2D models and applied it to the analysis of 3D cells. There have also been attempts in recent years to reduce the computation time of physics-based models [21,22,23,24]. However, as most ROMs proposed so far have focused on simplifying the governing equations of electrode scales, it appears they still have computational limits when applied to cell models used to analyze large batteries.
This study proposes a LER cell model that enables fast calculations while considering the prediction of the behavior of large LIBs regarding the shape of the cell. The LER cell model corresponds to a cell domain model in the MSMD model framework. It is a simplified model that includes the electrical and thermal resistances of the cell volume of large LIB cells. The LER cell model allows for robust voltage, current, temperature response calculations of large cells while efficiently decreasing the grid resolution of the cell domain. In particular, the novelty of this model is that it can overcomes the enormous computational cost of conventional 3D models when predicting the long-term lifetime response of large cells.
The paper is structured as follows: Section 2 describes each sub-model in the MSMD model framework and shows the difference between the lumped cell model and the 3d cell model for various cell shapes (20-Ah pouch cell, 20-Ah cylindrical cell, and 60-Ah pouch cell). Section 3 explains in detail the development of a LER cell model by obtaining and applying electrical and thermal resistances from a 3d cell model. The model results of the LER cell model were verified by comparing results obtained using a full-resolution 3D cell model and the experimental values of actual LIB cells. Section 4 shows the comparison result of the 3D cell model and the LER cell model under the constant current discharge, cycle life patterns and power profile.

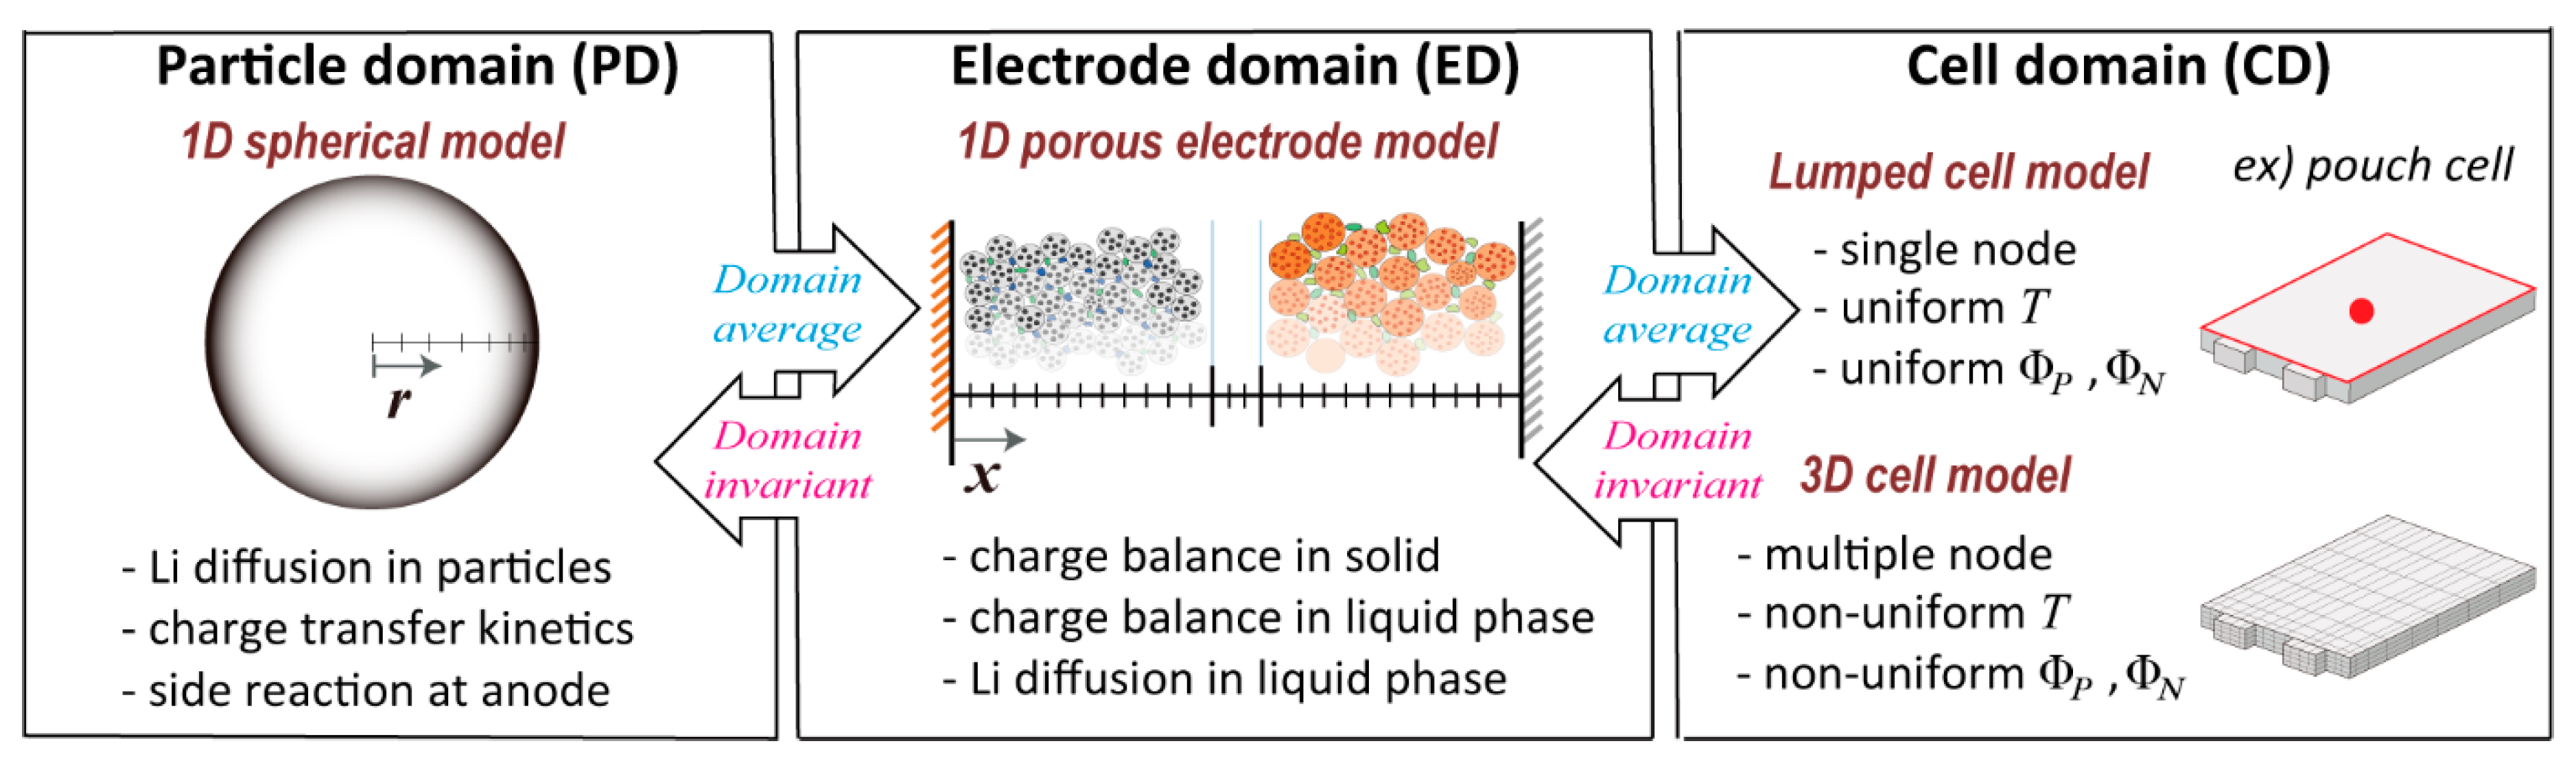
2. Selection of Domain Models

As shown in Figure 1, MSMD model frameworks are structures that distinguish physical phenomena occurring inside batteries depending on lengths of scales and assign them to independent model domains. Depending on the purpose, models used in each domain can be selected and modified independently from other domains. In this study, the model domains are classified into particle (PD), electrode (ED), and cell domains (CD). Each domain model has an independent geometry and coordinate system, and data calculated in each domain are shared with the upper and lower domains inside a hierarchical structure. Owing to this hierarchical structure, in MSMD models, the number of nodes of the upper domains has a larger impact on the entire calculation time than the number of nodes of the lower domains.
In this study, the same sub-models to the particle and electrode domains are applied for investigation of the impacts of the model selected in the cell domain. In the PD model, the electrochemical and parasitic reactions occurring on the particle surface are solved by assuming a 1D spherical electrode particle, and the diffusion of lithium ions inside the particles is also calculated by Fick’s law. The term “parasitic reaction” refers to electrolyte decomposition occurring on the surface of anode electrode particles, and it is used to calculate the growth of solid electrolyte interphase (SEI) layers caused by electrolyte decomposition [25,26,27,28]. In the ED model, 1D porous electrode layers are assumed to calculate the charge and lithium-ion transports that occur inside homogeneous porous electrodes. The governing equations of the particle and electrode domains are listed in Table 1. The detailed information of the equations for PD or ED model can be found in [29,30].

2.1. Cell Domain Models

There are various CD models developed that consider different characteristics of various cell designs. The simplest and fastest CD model is the lumped cell model, which has just one calculation node in the CD domain. The lumped cell model assumes that the entire cell volume has a uniform electrical potential and temperature without considering the cell’s shape or design in the cell domain. Thus, accurate analysis of large LIB cells may not be obtained from this model. The cell temperature in the lumped cell model is calculated using the following energy conservation equation, considering the entire cell volume as one calculation node, ignoring the heat transfer inside the cell, and considering only external heat transfer conditions. Energy conservation for lumped cell model:
( ρ C P T ) t = q E D h A s ( T T a m b )
q E D = ( q r x n , E D + q j o u l e ,   E D + q r e v , E D )
where ρ is the density of the electrode pair, C P is the specific heat capacity,   h is the convective heat transfer coefficient,   A s is the cooling area of the cell, and T a m b is the ambient temperature. The volumetric heat generation in the electrode domain q E D is composed of electrochemical reaction heat ( q r x n ,   E D ), joule heat ( q j o u l e ,   E D ), and reversible heat ( q r e v , E D ) [31].
CD models resolving 3D shapes of LIB cells with numbers of computational nodes are called 3D cell models in this paper. Selecting a CD model depends on the structure of composite layers composed of electrode-separator-current collectors in the cell. When modeling pouch-type cells, a single-potential-pair-continuum (SPPC) model [16,29] can be used as an appropriate 3D cell model for stacked composite layers that are connected in parallel in electrical tabs. Since the layer-by-layer difference is very small in the stacked composite layers of the pouch-type LIB cells, the finite volume of the cell composites can be assumed to be statistically homogeneous in the SPPC model. In one calculation node of the SPPC model, the temperature and the positive and negative electrical potential values of a pair of current collectors are calculated. For heat transfer calculations, the thermal and electrical conductivities are assumed to be orthogonal considering the layer direction of the cell volume.
To perform modeling by considering the design of cylindrical batteries, a wound potential-pair continuum (WPPC) model [17,30], which appropriately reflects the structure of long wound composite layers, is required. In wound composite layers of cylindrical cells with a local tab, the current flows quite a long distance in the azimuthal direction along the current collectors. Owing to the electrical overpotential generated by the azimuthal current, the current collectors of adjacent composite layers have significantly different electrical potentials. Therefore, the WPPC model cannot consider an arbitrary finite volume of the electrode composite layers in the cylindrical cells as homogeneous continuum like the SPPC model. The grid mesh of the WPPC model is restricted to the wound geometry in which one calculation node includes only a pair of current collectors, thus requiring a greater number of calculation nodes when compared to SPPC models. More detailed information about SPPC and WPPC models is given in [16,17].
In 3D cell models such as SPPC and WPPC, the electrical potential ( Φ + , Φ ) distribution in the metal collector plate and the temperature ( T ) distribution in the cell volume are calculated using the following governing equations. Potential distribution in current collectors in cell domain (CD):
CD ( σ eff CD Φ ) j CD = 0
CD ( σ + eff CD Φ + ) + j CD = 0
where σ + eff is the effective conductivity of current collectors, and j CD is the volumetric charge transfer current density. Temperature distribution in cell volume in cell domain (CD):
( ρ C P T ) t = CD ( k CD T ) + q CD
q CD = ( q ED + q cc )
where k is the thermal conductivity, q CD is the volumetric heat generation in the cell domain (CD), including the heat generation delivered from the electrode domain q ED and the ohmic heat in the current collectors q cc .
The selection of the CD model has a significant impact on the entire computational efficiency of the model. As shown in Figure 1, since each node of the CD model of the MSMD model framework calculates the electrode and particle domain models, increasing the number of calculation nodes in the cell domain increases the entire number of calculations and the highest iteration loop, thus significantly increasing the time required for calculations. Nevertheless, in the case of large LIB cells, if the performance and lifespan are considerably affected by the cell geometry, it is necessary to use full-resolution 3D cell models, such as SPPC or WPPC, in the cell domain to obtain more accurate predictions.

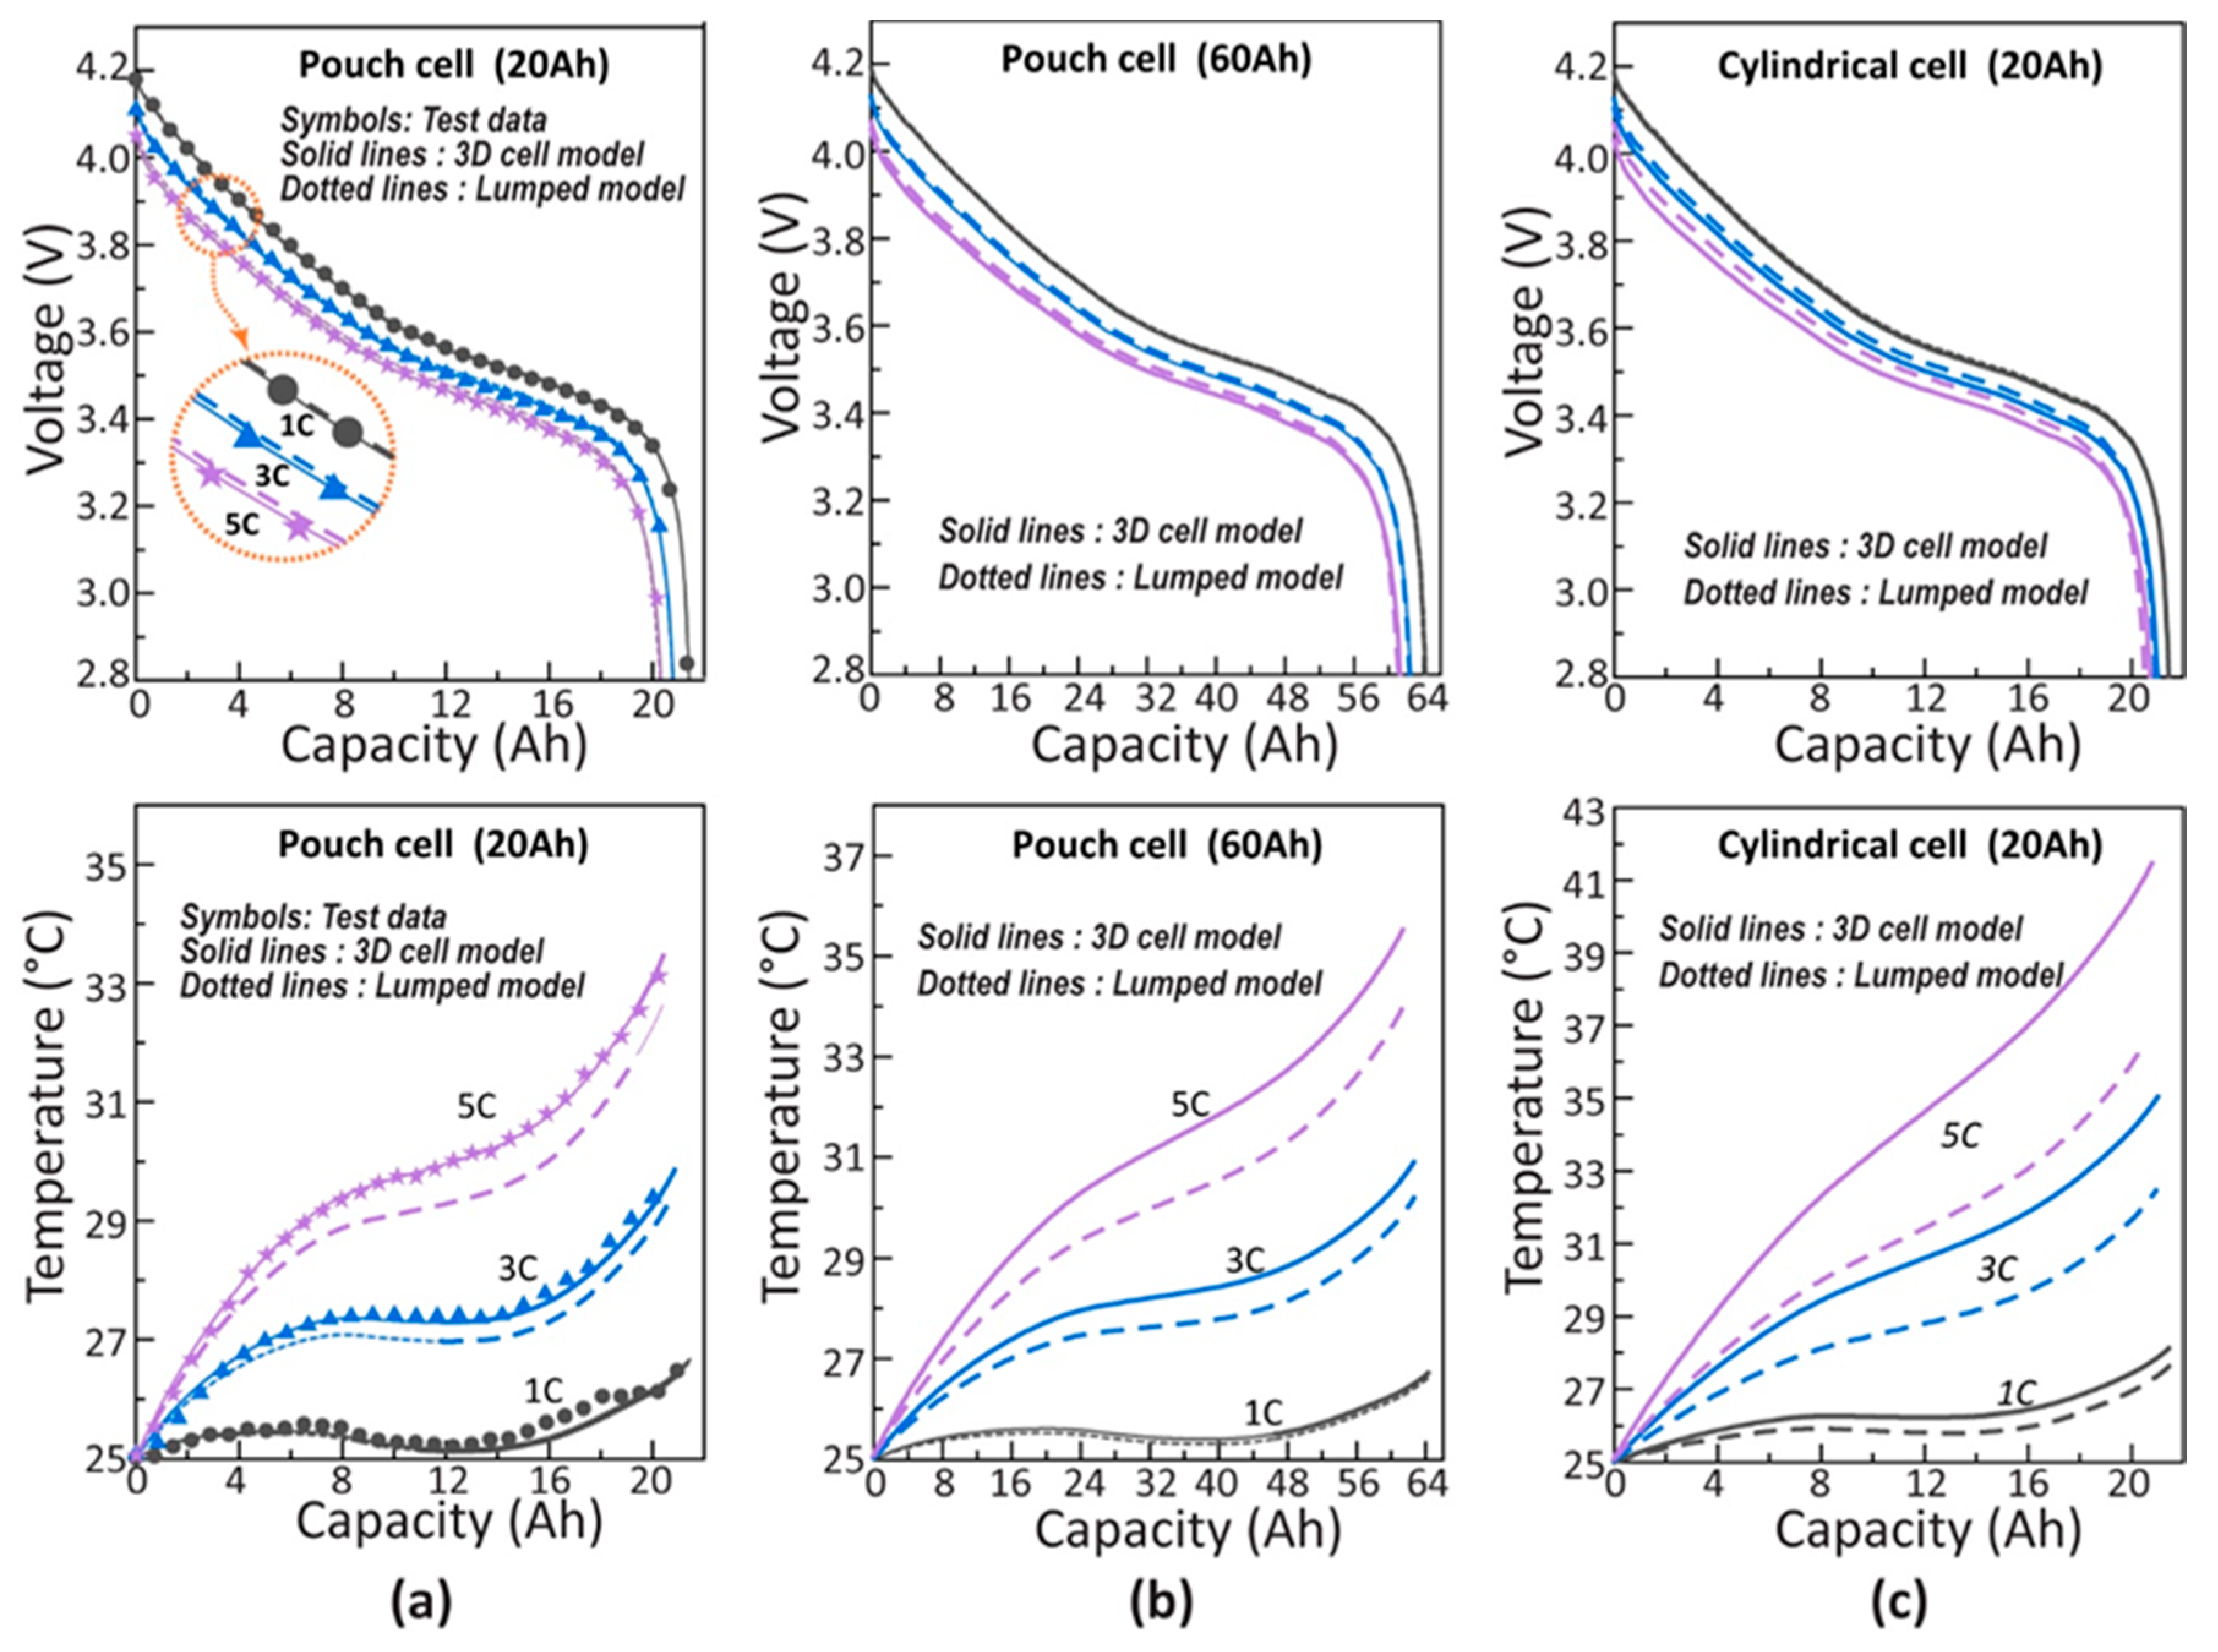
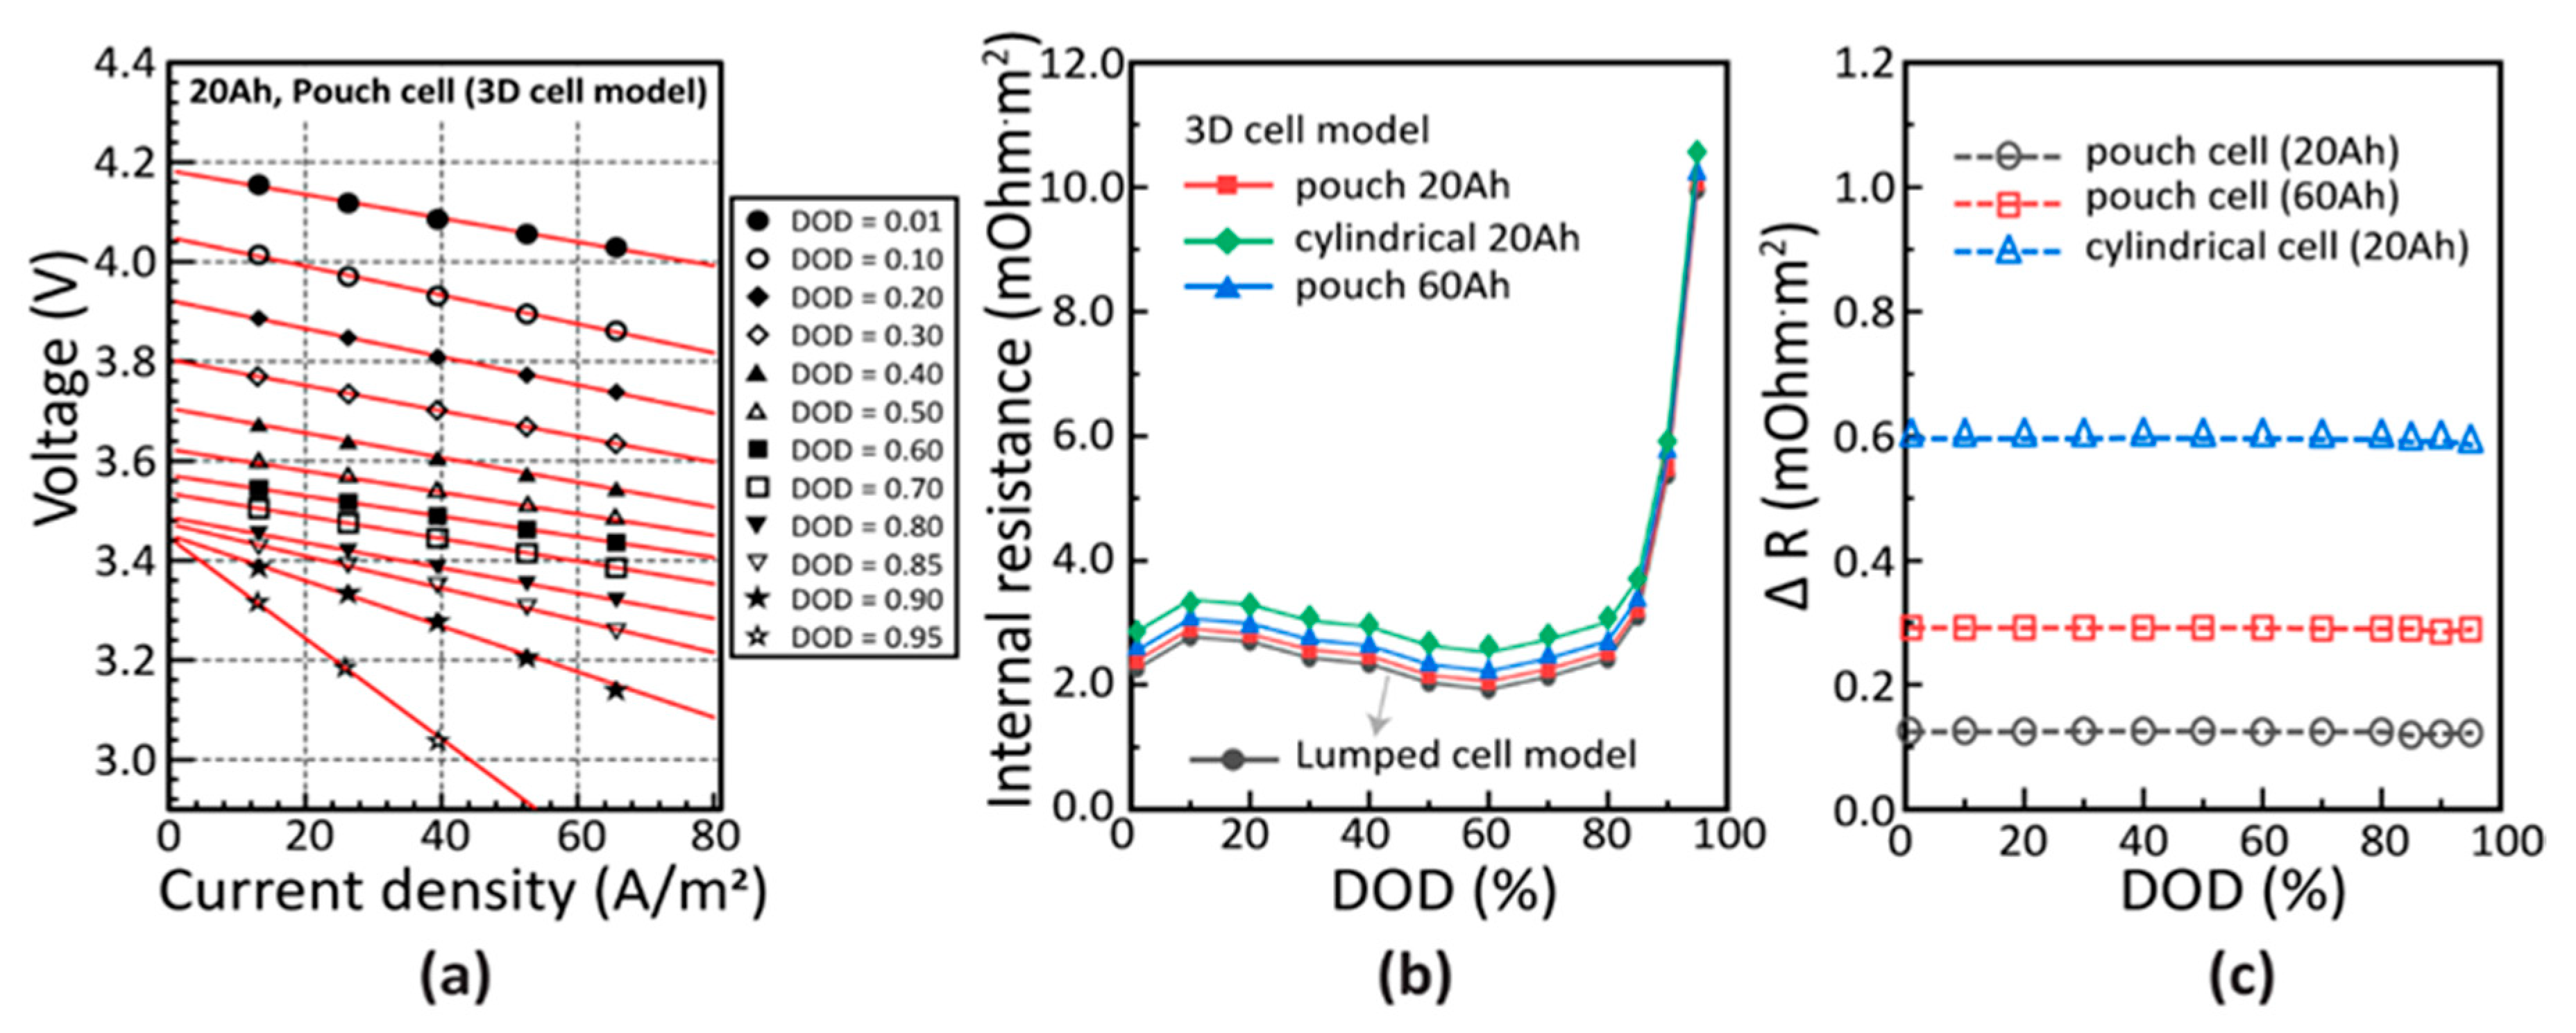
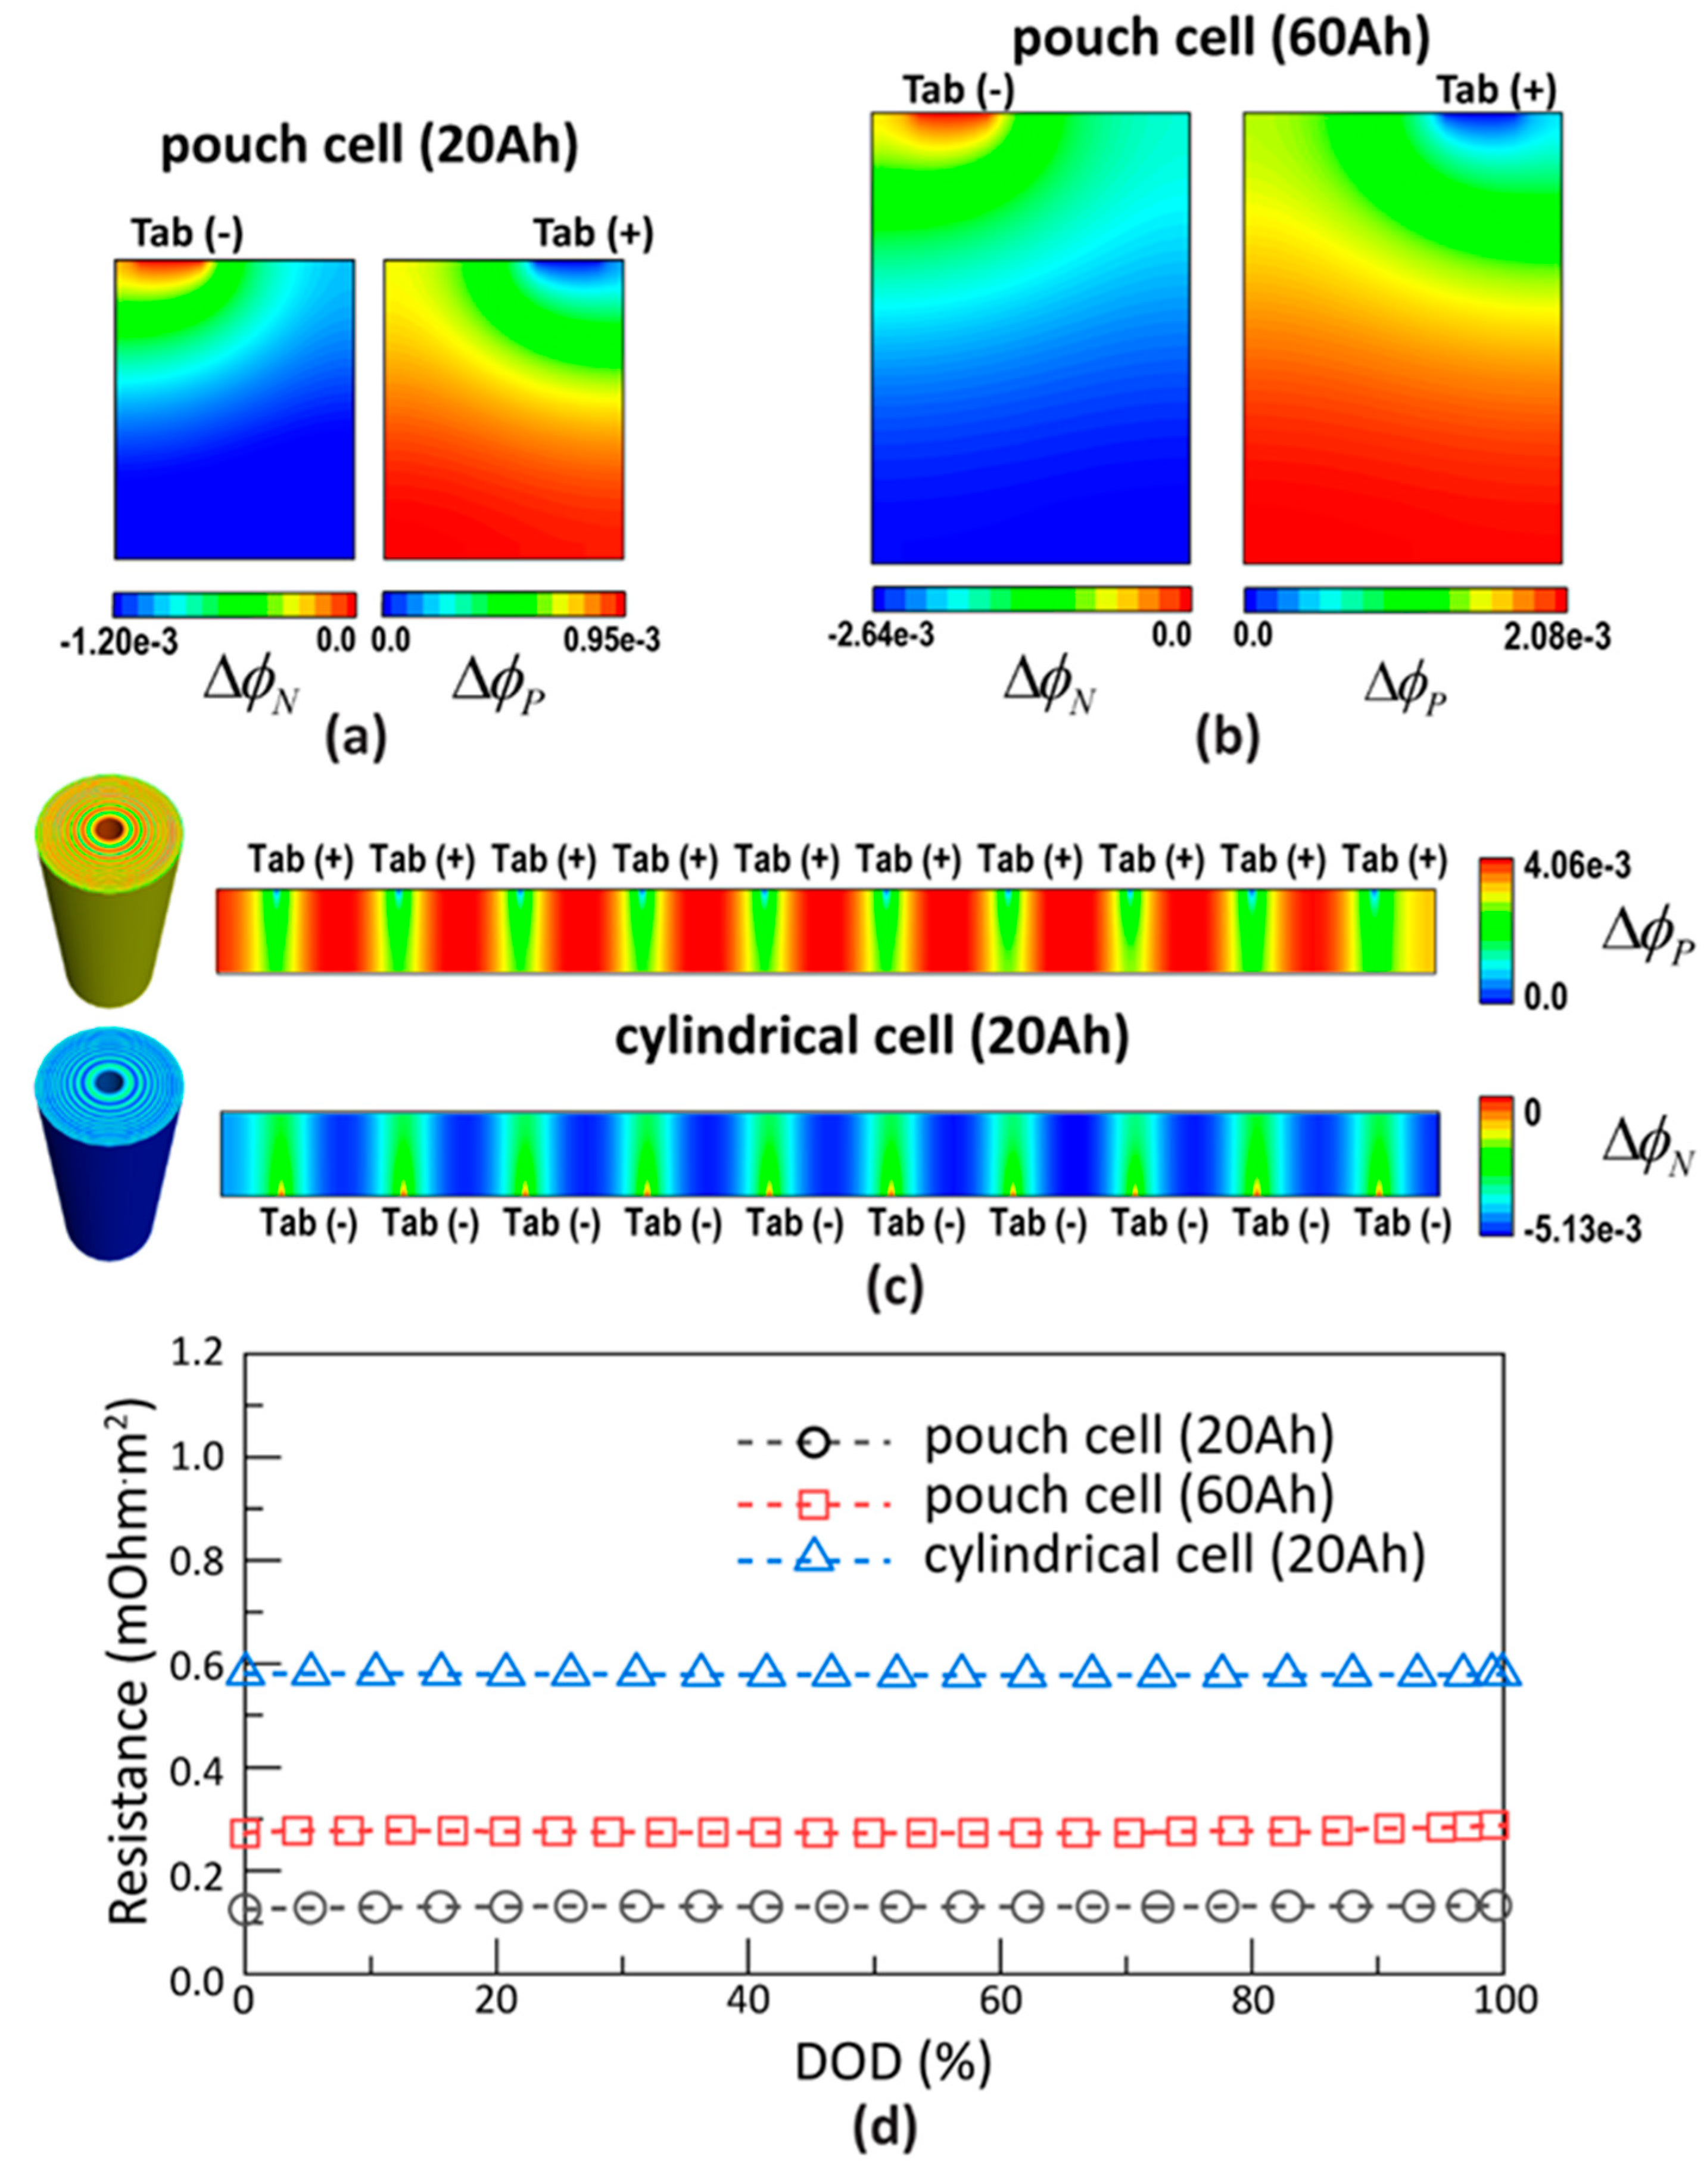
2.2. Comparisons of Lumped Cell and 3D Cell Models

In this section, the impact of the selection of cell domain models on the lifespan analysis accuracy and calculation efficiency is compared and analyzed through analysis cases of pouch and cylindrical cells. An actual pouch-type LIB cell (20-Ah, NCM/graphite, TOP battery) was simulated by two models, one with a 3D cell model (SPPC model) and the other with a lumped cell model. The two models have the same electrode and particle domain models with the same parameters. Since the lumped cell model ignores the internal imbalances inside the cell volume while the 3D cell model considers them, comparisons of the model results can reveal effects of the large size and geometry of the LIB cell. Moreover, to identify how the cell design and size affect performances of LIB cells, the 3D cell and lumped cell models of a 60-Ah pouch cell and 20-Ah cylindrical cell are also simulated and compared.
Table 2 provides the detailed information of the three cells. First, all design parameters in the particle domain and electrode domain of all LIB cells were set to be the same as the electrode design information of the actual pouch-type LIB cell. For cell domain, the size of the 20-Ah pouch cell was set to the same as the reference cell (185 mm × 147 mm × 5.74 mm), and it has a 45 mm wide electrical tab on one side. Two virtual cells of 60-Ah pouch cell and a 20-Ah cylindrical cell were modeled by considering the aspect ratio similar to that of the actual cell. The size of the 60-Ah pouch cell is 278 mm × 195 mm × 8.85 mm, which is about three times the electrode area of the 20-Ah pouch cell. The 20-Ah cylindrical cell has a diameter of 44 mm, height of 110 mm, and the inner diameter is 8 mm. The electrodes and collector plates are spirally wound 85 times in the cylindrical cell. The length of the collector plate when unwound is about 6.55 mm. Moreover, ten 15 mm wide tabs are placed on top of the cylindrical cell, and 10 on the bottom, separated by the same distance. Among the model parameters, the diffusion coefficient, kinetic reaction rate constant and side reaction-related parameters in the model were estimated by fitting with experimental data. For each cell domain, a computational grid was generated with high resolution near the tabs with significant change in local responses such as electrical current, potential, and temperature. Therefore, the number of nodes in the cell domain was set to 3000 for 20-Ah pouch cells and 60-Ah pouch cells with tabs on one side, and 15,000 for 20-Ah cylindrical cells with discrete tabs. The atmospheric temperature was set to 25 °C, and the top and bottom sides of both pouch cells, as well as the external side of the cylindrical cell, were cooled at a convective heat transfer coefficient of 20 W/m2.
Figure 2 shows a comparative graph of the results of the 3D cell and lumped cell models with respect to constant current discharge conditions of the three types of cells at rates of 1 C, 3 C, and 5 C. The experimental value of the actual 20-Ah pouch cell is also shown in Figure 2a. When looking at the output voltage shown in Figure 2a, it can be noticed that regarding the 20-Ah pouch cell, the voltage of the lumped cell model is higher (about 15 mV at 5 C), despite the small difference, than that of the 3D cell model. Moreover, the temperature of the lumped cell model is lower (about 1 °C at the end at 5 C) than that of the 3D cell model. These differences are due to the electrical overpotential and ohmic heat generation that occur in metal current collectors in the 3D cell models, which are ignored in the lumped cell models [32,33,34]. Therefore, as shown in Figure 2b,c, these differences appear to be larger in the analysis of the 60-Ah pouch cell and cylindrical cell, which have an electrical flow path in a relatively longer collector plate than the 20-Ah pouch cell. In the cylindrical cell, whose electrical flow path reaches 65 cm, the output voltage of the 3D cell mode is lower (up to 40 mV at 5 C of discharge) than that of the lumped cell model. Likewise, when calculating the operating temperature, at 5 C of discharge, the temperature difference between the lumped cell and 3D cell models increases by a maximum of 2 °C and 6 °C, in the 60-Ah pouch cell and in the cylindrical cell, respectively. These data clarify that, if the size of the cell increases or the electrical flow path of the collector plate is designed to be longer, the accuracy of the lumped cell model is further reduced.
However, the use of 3D cell models has certain limitations in terms of calculation time when compared to lumped cell models. Table 3 shows the number of nodes and calculation times of the lumped cell and 3D cell models. In this study, the SPPC-model-based pouch cell model uses 3000 times more calculation nodes than the lumped cell model, and the WPPC-model-based approach uses 15,000 times more calculation nodes because the electrode’s wound shape should be considered. This causes a higher number of calculation nodes required in the cell domain. Owing to this, when using one CPU, the simulation time at 1 C of discharge is 1000 and 4000 times longer in the SPPC cell and the WPPC cell models, respectively, when compared to the lumped cell model. Even when using eight CPUs with OPENMP parallel programming, the simulation time in the 3D cell model is about 240 (SPPC cell model) and 900 (WPPC cell model) times longer than in the lumped cell model. The use of full-resolution 3D cell models increases the iterations of the upper calculation loops, generating a significant increase in the calculation time. Thus, even when applying ROMs or ECMs, whose calculation time is shorter, to lower hierarchical models, there are still limitations in reducing the calculation time. These problems directly manifest when analyzing the lifespan of batteries.

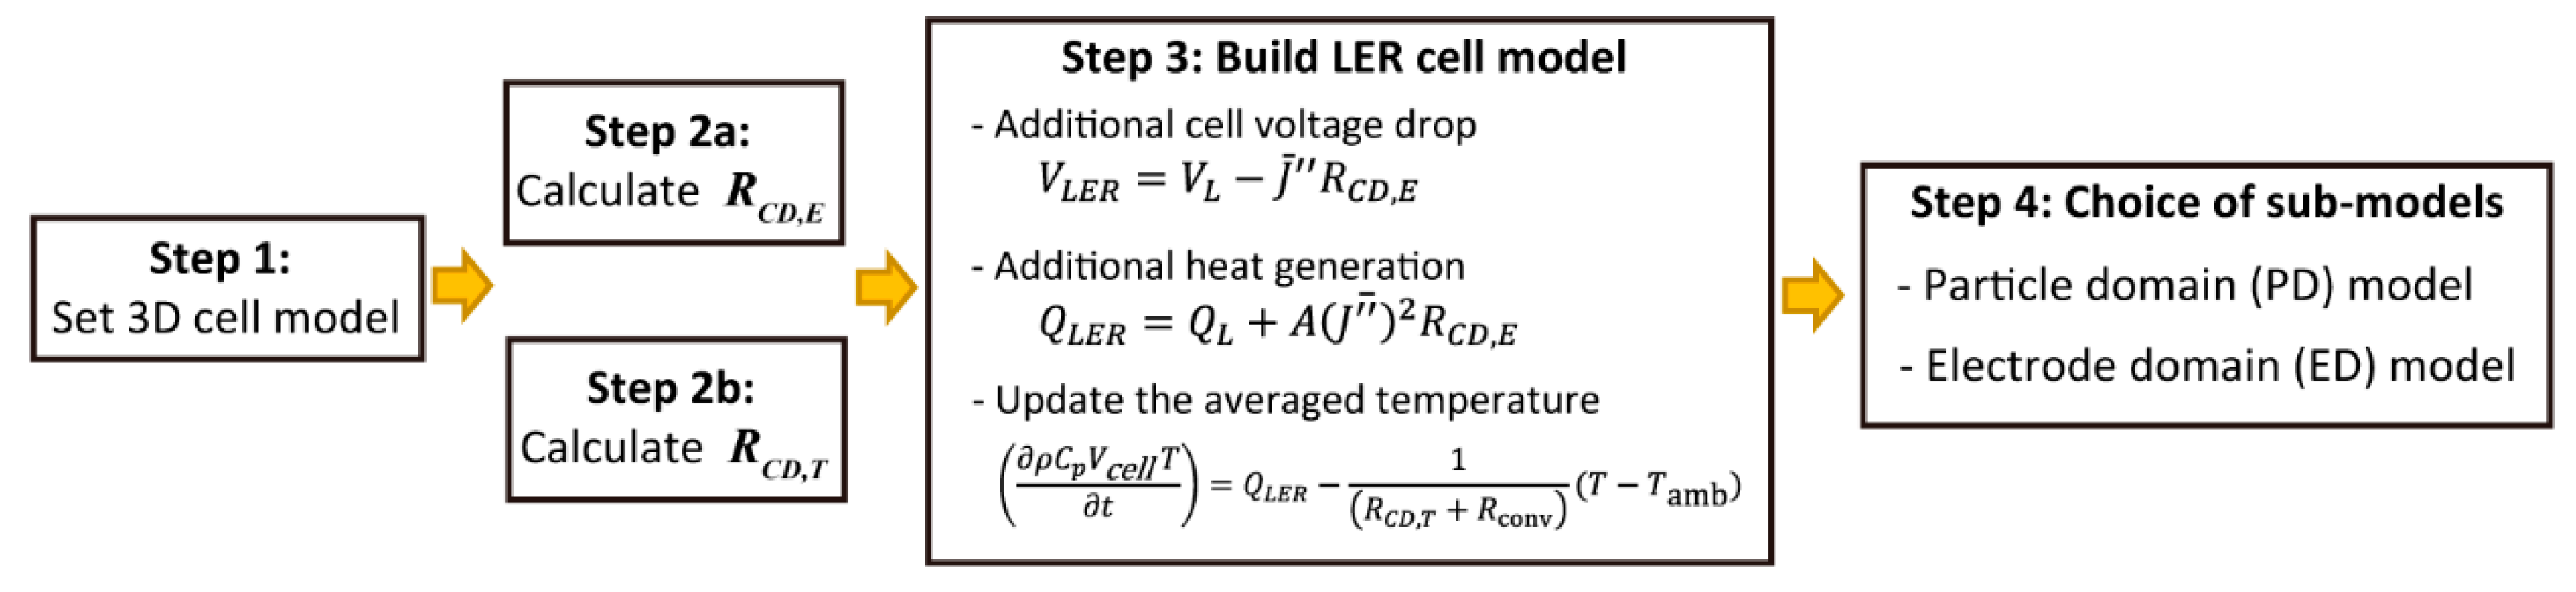
3. Lumped Cell Model with Equivalent Resistances (LER Cell Model)

The impact of the cell design on the performance of large LIBs is significant, as verified in the previous section. However, high calculation costs are also required to analyze the impact of the cell design with a full-resolution cell model. To solve these problems, we propose an LER cell model that features fast calculation while considering the impact of the cell design. This LER cell model is basically a lumped cell model that calculates the positive and negative electrical potentials as well as temperature, considering the cell volume as one computational node. Thus, the speed of calculation is as fast as in the lumped cell model. Moreover, the LER cell model allows the prediction of the impact of the cell size and design on the performance and lifespan using the electrical and thermal resistances, which can reflect the effects of the spatial imbalance inside cell volumes. Since complex interactions among thermal, electrical, and electrochemical phenomena in the cell volumes are represented by simplified resistances, it is a type of ROM that compromises analytical accuracy to ensure calculation efficiency. Building an LER cell model requires calculating the 3D cell model for determining the resistances based on the differences from the lumped cell model. A short and simple case of the 3D cell model, for example a constant current discharge in short times, is sufficient for the preparation process of the LER cell model, which can be used for long calculation, such as lifespan prediction.
The electrical resistance of the cell domain can be determined by two methods. The first is using the increase of the internal resistance in the 3D cell model compared to the lumped cell. Figure 2 shows that in all LIB cells the 3D cell model displayed a higher temperature and lower output voltage value than the lumped cell model and this tendency became more apparent with increasing C rates. The internal resistances in the 3D cell model are calculated by applying a linear polarization expression based on the model data of the three LIB cells introduced in the previous section. However, the simulations are conducted assuming that all cells were at isothermal conditions (25 °C) to remove the effects of the increased temperature in the 3D cell model. Linear polarization expressions calculate internal resistances by assuming that the discharge voltage is linearly dependent on the current density at each depth-of-discharge (DOD) as shown below [4,19]:
j ¯ = Y ( V U )
where Y is the electrochemical conductance (Ω−1m−2), V is the battery’s working voltage (V), U is the open-circuit voltage (V), and j ¯ is the average current density (A/m2) at the current collector. The DOD is obtained from the ratio of the discharged capacity to the cell total capacity.
In Figure 3a in the 3D cell model results of the 20-Ah pouch cell, at constant current discharge conditions (1–5 C), the model data appear to be linearly dependent on the output voltage and average current density, and the slopes at all DODs, except high DODs (0.85–0.95), are similar. Each slope of the graph is the internal resistance (R = Y − 1) at each DOD condition. In the same manner as described above, the slopes at each DOD are also determined for the 60-Ah pouch and 20-Ah cylindrical cell. Figure 3b shows the internal resistance calculated at each DOD condition for three cells. As isothermal conditions are assumed, the lumped cell model results are the same for all cells and their internal resistance comes from electrochemical overpotential and ohmic resistance of porous electrodes, appearing in the electrode and particle domains. The highest internal resistance is calculated in the 20-Ah cylindrical cell. Figure 3c shows that the increases of the internal resistance in the 3D cell mode Δ R are 0.12, 0.29, and 0.59 mΩ·m2 for the 20-Ah and 60-Ah pouch cells, and 20-Ah cylindrical cell, respectively, compared to the lumped cell model. The increases of the internal resistance in the 3D cell models are relatively constant regardless of DOD changes in Figure 3c, while the internal resistances vary considerably from 2 mΩ·m2 to 10 mΩ·m2 depending on the DOD, as shown in Figure 3b. This implies that the relation between the internal resistance increments occurring in the cell domain and the electrochemical status, such as DOD, is relatively weak. Therefore, these internal resistance increments in the 3D cell model, Δ R , can be applied to the LER cell model as the electrical resistances in the cell domain, R C D , E .
The other method to determine the electrical resistance in the LER cell model is using equivalent electrical resistances of the metal current collectors. As the electrical fields in the metal collector are influenced by the plate size and the tab configuration, the analysis results of the 3D cell models are also acquired to determine the electrical resistances by this method. Figure 4 shows the electric potential distribution of the positive and negative collector plates after 5 min of starting the 1 C discharge on each cell and the equivalent electrical resistance values of the metal current collector at a 1 C discharge condition according to DOD. In Figure 4a–c, during 1 C discharge, the maximum electrical overpotentials inside the current collectors are 1.2, 2.6, and 5.1 mV in the 20-Ah and 60-Ah pouch cells, and in the 20-Ah cylindrical cell, respectively. To calculate the equivalent electrical resistance of the metal current collector on each cell, the average overpotential of the electric potential collector plate area is calculated with respect to the positive and negative current collectors, as shown in the equations below:
Δ Φ P ¯ = { | Φ P | × v CD   } v CD   = { | Φ P Φ P , T a b | × v CD   } v CD  
Δ Φ N ¯ = { | Φ N | × v CD   } v CD   = { | Φ N Φ N , T a b | × v CD   } v CD  
where Φ P and Φ N are the local potentials in both current collectors, Φ P , T a b and Φ N , T a b are tab’s potentials, and v CD   is the finite volume in the cell domain. The equivalent electrical resistance of the current collectors R cc (Ω·m2) can be found using the sum of the calculated overpotentials and the average current density J ¯ (A/m2) at the current collector.
R cc = ( Δ Φ P ¯ + Δ Φ N ¯ ) J ¯
As shown in Figure 4d, the electrical resistances of the current collector obtained by Equation (16) are relatively constant for the three types of cell regardless of the DOD and were found to be 0.12, 0.29, and 0.59 mΩ·m2 in the 20-Ah and 60-Ah pouch cells and in the 20-Ah cylindrical cell, respectively. The calculated electrical resistance of the current collectors R cc can be used as the electrical resistance in the LER cell model, R C D , E , and almost coincides with the increase of the internal resistance in the 3D cell model, Δ R , as calculated using a linear polarization expression. This also confirms that the additional internal resistance generated by the cell design of large LIBs is mostly the electrical resistance of the collector plate, and the resistance can be represented by a constant value regardless of the DOD. Thus, in the LER cell model, the output voltage V L E R is calculated as follows with the output voltage V L (V) calculated in the lumped cell model, the electrical resistance R C D , E and the average current density J ¯ (A/m2):
V L E R = V L J ¯ R C D , E
Another scale-up effect that occurs in large LIB cells is a temperature increase caused by additional heating in the cell domain and internal heat transfer. A full-resolution 3D cell model analysis is also required to determine the thermal resistance in the LER cell model. Generally, in the case of thin pouch cells with wide surface areas, the temperature difference between the surface and the volume center is small. However, in cylindrical or large thick pouch cells, a significant temperature difference occurs between the surface and center of the cell as the thermal resistance in the through-layer direction is high. In addition, heat generated in the metal current collector is significant. Thus, in the LER cell model, the ohmic heat generation in the metal current collectors is calculated with the equivalent electrical resistance determined as R C D , E . The equivalent thermal resistance of the cell volume is calculated based on the model results of the 3D cell model.
First, the ohmic heating generated by the electrical resistance of the metal collector is calculated through a simple Joule heating equation and summed up with heat delivered from the sub-domain models,   Q L . Thus, the total heat generation in the LER cell model,   Q L E R , is as follows:
Q L E R = Q L + A ( J ¯ ) 2 R C D , E
where A is the total area of the electrode plate. Then, to determine the thermal resistance of the cell domain, it is assumed that a uniform heating per unit volume ( q CD ) occurs inside the cell, and that the cell surface is cooled at an isothermal temperature (25 °C). The steady-state temperature distribution data inside the LIB cell, which are obtained from the model results, can be used to calculate the increase of the average temperature in the cell volume as follows:
Δ T ¯ = { ( T CD T s ) × v CD   } v CD  
where T s is cell temperature at steady state.
This average temperature increase, Δ T ¯ , is divided by the total heat generated inside the cell, q CD ( v CD ) , to determine the equivalent thermal resistance, RCD,T, (K/W) of the cell domain.
R C D , T = Δ T ¯ q CD ( v CD   )
The calculated R C D , T are 5.0 × 10⁻³, 3.8 × 10⁻³, and 4.2 × 10⁻¹ for the 20-Ah and 60-Ah pouch cells and the 20-Ah cylindrical cell, respectively. In the LER cell model, the cell temperature is calculated using the conductive thermal resistance, R C D , T , and the convective thermal resistance R conv = hA−1, where the cooling condition is given with the convective heat transfer coefficient, h (W/m2.K), and the surface cooling area, A (m2):
( ρ C p V Cell T t ) = Q L E R 1 ( R C D , T + R conv ) ( T T amb )
The LER cell model is established based on the procedure shown in Figure 5. First, the 3D cell model of the large LIB cell to be analyzed should be created to determine the electrical and conductive thermal resistances of the cell volume. Then, the resistances are added to a lumped cell model for calculation of the additional voltage drop, heating, and temperature increase occurring in the large LIB cell.

4. Results and Discussion

The accuracy and calculation speed were compared with the results of the 3D cell and LER cell models for the three types of cell. The cells were simulated when operating at constant current discharge conditions and under the duty-cycle conditions of ESS by the 3D cell and LER cell models. Moreover, the lifespan reduction of the cells was compared under repetitive-use conditions (4 C constant current discharge, 4 C constant current charge, and constant voltage charge cycle). All simulation programs were written in the C language and calculated using a PC with 16.0 GB of RAM and an Intel Core i7-6700K 4.00-GHz CPU.

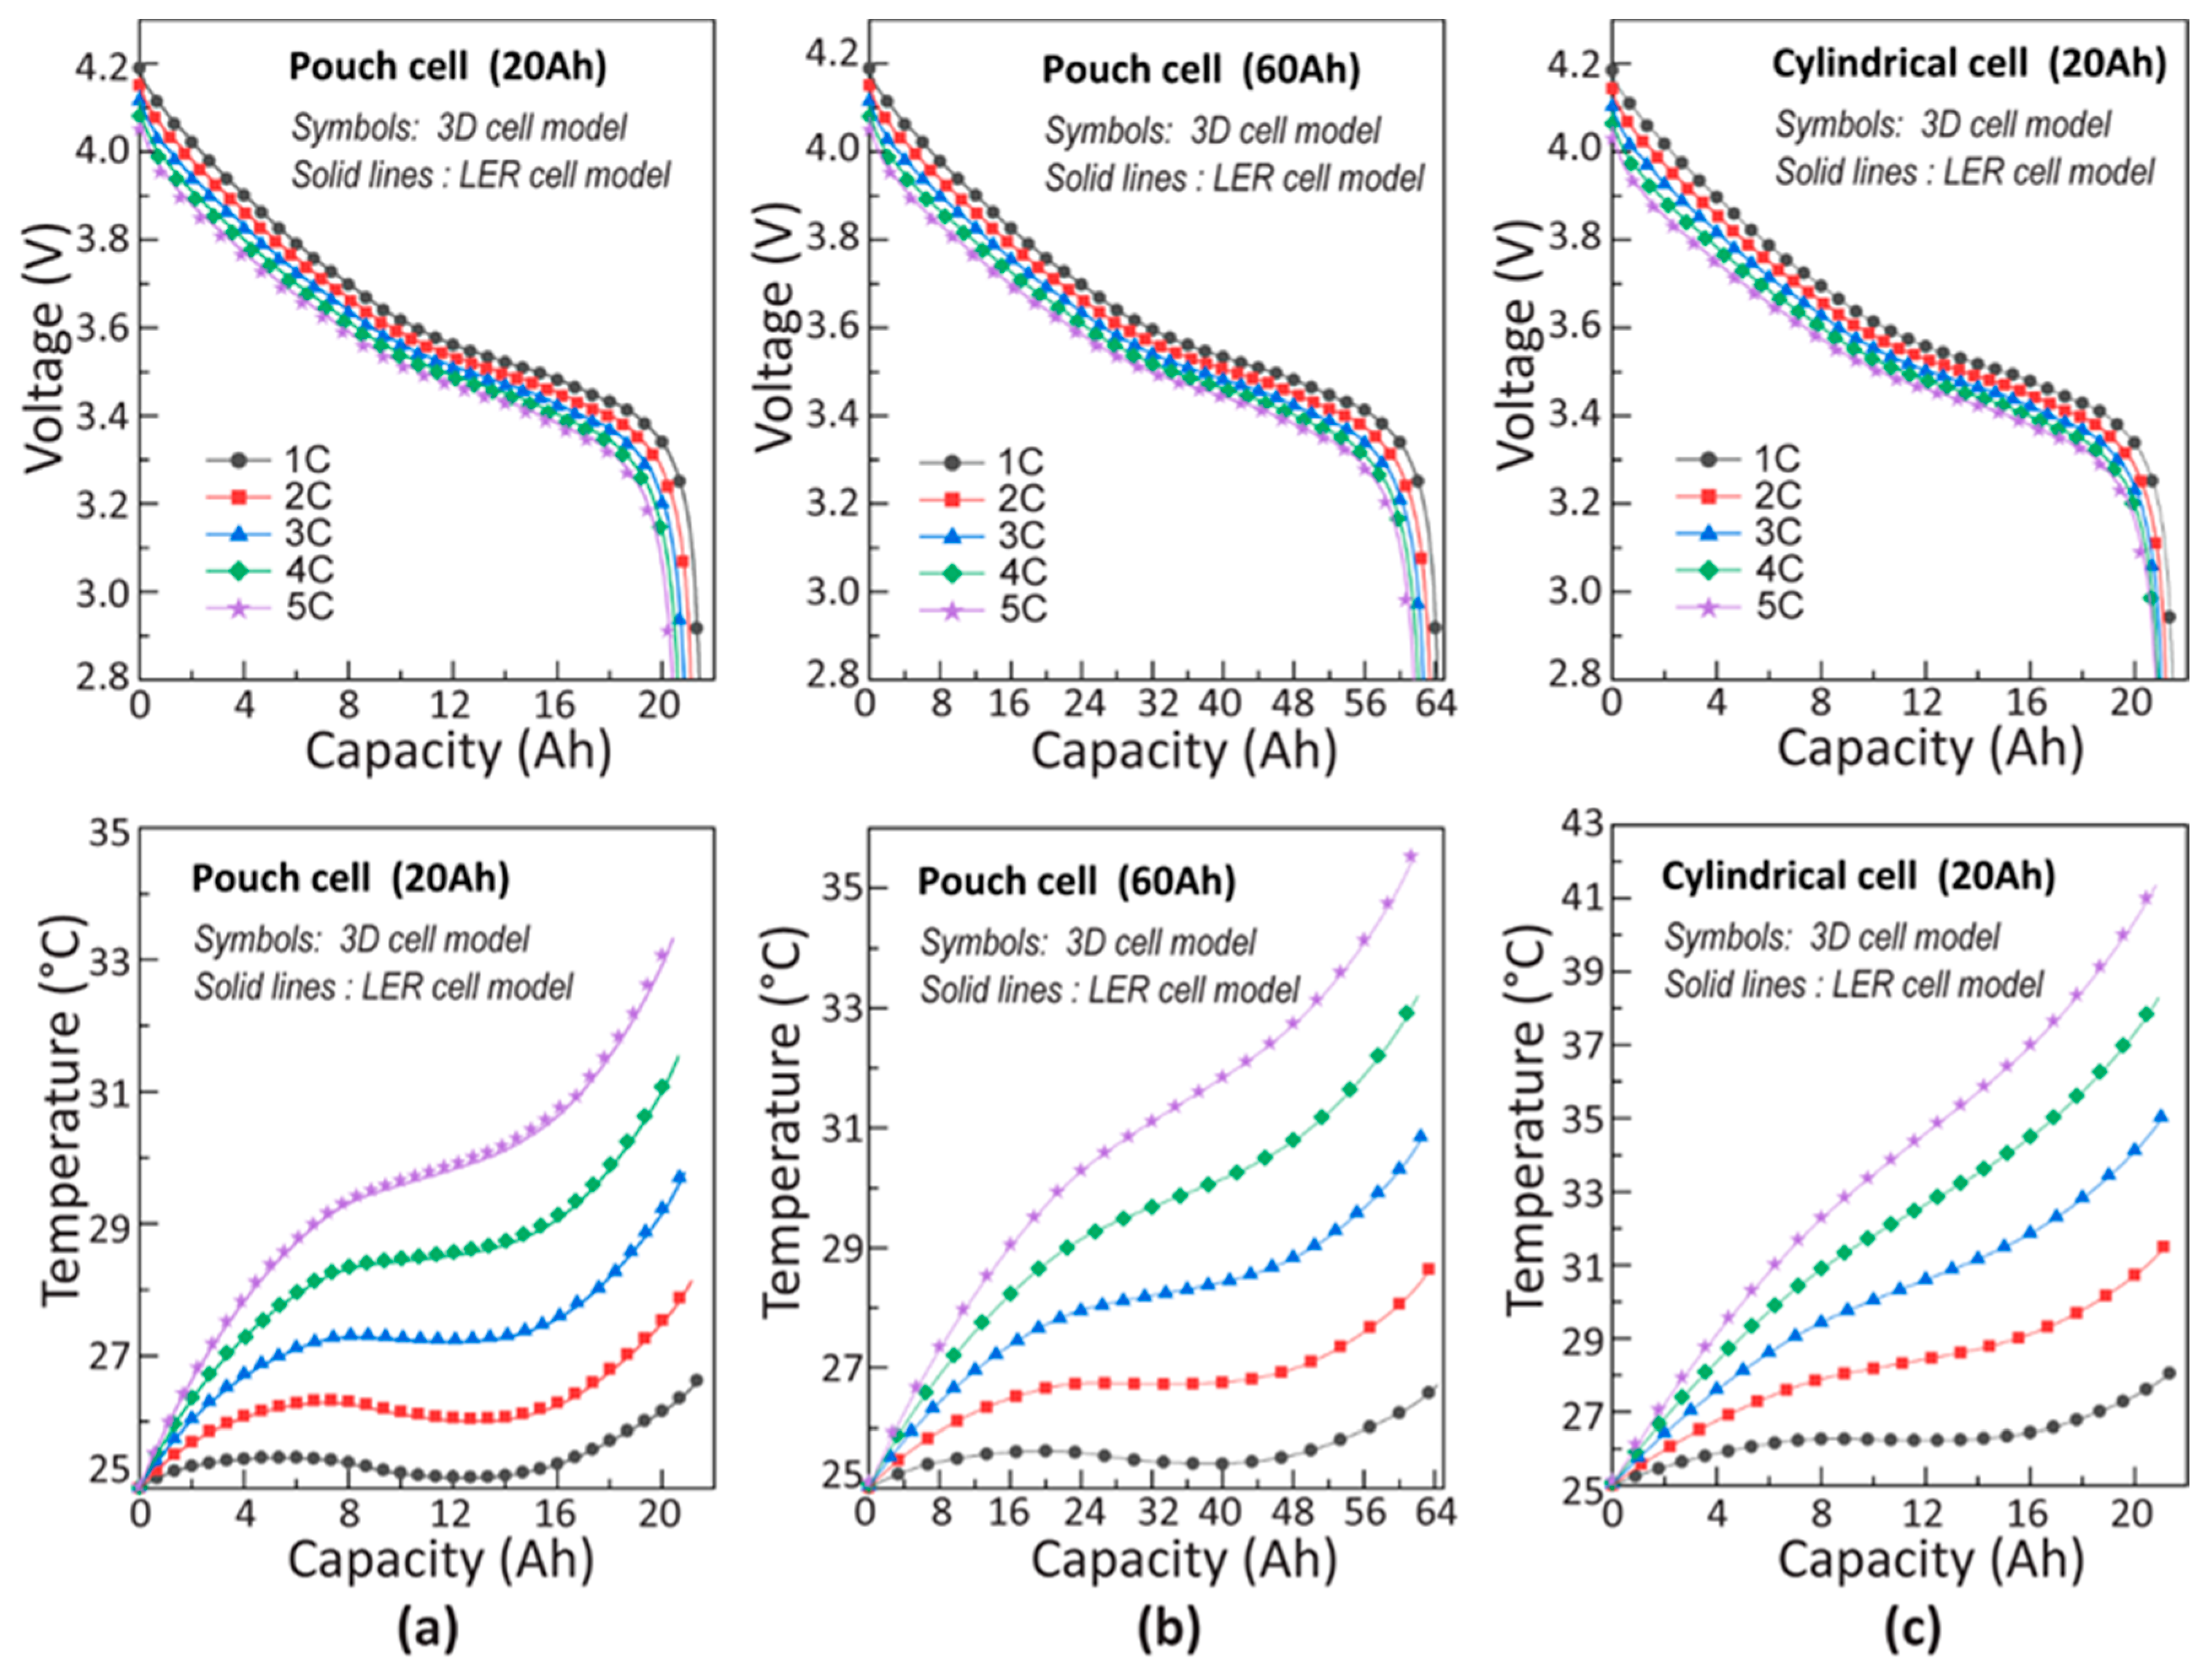
4.1. Constant Current Discharge Simulation

Figure 6 shows graphs that compare the output voltage and average temperature calculated using the LER cell and 3D cell models under conditions in which the 20-Ah and 60-Ah pouch cells and 20-Ah cylindrical cell discharge at a constant current from 1 C to 5 C. As the LER cell model considers the electrical resistance of the collector plate and the thermal resistance of the cell volume, the temperature increase and the output voltage drop in the large cells can be seen in the LER cell model results as in the 3D cell model results.
As shown in Figure 6, the voltage and temperature results of the LER cell model coincided with the 3D cell model results within a margin of error of 1% in the three types of cells. The difference between the LER cell and the 3D cell models comes from the simplification of the LER cell model. As the lumped mass was assumed in the LER cell model, the imbalance of electrochemical reactions inside the cell volume could not be predicted by this model. For example, as electrochemical reactions occur more actively in parts that are closer to the electrical tabs of the current collector, such parts discharge faster and become hotter. However, the effects of this imbalance were not significant because the difference between the LER cell and the 3D cell models was small.

4.2. Power Profile Simulation

In the response analysis of the duty cycle in which the output voltage and current of the cell shortly change, the results of the LER cell model were compared with those of the 3D cell and lumped cell models. In the power profile, the PNNL-22010 duty-cycle conditions of the ESS proposed by the Pacific Northwest National Laboratory (PNNL) were used [35]. The initial operating conditions were set to 25 °C with an initial SOC of 53.2%.
Figure 7 shows the voltage response results of each cell regarding a PNNL cycle of 300 min. As shown in Figure 7a, in the response of the 20-Ah cell, whose collector plate had a small resistance, the maximum voltage difference between the 3D cell and the lumped cell models was less than 3 mV, which is small. The experimental data obtained by testing the 20-Ah reference cell also met the model results. As shown in Figure 7b,c, in the response of the 60-Ah cell, the maximum voltage difference between the 3D cell and the lumped cell models was about 20 mV, and the highest voltage difference (45 mV) was displayed by the cylindrical cell, which had the highest collector plate resistance. With respect to all cells, the results for the LER cell model were very similar to those of the 3D cell model, which were within a margin of error of +/−1%. In the power profile cycle, the temperature increase was very low (about 1 °C) in all cells; thus, the difference between the 3D cell model and LER cell model was insignificant.

4.3. Cycle Life Simulation

Degradation of LIB cells is also affected by the cell size and design. The temperature increases in large cells can activate parasitic reactions, causing the lifespan of the cells to decrease more rapidly. To verify whether the LER cell model can appropriately predict this phenomenon as the 3D cell model, a cycle operation of the three cells was simulated to compare the capacity retention. The 4CD4CCCV cycle was composed of five stages: 4 C constant current discharge (2.8 V cutoff), 30 min break, 4 C constant current charge (4.2 V cutoff), 4.2 V constant voltage charge (0.05 C cutoff), and 30 min break. For all cells, the initial SOC was set to 100 %, and the initial operating and atmospheric temperatures were set to 25 °C. The 20-Ah pouch cell was cycled 2000 times, and the experimental data and the lumped cell model results were compared. The 60-Ah pouch cell and cylindrical cell were simulated until the capacity reached 80% of their initial value.
Figure 8a shows the model results and experimentally measured values of the capacity retention of the 20-Ah pouch cell with respect to the cycle operation. The discharged capacities calculated by the LER, 3D, and lumped models for 2000 cycles displayed a margin of error of less than 1%, which meets the experimentally measured capacity. The small difference between the model results was caused by the small electrical resistance of the current collector of the 20-Ah pouch cell followed by small Joule heating. Its thermal resistance was also relatively low due to its thin and wide geometry. Therefore, its temperature increase appeared insignificant to impact the degradation. In Figure 2a, it can be verified that at 5 C of discharge operation, temperature increases of the 3D cell model were within 1 °C of those of the lumped cell model. Thus, the lifespan of the 20-Ah pouch cell was not considerably affected by the cell size. Meanwhile, Figure 8b shows the capacity retention calculated for the 60-Ah pouch cell and 20-Ah cylindrical cell. In the case of the 60-Ah pouch cell, at 973 cycles, there was a difference of about 2% between discharged capacities in the LER, 3D, and lumped cell model. In addition, the differences between the model results were increased up to about 6.3% at 746 cycles for the 20-Ah cylindrical cell. This was caused by severe temperature increases in the 20-Ah cylindrical cell, considerably accelerating lifespan reduction. The discharge curves of the 60-Ah pouch cell and 20-Ah cylindrical cell, during the cycle where the discharged capacity reached 80%, are compared in Figure 8c. Even at the end of life after a large number of cycles, the LER cell model showed almost identical voltage curves with the 3D cell model, while the lumped cell model had higher output voltages (23 mV in the 60-Ah pouch cell and 110 mV in the cylindrical cell).

4.4. Comparison of Calculation Times

Table 4 lists the calculation times of the LER cell and 3D cell models when the simulation was conducted by a PC with 16.0 GB of RAM and an Intel Core i7-6700K 4.00-GHz CPU. Despite having conducted the 3D cell model simulation using OpenMP parallel programing with eight CPUs, the LER cell model displayed a significantly better calculation efficiency than the 3D cell model for all operating conditions. In the case of the cylindrical cell, which has a high number of computational nodes, this difference became larger; the calculation time of the LER cell model using a single CPU was down to 1/1300 for a 4CD4CCCV cycle simulation. The 3D cell model with at least thousands of nodes in the cell domain can help to take long times for calculating the lifespan reduction through cycling simulations. It is expected that the LER cell model can be useful for predicting the lifespan of large cells accurately and effectively.
Moreover, the LER cell model in this study was developed using a full-physics model as sub-domain models that somewhat delayed the calculation time through iterative calculations. However, if the LER cell model with the equivalent electrical and thermal resistances employs the ECMs or other ROMs with fast calculations as sub-domain models, better calculation efficiency can be expected.

5. Conclusions

In this study, an LER cell model that efficiently performs accurate calculations was proposed; it can consider the scale-up effects that occur in large LIB cells. First, we confirmed that the additional internal resistance for the large LIB cells mainly occurs from current collectors by comparing the linear dependency of voltage and current and the equivalent electrical resistance at each DOD. Then, we developed a LER cell model by applying the electrical and thermal resistance, which are factors determined by the cell design and size.
Discharge test, power-profile cycle test, and lifespan reduction test results obtained from an actual commercial cell (NCM/graphite-cell-based 20-Ah pouch cell, TOP battery) were compared with the model results of the LER, 3D, and lumped cell models to verify the accuracy of the LER cell model regarding the scale effects in the large cells. In addition, we modeled a virtual 60-Ah pouch cell and a 20-Ah cylindrical cell that have the same electrode design as the actual LIB cell (20-Ah pouch cell) to identify the effect of cell design and size on performance and degradation. For the 20-Ah pouch cell with small electrical and low thermal resistance due to its thin and wide geometry, the difference between the three models showed as less than 1% after 2000 cycles. However, the difference between the lumped cell model and the 3D cell model for 60-Ah pouch cell and a 20-Ah cylindrical cell were clearly observed at 2.0% (after 973 cycles) and 6.3% (after 746 cycles), while it was confirmed that the LER cell model showed similar results compared to the 3D cell model. Results from this study show that the effects of this imbalance were not significant because the difference between the LER cell and the 3D cell models was small. In addition, when designing large LIB cells, we confirmed that it is important to design not only to have a small thermal resistance, for example a thin and wide pouch cell, but also to minimize electrical resistance in current collectors through tab design. Finally, we show the LER cell model demonstrated calculation times as fast as the lumped cell model and the same accuracy as the 3D cell model. In particular, this model showed the reduction of the computation time of 1/1300 during cycle simulation compared to the 3D cell model. Therefore, the LER cell model is expected to be useful for analyzing the behavior or lifespan of large LIB cells in energy systems, such as electric vehicles and energy storage systems.

Author Contributions

The author’s contributions in the paper are as follows: Conceptualization, H.-K.K. and K.-J.L.; methodology, H.-K.K. and K.-J.L.; software, H.-K.K.; validation, H.-K.K.; investigation, H.-K.K. and K.-J.L.; writing—original draft preparation, H.-K.K.; writing—review and editing, K.-J.L.; supervision, K.-J.L. All authors have read and agreed to the published version of the manuscript.

Funding

This research was funded by National Research Foundation of Korea, grant number 2019R1A2C100617712b and the Korea Institute of Energy Technology Evaluation and Planning (KETEP) and the Ministry of Trade, Industry & Energy (MOTIE) of the Republic of Korea (No. 20174010201160).

Conflicts of Interest

The authors declare no conflict of interest.

References

  1. Zhang, L.J.; Peng, H.; Ning, Z.S.; Mu, Z.Q.; Sun, C.Y. Comparative Research on RC Equivalent Circuit Models for Lithium-Ion Batteries of Electric Vehicles. Appl. Sci. 2017, 7, 1002. [Google Scholar] [CrossRef] [Green Version]
  2. Zhang, X.; Lu, J.L.; Yuan, S.F.; Yang, J.; Zhou, X. A novel method for identification of lithium-ion battery equivalent circuit model parameters considering electrochemical properties. J. Power Sources 2017, 345, 21–29. [Google Scholar] [CrossRef]
  3. Zhang, C.; Allafi, W.; Dinh, Q.; Ascencio, P.; Marco, J. Online estimation of battery equivalent circuit model parameters and state of charge using decoupled least squares technique. Energy 2018, 142, 678–688. [Google Scholar] [CrossRef]
  4. Saleem, K.; Mehran, K.; Ali, Z. Online reduced complexity parameter estimation technique for equivalent circuit model of lithium-ion battery. Electr. Power Syst. Res. 2020, 185, 106356. [Google Scholar] [CrossRef]
  5. Harris, S.J.; Harris, D.J.; Li, C. Failure statistics for commercial lithium ion batteries: A study of 24 pouch cells. J. Power Sources 2017, 342, 589–597. [Google Scholar] [CrossRef] [Green Version]
  6. Ma, Y.; Li, B.S.; Li, G.Y.; Zhang, J.X.; Chen, H. A Nonlinear Observer Approach of SOC Estimation Based on Hysteresis Model for Lithium-ion Battery. IEEE/CAA J. Autom. 2017, 4, 195–204. [Google Scholar] [CrossRef]
  7. Xiong, R.; Tian, J.P.; Mu, H.; Wang, C. A systematic model-based degradation behavior recognition and health monitoring method for lithium-ion batteries. Appl. Energy 2017, 207, 372–383. [Google Scholar] [CrossRef]
  8. Rodriguez, A.; Plett, G.L. Controls-oriented models of lithium-ion cells having blend electrodes. Part 2: Physics-based reduced-order models. J. Energy Storage 2017, 11, 219–236. [Google Scholar] [CrossRef]
  9. Lai, X.; Zheng, Y.J.; Sun, T. A comparative study of different equivalent circuit models for estimating state-of-charge of lithium-ion batteries. Electrochim. Acta 2018, 259, 566–577. [Google Scholar] [CrossRef]
  10. Deng, Z.W.; Deng, H.; Yang, L.; Cai, Y.S.; Zhao, X.W. Implementation of reduced-order physics-based model and multi parameters identification strategy for lithium-ion battery. Energy 2017, 138, 509–519. [Google Scholar] [CrossRef]
  11. Bonkile, M.P.; Ramadesigan, V. Power management control strategy using physics-based battery models in standalone PV-battery hybrid systems. J. Energy Storage 2019, 23, 258–268. [Google Scholar] [CrossRef]
  12. Fuller, T.F.; Doyle, M.; Newman, J. Simulation and Optimization of the Dual Lithium Ion Insertion Cell. J. Electrochem. Soc. 1994, 141, 1–10. [Google Scholar] [CrossRef] [Green Version]
  13. Doyle, M.; Newman, J.; Gozdz, A.S.; Schmutz, C.N.; Tarascon, J.M. Comparison of modeling predictions with experimental data from plastic lithium ion cells. J. Electrochem. Soc. 1996, 143, 1890–1903. [Google Scholar] [CrossRef]
  14. Kwon, K.H.; Shin, C.B.; Kang, T.H.; Kim, C.S. A two-dimensional modeling of a lithium-polymer battery. J. Power Sources 2006, 163, 151–157. [Google Scholar] [CrossRef]
  15. Kim, U.S.; Shin, C.B.; Kim, C.S. Modeling for the scale-up of a lithium-ion polymer battery. J. Power Sources 2009, 189, 841–846. [Google Scholar] [CrossRef]
  16. Kim, G.H.; Smith, K.; Lee, K.J.; Santhanagopalan, S.; Pesaran, A. Multi-Domain Modeling of Lithium-Ion Batteries Encompassing Multi-Physics in Varied Length Scales. J. Electrochem. Soc. 2011, 158, A955–A969. [Google Scholar] [CrossRef]
  17. Lee, K.J.; Smith, K.; Pesaran, A.; Kim, G.H. Three dimensional thermal-, electrical-, and electrochemical-coupled model for cylindrical wound large format lithium-ion batteries. J. Power Sources 2013, 241, 20–32. [Google Scholar] [CrossRef]
  18. Smith, K.; Wang, C.Y. Solid-state diffusion limitations on pulse operation of a lithium ion cell for hybrid electric vehicles. J. Power Sources 2006, 161, 628–639. [Google Scholar] [CrossRef]
  19. Cai, L.; White, R.E. Reduction of Model Order Based on Proper Orthogonal Decomposition for Lithium-Ion Battery Simulations. J. Electrochem. Soc. 2009, 156, A154–A161. [Google Scholar] [CrossRef] [Green Version]
  20. Guo, M.; White, R.E. A distributed thermal model for a Li-ion electrode plate pair. J. Power Sources 2013, 221, 334–344. [Google Scholar] [CrossRef]
  21. Rodriguez, A.; Plett, G.L.; Trimboli, M.S. Improved transfer functions modeling linearized lithium-ion battery-cell internal electrochemical variables. J. Energy Storage 2018, 20, 560–575. [Google Scholar] [CrossRef]
  22. Jin, X.; Liu, C. Physics-based control-oriented reduced-order degradation model for LiNiMnCoO2—Graphite cell. Electrochim. Acta 2019, 312, 188–201. [Google Scholar] [CrossRef]
  23. Li, Y.; Vilathgamuwa, M.; Farrell, T.; Choi, S.S.; Tran, N.T.; Teague, J. A physics-based distributed-parameter equivalent circuit model for lithium-ion batteries. Electrochim. Acta 2019, 299, 451–469. [Google Scholar] [CrossRef]
  24. Yin, Y.L.; Hu, Y.; Choe, S.Y.; Cho, H.; Joe, W.T. New fast charging method of lithium-ion batteries based on a reduced order electrochemical model considering side reaction. J. Power Sources 2019, 423, 367–379. [Google Scholar] [CrossRef]
  25. Yang, X.G.; Leng, Y.J.; Zhang, G.S.; Ge, S.H.; Wang, C.Y. Modeling of lithium plating induced aging of lithium-ion batteries: Transition from linear to nonlinear aging. J. Power Sources 2017, 360, 28–40. [Google Scholar] [CrossRef]
  26. Safari, M.; Morcrette, M.; Teyssot, A.; Delacourt, C. Multimodal Physics-Based Aging Model for Life Prediction of Li-Ion Batteries. J. Electrochem. Soc. 2009, 156, A145–A153. [Google Scholar] [CrossRef]
  27. Ramadass, P.; Haran, B.; Gomadam, P.M.; White, R.; Popov, B.N. Development of first principles capacity fade model for Li-ion cells. J. Electrochem. Soc. 2004, 151, A196–A203. [Google Scholar] [CrossRef]
  28. Ning, G.; White, R.E.; Popov, B.N. A generalized cycle life model of rechargeable Li-ion batteries. Electrochim. Acta 2006, 51, 2012–2022. [Google Scholar] [CrossRef]
  29. Kim, H.K.; Kim, C.J.; Kim, C.W.; Lee, K.J. Numerical analysis of accelerated degradation in large lithium-ion batteries. Comput. Chem. Eng. 2018, 112, 82–91. [Google Scholar] [CrossRef]
  30. Kim, H.K.; Choi, J.H.; Lee, K.J. A Numerical Study of the Effects of Cell Formats on the Cycle Life of Lithium Ion Batteries. J. Electrochem. Soc. 2019, 166, A1769–A1778. [Google Scholar] [CrossRef]
  31. Viswanathan, V.V.; Choi, D.; Wang, D.H.; Xu, W.; Towne, S.; Williford, R.E.; Zhang, J.G.; Liu, J.; Yang, Z.G. Effect of entropy change of lithium intercalation in cathodes and anodes on Li-ion battery thermal management. J. Power Sources 2010, 195, 3720–3729. [Google Scholar] [CrossRef]
  32. MeCleary, D.A.H.; Meyers, J.P.; Kim, B. Three-Dimensional Modeling of Electrochemical Performance and Heat Generation of Spirally and Prismatically Wound Lithium-Ion Batteries. J. Electrochem. Soc. 2013, 160, A1931–A1943. [Google Scholar] [CrossRef]
  33. Taheri, P.; Mansouri, A.; Yazdanpour, M.; Bahrami, M. Theoretical Analysis of Potential and Current Distributions in Planar Electrodes of Lithium-ion Batteries. Electrochim. Acta 2014, 133, 197–208. [Google Scholar] [CrossRef]
  34. Zhao, W.; Luo, G.; Wang, C.Y. Effect of tab design on large-format Li-ion cell performance. J. Power Sources 2014, 257, 70–79. [Google Scholar] [CrossRef]
  35. Conover, D.R.; Crawford, A.J.; Viswanathan, V.; Ferreira, S.R.; Schoenwald, D.A. Protocol for Uniformly Measuring and Expressing the Performance of Energy Storage Systems PNNL-22010 Rev. 1; Pacific Northwest National Laboratory: Richland, WA, USA, 2014. [Google Scholar]
Figure 1. Concept of the multi-scale multi-dimensional (MSMD) model framework.
Sustainability 12 08544 g001
Figure 2. Comparisons of output voltages and average temperatures between the 3D cell models and the lumped models of the (a) 20-Ah pouch cell, (b) 60-Ah pouch cell, and (c) 20-Ah cylindrical cell.
Sustainability 12 08544 g002
Figure 3. (a) Linear dependency of voltage and current at various DODs by 3D cell model (20-Ah pouch cell), (b) Internal resistance vs. DOD for each type of cell, and (c) difference of internal resistance between the lumped cell model and the 3D cell models.
Sustainability 12 08544 g003
Figure 4. Contours of the electric potentials in the 3D cell models at 5 min after 1 C discharge: (a) 20-Ah pouch cell, (b) 60-Ah pouch cell, and (c) 20-Ah cylindrical cell, and (d) the equivalent electrical resistance of current collectors at various DODs.
Sustainability 12 08544 g004
Figure 5. Procedure of the LER cell model.
Sustainability 12 08544 g005
Figure 6. Output voltage and average temperature at constant current discharge conditions calculated by the LER cell and 3D cell models for (a) 20-Ah pouch cell, (b) 60-Ah pouch cell, and (c) 20-Ah cylindrical cell.
Sustainability 12 08544 g006
Figure 7. Output voltage at the duty cycle condition of energy storage systems calculated by the LER cell, 3D cell, and lumped cell models for (a) 20-Ah pouch cell, (b) 60-Ah pouch cell, and (c) 20-Ah cylindrical cell.
Sustainability 12 08544 g007
Figure 8. Comparisons of the LER cell, 3D cell, and lumped cell models: (a) capacity retention of the 20-Ah pouch cell, (b) 60-Ah pouch cell and 20-Ah cylindrical cell, and (c) output voltages of the 60-Ah pouch cell and 20-Ah cylindrical cell at 973 and 746 cycles, respectively.
Sustainability 12 08544 g008
Table 1. Solution variables and governing equations of the sub-domain models.
Governing EquationsBoundary Conditions
1D Spherical Particle Model
Li+ conservation
in active material
c s t = D s r 2 r ( r 2 c s r )   ( 1 ) c s r | r = 0 = 0 , c s r | r = R s = i D s F
Charge transfer
Kinetic
(Butler–Volmer equation)
i = i r + i para (2)
where i r = F k i ( c e ) α a ( c s , max c s , e ) α a ( c s , e ) α a { exp [ α a F R T η ] exp [ α c F R T η ] } ,
η = ϕ s ϕ e U O C V i R S E I (negative electrode)
and η = ϕ s ϕ e U O C V (positive electrode)
Aging mechanism
(SEI layer growth)
i para = i para ,   init exp [ α c F R T η para ] , ( i para ,   init = F k 0 , S E I c E C s ) (3)
where η para = η = ϕ s ϕ e U para i R S E I ,
D E C ( c E C s c E C 0 ) δ S E I = i para F , δ S E I t = i para M S E I ρ S E I F , and R S E I = δ S E I κ S E I
1D Porous Electrode Model
Li conservation
in liquid phase
( ε e c e ) t = x ( D e e f f x c e ) + ( 1 t + 0 ) F a s i r i e F t + 0 x (4) c e x | x = 0 = 0 ,   c e x | x = L a + L s + L c = 0
Charge conservation
in liquid phase
x ( κ e f f x ϕ e ) + x ( κ D e f f x ln c e ) + a s i r = 0 (5)
where κ D e f f = 2 κ e f f R T F ( 1 + ln f ± ln c e ) ( 1 t + 0 )
ϕ e x | x = 0 = 0 ,   ϕ e x | x = L a + L s + L c = 0
Charge conservation
in solid phase
x ( σ eff x ϕ s ) a s i r = 0   (6) ϕ s x | x = 0 = Φ N , ϕ s x | x = L a = 0
ϕ s x | x = L a + L s = 0 , ϕ s x | x = L a + L s + L c = Φ P
Table 2. Summary of model parameters in the sub-domain models.
Particle Domain & Electrode DomainNegative ElectrodeSeparatorPositive Electrode
Particle radius, Rs (m)4 × 10⁻⁶ d-4 × 10⁻⁶ d
Diffusivity, Ds,a, Ds,c (m2/s)1.5 × 10−14 e-2.0 × 10⁻¹⁴ e
Reaction rate constant ka, kc (m/s)4.8 × 10−11 e-5.5 × 10⁻¹¹ e
SEI layer molecular weight, M S E I (kg/mol)0.1 [27,28,29,30]--
SEI layer density, ρ S E I (kg/m3)2100 [27,28,29,30]--
Equilibrium potential of parasitic reaction,   U para (V)0.4 [27,29,30]--
SEI layer conductivity, κ S E I (S/m)3.8 × 10−6 e--
Initial concentration of EC, C E C 0 (mol/m3)4541 [30]--
Diffusivity of EC, D E C (mol/m3)2.0 × 10−18 [30]
Reaction rate for SEI layer, k0,SEI (m/s)1.1 × 10−15 e
Initial SEI layer resistance ( Ω m 2 )0.001 --
Electrode thickness, La, Ls, Lc (m)39 × 10−6 d20 × 10−6 d31 × 10−6 d
Electrolyte diffusion coefficient, De (m2/s)-3 × 10−10 e-
Conductivity, σ s , a , σ s , c (S/m)100 [16]-10 [16]
Porosity, ε i 0.397 d0.43 d0.404 d
Volume fraction AB, ε f , i 0.044 d-0.042 d
Volume fraction PVDF, ε p , i 0.007 d-0.064 d
Initial salt concentration, ce, (mol/m3)1200 d
Transport number, t + 0 0.363 [29,30]
Faraday’s constant, F, (C/mol)96,450
Gas constant, R (J/mol·K)8.314
Cell domainPouch, 20-AhPouch, 60-AhCylindrical, 20-Ah
Dimension (mm)185 × 147 × 5.88 d278 × 195 × 8.85 d44(D) × 110(h) d
Mass density of jelly roll (kg/m3)2580 d
Specific heat of jelly roll (J/kg∙K)975 d
Electric conductivity for Cu, σ (S/m)59.6 × 10 6 [16,17]
Electric conductivity for Al, σ + (S/m)37.8 × 10 6 [16,17]
Thermal conductivity (W/m∙K)x, y direction: 27 [16]
z direction: 0.8 [16]
azimuthal direction, k r :27 [17]
transversal direction, k t : 0.8 [17]
Convective heat transfer coefficient, h (W/m2∙K)25
Initial temperature, T init (°C)25
Atmospheric temperature, T amb (°C)25
e: estimated, d: design parameter.
Table 3. Computational costs of the lithium-ion battery (LIB) models.
Number of NodesPouch (20-Ah)Pouch (60-Ah)Cylindrical
Lumped cell modelParticle domain151515
Electrode domain252525
Cell domain111
3D cell modelParticle domain151515
Electrode domain252525
Cell domain3000300015,000
Calculation Time
(1 C discharge)
Pouch (20-Ah)Pouch (60-Ah)Cylindrical
Lumped cell model1 CPU core6.6 s6.8 s6.6 s
3D cell model1 CPU core1 h 53 min1 h 56 min7 h 20 min
8 CPU core27 min28 min1 h 40 min
Table 4. Computational times of the LER and 3D cell models.
Run ModeModelPouch (20-Ah)Pouch (60-Ah)Cylindrical
Discharge (1CD)3D cell model27 min28 min1 h 40 min
LER cell model7.59 s7.86 s6.84 s
PNNL cycle (300 min)3D cell model3 days3 days9 days
LER cell model4 m 30 s4 m 28 s4 m 12 s
4CD4CC42CV (~80%)3D cell model6 days7 days22 days
LER cell model35 min31 min24 min
Publisher’s Note: MDPI stays neutral with regard to jurisdictional claims in published maps and institutional affiliations.

