Article

Comfort Evaluation of an Aircraft Cabin System Employing a Hybrid Model

1
Key Laboratory of Industrial Design and Ergonomics, Ministry of Industry and Information Technology, Northwestern Polytechnical University, Xi’an 710072, China
2
College of Mechanical and Electronic Engineering, China University of Petroleum, Qingdao 266580, China
*
Author to whom correspondence should be addressed.
Sustainability 2020, 12(20), 8503; https://doi.org/10.3390/su12208503
Submission received: 12 September 2020 / Revised: 12 October 2020 / Accepted: 12 October 2020 / Published: 15 October 2020
(This article belongs to the Section Health, Well-Being and Sustainability)

Abstract

:
Comfort is becoming one of the most important principles in the process of design and evaluation of civil aircraft cabins. However, the comprehensive quantitative evaluation of comfort in an aircraft cabin is a complicated issue because of the subjectivity of comfort perception and a large number of factors involved in the whole complex cabin system. A hybrid model combined with the Decision Making Trial and Evaluation Laboratory (DEMATEL) method and fuzzy comprehensive evaluation is proposed, which considers both the interrelation between the criteria and the fuzziness of subjective comfort perception concurrently. The result of the empirical study from the questionnaire survey in flight was consistent with that of the hybrid model. The proposed model is effective. It could provide a more reasonable priority to improve comfort in the aircraft cabin. According to the measured results of the cabin environment, the cabin facilities and layout, seats and service, the specific differences between the criteria can be displayed clearly, which is helpful to improve the cabin comfort level.

1. Introduction

Comfort in aircraft cabin systems is becoming an important issue with which airlines differentiate themselves in a competitive market [1]. Passengers are paying more attention to it with the increase in traveling by airplane. Some studies show that comfort has a close relation with passengers’ choice about airlines and flights. A study has shown that about 35% of passengers base their choices on comfort, delays and past flight experience. [2]. Richards and Jacobson [3] suggested that comfort levels would influence how willing a person is to fly again on future occasions. Therefore, there is no doubt that the research regarding comfort in aircraft cabin systems plays an increasingly important role in the aviation industry.
The aircraft cabin is an artificial closed space at high altitude with high speed when the aircraft is in flight, which is of great difference with an ordinary cabin environment. Passengers are required to stay in their seat with their safety belt and are not allowed to walk around. At the same time, passengers need to stay together for a period of time with neighbor passengers and crew members. The comfort perceived by passengers is influenced by both objective factors, such as environment, facilities, services [4], etc., and subjective and emotional factors, such as expectations, emotions and preferences, characterized by ambiguity and uncertainty. To date, many scholars have conducted comfort studies through different perspectives. However, the existing comfort research mainly focuses on the automobile seat, the office seat, hand tools, trains, etc. In the field of comfort in the aircraft cabin, there is relatively little research. There has been no widely accepted concept regarding comfort until recently [5]. However, some points of view summarized by De Looze, Kuijt-Evers and van Dieen [5] have been approved by most scholars. These are as follows: (1) Comfort is a construct with subjective and personal elements. (2) Various factors influence comfort (psychological, physiological and physical). (3) Comfort is a reaction to the environment.
There are a number of criteria influencing passengers’ comfort in aircraft cabin systems. Some scholars conducted some empirical studies to identify the influencing factors and generating mechanism [6,7]. Some researchers studied the influencing factors affecting passenger comfort [1]. From the perspective of the environment, some studies focus on the influence of vibration [8], noise [9], light [10], temperature and humidity [11], and air quality [12] on comfort. Bubb [13] prioritized the different cabin environment elements according to their importance, in which a bad smell is the most important cause of discomfort. The remaining factors are light, noise, vibration, cabin climate and anthropometry. Ahmadpour, et al. [14] demonstrated that a clean, tidy cabin environment in aircraft and the featured, aesthetic flight facilities would intensify the passengers’ comfort experience.
From the view of products and experiences, the seat and the cabin layout are the focus of study because passengers spend most time on seat in flight. Besides, other products in cabin, such as luggage room, washroom, kitchen, in-flight entertainment system (IFE), were mentioned in the survey about comfort. Vink, et al. [15] showed that legroom, hygiene, the crew attention and the seat were the most important aspects influencing comfort by the way of an analysis of 10,032 internet trip reports. Richards, et al. [16] demonstrated that legroom is the most important factors related to passengers’ comfort. Kremser, et al. [17] displayed the relationship between overall comfort feeling and seat pitch in an experiment. Passengers perceived the highest comfort level at the seat pitch of 36 inches because it provides the optimum eye height and a comfortable visual impression. Rossi, et al. [18] indicated passengers’ comfort levels when they performed different activities by way of the observation survey, in which the seat space played an important role. Tan, et al. [19] discussed the influence of headrests in an airplane’s economy class on passenger comfort and created a new conceptual design. Chen [20] suggested that the passengers’ overall satisfaction was related to service quality, perceived value and behavioral intentions. Vink and Brauer [7] indicated that if the environment factors were guaranteed, service was the key element affecting the passenger comfort experience, including the crew’s attention, attitude, appearance, meals and drinks, information broadcast, and response time. Vink and Hallbeck [21] highlighted that expectations and emotions of passengers played a major part on comfort perception from the perspective of experience. These studies discussed the influences of one aspect in the aircraft cabin. Little attention has been devoted to establishing a comprehensive comfort evaluation of the whole cabin system, and most of these studies assumed that the influencing factors were independent, which is not accurate. The comprehensive evaluation of passengers’ comfort in aircraft cabin systems from the holistic perspective is a complicated issue [1,5]. It is necessary to understand the interrelationship between the influencing factors, which plays an important role in taking measures to improve passengers’ comfort. The main reasons are the subjectivity and personality of comfort perception of passengers and the complexity of a large number of factors involved in the whole cabin system. Furthermore, the main methods adopted in these studies are interviews and statistics analysis of data. They could not offer a comprehensive, quantitative evaluation result of the passengers’ comfort in the aircraft cabin system from a systematized perspective. Referring to the comfort evaluation, many scholars are devoted to studying the objective and quantitative measurement and evaluation methods of comfort [22,23]. Fuzzy set theory is used to deal with the ambiguous concepts related to human’s subjective perceptions and judgments, which is suitable to measure comfort [24]. Voisin and Levrat [25] previously presented a method by quantifying sensory characteristics evaluated exclusively by the human, using a fuzzy measurement system to evaluate the comfort of the car seat. Grabisch, et al. [26] established a model of subjective sensation of discomfort and different macro-zones of the body using fuzzy measures and Choquet integrals, which is more flexible and has a good accuracy. The above methods are mainly applied to assess the comfort of the ground vehicle seats or comfort regarding the environment comfort, which are only parts of overall comfort. Moreover, they have not been used in the field of comfort evaluation in an aircraft cabin system. However, they could provide good references and lay a foundation for comfort evaluation in an aircraft cabin system.
Thus, the purpose of this paper is to establish a new evaluation model for comfort in an aircraft cabin system with consideration of the interrelationship between criteria from the perspective of the whole cabin system. Based on summarizing the factors influencing comfort in the aircraft cabin system, a comprehensive evaluation criteria system is established. A new hybrid model combined with the Decision Making Trial and Evaluation Laboratory (DEMATEL) method [27] and the fuzzy comprehensive evaluation method is proposed, which takes full advantage of these two approaches. The DEMATEL method is applied to illustrate the interrelations between criteria and calculate the corresponding weights. Fuzzy comprehensive evaluation is used to evaluate the subjective comfort perception and provide a quantitative result, which could be applied to the process of improving comfort in the aircraft cabin system with a more reasonable priority.

2. Materials and Methods
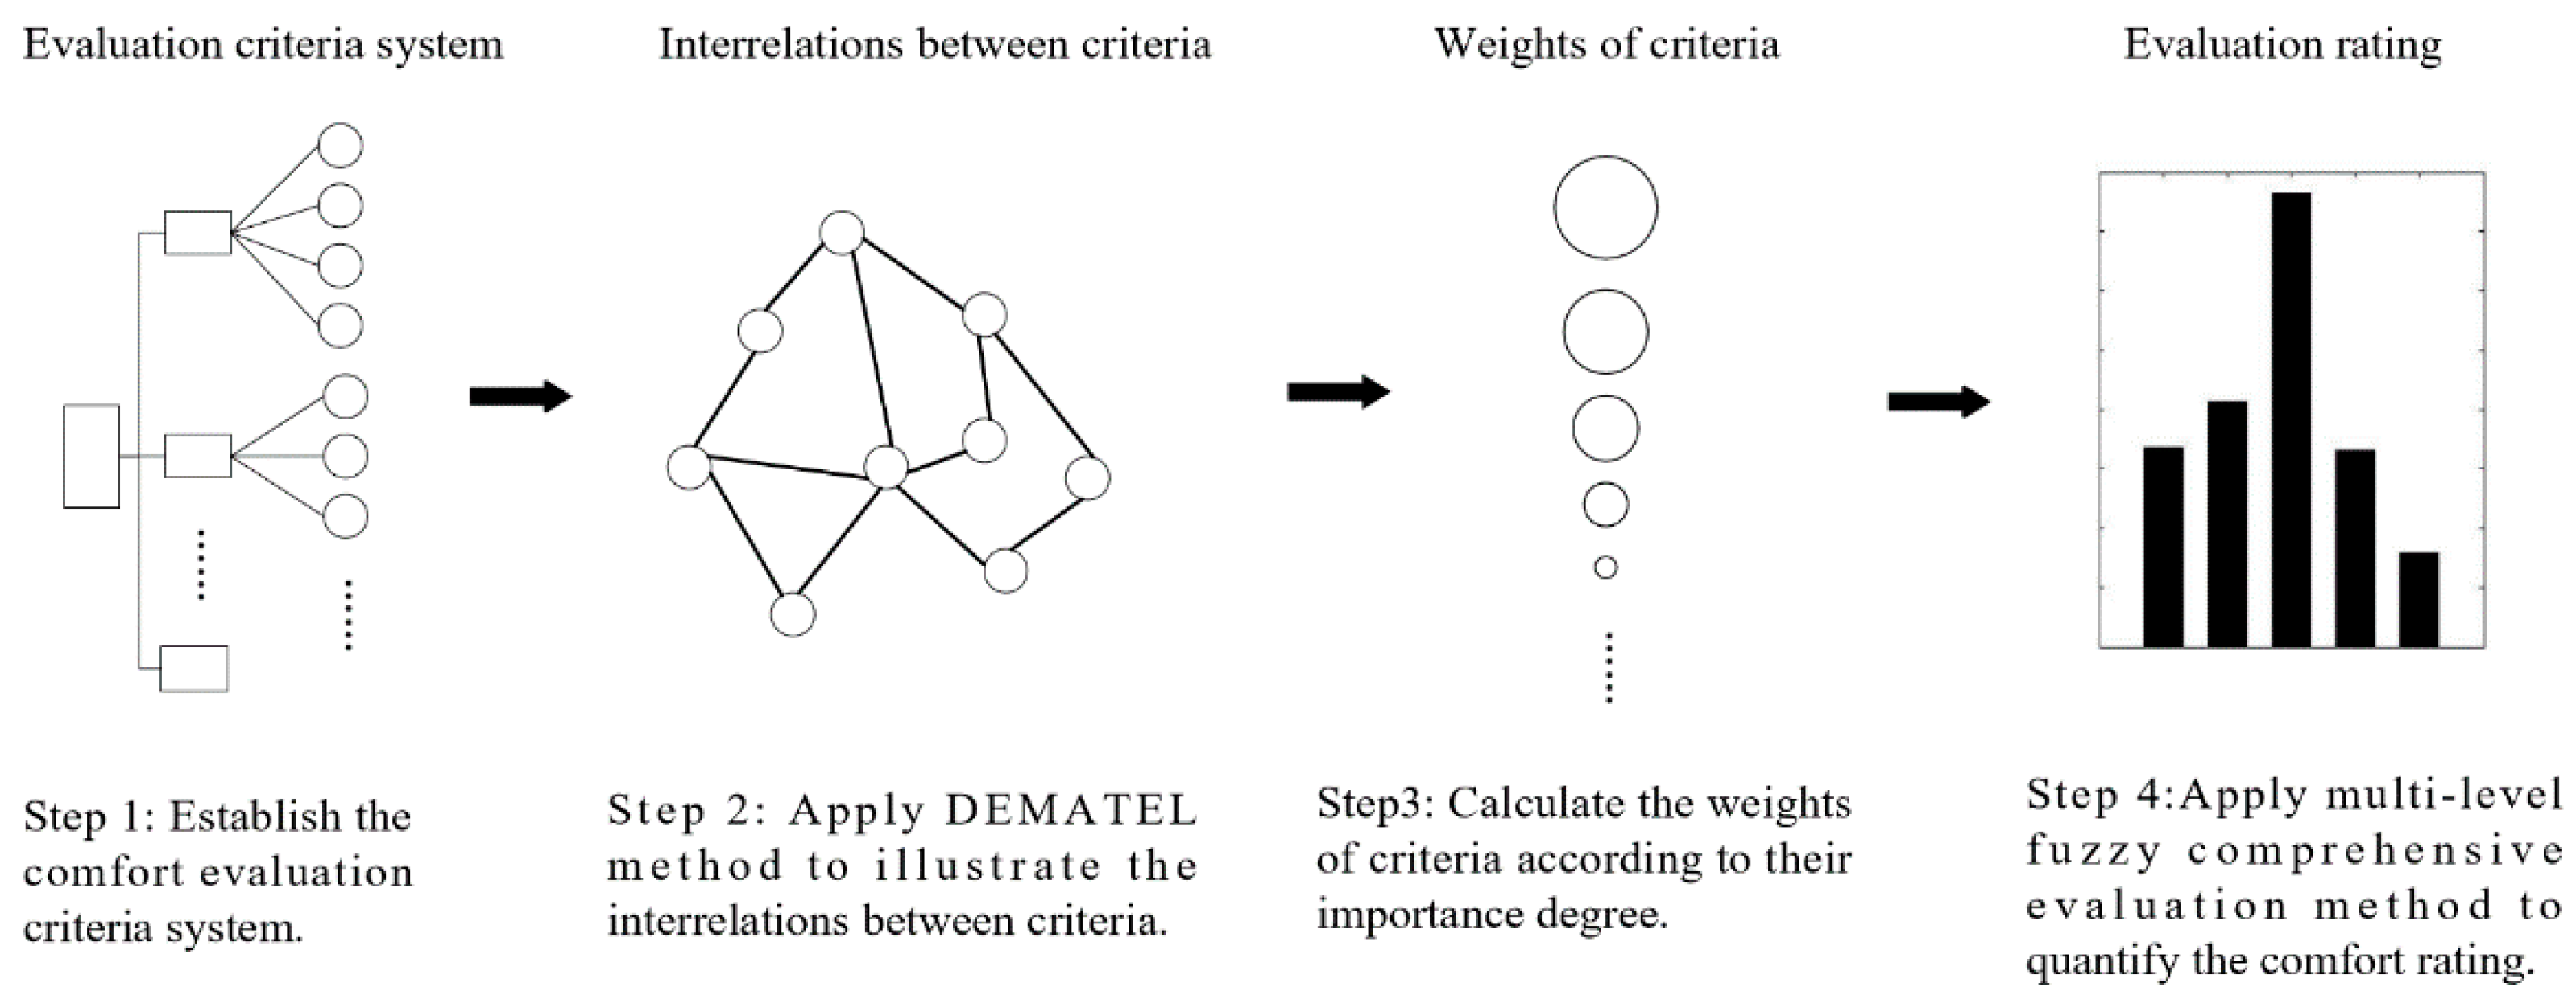
2.1. Procedures

A hybrid model for evaluating comfort in an aircraft cabin system is proposed and introduced, which integrates the DEMATEL method with multi-level fuzzy comprehensive evaluation [28]. The DEMATEL method is used to construct the interrelationship between criteria and calculate their weights according to their importance important degree. Multi-level fuzzy comprehensive evaluation is applied to deal with the subjectivity of evaluation and quantify the comfort level.
The procedures of the hybrid model are shown briefly in Figure 1.

2.2. DEMATEL Method

Decision Making Trial and Evaluation Laboratory (DEMATEL) was first proposed and developed by The Battelle Memorial Institute through its Geneva Research Centre in 1973 [28], and it is one of the structural modelling techniques based on graph theory and matrix. Not only could it analyze and visualize the causal relationships between criteria through a causal diagram, but it could also provide weight ranking according to the importance degree of criteria. The criteria could be classified into cause group (criteria impose an effect on others) and effect group (criteria receive an effect from others), which can help researchers understand the structural relationship between criteria better. This method has been used in many fields, except for in the area of comfort evaluation. This paper will adopt this effective structural modelling method to discuss the interrelationship between criteria.
The specific steps are as follows.
Step 1: Define the impact scale.
Suppose the number of criteria in the system is n, which is in a set U = { u 1 , u 2 , u 3 , , u n } . The impact scale should be set up in advance before the pair-wise comparison between criteria is carried out. In this method, we defined that the values of “4”, “3”, “2”, “1” and “0” represent “great effect”, “high effect”, “middle effect”, “low effect” and “no effect”, respectively.
Step 2: Establish the initial direct relation matrix.
Convert the linguistic descriptions of experts into crisp values after the pair-wise comparison according to the impact scale. The initial direct relation matrix Z = ( z i j ) n × n is composed with these numerical results. Z is a n × n non-negative matrix, and z i j indicates the direct effect of criterion i on criterion j. When i = j, the values of z i j are equal to 0.
Step 3: Normalize the initial direct relation matrix.
D = ( d i j ) n × n is the normalized direct relation matrix, which is calculated by Equation (1). 0 d i j 1 , When i = j, the values of d i j are equal to 0.
D = Z / max j = 1 n | z i j |
Step 4: Calculate the total relation matrix.
T is the total relation matrix, which represents the total relation between every pair criteria. T is calculated through Equation (2). I is an n × n identity matrix.
T = i = 1 n D i = D ( I D ) 1 = ( t i j ) n × n
Step 5: Obtain the influencing degree R and influenced degree C.
The influencing degree R is obtained by calculating the sum of rows in matrix T, which indicates the effect imposing another criterion. The influenced degree C is obtained by calculating the sum of columns in matrix T, which indicates the effect perceived by another criterion. R and C can be obtained by Equations (3) and (4), respectively.
R = [ j = 1 n t i j ] n × 1 = [ r i ] n × 1 ,   i = 1 , 2 , , n
C = [ i = 1 n t i j ] 1 × n = [ c j ] 1 × n ,   j = 1 , 2 , , n
Step 6: Calculate the central degree (R + C) and relation degree (RC).
(R + C) is denoted as the central degree, which can be obtained by calculating the value of ( r i +   c i ) when i = j. It represents how important the criterion i is. (RC) is denoted as relation degree which can be obtained by calculating the value of ( r i   c i ) when i = j. It indicates the effect criterion i contributing to the whole evaluation system. According to the value of (RC), the criteria could be classified into a cause group ( ( r i   c i ) > 0 ) and an effect group ( ( r i   c i ) < 0 ). The criteria in the cause group indicate that they have a great effect on others. The criteria in the effect group mean that they are highly affected by others.
Step 7: Draw the causal diagram.
Taking the central degree (R + C) as X axle and the relation degree (RC) as Y axle, the causal diagram could be obtained by mapping the data set of ( r i +   c i , r i   c i ) , which would offer a valuable insight for understanding the relationship between the criteria with a simplified visual structure.
Step 8: Calculate the weights of the criteria.
The weight of criterion w i can be calculated by Equation (5).
w i = E i / i = 1 n E i ( i = 1 , 2 , , n )   , 0 w i 1 ,   i = 1 n w i = 1

2.3. Multi-Level Fuzzy Comprehensive Evaluation Method

Subjectivity and fuzziness exist in the process of comfort perception and evaluation. Passengers evaluate or describe their comfort perception using the lingual expressions instead of definite values, which makes further evaluation and analysis difficult to compute. Therefore, fuzzy evaluation may be more suitable to measure ambiguous concepts associated with human beings’ subjective perceptions and judgments [29].
Fuzzy comprehensive evaluation based on the fuzzy set theory is proposed as a new decision-making method that is particularly useful in multivariable circumstances [30,31]. The numerous criteria will be classified into different layers according to the multi-level fuzzy comprehensive evaluation method, which could realize the evaluation from the lower levels to higher ones.
The steps are described as follows.
Step 1: Establish the factor set.
The whole evaluation criteria system can be divided into the target layer, factor layer, and criteria layer according to their hierarchy relation. A factor set includes different factors impacting the passenger comfort evaluation, which is defined as U = { U 1 , U 2 , , U k } , and the corresponding weight vector is W = ( W 1 , W 2 , , W k ) , in which, k = 1 , 2 , , N , N is the number of factors, k = 1 N W k = 1 .
The criteria set is denoted as U k = { u k 1 , u k 2 , , u k l } , and its corresponding weight vector is W k = ( w k 1 , w k 2 , , w k l ) . Among them, l = 1 , 2 , , m , M is the number of criteria belonging to a factor U k , and l = 1 m w k l = 1 .
Step 2: Construct the comment set.
The comment set is adopted to describe the factor’s level, which is denoted as V = { v 1 , v 2 , v 3 , , v n } , respectively representing different comment grades, of which, n is the number of comment grades.
Step 3: Establish the evaluating matrix of the criteria layer.
The criteria are denoted as u k l ( k = 1 , 2 , N ,   l = 1 , 2 , , m ) . The degree of membership that a criterion belongs to a comment grade is determined by the proportion accounting for the overall comments, which is denoted as r i j , i = 1 , 2 , , m ,     j = 1 , 2 , , n . This needs to be normalized to realize j = 1 n r i j = 1 . The evaluating matrix of a factor U k is composed of Equation (6), which is denoted as R k , k = 1 , 2 , , N , N represents the number of factors.
R k = ( r i j ) m × n = [ r 11 r 12 r 1 n r 21 r 22 r 2 n     r m 1 r m 2 r m n ]
Step 4: Establish the comprehensive evaluation matrix of the factor layer.
A fuzzy transformation is carried out between R k and the weight set of the criteria layer W k . The fuzzy comprehensive evaluation matrix of the factor layer S k is calculated by Equation (7).
S k = W k R k , k = 1 , 2 , , N
Step 5: Form the multi-level fuzzy comprehensive evaluation matrix of the target layer.
The evaluating matrix of the target layer R is obtained by R = ( S 1 , S 2 , , S k , S N ) T , of which k = 1 , 2 , N . A fuzzy transformation is carried out between R and the weight set of the factor layer W = ( W 1 , W 2 , , W k ) . Therefore, the fuzzy comprehensive evaluation matrix of the target layer S is calculated by Equation (8).
S = W R = ( W 1 , W 2 , , W k ) [ S 1 S 2 S k ] ,   k = 1 , 2 , N
Step 6: According to the maximum membership principle, the comfort level in the aircraft cabin system can be determined, and this can be applied to the next analysis to improve the cabin design.

2.4. Comfort Evaluation Criteria System

The numerous criteria will be classified into different layers according to the multi-level fuzzy comprehensive evaluation method, which can realize the evaluation from the lower levels to higher ones. On the basis of a literature review, a comprehensive evaluation criteria system of comfort in an aircraft cabin system was established (Table 1), which can be divided into a target layer, factor layer, and criteria layer. Comfort evaluation (U) is the main objective of this system; thus, it is located in the target layer, which includes four factors: cabin environment comfort (U1), cabin facility and layout comfort (U2), seat comfort (U3) and service comfort (U4), i.e., U = f (U1, U2, U3, U4). These four factors constitute the factor layer, which are the four major categories of evaluation criteria. They have different weights, which means they are different in importance. Every factor includes the specific related criteria, which are shown in Table 1. These criteria in this layer would be the main basis for evaluating and improving passengers’ comfort.

3. Results

According to the procedures of the hybrid model, the results are obtained and displayed in this section.

3.1. Results of the Hybrid Model

After establishing the evaluation criteria system, the DEMATEL method is applied to analyze the interrelations among criteria and calculate the weights of them based on importance degree.
Firstly, according to the linguistic scale, a pair-wise comparison of criteria was performed by selected experts. The number of experts who took part in the study was determined based on Equation S min = 0.5 ( 3 α + 5 ) = 32.5 33 [32], where: S min —minimum number of experts, α —statistical significance, α = 5 % . Therefore, 33 experts were chosen in this study, who were two cabin designers, two industrial designers, two mechanical engineers, and twenty-seven ordinary passengers. They all have experiences of flying.
Then, the direct-relation matrix Z was obtained. The average of the direct relation matrix was calculated from the thirty-three experts. Then the direct-relation matrix Z was obtained. The average of the direct relation matrix was calculated from the six experts. The normalized direct relation matrix D and the total relation matrix T are obtained according to Equations (1) and (2).
Influencing degree R and influenced degree C can be achieved by calculating the sum of rows and columns of the total relation matrix T, respectively, according to Equations (3) and (4). Besides, the central degree (R + C) and relation degree (RC) were obtained by ( r i +   c i ) and ( r i   c i ) . The weights of criteria and factors were calculated by Equation (5), and these are shown in Table 2.
Mapping the data set of (R + C, RC) by employing the prominence (R + C) as a horizontal axle and the relation (RC) as a vertical axle, the causal diagram was obtained, which is shown in Figure 2.
On the basis of having obtained the weights of factors and criteria, the multi-level fuzzy comprehensive evaluation of comfort in the aircraft cabin system was conducted. Firstly, a survey was carried out during the flight from Xi’an to Qingdao, which belongs to the Shandong Airlines. The purpose of the survey is to obtain the passengers’ subjective evaluation data, and finally, to verify whether the passengers’ evaluation result is consistent with the calculated results. The airplane type is a Boeing 737-300. The seat pitch is 31 inches, the seat width is 17 inches, and the configuration of the seats is 3–3. The in-flight entertainment (IFE) employs the TV overhead.
The duration of this flight was 2.5 h. The questionnaires were distributed to the passengers at half an hour before landing, which is shown in the appendix. Two-hundred questionnaires were distributed in one week, and there were 178 valid ones completed by 51 females and 127 males. The average age was 29.91 ± 6.57 years, the average stature 1.69 ± 0.21 m and the average weight 67 ± 14.56 kg. They gave their evaluation on this aircraft cabin system adopting five comment grades. These are denoted as V = { v 1 , v 2 , v 3 , v 4 , v 5 } , representing “worse”, “bad”, “general”, “good”, “better”, respectively. The number of these five comment grades aiming at every evaluating criterion was counted, and normalization was carried out. Therefore, the fuzzy evaluation matrix of different factors was obtained. Taking the criteria “temperature” in the cabin environment factor, for example, 53 passengers chose “better”, 71 chose “good”, 36 chose “general”, 18 chose “bad”, and no one chose “worse”. Therefore, the comment set of “temperature” was calculated as C = ( 53 / 178 , 71 / 178 , 36 / 178 , 18 / 178 , 0 / 178 ) = ( 0.3 , 0.4 , 0.2 , 0.1 , 0 ) . The remaining comment sets were obtained in the same way, and an evaluating matrix was composed of the comment sets of the whole criteria in a factor layer. For example, the result of the cabin environment factor layer was as shown in Table 3.
The corresponding evaluation matrixes R k were obtained.
The fuzzy calculation was conducted with weighted average fuzzy arithmetic operators, and the results are as follows. W 1 , W 2 , W 3 , W 4 , W 5 represent the weights of environment U1, cabin facilities and layout U2, seats U3 and service U4 in the factor layer, respectively. R 1 , R 2 , R 3 , R 4 , R 5 are the corresponding evaluation matrixes of environment U1, cabin facilities and layout U2, seats U3 and service U4. S 1 , S 2 , S 3 , S 4 , S 5 represent the evaluation results of these four factors, respectively. The specific value represents the evaluation grade of each factor, namely, the membership degree of “better”, “good”, “general”, “bad”, and “worse”. These results could indicate what is good and what is bad in an aircraft cabin.
S 1   =   W 1 R 1   =   ( 0.1596    0.2247    0.3943    0.1532    0.0681 ) S 2   =   W 2 R 2   =   ( 0.0605    0.2092    0.3453    0.3147    0.0701 ) S 3   =   W 3 R 3   =   ( 0.0936    0.2478    0.3399    0.1879    0.1306 ) S 4   =   W 4 R 4   =   ( 0.2101    0.3576    0.2602    0.1338    0.0381 )
The fuzzy evaluation matrix R of the target layer could be formed by these results.
R   =   ( S 1 , S 2 , S 3 , S 4 ) T   =   [ 0.1596 0.2247 0.3943 0.1532 0.0681 0.0605 0.2092 0.3453 0.3147 0.0701 0.0936 0.2478 0.3399 0.1879 0.1306 0.2101 0.3576 0.2602 0.1338 0.0381 ]
The fuzzy calculation was conducted again with weighted average fuzzy arithmetic operators to obtain the final results.
S = W R   = ( 0.1213    0.2468    0.3543    0.1983    0.0793 )
According to the calculating result, these five numbers represent the scores of comfort level calculated with the hybrid model. The comfort evaluation result is displayed in Figure 3. It shows that the results of cabin comfort affiliated with “better”, “good”, “general”, “bad” and “worse” are 0.1213, 0.2468, 0.3543, 0.1983 and 0.0793, respectively. According to the maximum membership principle, the comfort level of this aircraft cabin system is regarded as “general”, which needs to be improved in the future.

3.2. Results of the Empirical Study

A questionnaire was designed to obtain the basic data of passengers’ comfort perception in the aircraft cabin, which comprised 6 themes and 58 comfort-related questions in total. Two hundred questionnaires were distributed in Qingdao Liuting International Airport and Xi’an Xianyang International Airport by way of a field survey for one week. After completion, there were 178 valid ones in total. On a 5-point scale (1—worse, 2—bad, 3—general, 4—good, 5—better), the passengers were asked to describe their experience regarding comfort during this flight. The data were analyzed employing SPSS 22.0. The average score of overall comfort experience in this flight was 3.7, which indicated that passengers’ feeling of comfort was more than “general”, but not at a “good” level in this flight. This result was consistent with the computation result of the model.

4. Discussion

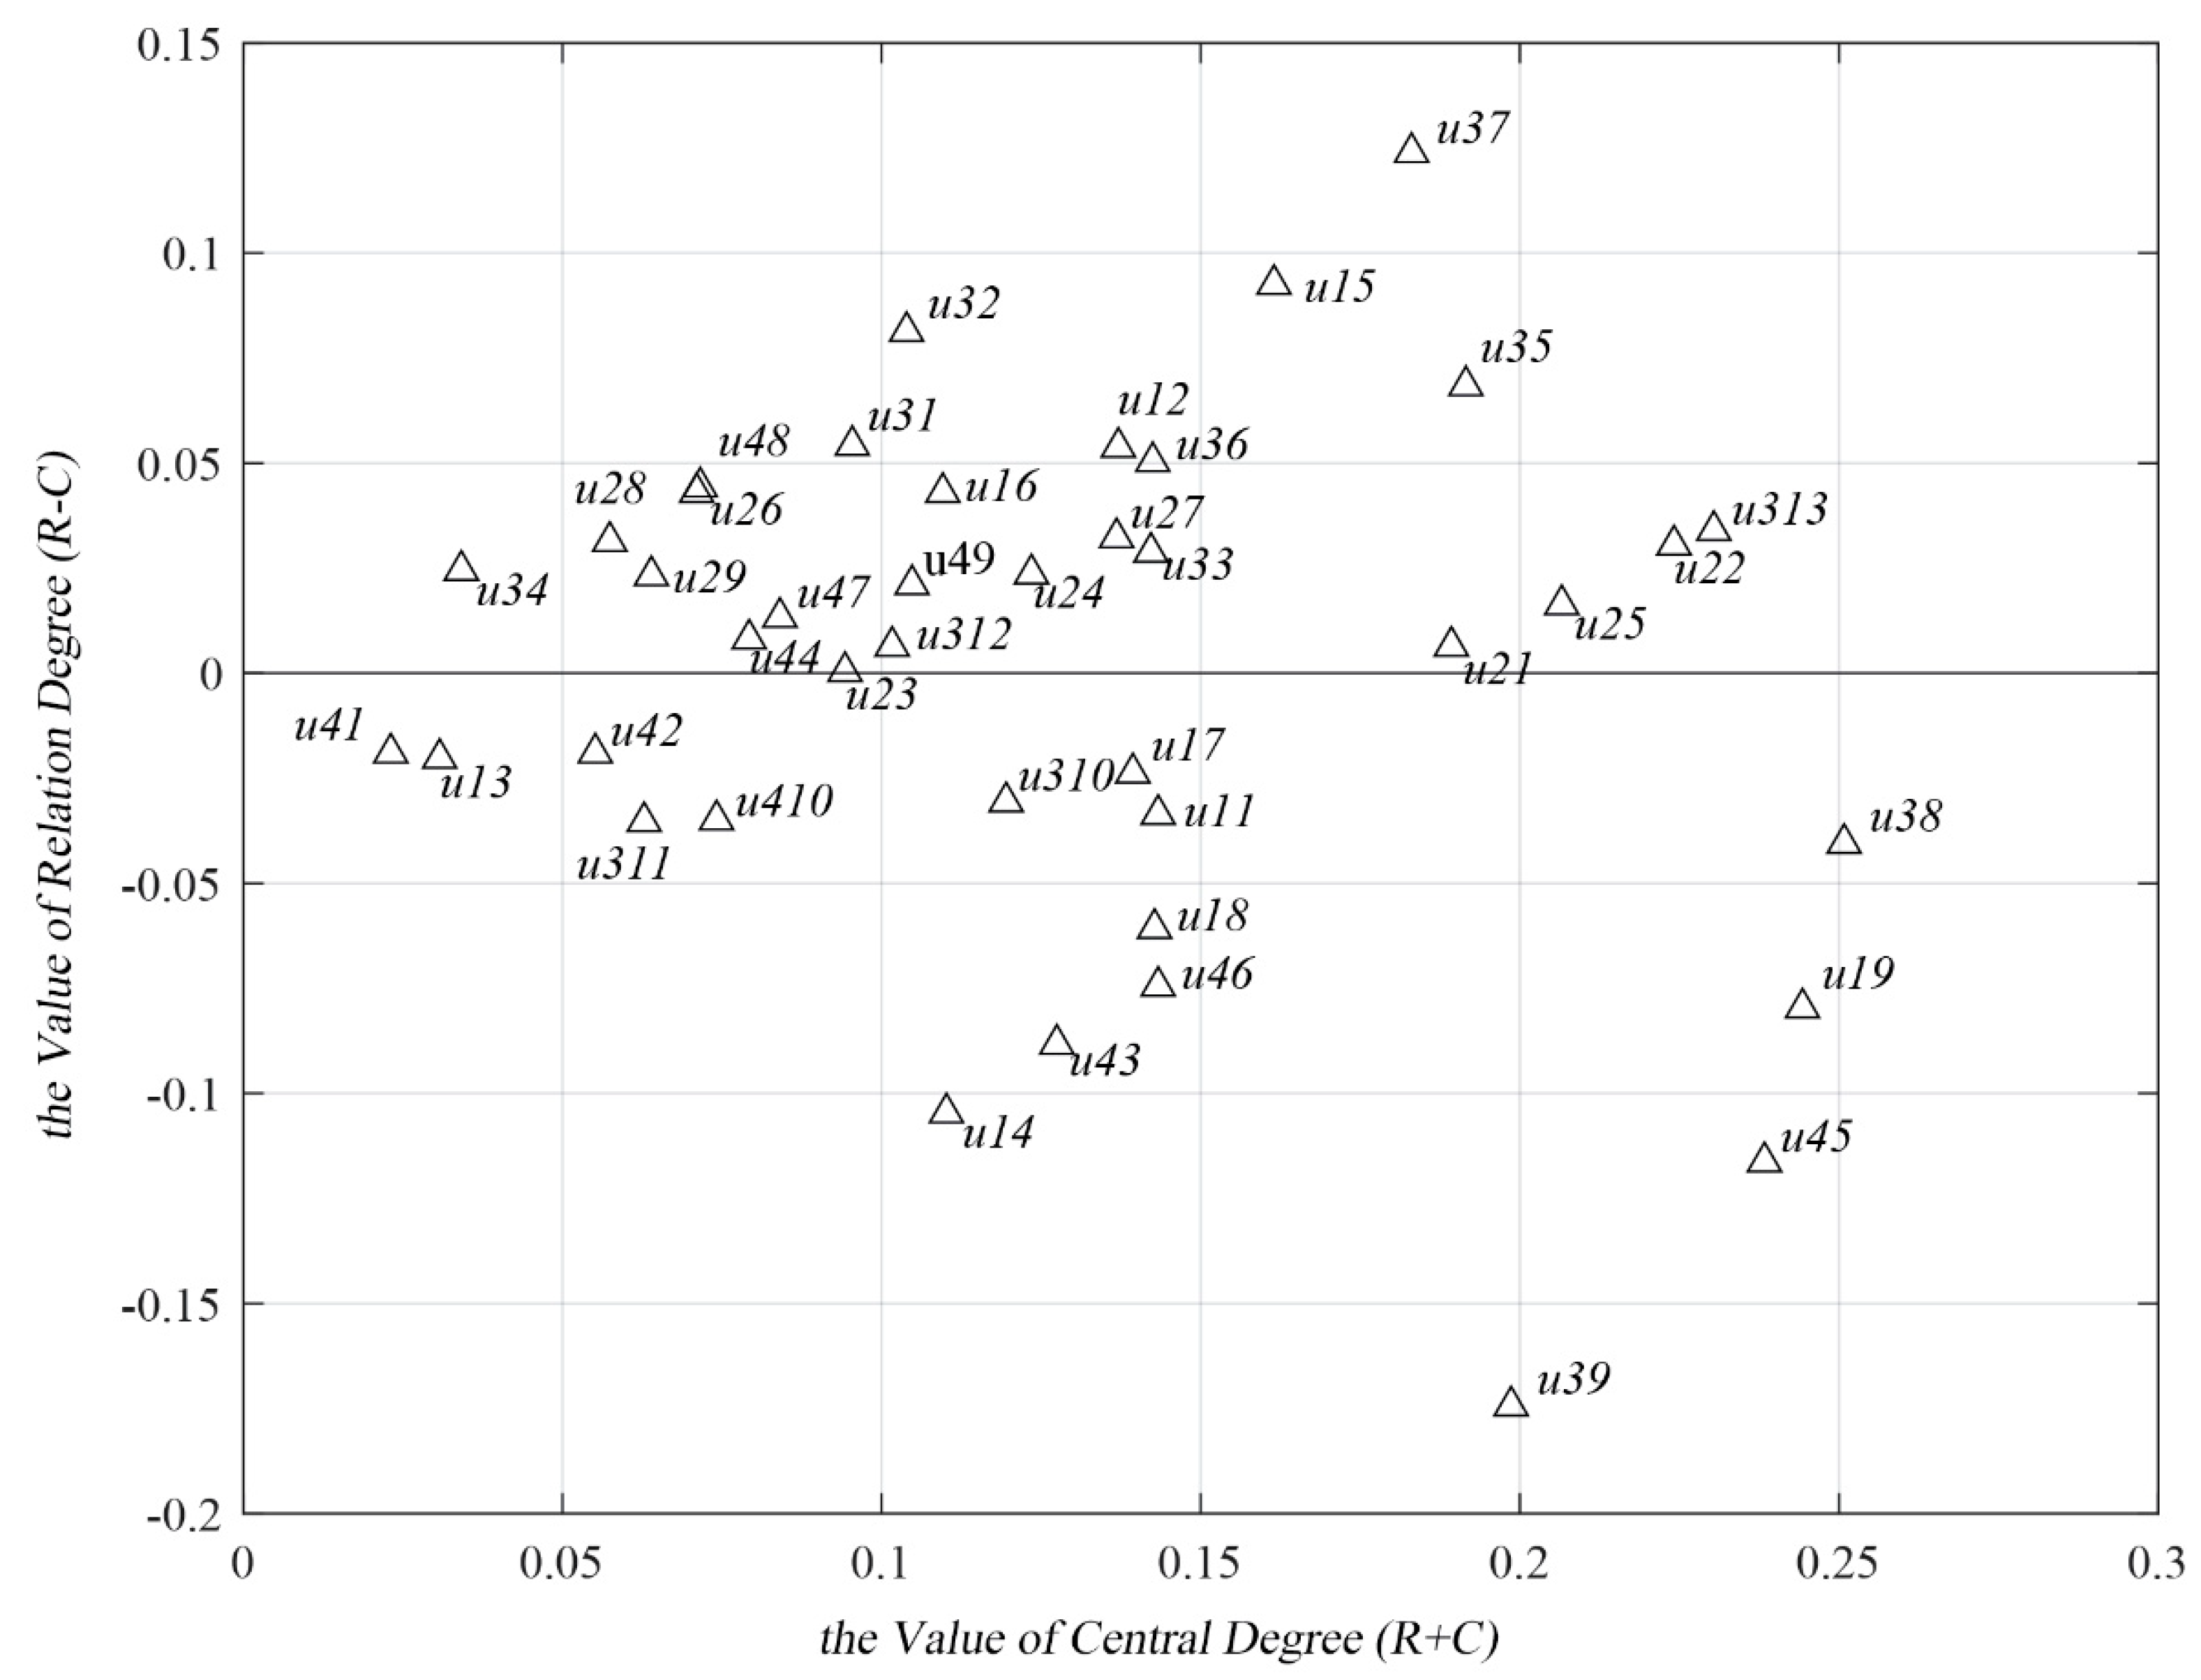
4.1. Interrelationship Analysis between Criteria

Some indications and information could be extracted from the analysis of the causal diagram. These suggestions are of great importance to direct cabin design for improving comfort in aircraft cabin systems. The criteria could be analyzed according to their values of central degree and effect degree. Because there are so many criteria in the evaluation system, we took some typical criteria for example to show the interrelationship between them. The criteria are classified into a cause group and an effect group according to the value of (RC). The criteria in the cause group (RC > 0) have more influence on those in the effect group (RC < 0). Therefore, it is essential to pay more attention to the criteria in the cause group. The backrest shape (u37) has the maximum value of (RC), which means that u37 is the most influential criterion. It has the greatest influence on other criteria and is influenced by others the least. The central degree of u37 is 0.1869, located in the middle of the X axle, as shown in Table 2. This represents that u37 is an important criterion impacting the passenger comfort. The improvement of u37 can effectively improve the passenger comfort perception level. Therefore, more importance should be attached to the backrest shape (u37).
The (RC) value of legroom (u39) is lower, while its central degree is located in the relatively front place in the X axle, which indicates that u39 is susceptible to other criteria. The adjustment of other criteria, such as seat pitch, seat width, backrest shape, etc., would lead to an improvement in u39. If we want to improve u39 to enhance the passenger comfort perception, we can take measures from the corresponding cause criteria. The improvement in these criteria would trigger a change in u39.
From analysis of the central degree, adjustability (u38) belongs to the effect group. Its central degree is highest, which means that it is one of the most important criteria in the comfort evaluation system. It is needed to be considered first, including the adjustable angle of the backrest, armrest, headrest, etc.
The weights of all criteria are assigned according to their importance degree. In the factor layer, seat comfort (U3) has the highest weight value of 0.3498, which is the most influential factor and should be considered first. The reason is that passengers spend most of the time in their seat, therefore, seat comfort has a direct relation to comfort evaluation. The remaining factors are cabin environment, cabin facilities, layout and service. In the criteria layer, seat adjustability (u38) has the highest weight. Cleanness (u19), button layout (u45), and tray table (u313) are the more important criteria.

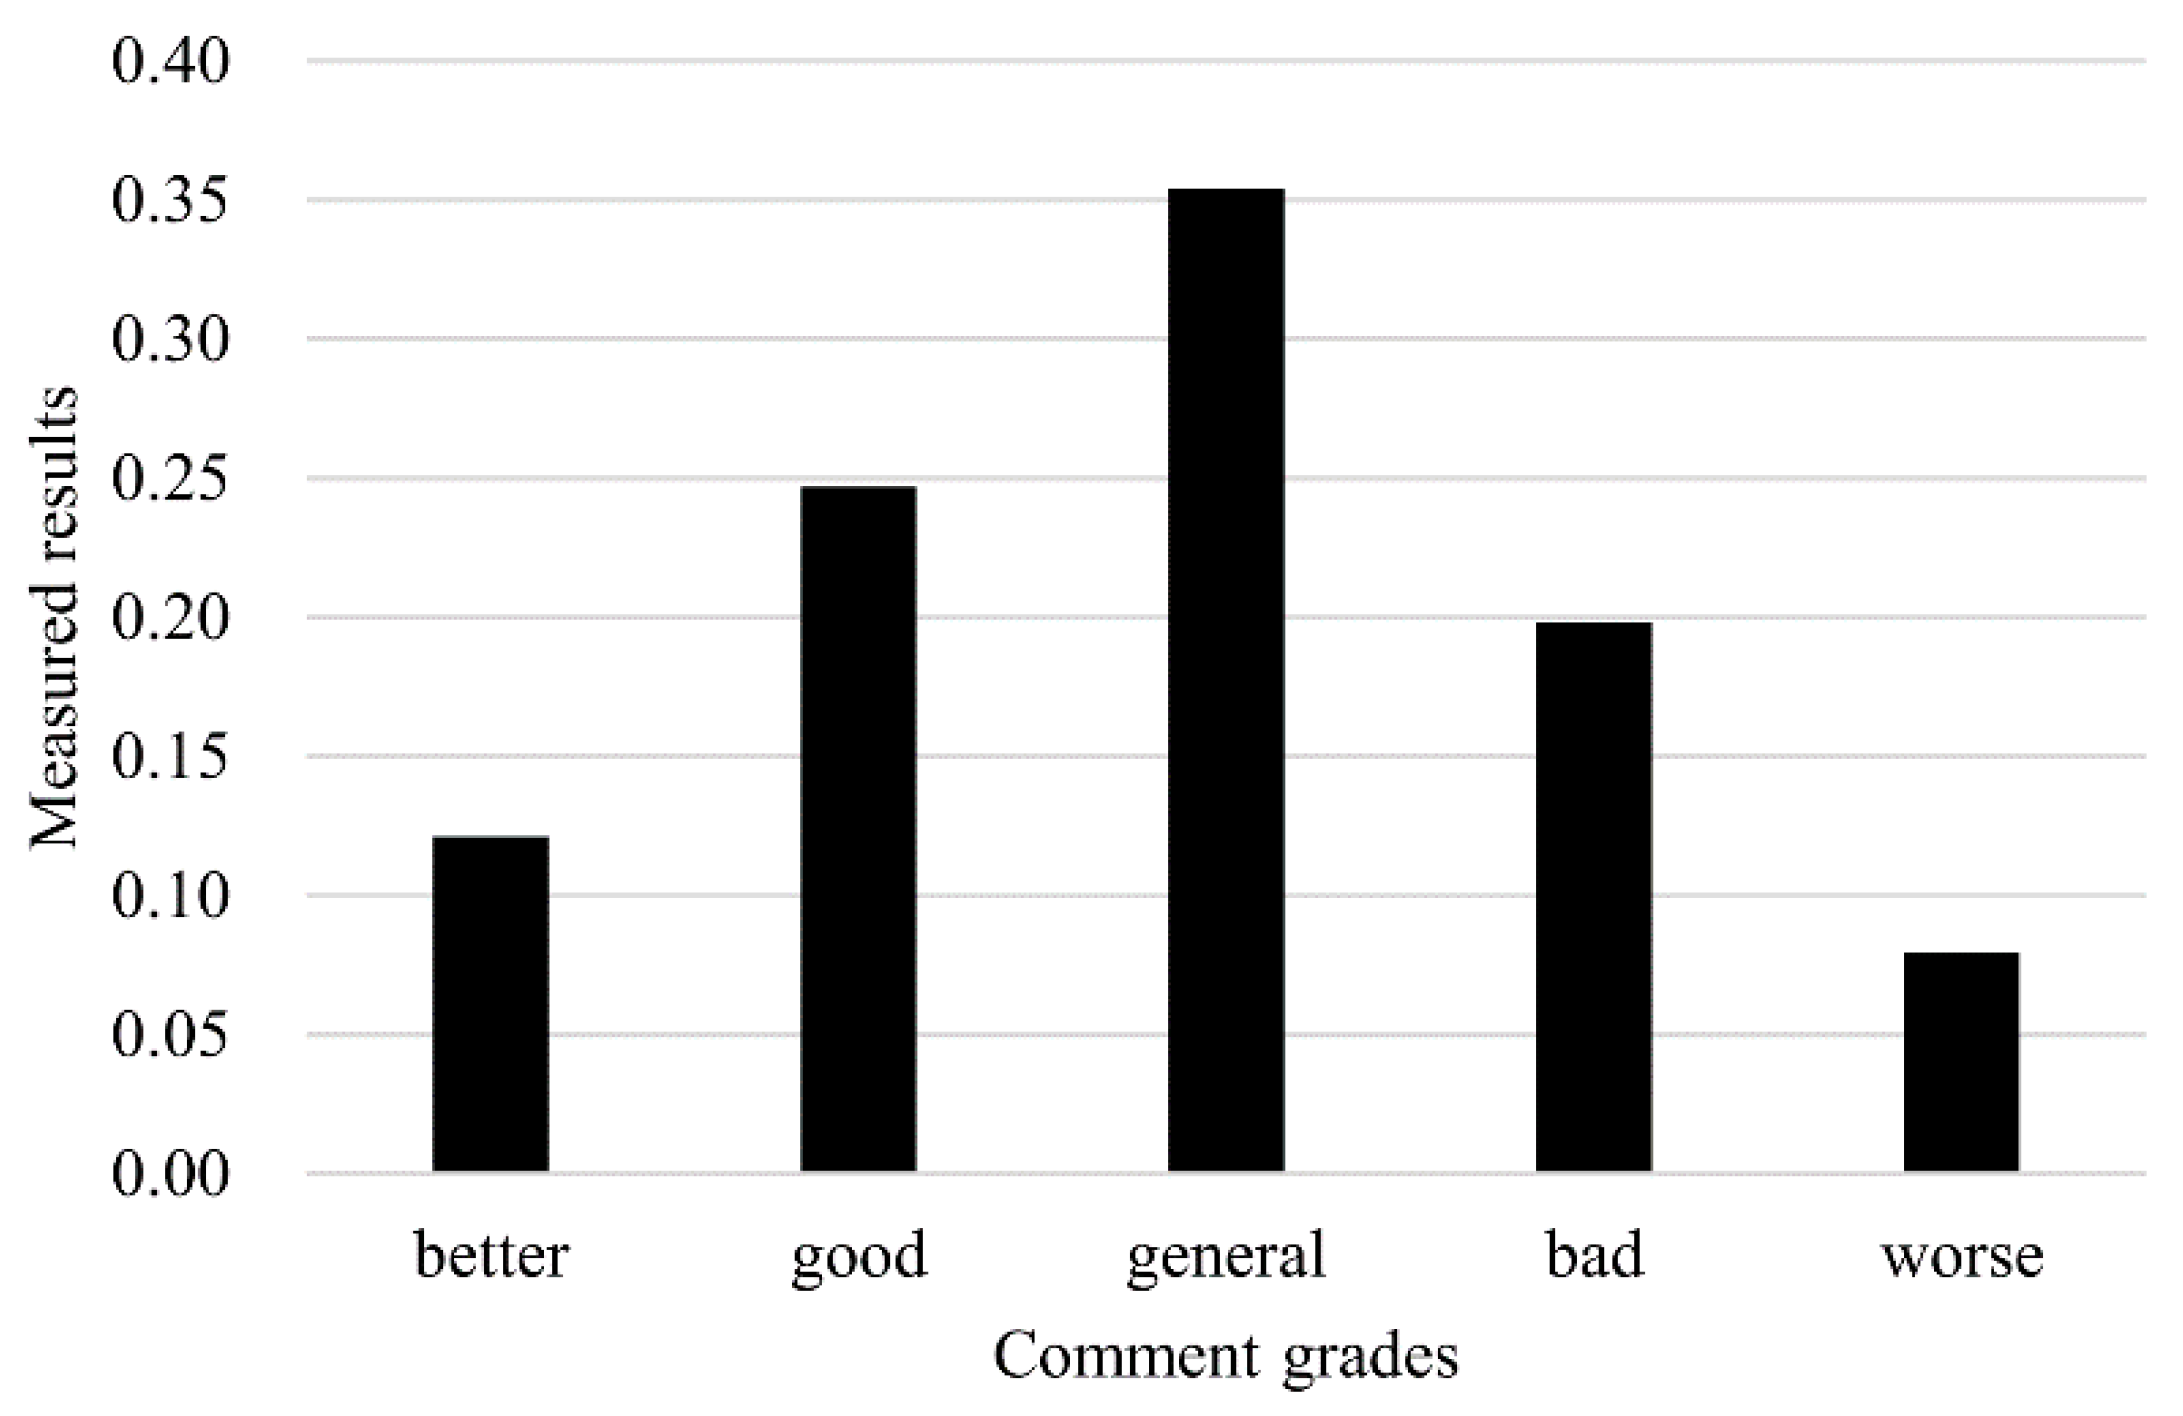
4.2. Evaluation Analysis

The calculation result of cabin comfort shown in Figure 3 is consistent with the result of the questionnaire survey in the flight.
Referring to what measures are necessary to be taken to improve the cabin comfort level, the measured results of factor layers could offer some suggestions that show the specific differences between the criteria.
From the perspective of cabin environment, the measured results affiliated with “general” and “good” are 0.3943 and 0.2247, respectively, accounting for 61.90% of total measured results, which means that the comfort level of the cabin environment basically satisfies the demands of passengers currently. If we want to take measures to improve environment comfort, the criteria such as cleanness (u19), light (u15), temperature (u11), noise (u17), etc. are require further attention according to their importance. With the development of technology, passengers attach great importance to higher requirements, and cabin cleanness is becoming the most important criterion. If the cabin environment is tidy and clean, passengers perceive stronger feelings of comfortable, which is in accordance with the research results of Ahmadpour, Lindgaard, Robert and Pownall [14]. Moreover, the lighting system in the cabin will be the next candidate in the improvement measures. Figure 2 and Table 2 show that the light has a higher value of (RC) and belongs to cause group, which could impact other criteria such as meals, cleanness, temperature, activities, etc. The current light system remains simple with illumination functions. If the light system could provide more functions, it could potentially improve passengers’ perception of comfort. For example, Finnair’s A350 cabin adopts simulated northern lights as their lighting mood during flight, consequently offering to their passangers a unique experience related to Finnish characteristics and improving their perception of comfort. In regard to temperature, more stability will provide improvements. Many passengers complained that when the airplane was taking off and landing, the cabin was always cold. Noise does not only result from the vibration but also passengers’ communication and children’s crying. The improvement in noise could start with these aspects.
In regard to the factor of cabin facilities and layout, the measured results affiliated with “general” and “bad” are 0.3453 and 0.3147, respectively, accounting for 66.00% of the total, which indicates that this factor does not meet the passengers’ demands. The evaluation result is not good enough. The ranking of important criteria is as follows: The seat pitch (u22), layout (u21), kitchen (u25), etc., which is also the priority of taking measures to improve cabin comfort. From Figure 2 and Table 2, seat pitch has a higher importance degree among the criteria and is a cause criterion, indicating that it is a critical factor impacting passenger comfort in the flight from Xi’an to Qingdao, which belongs to the Shandong Airlines SC CDG. The airplane type is a Boeing 737-300. The seat pitch is 31 inches, which is not the most comfortable distance when compared with the deluxe class. For a specific type aircraft and type of class, seat pitch is not easy to change considering the economical reason. The layout is the same as pitch. In the process of designing a new cabin, it would be considered in advance. The kitchen is relative to the supply of meals and drinks; passengers pay more attention to it. If the kitchen is tidy, neat and sanitary, passengers feel more comfortable.
The measured results of seat comfort affiliated with “general” and “good” are 0.3399 and 0.2478, respectively, accounting for 58.77% of the total measured results, which indicates that the current seat comfort of this type of airplane basically satisfies the passengers’ demands. According to the weight assignment, adjustability (u38), legroom (u39), the tray table (u313) and the backrest shape (u37) have greater importance on cabin comfort, respectively. In the future processes of cabin design, more attention should be paid to seat adjustability, especially the backrest adjustable angle, which is of great importance to the improvement of cabin comfort. Passengers spend most of the time in their seat. The duration of a flight is generally more than 2 h. If the backrest of the seat is always kept upright, passengers feel fatigued easily. It would improve spine stress if the backrest had an appropriate angle of inclination. However, in this economy class cabin, due to the legroom not being large enough, passengers are not allowed to adjust their backrest freely, as this would greatly impact the activities of rear row passengers. Therefore, the seat adjustability of this cabin could not provide a better sitting perception. The legroom also plays an important role in cabin comfort. Figure 2 shows that it is an effect criterion with the highest value of (RC), which is susceptive to other criteria. It is influenced by seat depth, the tray table, the backrest shape, etc. If we can improve these relative criteria, legroom would be improved correspondingly.
The measured results of service factor are 0.2101, 0.3576, 0.2602, 0.1338 and 0.0381, respectively. The sum of “better”, “good” and “general” accounts for 82.79% of total measured results, which means that passengers are satisfied with the services in this cabin. In view of saving resources, service is not the first priority to consider to improve cabin comfort.

5. Conclusions

Comfort evaluation of aircraft cabin systema plays an increasingly important role in the process of cabin design. As a complex system, comprehensive comfort evaluation of aircraft cabin systems from the holistic perspective is a complicated problem. Quantitative evaluation methods are needed to be considered to provide a direction for cabin design from the perspective of comfort. Therefore, a hybrid model is proposed to solve this problem. On the basis of a literature review, a comprehensive comfort evaluation criteria system is outlined, including four factors, namely, cabin environment, facilities and layout, seat comfort and service, and 41 criteria in total. The DEMATEL method is adopted to analyze the interrelations between criteria and calculate their corresponding weights according to their importance degree. A multi-level fuzzy comprehensive evaluation is conducted to obtain a quantitative result regarding an airline. Finally, the evaluating results could provide a direction to improve cabin comfort. The empirical study testified that this hybrid model combined with the DEMATEL method and fuzzy comprehensive evaluation was an effective method.
Although this method could display the interrelationship between criteria and provide suggestions to improve the passengers’ comfort, there are still some limitations. First, due to the large number of comfort evaluation criteria in the aircraft cabin system, the experts need to compare each criterion in pairs. This process is subjective and easy to make mistakes as it depends on the knowledge and ability of experts. Therefore, it is an important task to simplify the comfort evaluation criteria system in the future. In addition, although the number of experts has been increasing according to the statistical significance, the selection of experts should be improved in the future, and more experts with professional cabin design knowledge and comfort evaluation should be selected. Besides, the hybrid model proposed in this study only analyzed the evaluating results regarding the current cabin in a certain aircraft. It could not be used as a predicted model. In future research, more attention should be paid to establish an effective predict model to direct cabin design, which is of great importance to improve cabin comfort. Finally, this paper gives suggestions only on how to improve cabin comfort. More specific measures and data should be researched in a future study.

Author Contributions

J.L. was a major contributor of this manuscript. She presented the idea of this manuscript and analyzed the data. S.Y. checked the paper and gave valuable suggestions. J.C. performed the survey. All authors have read and agreed to the published version of the manuscript.

Funding

This work was supported by the Fundamental Research Funds for the Central Universities Study on Interior Design Optimization of Civil Aircraft and Evaluation Method of Passenger Cabin Comfort (No. 31020190504004) and 111 Project (No. B13044).

Conflicts of Interest

No conflict of interest exits in the submission of this manuscript, and the manuscript is approved by all authors for publication. We declare that we have no conflict of interest.

References

  1. Liu, J.; Yu, S.H.; Chu, J.J.; Gou, B.C. Identifying and analyzing critical factors impacting on passenger comfort employing a hybrid model. Hum. Factors Ergon. Manuf. Serv. Ind. 2017, 27, 289–305. [Google Scholar] [CrossRef]
  2. Brauer, K. Convenience, comfort and cost: The Boeing perspective on passenger satisfaction. In Proceedings of the Aircraft Interior EXPO’04, Hamburg, Germany, 30 March–1 April 2004. [Google Scholar]
  3. Richards, L.G.; Jacobson, I.D. Ride Quality Evaluation 1. Questionnaire Studies of Airline Passenger Comfort. Ergonomics 1975, 18, 129–150. [Google Scholar] [CrossRef] [Green Version]
  4. Friman, M.; Lattman, K.; Olsson, L.E. Public Transport Quality, Safety, and Perceived Accessibility. Sustainability 2020, 12, 3563. [Google Scholar] [CrossRef]
  5. De Looze, M.P.; Kuijt-Evers, L.F.; van Dieen, J. Sitting comfort and discomfort and the relationships with objective measures. Ergonomics 2003, 46, 985–997. [Google Scholar] [CrossRef] [PubMed]
  6. Richards, L.G.; Jacobson, I.D. Ride Quality Assessment III: Questionnaire Results of a Second Flight Programme. Ergonomics 1977, 20, 499–519. [Google Scholar] [CrossRef]
  7. Vink, P.; Brauer, K. Aircraft Interior Comfort and Design; CRC Press: Boca Raton, FL, USA, 2011; Volume 5. [Google Scholar]
  8. Šika, Z.; Valášek, M.; Vampola, T.; Füllekrug, U.; Klimmek, T. Dynamic Model of Aircraft Passenger Seats for Vibration Comfort Evaluation and Control. In Vibration Problems ICOVP 2011; Springer: Berlin/Heidelberg, Germany, 2011; pp. 217–223. [Google Scholar]
  9. Quehl, J. Comfort Studies on Aircraft Interior Sound and Vibration. Ph.D. Thesis, Universität Oldenburg, Oldenburg, Lower Saxony, Germany, 2001. [Google Scholar]
  10. Winzen, J.; Albers, F.; Marggraf-Micheel, C. The influence of coloured light in the aircraft cabin on passenger thermal comfort. Lighting Res. Technol. 2014, 46, 465–475. [Google Scholar] [CrossRef] [Green Version]
  11. Giaconia, C.; Orioli, A.; Di Gangi, A. Air quality and relative humidity in commercial aircrafts: An experimental investigation on short-haul domestic flights. Build. Environ. 2013, 67, 69–81. [Google Scholar] [CrossRef] [Green Version]
  12. Winzen, J.; Marggraf-Micheel, C. Climate preferences and expectations and their influence on comfort evaluations in an aircraft cabin. Build. Environ. 2013, 64, 146–151. [Google Scholar] [CrossRef]
  13. Bubb, R. Sitting comfort. In Proceedings of the IQPC (International Quality and Productivity Center) Aircraft Interior Innovation Conference, Hamburg, Germany, 11 November 2008. [Google Scholar]
  14. Ahmadpour, N.; Lindgaard, G.; Robert, J.M.; Pownall, B. The thematic structure of passenger comfort experience and its relationship to the context features in the aircraft cabin. Ergonomics 2014, 57, 801–815. [Google Scholar] [CrossRef]
  15. Vink, P.; Bazley, C.; Kamp, I.; Blok, M. Possibilities to improve the aircraft interior comfort experience. Appl. Ergon. 2012, 43, 354–359. [Google Scholar] [CrossRef]
  16. Richards, L.G.; Jacobson, I.D.; Kuhlthau, A.R. What the passenger contributes to passenger comfort. Appl. Ergon. 1978, 9, 137–142. [Google Scholar] [CrossRef]
  17. Kremser, F.; Guenzkofer, F.; Sedlmeier, C.; Sabbah, O.; Bengler, K. Aircraft seating comfort: The influence of seat pitch on passengers’ well-being. Work 2012, 41 (Suppl. 1), 4936–4942. [Google Scholar] [CrossRef] [PubMed] [Green Version]
  18. Rossi, N.; Greghi, F.; Menegon, L.; Souza, G. Activity analysis: Contributions to the innovation of projects for aircrafts cabins. Work 2012, 41, 5288–5295. [Google Scholar] [CrossRef] [PubMed] [Green Version]
  19. Tan, C.; Chen, W.; Rauterberg, G.W.M. Total Design of Active Neck Support System for Economy Class Aircraft Seat. In Advanced Materials Design and Mechanics Ii; Kida, K., Ed.; Trans Tech Publications Ltd.: Stafa-Zurich, Switzerland, 2013; Volume 372, pp. 657–660. [Google Scholar]
  20. Chen, C.-F. Investigating structural relationships between service quality, perceived value, satisfaction, and behavioral intentions for air passengers: Evidence from Taiwan. Transp. Res. Part A Policy Pract. 2008, 42, 709–717. [Google Scholar] [CrossRef]
  21. Vink, P.; Hallbeck, S. Editorial: Comfort and discomfort studies demonstrate the need for a new model. Appl. Ergon. 2012, 43, 271–276. [Google Scholar] [CrossRef]
  22. Antonsen, E.L.; Mulcahy, R.A.; Rubin, D.; Blue, R.S.; Canga, M.A.; Shah, R. Prototype development of a tradespace analysis tool for spaceflight medical resources. Aerosp. Med. Hum. Perform. 2018, 89, 108–114. [Google Scholar] [CrossRef]
  23. Berg, J.; Henriksson, M.; Ihlstrom, J. Comfort First! Vehicle-Sharing Systems in Urban Residential Areas: The Importance for Everyday Mobility and Reduction of Car Use among Pilot Users. Sustainability 2019, 11, 2521. [Google Scholar] [CrossRef] [Green Version]
  24. Ma, H.R.; Chen, D.W.; Yin, J.T. Riding Comfort Evaluation Based on Longitudinal Acceleration for Urban Rail Transit-Mathematical Models and Experiments in Beijing Subway. Sustainability 2020, 12, 4541. [Google Scholar] [CrossRef]
  25. Voisin, A.; Levrat, E. Evaluation of a sensory measurement fuzzy system for car seat comfort. In Proceedings of the 10th IEEE International Conference on Fuzzy Systems, Melbourne, Victoria, Australia, 2–5 December 2001; pp. 805–808. [Google Scholar]
  26. Grabisch, M.; Duchêne, J.; Lino, F.; Perny, P. Subjective evaluation of discomfort in sitting positions. Fuzzy Optim. Decis. Mak. 2002, 1, 287–312. [Google Scholar] [CrossRef]
  27. Fontela, E.; Gabus, A. The DEMATEL Observer; Battelle Institute, Geneva Research Center: Geneva, Switzerland, 1976. [Google Scholar]
  28. Hosseini, M.B.; Tarokh, M.J. Type-2 fuzzy set extension of DEMATEL method combined with perceptual computing for decision making. J. Ind. Eng. Int. 2013, 9, 10. [Google Scholar] [CrossRef] [Green Version]
  29. Zhou, Q.; Huang, W.; Zhang, Y. Identifying critical success factors in emergency management using a fuzzy DEMATEL method. Saf. Sci. 2011, 49, 243–252. [Google Scholar] [CrossRef]
  30. Guo, L.; Gao, J.; Yang, J.; Kang, J. Criticality evaluation of petrochemical equipment based on fuzzy comprehensive evaluation and a BP neural network. J. Loss Prev. Process. Ind. 2009, 22, 469–476. [Google Scholar] [CrossRef]
  31. Han, Y.F.; Zeng, W.D.; Sun, Y.; Zhao, Y.Q. Development of a database system for operational use in the selection of titanium alloys. Int. J. Miner. Metall. Mater. 2011, 18, 444. [Google Scholar] [CrossRef]
  32. Turon, K.; Kubik, A. Economic Aspects of Driving Various Types of Vehicles in Intelligent Urban Transport Systems, Including Car-Sharing Services and Autonomous Vehicles. Appl. Sci. 2020, 10, 5580. [Google Scholar] [CrossRef]
Figure 1. The hybrid model procedures.
Sustainability 12 08503 g001
Figure 2. The causal diagram.
Sustainability 12 08503 g002
Figure 3. Measured results of comfort in the aircraft cabin system.
Sustainability 12 08503 g003
Table 1. Passenger comfort evaluation criteria system.
Target LayerFactor LayerCriteria Layer
Comfort evaluation criteria systemEnvironment U1Temperature u11
Humidity u12
Pressure u13
Air quality u14
Light u15
Vibration u16
Noise u17
Color u18
Cleanness u19
Cabin facilities and layout U2Seat layout u21
Pitch u22
Luggage room u23
Washroom u24
Kitchen u25
Porthole u26
Aisle u27
Celling u28
Safety instructions u29
Seat U3Height u31
Width u32
Depth u33
Material u34
Backrest height u35
Backrest width u36
Backrest shape u37
Adjustability u38
Legroom u39
Lumbar support u310
Headrest u311
Armrest u312
Tray tables u313
Service U4Books and magazines u41
Music u42
Videos u43
Button layout u44
Meals u45
Drinks u46
Crew’s attitude u47
Crew´s appearance u48
Response time u49
Information broadcast u410
Table 2. The weights of factors and criteria.
FactorsWeights of FactorsCriteriaWeights of CriteriaInfluencing Degree RInfluenced Degree CCentral Degree ( R + C )Relation Degree ( RC )
U10.2304u110.02650.05420.0860.1402−0.0318
u120.02720.09610.04210.13820.054
u130.00750.00510.02530.0304−0.0202
u140.02150.00290.10730.1102−0.1044
u150.02980.1260.03480.16080.0912
u160.02370.07630.0330.10930.0433
u170.02400.05760.08180.1394−0.0242
u180.02330.0430.10190.1449−0.0589
u190.04870.08210.16170.2438−0.0796
U20.2192u210.03590.0980.09130.18930.0067
u220.04290.12720.09710.22430.0301
u230.01980.04750.04710.09460.0004
u240.02110.07340.05010.12350.0233
u250.04020.1120.09520.20720.0168
u260.01230.05650.01430.07080.0422
u270.02750.08470.0520.13670.0327
u280.01110.04480.01290.05770.0319
u290.01140.04390.02010.0640.0238
U30.3498u310.01790.07510.02090.0960.0542
u320.02120.09210.01110.10320.081
u330.02780.08530.05650.14180.0288
u340.00830.02970.00440.03410.0253
u350.03990.13110.06180.19290.0693
u360.02450.09660.04630.14290.0503
u370.03300.15710.02980.18690.1273
u380.05020.10620.14530.2515−0.0391
u390.03850.0150.18670.2017−0.1717
u3100.01980.04480.0750.1198−0.0302
u3110.01080.01390.04950.0634−0.0356
u3120.02030.05370.04810.10180.0056
u3130.04760.13170.09860.23030.0331
U40.2008u410.0480.00260.02060.0232−0.018
u420.01160.01740.03740.0548−0.02
u430.02650.01920.10740.1266−0.0882
u440.01670.04390.03530.07920.0086
u450.04690.06080.17790.2387−0.1171
u460.02640.03540.10860.144−0.0732
u470.01540.04790.03590.08380.012
u480.01350.05790.01340.07130.0445
u490.02200.06240.04120.10360.0212
u4100.01780.0210.05490.0759−0.0339
Table 3. Evaluating sets of criteria in the cabin environment layer.
U1Comment Grades
BetterGoodGeneralBadWorse
u110.30.40.20.10
u120.10.10.50.20.1
u1300.10.40.40.1
u1400.10.50.20.2
u150.10.10.40.30.1
u1600.10.40.40.1
u170.50.30.200
u180.20.20.600
u190.10.40.30.10.1
Publisher’s Note: MDPI stays neutral with regard to jurisdictional claims in published maps and institutional affiliations.

