Article

Successful Implementation of Climate-Friendly, Nutritious, and Acceptable School Meals in Practice: The OPTIMAT Intervention Study

by
Liselotte Schäfer Elinder
1,2,*,
Patricia Eustachio Colombo
1,
Emma Patterson
1,3,
Alexandr Parlesak
4 and
Anna Karin Lindroos
3,5
1
Department of Global Public Health, Karolinska Institutet, Solnavaegen 1E, 113 65 Stockholm, Sweden
2
Department of Health-Related Behaviours, Centre for Epidemiology and Social Medicine, Region Stockholm, Solnavaegen 1E, 113 65 Stockholm, Sweden
3
Department of Risk and Benefit Assessment, The Swedish Food Agency, Box 622, SE-75126 Uppsala, Sweden
4
Global Nutrition and Health, University College Copenhagen, Sigurdsgade 26, 2200 Copenhagen, Denmark
5
Department of Internal Medicine and Clinical Nutrition, Institute of Medicine, Sahlgrenska Academy, University of Gothenburg, PO Box 428, Gothenburg University, 405 30 Gothenburg, Sweden
*
Author to whom correspondence should be addressed.
Sustainability 2020, 12(20), 8475; https://doi.org/10.3390/su12208475
Submission received: 1 September 2020 / Revised: 5 October 2020 / Accepted: 11 October 2020 / Published: 14 October 2020
(This article belongs to the Special Issue Sustainability on Environmental Health and Well-Being)

Abstract

:
Introducing children to sustainable and healthy school meals can promote a long-term dietary shift to lower climate impact and improve population health. The aim of the OPTIMAT study was to optimize meals for minimum deviation from the current food supply while reducing greenhouse gases and ensuring nutritional adequacy without increasing cost. Optimized menus were tested in four primary schools in Sweden and effects on daily food consumption and waste evaluated. Pupils received their usual menu plan for three weeks and then the isocaloric optimized menu plan for another three weeks. Nutritional recommendations for a school lunch and a maximum of 500 g of carbon dioxide equivalents per meal (CO2 eq/meal) were applied as constraints during linear programming. Pulses, cereals, meat, and eggs increased, while fats and oils, dairy, sauces, and seasonings decreased. The amount of ruminant meat was reduced in favor of other meat products. The new menu was 28% lower in greenhouse gas emissions and slightly less costly than the original. No significant changes in mean food consumption or plate waste were found in interrupted time series analysis between the two periods. This pragmatic approach for combining linear optimization with meal planning could accelerate sustainable development of the meal sector in Sweden and abroad.

1. Introduction

Contemporary diets, being rich in animal products and low in fruits and vegetables, are among the leading causes of greenhouse gas emissions (GHGEs) and the global burden of obesity and chronic diseases [1,2]. Hence, a dietary shift towards more plant-based foods holds substantial potential for considerable gains in both public health and environmental sustainability.
School meals have been identified as an underutilized opportunity to deal with health and sustainability as they can reach all children, and make up a considerable proportion of children’s dietary intake over a long and critical period of growth [3]. Introducing children to environmentally sustainable and healthy school meals from an early age, thus, provides a unique chance to promote dietary change and improve children’s knowledge of sustainable development and healthy diets, which may persist throughout life [3].
In Sweden, roughly 196 million meals, at a cost of around 640 million euros (EUR), are served in Swedish primary schools (years 0–9) every year [4]. Lunches are typically self-served, hot dishes including a salad buffet, bread, spread, and milk or water. According to Swedish law, these lunches should cover 30% of children’s dietary needs [5]. A recent study of adolescents’ school meals showed that school lunches contribute substantially to the nutritional quality of pupils’ diets, providing on average almost half of total vegetable intake and two-thirds of fish intake [6]. However, the consumption of meat during school lunches is, accumulated over a week, also contributing to intakes exceeding the Swedish weekly population target for red and processed meat [7]. This is problematic from both a health and environmental sustainability perspective [8].
In general, Swedish school meals are of high quality [9] and a powerful way to facilitate more equal food intake among different groups in society [10]. However, our previous studies show that there is room for improvement when it comes to certain nutrients, how the school meal is integrated with teaching, and how schools deal with issues of environmental impact [9]. Today, many schools and municipalities in Sweden try to reduce the environmental impact, e.g., serving more vegetarian meals or organic foods, or even calculating associated emissions of greenhouse gases. However, it is not always clear what aspect of environmental impact is being reduced, and the process is labor-intensive, requiring many iterations, as it is difficult to simultaneously balance requirements regarding nutritional adequacy, cost, and cultural acceptability (potential food waste).
Linear optimization is a mathematical method for finding the best possible solution when trying to accommodate several different, occasionally competing, demands [11]. It constitutes a systematic approach whereby environmental and nutritional requirements as well as acceptability and cost can be taken into consideration simultaneously [12]. Optimization has been used to model diets that are nutritionally adequate, cost-effective, and more climate friendly [12,13,14,15,16,17,18]. It has also been used to mathematically design nutritious and environmentally sustainable school meals [19,20,21]. Our research group has developed and tested a pragmatic approach for combining linear optimization with planning and serving of a new school lunch menu [22]. In this first-ever intervention, no undesirable effects on food waste or consumption were observed. However, the study was performed in only one Swedish municipality, limiting its generalizability. The present study constitutes the second intervention trial using this approach, this time in a municipality known for in its progressive climate work with public meals for several years. We, thus, aimed to introduce a GHGE-reduced, nutritionally adequate, and affordable lunch menu plan optimized for minimum deviation from the baseline food supply. This was done in order to maximize acceptability, and to evaluate the new menu’s impact on food waste and consumption in a different municipality. Our hypothesis was that school meals could be optimized to become more climate friendly and nutritious, without negatively affecting the amount of food consumed and wasted, as a proxy for acceptance, and without increasing the cost.

2. Materials and Methods

2.1. Study Design and Theory

The study employed a pre-post design using interrupted time series (ITS) analysis to investigate the effect of introducing an optimized lunch menu on daily food waste and consumption in schools [22]. Pupils in four primary schools followed their usual (baseline) menu plan during a period of four weeks and after a one-week mid-term break, the optimized four-week menu plan was served daily during the intervention period.
The theoretical basis for the intervention is Social Cognitive Theory (SCT), stating that behavior is determined by reciprocal interaction between personal factors and the social and physical environment [23]. In this project, we mainly intervened in the physical environment of the children (the available menu). In addition to the information sent home to parents, brief information material was placed in the school canteen and a poster was displayed during the trial. No other intervention activities were performed compared to usual practice.

2.2. Recruitment of Schools

During the fall of 2019, a meeting was held with the meal services administration (including management, administrators, and meal planner) in the municipality of Uppsala, Sweden. Uppsala city has about 170,000 inhabitants. School chefs from four primary schools (up to grade 9) with 360 to 660 pupils were also present at the meeting. These schools had been identified by the municipality’s meal manager as having the highest measured climate impact as associated with their school meals. Three of the four schools were located in rural areas about 25 km from Uppsala city center, while one school was located in the outskirts of the city. The research team presented the project’s idea of implementing more climate-friendly lunches in schools and findings from the previous intervention [22] in three large schools in a different municipality. We drew up written agreements with all four participating schools concerning tasks to be performed by the school and by the research team, respectively, and these were signed by the headmasters and the principal investigator (L.S.E.). Schools were asked to inform parents about the project via their usual newsletter. They were also asked to place the information leaflet on each table in the school canteen and to set up a poster provided by the research team during the trial. These materials contained easy-to-read information about the project’s outline and its aim to make school lunches more climate friendly. The schools did not receive any reimbursements for their participation in the study.

2.3. Preparation of the Database and Optimization

A four-week menu plan (including 2–3 dishes/day over a period of 20 weekdays) which had previously been served at the recruited schools to the research team was provided by the municipality’s meal planner. This menu was planned to meet 30% of the nutritional needs of a reference pupil aged 10–12 years over the four-week period [5]. A food list containing all foods and drinks (excluding spices) needed to produce the meals and the salad buffet was also provided. The list indicated the amount of each food item in kilograms (kg) of raw food used as well as the total cost of each item. For each food, an average price was calculated by dividing the total weight by the total cost. In total, 181 food items were part of this list (in Swedish; can be obtained from the authors). These items were consequently linked to the Swedish Food Agency’s food database [24], which provides the nutritional composition and also includes information on the edible proportions of foods. Each food was assigned a climate footprint, expressed as kg carbon dioxide equivalents per kg (kg CO2 eq/kg) of food item, by linking to the Research Institutes of Sweden’s Climate database. The database contains more than 750 food items representing Swedish food consumption [25]. It builds on results from life cycle analyses [26,27] and provides CO2 eq values from farm to final product at the food factory gate. This database is not open to the public and access was paid for by the research team. As described previously [19,22,28], all calculations of nutritional adequacy were based on the nutrient content of the edible proportions of prepared (cooked, boiled, oven baked, etc.) foods, while the calculations for cost and CO2 eq were done on the amount of raw food.

2.4. Linear Programming

The baseline food list was optimized following a linear programming (LP) strategy described in detail elsewhere [19,22] and was implemented with the COIN-OR Branch and Cut Solver (CBC) algorithm, part of the Excel® 2016 software add-in OpenSolver, V. 2.9.0 [29]. Briefly, LP aims to either minimize or maximize a linear objective function that is subjected to a set of linear constraints having to be met simultaneously. As described previously [19,22], we chose to minimize the total relative deviation (TRD) from the baseline food supply across all 181 food items in an attempt to make the new menus as acceptable as possible. All applied nutritional and other food constraints are shown in Table 1. The baseline menu’s average energy content (672 kilocalories per pupil and lunch) was held constant during the optimization (baseline menu plan available from authors in Swedish). Furthermore, nutritional recommendations for a school lunch [5] and a maximum limit of 500 g of CO2 eq/meal were applied as constraints over a 4-week period. The CO2 eq constraint was set to match the World Wildlife Fund’s (WWF’s) target for school lunches [30] (max 500 g CO2 eq/lunch) which has been derived from data in the IPCC (Intergovernmental Panel on Climate Change) report [1]. The TRD was divided by the total number of food items included in the model to estimate the average relative deviation (ARD) of all foods. This value is a proxy for the optimized model’s overall similarity to the baseline menu plan. As found in previous investigations [22], allowing unrestricted alteration in the supply of single foods resulted in unacceptably high amounts of food items that were both nutrient-rich and climate-friendly, such as potatoes. Therefore, we decided to constrain the relative change in food item weight to stay between −75% and +100% compared to baseline levels in order to facilitate meal planning. Milk (not used for cooking) and crisp bread are traditionally available for consumption ad libitum at lunch. These items were constrained to equal 50% of their initial amount upon request from the municipality’s meal planner, who estimated that pupils did not consume more than half of the provided amount of these items anyway. Potatoes were also constrained to increase by a maximum of 50% since we knew from previous experience that a greater increase was judged to be practically unfeasible when planning the meals.
Before initiating the menu development, the optimized food supply was presented to the meal planner who was given the chance to make modifications if deemed necessary for practical reasons. In this case, the meal planner requested that three foods (each reduced by 75% from baseline amounts by the algorithm) be excluded entirely. These were portion-sized meat products (frozen meat patties and frozen hamburgers) and minced meat. The meal planner judged that the amounts of these food items were too low to be feasible in the new menu plan. Furthermore, the baseline weight of frozen meatballs (one of the most popular foods amongst pupils) was requested to be kept constant. A second linear optimization of the baseline food list was performed implementing these additional modifications to the model.
Foods were grouped into 14 categories to provide an illustration of the overall changes resulting from the optimization. The categorization built on the grouping of foods in the Climate database [25]: beverages (without milk), fats and oils, seafood, fruits and berries, vegetables, pulses, potatoes and roots, meat, cereals, dairy, nuts and seeds, seasoning and sauces, sugar and sweets, and eggs. Materials not published in this paper can be provided by the authors upon reasonable request.

2.5. Meal Planning and Implementation

The municipality’s meal planner developed the new menu plan using the food list resulting from the final optimization (optimized menu plan available from authors in Swedish). The new menu plan was developed following the baseline menu plan as closely as possible in terms of type/composition and naming as this was thought to increase its acceptability. During this process, the meal planner requested and was granted to do an additional change to the optimized food list, which led to a reduction in the amount of blood pudding (a smooth-textured sausage-like product made with pork blood) to baseline levels and instead increasing the amount of chicken sausage by 100% as this was thought to be more acceptable. The change resulted in negligible changes to the main parameters (i.e., GHGEs, nutritional adequacy, and cost) of the optimized food supply. The new menu plan was discussed with and approved by the school chefs.

2.6. Outcomes

Plate waste per pupil and consumption per pupil were the primary outcomes. These parameters were considered to reflect the pupils’ acceptance of the new menu. Prior to the intervention, detailed instructions on how to perform the measurements of food waste and consumption were provided to the chefs by the research team. The kitchen staff, instructed and supervised by the chefs at each school, executed these measurements based on a template with written instructions for measuring food waste and school lunch consumption [32]. Four fractions were weighed using school kitchen scales during the baseline and intervention periods: all food prepared in the kitchen (prepared food (kg)); the amount of prepared food that was not consumed and had to be discarded as it was unsuitable for re-use (serving waste (kg)); the amount that could be re-used (leftover food (kg)); and the amount of leftover that was discarded by the pupils into a bin (plate waste (kg)). The number of plates used by the pupils in the school restaurant was also recorded daily. The chefs reported all waste measurements on a weekly basis to the research team and were also asked to record details of any additional adjustments made to the new menu plan. These measurements were taken for the calculations of:
(1)
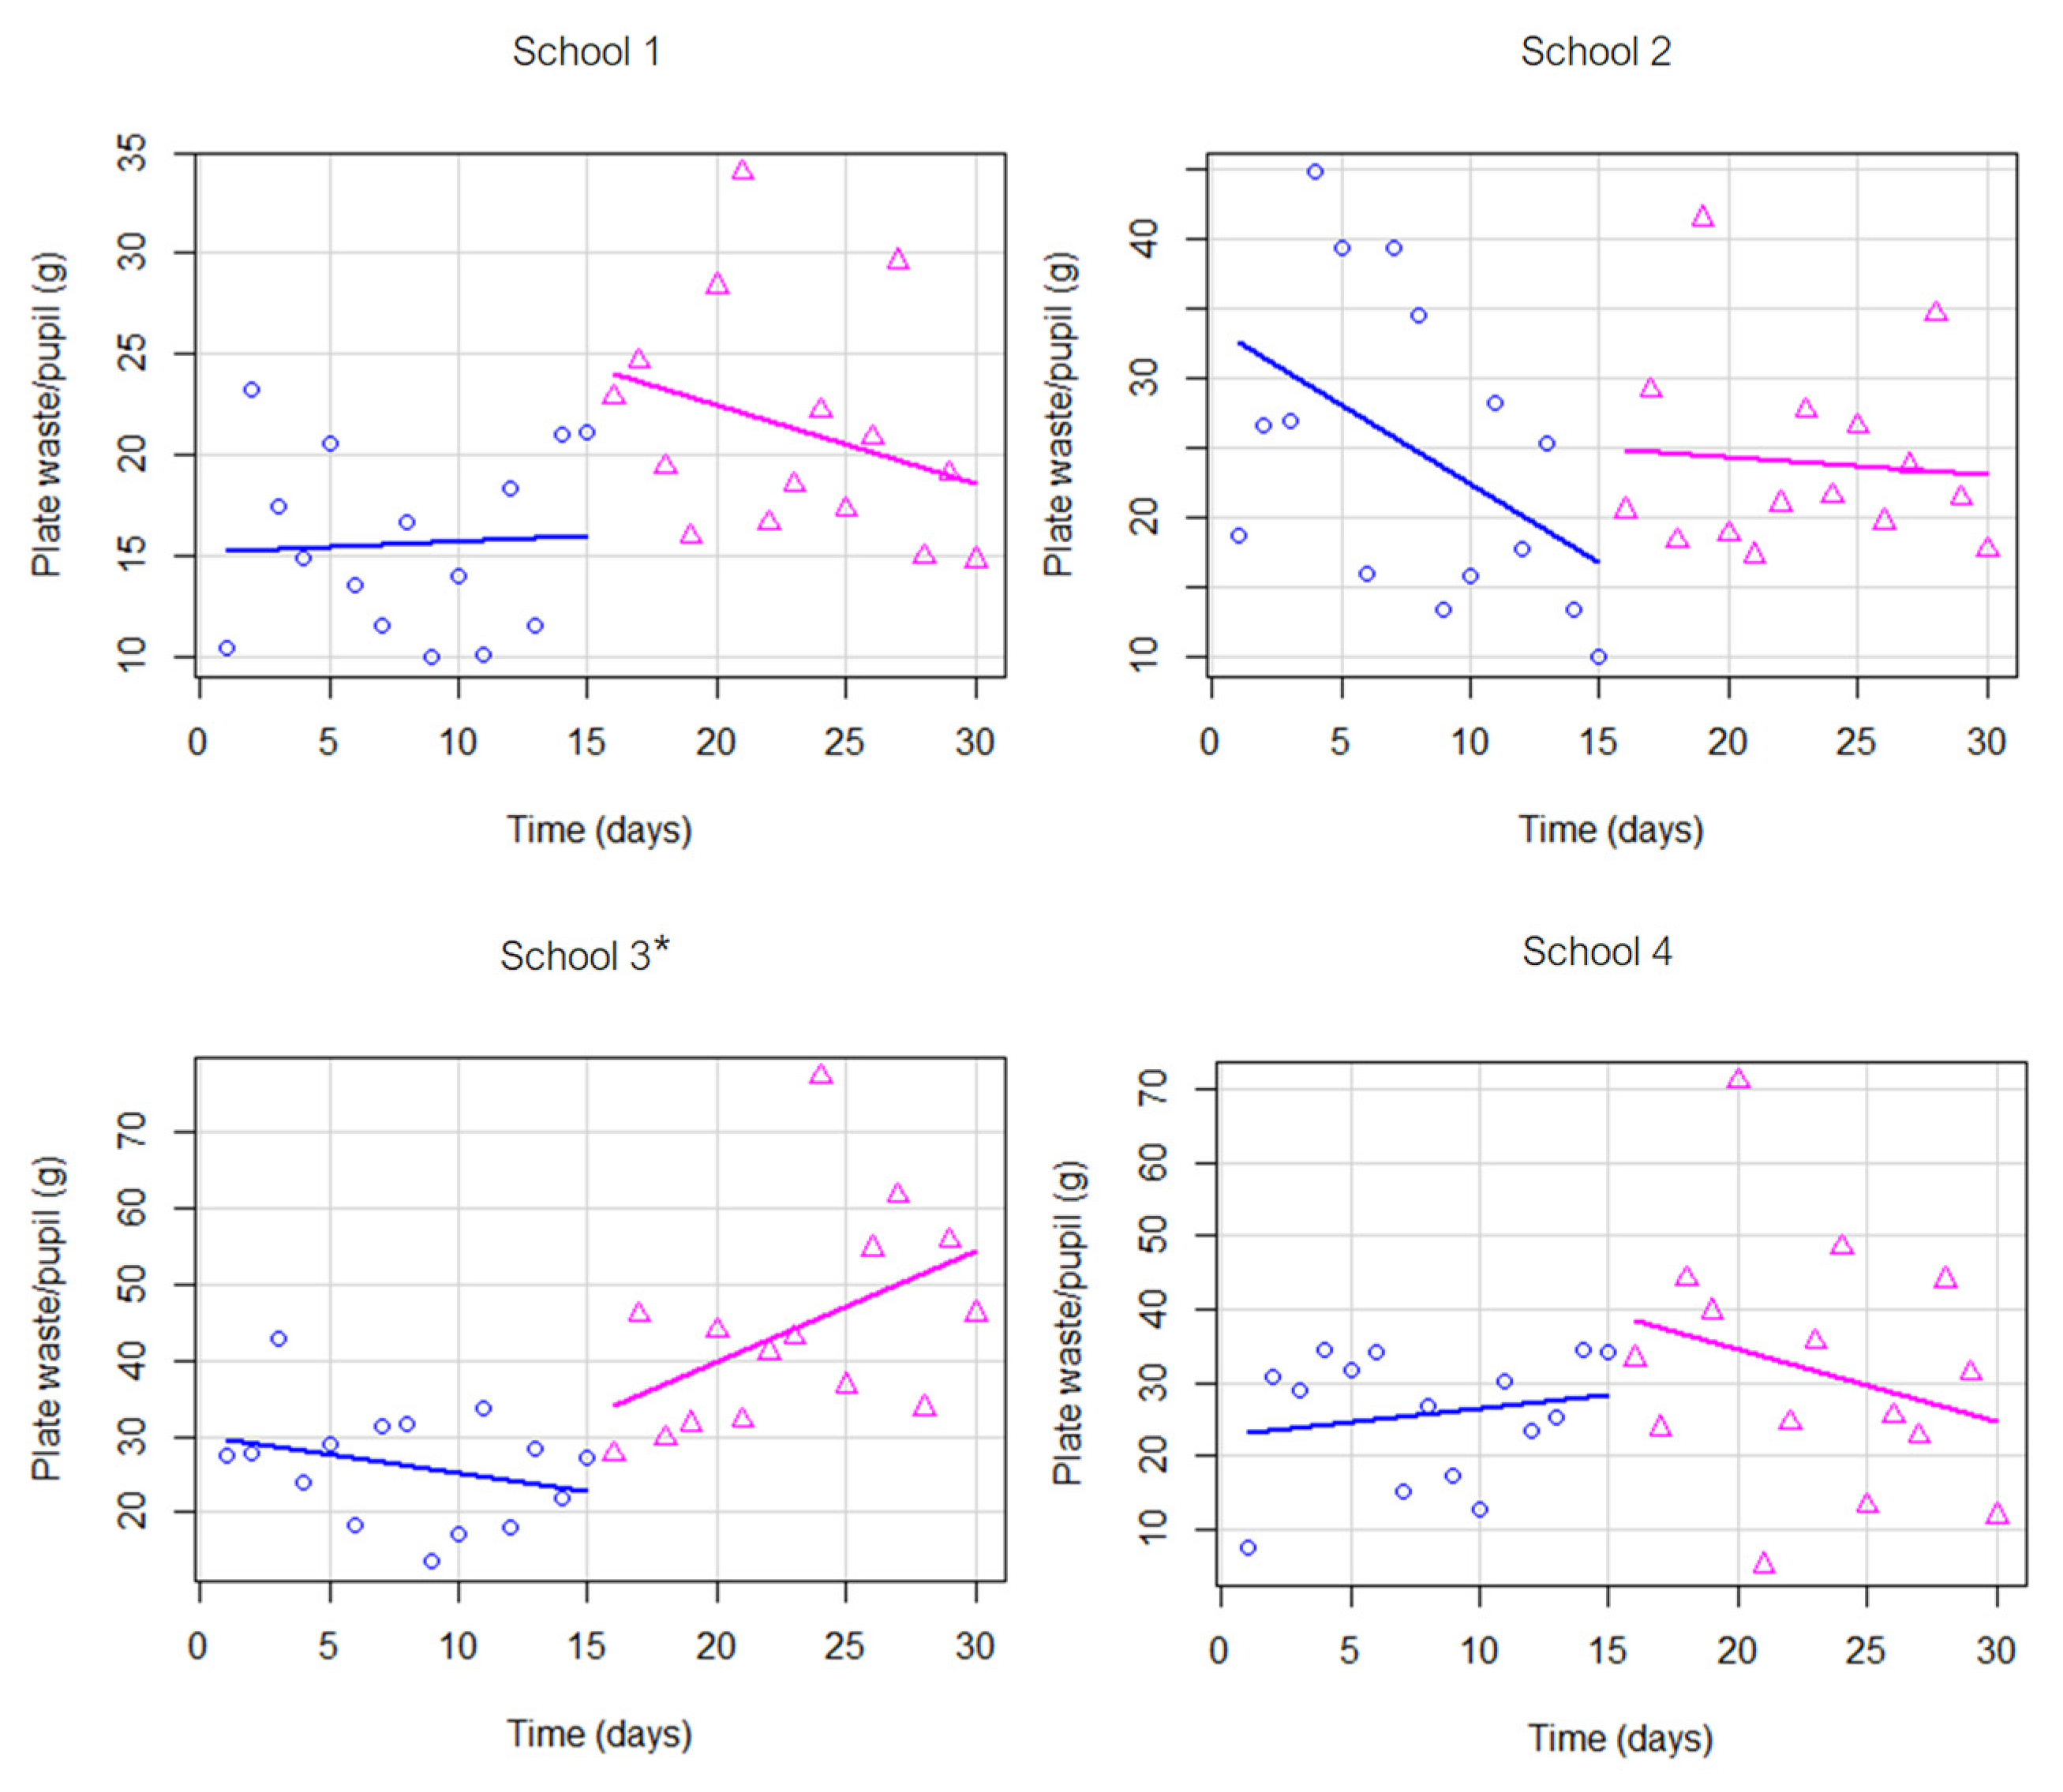
Plate waste per pupil (g), calculated per day by dividing the total plate waste by the total daily number of recorded plates.
(2)
Food consumption per pupil (g), calculated by subtracting the sum of the total serving waste, total plate waste, and total leftover food from the total amount of prepared food and dividing that by the recorded total daily number of plates.
As a result of the accelerating COVID-19 pandemic in March 2020, school attendance rates dropped (even though primary schools were not closed in Sweden) during the last week of the intervention, and, in several cases, waste measurements were not undertaken due to staff shortage. These circumstances resulted in a decision to only compare the three weeks preceding the one-week mid-term break to the three weeks following the break, thus, excluding the first baseline week and the last intervention week from the calculations.

2.7. Statistical Analyses

Interrupted time series (ITS) [33] analysis was used for comparing daily plate waste per pupil (g) and daily consumption per pupil (g) between the two time sequences (baseline and intervention). We performed a level and slope change analysis [33]. The slope represents the trend of either increasing or decreasing amounts of food consumption or waste over the baseline and intervention periods. We thereby included a numerical variable representing the time elapsed (to adjust for the baseline trend), a categorical variable representing the period (to reveal potential mean differences between baseline and intervention periods), and, consequently, an interaction term between time and the period in the regression models (to reveal differences in slopes between the two time periods). Assumptions of normality and homoscedasticity, as well as absence of autocorrelation and partial autocorrelation, were assessed through normal probability plots, residual plotting, and the Durbin-Watson test (25). All tests were two-sided and p values of <0.05 were assumed to indicate statistical significance. All statistical analyses were conducted in the software R (version 3.6.1) [34].

3. Results

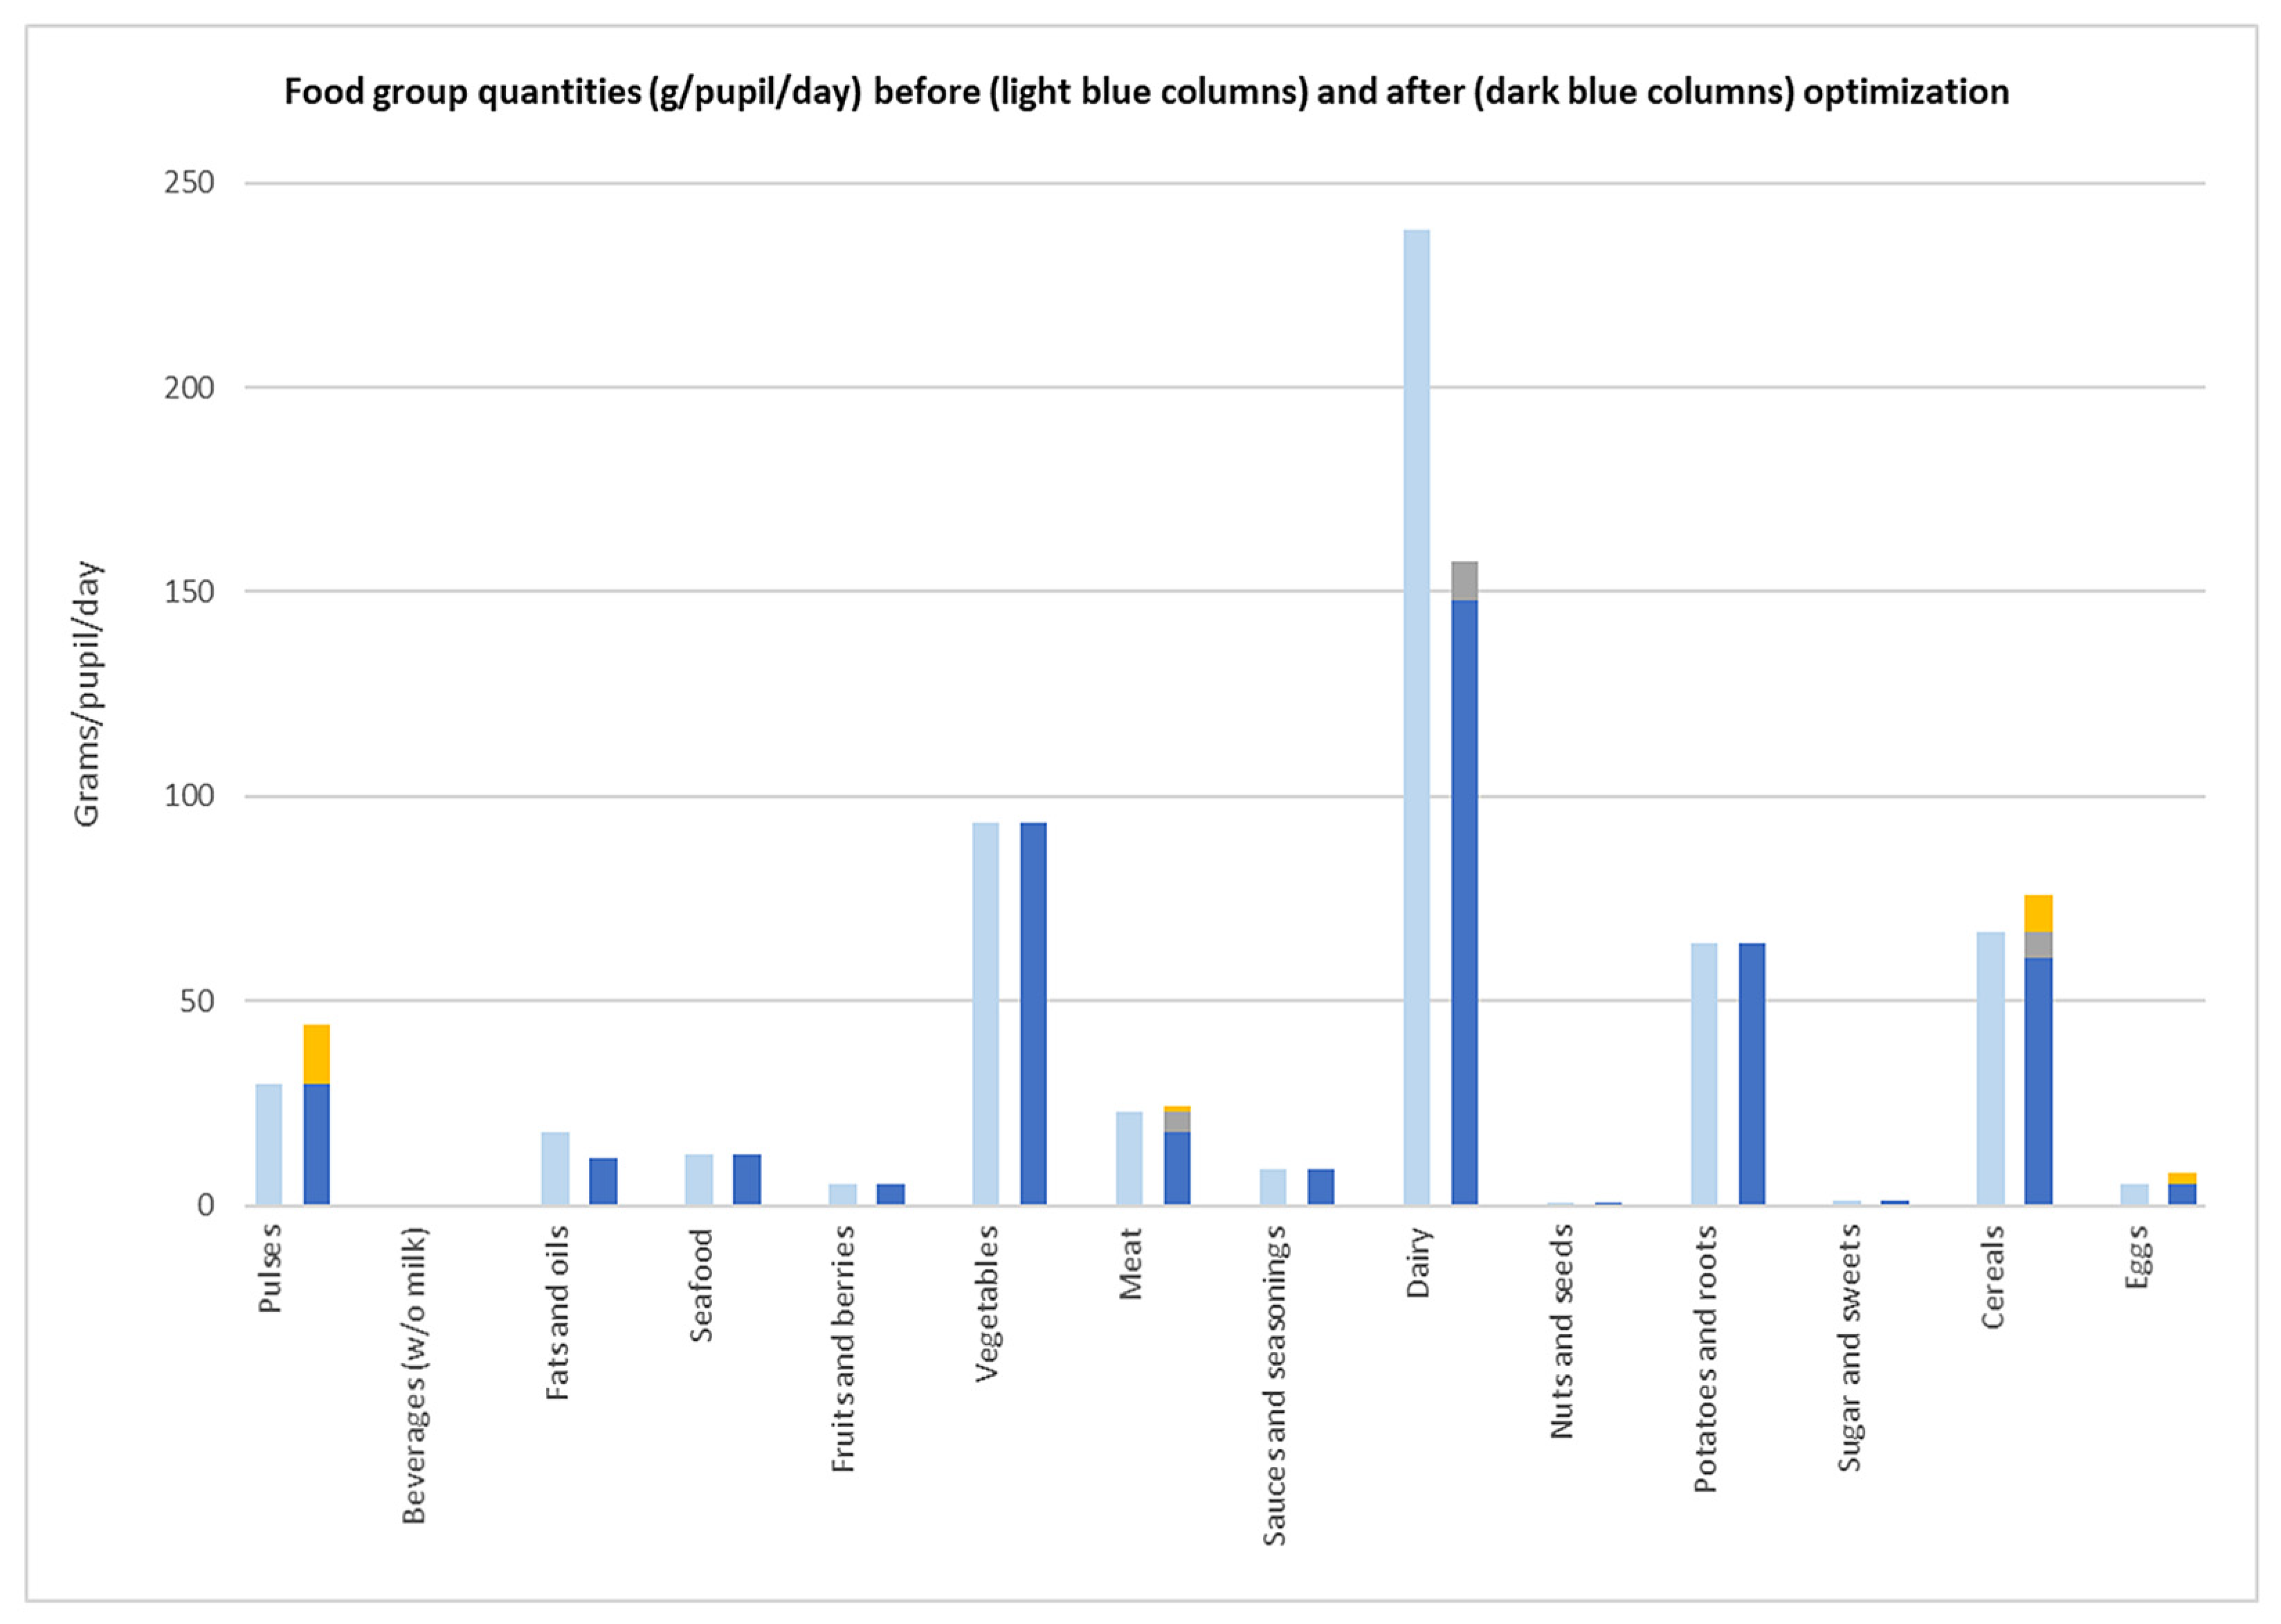
Linear Optimization and Menu Planning

Table 1 shows the GHGEs, cost, and nutritional content of an average meal from the baseline food list, the optimized food list, and the final menu plan. The baseline food list contained 693 g CO2 eq and cost 11.5 SEK (approx. 1.05 euros) on average per meal. It met all dietary reference values used for planning school meals. The linear optimization provided an optimized food list containing 499 g CO2 eq on average (28% less than baseline emissions) that also met all nutritional requirements and cost 3.1% less than the baseline food list. The ARD was 13.7% from baseline. After the modifications made by the meal planner (reducing the amount of blood pudding to baseline levels and instead increasing the amount of chicken sausage by 100%) reduced the energy content of an average lunch by 5 kcal compared to the optimized list (Table 1). The final menu plan contained 497 g CO2 eq and the cost was 3.2% lower than at baseline. In both the baseline and the new menu plan, 30 of the 49 served dishes were entirely vegetarian (i.e., did not contain any red meat/fish/poultry).
Figure 1 displays the food group quantities in the baseline food list and in the optimized (isocaloric) food list. Amounts of seven of the 14 food groups were not changed by the linear programming algorithm (beverages (without milk), seafood, fruits and berries, vegetables, nuts and seeds, potatoes and roots, and sugars and sweets). Four of the food groups increased in weight per pupil per day (pulses, +14.2 g; cereals, +9.1 g; meat, +1.0 g; eggs, +2.9 g), while three food groups were reduced in weight (fats and oils, −6.4 g; dairy, −80.1 g; seasoning and sauces, −0.2 g). In some food groups, intra-food group substitutions occurred, meaning that some food items in each food group were reduced by the optimization while others were increased so much that each food groups’ total quantities were larger than their baseline values. For example, while the meat category actually increased slightly overall, red meat was reduced by 5.1 g, while the amounts of poultry meat and blood pudding increased by 6.1 g in total.
The primary outcomes of this study were the average daily food consumption per pupil and the average daily plate waste per pupil. Average plate waste per pupil increased in one of the schools (β1 = 8.19, p < 0.040 in School 1) but otherwise no significant changes in the daily consumption per pupil were seen in any of the schools between the baseline and the intervention period (Table 2).
However, the slope changed between baseline and intervention period for the plate waste in School 3, where it increased (β2 = 1.95, p = 0.034) during the intervention period (Figure 2). Slope differences between baseline and intervention were also seen for the daily food consumption in School 1 (β2 = −13.58, p = 0.002) and School 2 (β2 = −12.91, p = 0.028) (Figure 3).

4. Discussion

4.1. Main Findings

In the study at hand, we were able to demonstrate that climate-friendly and nutritionally adequate menu plans for Swedish schools can be designed through optimization and experienced meal planning. Linear programming ensured a food supply that covered all nutrients in recommended amounts as indicated in Table 1. The associated GHGEs per meal decreased by 28%, reaching the target level of 500 g CO2 eq/meal; the optimized food pattern was fairly similar to baseline, comparably affordable, and, as the amount of food consumed was unchanged, acceptable to pupils. Our optimization strategy affected mainly animal-based foods such as ruminant meat and solid dairy foods which were reduced. This reduction was compensated for by increased amounts of other less GHGE-intense animal products such as poultry meat and eggs, however, the major part of the substitution consisted of pulses and cereals. These findings are complementary to those of previous studies [14,15,16,35,36], where the optimization algorithm reduced meat and dairy products and increased plant-based foods to achieve nutritionally adequate, GHGE-reduced, and acceptable solutions.
The findings in the present study support the results of a comparable study, which also used a quasi-experimental design and ITS analysis, where environmental sustainability and nutritional quality were integrated to provide a new menu plan optimized for minimal deviation from baseline and nutrient content [22]. The information material about the change in menu was displayed in the school restaurant during the study. However, this, apparently, did not deter the pupils since mean consumption and plate waste did not change significantly from baseline (20–40 g per day both during baseline and intervention), similar to our previous study [22]. School number 3 was an exception in this regard where an increase in slope for plate-waste was observed. This school included pupils with cognitive/intellectual disabilities who were reported by the staff to be more averse to dietary change. This aspect of children with special needs should be considered in future interventions. The amount of food consumed did not change significantly with the new menu plan, although there were some slope changes for consumption in Schools 1 and 2. These changes are difficult to interpret as the slopes of the regression lines to some extent could be influenced by the order in which the meals were served over both periods. Slope changes are probably a temporary phenomenon and would most likely even out over a longer time period, but the important question is if they stabilize at the same level between the two periods. In order to study this, much longer interventions will be required. A longer intervention would increase the risk of secular trends occurring during the trial, which we did not experience during our relatively short intervention. In that case, a parallel group randomized controlled study design would be more appropriate.
Although the meal planner was asked to plan the new menu as closely as possible to the baseline menu, this did not necessarily mean keeping the order of the meals similar but rather just keeping the new dishes as similar as possible to the old ones in terms of dish-type/composition and naming. Future studies should take this into consideration.
Uppsala municipality has been very progressive in its climate work with public meals for several years, which explains the relatively low baseline GHGE values from school meals (average baseline emissions of 693 g CO2 eq/meal compared to 829 g CO2 eq/meal in our previous study) and probably also why intra-food group substitutions in the meat-category (resulting in a total increase of meat products) were observed in the optimized menu. This is similar to findings from Tunisia, where total GHGEs from diets were reduced mainly from redistributing animal products rather than on reducing their total contribution to the diet [37]. In comparison, GHGEs from school meals in the UK have been estimated at 720 g CO2 eq/meal, with meat and fish making the greatest contribution [38]. However, it is difficult to make clear-cut comparisons between school meals in different countries due to aspects such as differences in portion size estimations and variations in environmental impacts of food production between countries [39]. Other evaluations of the effects of introducing more sustainable school meals in practice are scarce. In Italy, optimization techniques have been applied to design a nutritious and GHGE-minimized one-month lunch plan for primary school children [20]. The applied approach is similar to ours as it reduced GHGEs of the meals to between 389 and 553 g of CO2 eq/day while meeting dietary recommendations for energy, proteins, lipids, carbohydrates, fibers, sugar, and sodium. Similarly, Spanish researchers reduced the GHGEs of a 4-week school meal menu by 13%–24% while meeting most nutrient requirements using optimization techniques [21]. However, the acceptability of the optimized menus in these studies [20,21] remains unknown as none of them were reported to have ever been tested in practice. In Finland, the implementation of a weekly compulsory vegetarian day initially reduced school lunch participation, resulted in more plate waste and lower food consumption [40]. These findings stand in contrast to this and a previous intervention [22] where the new menus neither significantly increased the plate waste nor reduced the food consumed by pupils. Our methodological approach considered acceptability of the new menu by minimizing the deviation from the baseline food supply. This was not done in the aforementioned studies [20,21,40], although Benvenuti et al. considered aspects such as frequency and composition of the meals, which to some extent parallels the contribution of the meal planner in this study. Other researchers have also emphasized the importance of considering cultural acceptability in the modeling of climate-friendlier diets by minimizing the deviation from baseline diets as a proxy for acceptability [13,14,17,19,36,41,42]. However, cultural acceptability of diets should ideally be regarded as a more complex matter, including aspects such as knowledge and preconceptions [43]. Using the baseline menu plan as a basis for the optimization could be problematic if the baseline menu is not acceptable in the first place. Then, the optimized menu will most probably not become more acceptable if the goal function in linear programming aims at mimicking that. In future studies, researchers should include formative research that can help to understand preferences and values of the intended consumers better prior to optimization.
We noted a relatively large day-to-day variation in plate waste and consumption in and between schools already at baseline despite the same menu being served, similar to what we saw in the first intervention study [22]. This underlines that waste and consumption should be measured daily for higher precision of the outcomes. There are a number of possibilities to explain this variability like a varying water content of different meals, variations in appetite among children from day to day, and children occasionally using several plates per meal, as well as measurement error at some stage of the procedure. This needs further investigation through observational studies in the school restaurant.
Interventions to improve children’s diets in schools are more likely to be effective when they combine several components such as education and environmental changes simultaneously [44,45]. It would, therefore, be of great interest to repeat this study and include age-adjusted pedagogical materials, e.g., those produced by the WWF regarding healthy and sustainable eating [46]. One aim of such an approach could be to reduce food waste and change attitudes in the long term among both pupils and school staff.

4.2. Strengths and Limitations

This study has several strengths when it comes to finding solutions regarding how to balance environmental and health demands in meal planning and to show its practical applicability. The mathematical optimization approach tackles the challenge of identifying the optimal combination of foods to fulfill nutritional recommendations and reach environmental targets and cost while keeping the deviation from the baseline menu to a minimum. This approach offers the flexibility to modify the objective function and/or constraints so that the priorities and needs of different users can be accommodated. It is a more efficient method than using traditional food-substitution [47,48,49] or iterative methods [50] to identify the best food and beverage composition of a healthy and sustainable diet based on experience and intuition. These common sense heuristic approaches require multiple steps, and the chances are that the final solution is not always the optimal one [12] with some priorities unfulfilled. For example, the nutritional quality of French school meals was compromised when protein-rich dishes were reduced or when meat-/fish-based dishes were replaced by vegetarian meals [51]. Nutritional adequacy can, thus, be compromised when animal products in diets are replaced with plant-based foods without properly considering nutritional content [52]. The current OPTIMAT method does not include other environmental aspects of food choice besides GHGEs, mainly due to the lack of data for other important environmental aspects like water use, biodiversity, etc.
It was unfortunate that the data from the fourth week of the intervention could not be used due to the evolving COVID-19 pandemic, with many children and kitchen staff staying at home. We decided to use data from only three plus three weeks. However, we do not believe that this has affected the results significantly. It widened our confidence intervals due to fewer data points, but the figures on waste and consumption show a very similar picture to our previous study [22]. Three weeks might not be long enough to observe significant acceptance of the modified menu plan. On the other hand, acceptance of novel diets is known to increase with time since increased exposure is known to positively affect acceptance of new foods [53]. The study’s pre-post design, without a control group, constitutes another limitation of the interpretation of results since the observed changes could also be a result of underlying secular trends in society. However, with this short study period of fewer than two months, it is unlikely that secular trends such as increased food prices or seasonal variation had any impact on the results. Finally, measurements could potentially have been more precise if performed by the research team. On the other hand, weighing of food and waste is often done by kitchen staff, so this is not new to them. Furthermore, having the research team present during meal production could have led to other types of disturbances and irregularities and was, therefore, deemed less suitable.

4.3. Future Developments of the Method

The collection and clearance of data for the optimization in this study was done manually, applying Excel OpenSolver as described in the method section. This involves several steps like collecting the purchasing lists of foods (i.e., all foods purchased for school meals in a given time period, including amounts and cost), coupling the food items to the nutrition database and the database for food-specific GHGEs, optimization, minor adjustments of the food list, and, finally, creation of the new menu plan. We are currently considering automatizing this whole procedure in order to be able to offer the method on a large scale to meal providers. Based on our model of optimization, different acceptable dietary scenarios can be developed for specific populations with considerably lower GHGEs than today. For example, despite Uppsala municipality’s previous efforts to reduce the climate impact of their meals, it was possible to reduce GHGEs even more down to 500 g/meal [30]. This implies that even municipalities with knowledge, interest, and aptitude to design climate-friendly menus could still benefit from an integrated approach such as OPTIMAT. As data become available on other environmental impacts of specific food items, e.g., water use and biodiversity, these factors can also be integrated into the model.

5. Conclusions

We were able to reproduce our previous findings of unchanged consumption and plate waste of these environment-friendly school meals. This confirms the usefulness of our pragmatic approach for combining linear optimization with planning and serving of new and more sustainable school lunches. This method could, therefore, be a valuable tool for public and private meal services and an important lever for future sustainable development of the food sector in Sweden and abroad.

6. Patents

OPTIMAT is a registered trademark at the European Union Intellectual Property Office.

Author Contributions

All authors contributed to the conceptualization of the research goal and aims. L.S.E. conceived the idea for this study and acquired funding together with E.P., A.K.L. and A.P. A.P. and P.E.C. developed the optimization methodology and P.E.C. conducted the data management, optimization, formal data analysis, and visualizations for this study. L.S.E. and P.E.C. wrote the first draft of the paper, which was commented on by all authors and revised accordingly. All authors have read and agreed to the published version of the manuscript.

Funding

This study was funded by The Swedish Research Council for Environment, Agricultural Sciences and Spatial Planning (FORMAS) grant number 2016-00353.

Acknowledgments

We are grateful for the support of the employees of the Uppsala municipality (Anders Sundin, Malin Holfve, Theres Mortensen, Gunilla Pernling Danya Holmgren, Sandra Cuturic) and the chefs Emelie Ek, Katrin Bergqvist, Yesim Sözener Edberg, and Johan Eklund at the four schools that participated in the study. Moreover, we appreciate the support of all the kitchen staff who helped out with recording food waste.

Conflicts of Interest

The authors declare no conflict of interest.

References

  1. IPCC Climate Change. Land: An IPCC Special Report on Climate Change, Desertification, Land Degradation, Sustainable Land Management, Food Security, and Greenhouse Gas Fluxes in Terrestrial Ecosystems; Intergovernmental Panel on Climate Change: Geneva, Switzerland, 2019. [Google Scholar]
  2. Willett, W.; Rockström, J.; Loken, B.; Springmann, M.; Lang, T.; Vermeulen, S.; Garnett, T.; Tilman, D.; DeClerck, F.; Wood, A.; et al. Food in the Anthropocene: The EAT—Lancet Commission on healthy diets from sustainable food systems. Lancet 2019, 393, 447–492. [Google Scholar] [CrossRef]
  3. Oostindjer, M.; Aschemann-Witzel, J.; Wang, Q.; Skuland, S.E.; Egelandsdal, B.; Amdam, G.V.; Schjøll, A.; Pachucki, M.C.; Rozin, P.; Stein, J.; et al. Are school meals a viable and sustainable tool to improve the healthiness and sustainability of children’s diet and food consumption? A cross-national comparative perspective. Crit. Rev. Food Sci. Nutr. 2017, 57, 3942–3958. [Google Scholar] [CrossRef] [PubMed]
  4. The Swedish National Agency for Education Statistik om Förskola, Skola och Vuxenutbildning. Swedish. (Statistics on Preschool, School and Adult Education). Available online: https://www.skolverket.se/skolutveckling/statistik/sok-statistik-om-forskola-skola-och-vuxenutbildning (accessed on 27 May 2020).
  5. The Swedish Food Agency. The Swedish Food Agency Bra mat i Skolan: Råd för Förskoleklass, Grundskola, Gymnasieskola och Fritidshem. Swedish. (Good School Meals: Guidelines for Primary Schools, Secondary Schools and Youth Recreation Centres); The Swedish Food Agency: Uppsala, Sweden, 2018; ISBN 978-91-7714-266-9.
  6. Eustachio Colombo, P.; Patterson, E.; Elinder, L.S.; Lindroos, A.K. The importance of school lunches to the overall dietary intake of children in Sweden: A nationally representative study. Public Health Nutr. 2020, 23, 1705–1715. [Google Scholar] [CrossRef] [PubMed] [Green Version]
  7. The National Food Agency. The National Food Agency Råd om bra Matvanor-Risk- Och Nyttohanteringsrapport (Advice on Good Eating Habits-Risk and Utility Management Report); The National Food Agency: Uppsala, Sweden, 2015.
  8. Ottmar, E.; Ramón, P.-M.; Youba, S. Climate Change 2014: Mitigation of Climate Change: Working Group III Contribution to the Fifth Assessment Report of the Intergovernmental Panel on Climate Change; Intergovernmental Panel on Climate Change, Edenhofer, O., Eds.; Cambridge University Press: New York, NY, USA, 2014; ISBN 978-1-107-05821-7. [Google Scholar]
  9. Patterson, E.; Elinder, L.S. Improvements in school meal quality in Sweden after the introduction of new legislation—A 2-year follow-up. Eur. J. Public Health 2015, 25, 655–660. [Google Scholar] [CrossRef] [Green Version]
  10. Micha, R.; Karageorgou, D.; Bakogianni, I.; Trichia, E.; Whitsel, L.P.; Story, M.; Peñalvo, J.L.; Mozaffarian, D. Effectiveness of school food environment policies on children’s dietary behaviors: A systematic review and meta-analysis. PLoS ONE 2018, 13, e0194555. [Google Scholar] [CrossRef]
  11. Dantzig, G.B. Maximization of a linear function of variables subject to linear inequality. In Activity Analysis of Production and Allocation; Koopmans, T.C., Ed.; Wiley & Chapman-Hall: New York, NY, USA; London, UK, 1951; pp. 339–347. [Google Scholar]
  12. Gazan, R.; Brouzes, C.M.C.; Vieux, F.; Maillot, M.; Lluch, A.; Darmon, N. Mathematical Optimization to Explore Tomorrow’s Sustainable Diets: A Narrative Review. Adv. Nutr. 2018, 9, 602–616. [Google Scholar] [CrossRef]
  13. Vieux, F.; Perignon, M.; Gazan, R.; Darmon, N. Dietary changes needed to improve diet sustainability: Are they similar across Europe? Eur. J. Clin. Nutr. 2018, 72, 951. [Google Scholar] [CrossRef]
  14. Perignon, M.; Masset, G.; Ferrari, G.; Barré, T.; Vieux, F.; Maillot, M.; Amiot, M.-J.; Darmon, N. How low can dietary greenhouse gas emissions be reduced without impairing nutritional adequacy, affordability and acceptability of the diet? A modelling study to guide sustainable food choices. Public Health Nutr. 2016, 19, 2662–2674. [Google Scholar] [CrossRef] [Green Version]
  15. Macdiarmid, J.I.; Kyle, J.; Horgan, G.W.; Loe, J.; Fyfe, C.; Johnstone, A.; McNeill, G. Sustainable diets for the future: Can we contribute to reducing greenhouse gas emissions by eating a healthy diet? Am. J. Clin. Nutr. 2012, 96, 632–639. [Google Scholar] [CrossRef]
  16. Reynolds, C.J.; Horgan, G.W.; Whybrow, S.; Macdiarmid, J.I. Healthy and sustainable diets that meet greenhouse gas emission reduction targets and are affordable for different income groups in the UK. Public Health Nutr. 2019, 22, 1503–1517. [Google Scholar] [CrossRef] [Green Version]
  17. Horgan, G.W.; Perrin, A.; Whybrow, S.; Macdiarmid, J.I. Achieving dietary recommendations and reducing greenhouse gas emissions: Modelling diets to minimise the change from current intakes. Int. J. Behav. Nutr. Phys. Act. 2016, 13, 46. [Google Scholar] [CrossRef] [PubMed] [Green Version]
  18. Wilson, N.; Nghiem, N.; Mhurchu, C.N.; Eyles, H.; Baker, M.G.; Blakely, T. Foods and Dietary Patterns That Are Healthy, Low-Cost, and Environmentally Sustainable: A Case Study of Optimization Modeling for New Zealand. PLoS ONE 2013, 8, e59648. [Google Scholar] [CrossRef] [PubMed] [Green Version]
  19. Eustachio Colombo, P.; Patterson, E.; Schafer Elinder, L.; Lindroos, A.K.; Sonesson, U.; Darmon, N.; Parlesak, A. Optimizing School Food Supply: Integrating Environmental, Health, Economic, and Cultural Dimensions of Diet Sustainability with Linear Programming. Int. J. Environ. Res. Public Health 2019, 16, 3019. [Google Scholar] [CrossRef] [PubMed] [Green Version]
  20. Benvenuti, L.; De Santis, A.; Santesarti, F.; Tocca, L. An optimal plan for food consumption with minimal environmental impact: The case of school lunch menus. J. Clean. Prod. 2016, 129, 704–713. [Google Scholar] [CrossRef]
  21. Ribal, J.; Fenollosa, M.L.; García-Segovia, P.; Clemente, G.; Escobar, N.; Sanjuán, N. Designing healthy, climate friendly and affordable school lunches. Int. J. Life Cycle Assess. 2016, 21, 631–645. [Google Scholar] [CrossRef]
  22. Eustachio Colombo, P.; Patterson, E.; Lindroos, A.K.; Parlesak, A.; Elinder, L.S. Sustainable and acceptable school meals through optimization analysis: An intervention study. Nutr. J. 2020, 19, 1–15. [Google Scholar] [CrossRef]
  23. Bandura, A. Social Cognitive Theory. In The International Encyclopedia of Communication; Donsbach, W., Ed.; John Wiley & Sons, Ltd.: Chichester, UK, 2008; ISBN 978-1-4051-8640-7. [Google Scholar]
  24. The National Food Agency Livsmedelsdatabasen Version 20181024. Swedish. Available online: https://www.livsmedelsverket.se/om-oss/psidata/livsmedelsdatabasen (accessed on 9 October 2017).
  25. Florén, B.; Amani, P.; Davis, J. Climate Database Facilitating Climate Smart Meal Planning for the Public Sector in Sweden. Int. J. Food Syst. Dyn. 2017, 8, 72–80. [Google Scholar]
  26. International Organization for Standardization ISO 14040:2006-Environmental Management—Life Cycle Assessment—Principles and Framework. Available online: https://www.iso.org/standard/37456.html (accessed on 9 October 2017).
  27. International Organization for Standardization ISO 14044:2006-Environmental Management—Life Cycle Assessment—Requirements and Guidelines. Available online: https://www.iso.org/standard/38498.html (accessed on 9 October 2017).
  28. Parlesak, A.; Tetens, I.; Jensen, J.D.; Smed, S.; Blenkuš, M.G.; Rayner, M.; Darmon, N.; Robertson, A. Use of Linear Programming to Develop Cost-Minimized Nutritionally Adequate Health Promoting Food Baskets. PLoS ONE 2016, 11, e0163411. [Google Scholar] [CrossRef] [Green Version]
  29. Mason, A.J. OpenSolver-An Open Source Add-in to Solve Linear and Integer Progammes in Excel. In Operations Research Proceedings 2011; Klatte, D., Lüthi, H.-J., Schmedders, K., Eds.; Springer: Berlin/Heidelberg, Germany, 2012; pp. 401–406. ISBN 978-3-642-29209-5. [Google Scholar]
  30. World Wildlife Fund One Planet Plate 2019–Kriterier och Bakgrund (One Planet Plate 2019–Criteria and Background). Available online: https://wwwwwfse.cdn.triggerfish.cloud/uploads/2019/04/kriterier-fr-one-planet-plate-rev-2019.pdf (accessed on 30 January 2020).
  31. Wanselius, J.; Axelsson, C.; Moraeus, L.; Berg, C.; Mattisson, I.; Larsson, C. Procedure to Estimate Added and Free Sugars in Food Items from the Swedish Food Composition Database Used in the National Dietary Survey Riksmaten Adolescents 2016–17. Nutrients 2019, 11, 1342. [Google Scholar] [CrossRef] [Green Version]
  32. School Food Sweden. Att Mäta Konsumtion (to Measure Consumption). Available online: http://www.skolmatsverige.se/konsumtionsmatning (accessed on 25 August 2020).
  33. Bernal, J.L.; Cummins, S.; Gasparrini, A. Interrupted time series regression for the evaluation of public health interventions: A tutorial. Int. J. Epidemiol. 2017, 46, 348–355. [Google Scholar]
  34. R Foundation for Statistical Computing. R Core Team R: A Language and Environment for Statistical Computing; R Foundation for Statistical Computing: Vienna, Austria, 2019. [Google Scholar]
  35. Broekema, R.; Tyszler, M.; van’t Veer, P.; Kok, F.J.; Martin, A.; Lluch, A.; Blonk, H.T.J. Future-proof and sustainable healthy diets based on current eating patterns in the Netherlands. Am. J. Clin. Nutr. 2020. [Google Scholar] [CrossRef]
  36. Milner, J.; Green, R.; Dangour, A.D.; Haines, A.; Chalabi, Z.; Spadaro, J.; Markandya, A.; Wilkinson, P. Health effects of adopting low greenhouse gas emission diets in the UK. BMJ Open 2015, 5, e007364. [Google Scholar] [CrossRef] [PubMed] [Green Version]
  37. Perignon, M.; Sinfort, C.; El Ati, J.; Traissac, P.; Drogué, S.; Darmon, N.; Amiot, M.-J.; Amiot, M.J.; Achir, N.; Alouane, L.; et al. How to meet nutritional recommendations and reduce diet environmental impact in the Mediterranean region? An optimization study to identify more sustainable diets in Tunisia. Glob. Food Secur. 2019, 23, 227–235. [Google Scholar] [CrossRef]
  38. Wickramasinghe, K.K.; Rayner, M.; Goldacre, M.; Townsend, N.; Scarborough, P. Contribution of healthy and unhealthy primary school meals to greenhouse gas emissions in England: Linking nutritional data and greenhouse gas emission data of diets. Eur. J. Clin. Nutr. 2016, 70, 1162–1167. [Google Scholar] [CrossRef] [PubMed] [Green Version]
  39. Poore, J.; Nemecek, T. Reducing food’s environmental impacts through producers and consumers. Science 2018, 360, 987–992. [Google Scholar] [CrossRef] [PubMed] [Green Version]
  40. Lombardini, C.; Lankoski, L. Forced Choice Restriction in Promoting Sustainable Food Consumption: Intended and Unintended Effects of the Mandatory Vegetarian Day in Helsinki Schools. J. Consum. Policy 2013, 36, 159–178. [Google Scholar] [CrossRef]
  41. Tyszler, M.; Kramer, G.; Blonk, H. Just eating healthier is not enough: Studying the environmental impact of different diet scenarios for Dutch women (31–50 years old) by linear programming. Int. J. Life Cycle Assess. 2016, 21, 701–709. [Google Scholar] [CrossRef]
  42. Green, R.; Milner, J.; Dangour, A.D.; Haines, A.; Chalabi, Z.; Markandya, A.; Spadaro, J.; Wilkinson, P. The potential to reduce greenhouse gas emissions in the UK through healthy and realistic dietary change. Clim. Chang. 2015, 129, 253–265. [Google Scholar] [CrossRef]
  43. Hammelman, C.; Hayes-Conroy, A. Understanding Cultural Acceptability for Urban Food Policy. J. Plan. Lit. 2015, 30, 37–48. [Google Scholar] [CrossRef]
  44. Thomas, J.; Sutcliffe, K.; Harden, A.; Oakley, A.; Oliver, S.; Rees, R.; Brunton, G.; Kavanagh, J. Children and Healthy Eating: A Systematic Review of Barriers and Facilitators; Centre for Reviews and Dissemination: York, UK, 2003. [Google Scholar]
  45. Kaljonen, M.; Peltola, T.; Salo, M.; Furman, E. Attentive, speculative experimental research for sustainability transitions: An exploration in sustainable eating. J. Clean. Prod. 2019, 206, 365–373. [Google Scholar] [CrossRef]
  46. För Lärare (For Teachers). Available online: https://www.wwf.se/utbildning/larare/ (accessed on 25 August 2020).
  47. Thomson, J.L.; Tussing-Humphreys, L.M.; Onufrak, S.J.; Zoellner, J.M.; Connell, C.L.; Bogle, M.L.; Yadrick, K. A Simulation Study of the Potential Effects of Healthy Food and Beverage Substitutions on Diet Quality and Total Energy Intake in Lower Mississippi Delta Adults. J. Nutr. 2011, 141, 2191–2197. [Google Scholar] [CrossRef] [Green Version]
  48. Roodenburg, A.J.C.; van Ballegooijen, A.J.; Dötsch-Klerk, M.; van der Voet, H.; Seidell, J.C. Modelling of Usual Nutrient Intakes: Potential Impact of the Choices Programme on Nutrient Intakes in Young Dutch Adults. PLoS ONE 2013, 8, e72378. [Google Scholar] [CrossRef]
  49. Seves, S.M.; Verkaik-Kloosterman, J.; Biesbroek, S.; Temme, E.H. Are more environmentally sustainable diets with less meat and dairy nutritionally adequate? Public Health Nutr. 2017, 20, 2050–2062. [Google Scholar] [CrossRef] [Green Version]
  50. Verger, E.O.; Holmes, B.A.; Huneau, J.F.; Mariotti, F. Simple changes within dietary subgroups can rapidly improve the nutrient adequacy of the diet of French adults. J. Nutr. 2014, 144, 929–936. [Google Scholar] [CrossRef]
  51. Vieux, F.; Dubois, C.; Duchêne, C.; Darmon, N. Nutritional Quality of School Meals in France: Impact of Guidelines and the Role of Protein Dishes. Nutrients 2018, 10, 205. [Google Scholar] [CrossRef] [Green Version]
  52. Payne, C.L.; Scarborough, P.; Cobiac, L. Do low-carbon-emission diets lead to higher nutritional quality and positive health outcomes? A systematic review of the literature. Public Health Nutr. 2016, 19, 2654–2661. [Google Scholar] [CrossRef]
  53. Appleton, K.M.; Hemingway, A.; Rajska, J.; Hartwell, H. Repeated exposure and conditioning strategies for increasing vegetable liking and intake: Systematic review and meta-analyses of the published literature. Am. J. Clin. Nutr. 2018, 108, 842–856. [Google Scholar] [CrossRef] [Green Version]
Figure 1. Food group quantities (g/pupil/day) before (baseline food list—light blue columns) and after (optimized food list—dark blue columns) optimization. The grey parts indicate the amount that was reduced within a food group but replaced by other foods of the same group (i.e., intra-food group substitutions). The yellow part indicates the amount within a food group that exceeds the baseline amount after optimization.
Sustainability 12 08475 g001
Figure 2. Scatterplots based on interrupted time series (ITS) analysis displaying the daily plate waste per pupil (g) in Schools 1–4. The blue-colored graphs represent the daily amount of plate waste per pupil during the baseline period (measurement days 0–15), while the pink-colored graphs represent the daily amount of plate waste per pupil during the intervention period (measurement days 16–30); * p < 0.05 for slope change between baseline and intervention period based on the ITS analysis.
Sustainability 12 08475 g002
Figure 3. Scatterplots based on ITS analysis displaying the daily consumption per pupil (g) in Schools 1–4. The blue-colored graphs represent the daily consumption per pupil during the baseline period (measurement days 0–15), while the pink-colored graphs represent the daily consumption per pupil during the intervention period (measurement days 16–30); * p < 0.05 for slope change between baseline and intervention period based on the ITS analysis.
Sustainability 12 08475 g003
Table 1. Constraints applied during all linear optimization procedures, the resulting greenhouse gas emissions (CO2 eq), cost, and nutrient content per meal in the baseline food list, optimized food list, and the applied (final) menu plan.
ParameterConstraintsBaselineResults
Lower LimitUpper LimitBaseline Food ListOptimized Food ListFinal Menu Plan
CO2 eq. (g/lunch)na499 *693499497
Cost (SEK/lunch)nana11.5411.1811.17
Energy (kcal/lunch) a672672672672667
Carbohydrates (%E)4560475050
Fat (%E)2240332928
Protein (%E)10na161717
Fiber (%E)2na688
Saturated fatty acids (%E)na10988
Monounsaturated fatty acids (%E)1020141212
Polyunsaturated fatty acids (%E)510766
Vitamin A (µg) b188na316277277
Vitamin D (µg) b3.1na4.53.13.1
Vitamin E (mg) b2.2na5.14.74.7
Thiamine (mg) b0.3na0.40.40.4
Riboflavin (mg) b0.4na0.60.50.5
Vitamin C (mg) b16.0na39.640.040.0
Niacin (mg) b4.6na5.05.25.3
Vitamin B6 (mg) b0.4na0.60.60.6
Vitamin B12 (µg) b0.6na1.91.41.4
Folate (µg) b62.7na139152152
Phosphor (mg) b199na585555555
Iodine (µg) b43.2na10393.494.2
Iron (mg) b3.4na3.95.24.6
Calcium (mg) b282na419321322
Potassium (mg) b971na115411131111
Magnesium (mg) b87.7na111120120
Salt (g) cna3.62.42.32.3
Selenium (µg) b12.5na17.318.018.0
Zinc (mg) b3.4na3.53.43.4
Added sugars (E%) c,dna5211
Milk e−50%−50%
Crisp bread e−50%−50%
Butter (used as spread) e−50%−50%
Potatoes e−75%+50%
Frozen hamburgers e−100%−100%
Frozen meat patties e−100%−100%
Minced meat e−100%−100%
Meatballs e−0%+0%
All other foods e−75%+100%
Note: a Based on 30% of daily estimated energy requirement (EER) for an average pupil, 10–12 years, both sexes; b Lower limit based on 30% of daily recommended intakes (RIs) for an average pupil, 10–12 years, both sexes; c Upper limit based on 30% of daily recommended intake (RIs) for an average pupil, 10–12 years, both sexes; d Estimated according to Wanselius et al. [31]; e Relative deviation from baseline food supply; * World Wildlife Fund (WWF) target level of maximum 500 g carbon dioxide equivalents per meal (CO2 eq/meal); SEK = Swedish krona; na = not applicable.
Table 2. Difference in daily amount of plate waste per pupil (g) and daily consumption per pupil (g) between baseline and intervention periods with 95% confidence intervals (CIs).
Plate Waste (g/Pupil)Consumption (g/Pupil)
BaselineInterventionParameter EstimatesBaselineInterventionParameter Estimates
Mean95% CIMean95% CIβ1pβ2pMean95% CIMean95% CIβ1pβ2p
School 11613–182118–248.190.040−0.430.331277246–308251221–281−22.970.582−13.580.002
School 22519–312420–288.660.1921.010.181232186–278267232–303−49.330.350−12.910.028
School 32622–304437–5210.810.1911.950.034344311–377355314–39518.390.714−3.140.593
School 42621–313222–4110.400.302−1.330.251197167–228176133–218−25.150.6172.270.701
Note: Bold text indicates statistically significant p-values (<0.05); β1 Beta coefficient for the level (mean) change (baseline vs. intervention), with baseline period as the reference category; β2 Beta coefficient for the slope (baseline vs. intervention), with baseline period as the reference category.
Publisher’s Note: MDPI stays neutral with regard to jurisdictional claims in published maps and institutional affiliations.

