1. Introduction
Today, investors, customers, and other stakeholders (NGOs, media, customers, regulators, employees, etc.) increasingly take note of the sustainability efforts of companies [
1]. This marks a groundbreaking transition. More than ever, acting sustainably is a crucial factor for future business success. However, a fundamental question is how to evaluate and measure responsible and sustainable behavior. Anecdotal evidence shows that this task is notoriously difficult for businesses. There is no universal measure or method available for valuing a company’s impact and translating it into the type of value most commonly used in business—financial value.
Merck KGaA, an international science and technology company that operates across the healthcare, life science, and performance material fields, faced exactly this challenge: How can one measure and demonstrate stakeholder value? When focusing on stakeholders, companies commit to maximizing stakeholder value while ensuring financial performance [
2]. Stakeholders include a company’s shareholders, employees, customers, and the end users of the company’s products or services, suppliers, along with business partners, the environment, and future generations who depend on those products, as well as broader society (present and future), insofar as people are impacted by company activities [
3]. For these different groups, stakeholder value can take very different forms [
2,
4]. Here, environmental (e.g., waste, emissions, and recycling), social (e.g., product benefits, including performance, design and cost-effectiveness, and contributions to knowledge), economic (e.g., wealth for employees and suppliers), and governance value (e.g., quality of jobs and standards of supplier relationships) can be distinguished.
For Merck, do donations of medicine to fight neglected tropical diseases, such as schistosomiasis (affecting thousands of people mainly in African countries), contribute to societal enablement in these countries? Do programs for the prevention of diabetes provide a positive impact beyond an immediate therapeutic benefit? Does the development of semiconductor materials for microchips that enable energy efficient data storage or investments in cell-based clean meat yield environmental value? Moreover, can we convert these very different types of value into one standardized type of value that enables a company like Merck to compare its value to society across different projects and communicate this value effectively and credibly to its stakeholders?
To maximize stakeholder value while ensuring financial performance, companies need to be able to assess and quantify their positive and negative impacts on the environment, society, and the economy. In addition, society and investors demand a true and comprehensive picture of the value that corporate activities bring, and measuring stakeholder value can help provide this [
5]. However, as shown by our research, there is no universal measure or method available to evaluate a company’s impact holistically.
In the next section, we describe the developments in the field of sustainable business impact valuation. Based on the findings from this literature review and the practical business need for sustainable business valuation, we propose and test a new method for quantifying and monetarizing stakeholder value that can be applied by companies in decision-making, portfolio management, benchmarking, and stakeholder and investor communication and in identifying new business opportunities. Today, striving for and demonstrating a positive contribution to resolving great societal, economic, and ecological challenges is more important than ever for companies.
2. Literature Review
There have been enormous advances in the field of sustainable business impact valuation in the last three decades. Since the first Social and Environmental Assessment Report was published by the company Ben and Jerry’s in 1989, several initiatives and frameworks for measuring and reporting Sustainable Business Value creation have been proposed and implemented. These include corporate sustainability responsibility reporting with environmental, social, and governance performance standards; sustainability ratings and indices; and sustainability accounting [
6]. We comprehensively explore these three identified approaches across the business administration literature and present them as a literature review below.
2.1. Sustainability Reporting
The first category of initiatives and frameworks for measuring and reporting Sustainable Business Value is sustainability reporting, often described as corporate responsibility reporting. The first-ever corporate sustainability report was issued in 1989 by the company Ben and Jerry’s. The large multinational corporation Shell followed suit with its own report almost a decade later in 1998. Although sustainability reports are generally deemed voluntary, they are mandatory in some regions, countries, and stock exchanges. One of the most prominent examples of mandatory reporting is the European Union’s Non-Financial Reporting Directive, which applies to all EU companies with 500 or more employees [
7]. This directive contributes to the promotion and diffusion of sustainability reporting. In Europe, 96 percent of companies in the major European indices, including FTSE, CAC, DAX, MIB, IBEX, AEX, BEL, PSI, and SMI, publish a sustainability report [
8]. In the US, 86 percent of companies in the S&P 500 publish sustainability reports [
9]. Almost a decade ago, in 2011, only 20 percent of S&P 500 companies produced such reports [
9].
Sustainability reporting is conducted without “an underlying accounting system” [
10] (p. 45). However, there are several standards that companies can adopt to prepare their sustainability reports. The best-known standards include the reporting standards of the Global Reporting Initiative (GRI), the Integrated Reporting standards of the International Integrated Reporting Council (IIRC), and the standards of the Sustainability Accounting Standards Board (SASB) [
11].
Some of the most popular and earliest standards were developed by GRI, an organization founded in 1997 with the aim to provide global reporting standards that meet the needs of diverse stakeholders [
11]. The GRI standards include diverse topics across environmental, social, and economic categories. Companies are free to choose and report the standards related to the topics pertinent to their existence. These standards include narrative explanations of how companies manage these diverse topics, as well as quantitative measures. The GRI standards are primarily used for reporting purposes.
Another commonly used framework for sustainability reporting is the Integrated Reporting Framework, which was developed by the IIRC and established in 2010 [
12]. Integrated Reporting standards are predominantly used for reporting and aimed at providers of financial capital [
12]. The Integrated Reporting Framework recommends that companies use qualitative and quantitative measures, as well as narrations, to describe how they create value across six categories of capital: financial capital, manufacturing capital, human capital, social and relationship capital, intellectual capital, and natural capital. However, the Integrated Reporting Framework does not provide any standardized measures to report on.
Finally, the standards developed by the SASB, which was founded in 2011, primarily focus on which ESG factors are pertinent to a company’s financial performance. Overall, these factors can be used by companies to report on their impact on the environment, society, and the economy but are aimed at investors. The SASB standards are industry-specific and include quantitative and, in some cases, qualitative measures [
13].
Although all of these sustainability reporting frameworks are relatively comparable among the included companies, there is no comparability between the different frameworks, which are aimed at—and reach—different audiences. Furthermore, companies are not obliged to adhere to any of these standards [
14]. Navigating and comparing these different standards presents a challenge [
15], not only to experienced sustainability professionals from companies tasked with producing sustainability reports but also to corporate stakeholders [
16]. Finally, sustainability reporting frameworks, as the name suggest are to be used predominantly for reporting purposes.
2.2. Sustainability Ratings and Indices
Another category of initiatives and frameworks for measuring and reporting Sustainable Business Value consists of sustainability ratings and indices. These measures mainly consider the overall sustainability performance of companies, encompassing environmental, social, and economic performance data and risk assessments. Such indices include the Dow Jones Sustainability Index (DJSI), the FTSE4Good Indices, the Euronext Vigeo Eiris Indices, the STOXX ESG-X Indices, Sustainalytics’ ESG Ratings, the Thomson Reuters/S-Network ESG Best Practices Index, the Kirchhoff Consult Good Company Ranking, and the Corporate Knights World’s Most Sustainable Corporations. For an extensive and recent overview of the best-known sustainability ratings, please refer to Diez-Cañamero et al. (2020) [
6].
Sustainability ratings and indices started emerging in the early 1990s. The first, the MSCI KLD 400 Social Index (formerly Domini 400 Social Index), was established in 1990 and lists US companies only [
17]. The DJSI, established in 1999, and the FTSE4Good Index, founded in 2011, are both global indices. Some of these indices, such as the abovementioned MSCI KLD 400 Social Index and FTSE4Good, exclude controversial businesses (tobacco, alcohol, nuclear power, and adult entertainment) [
18]. Other indices, such as the DJSI, assess companies from different industries and compare them to their peers [
19,
20]. Although the main outcomes of corporate assessments are available to a wide variety of stakeholders, such as the general public, employees, and non-governmental organizations, the sustainability ratings and indices for overall sustainability performance are created for and fully accessible only to investors. As such, the available data are skewed towards financial impacts [
6].
Furthermore, some ratings focus on measuring only particular E (environmental), S (sustainability), or G (governance) aspects of sustainability. Anecdotal evidence suggests that these ratings are more commonly used by diverse stakeholders, as well as for peer comparisons between companies. However, due to their focus on specific issues, these ratings cannot be used to assess overall Sustainable Business Value. Rankings focusing on environmental issues were established the earliest, such as the CDP Annual A List, which scores companies on climate change, forest, and water security [
21]; the ET Carbon Ranking, which scores companies on greenhouse gas emissions [
22]; and the Newsweek Green Ranking, which rates overall corporate environmental performance [
23]. There are also a number of rankings that focus on social issues, including human rights (e.g., the Corporate Human Rights Benchmark) [
24], labor issues (e.g., the Workforce Disclosure Initiative) [
25], gender equality (e.g., the Bloomberg Gender-Equality Index) [
26], and diversity (the Thomson Reuters Diversity and Inclusion Index) [
27]. Rankings dealing with the corporate governance and economic performance of companies include the Institute of Directors Good Governance Index [
28]. Furthermore, some rankings pertain only to issues valid to companies from certain industries. A good example of such a ranking is the Access to Medicine Index, which ranks pharmaceutical companies on how they address a social problem related to access to medicine [
29].
Overall, ESG measures indicate relative performance but provide no cross-criteria quantification. These frameworks usually do not take the perspective of societal value but instead measure mainly the pure outputs of corporate activities, rather than the ultimate outcomes of these outputs (e.g., what is the economic benefit of having a higher female ratio among peer companies compared to just stating the percentage of women in the workforce). There are also difficulties in comparing between different frameworks due to the different rating and index providers that aggregate different metrics in different ways. Finally, the ESG metrics cannot be fully used by, and are not addressed to, diverse stakeholders. The result is “a vast and chaotic universe of products” [
6] (p. 2).
2.3. Sustainability Accounting
One of the most promising methods for evaluating sustainable businesses is sustainability accounting. This concept emerged in the early 1990s [
30]. There are different varieties of sustainability accounting [
30], such as sustainable cost and full-cost accounting [
31], triple bottom line accounting [
32], natural capital accounting [
31,
33], and input–output analysis [
31]. All of these methods use traditional accounting principles and practices [
30]. Traditional accounting produces external financial statements such as an income statement, a balance sheet, a cash flow statement, and a shareholder equity statement [
11]. In general, sustainability accounting aims to produce traditional financial statements extended by externalities that affect different stakeholders positively or negatively [
34]. In a simplified form, sustainability accounting can provide an extended income statement of a company that includes not only revenues and expenses but also positive and negative environmental, social, and economic externalities, resulting in the total profit of a company accounting for its impact on the environment, society, and the economy [
34]. As such, sustainability accounting provides the most promising fit for use by diverse stakeholders in impact valuation and appears to be an objective method based on well-established accounting principles and practices.
There are a number of new initiatives that aim at developing sustainability accounting, such as the Value Balancing Alliance initiative, supported by the Big Four accounting firms [
35], as well as the Impact-Weighted Accounts Project at Harvard Business School [
36]. However, so far, no universal measures of externalities have been established across industries and geographies. Additionally, the measurement of externalities is not widely practiced by companies, nor by their accountants. Some criticize sustainability accounting methods for their lack of flexibility in application to technologies or products. Sustainable accounting might be easy to use for entire companies, but it is not ideal for portfolio management purposes or prioritization among development opportunities. A focus on technologies (rather than entire companies) may help identify business opportunities, increase differentiation, and/or generate competitive advantages.
As described in this section, there are three different approaches to sustainable business valuation: sustainability reporting, sustainability ratings, and indices and sustainability accounting.
Table 1 summarizes the strengths and weaknesses of these approaches.
3. Materials and Methods
The main shortcomings of the existing approaches to sustainable business valuation include a lack of comparability between existing initiatives and frameworks, insufficient adjustments to the needs of a wider variety of stakeholders, and slow advances in the practical applications of the method to provide business insights for the entire company, as well as for specific technologies and investment decisions. In addition, sustainability reporting standards are not universal and remain difficult to compare to each other. ESG measures provide information on performance across different environmental, social, and economic factors but do not allow for comparison between these factors and are not measures of impact. Sustainability accounting offers great promise for measuring positive and negative corporate impacts, but its real-life applications for different business purposes are lacking.
To address these shortcomings, Merck decided to develop a sustainable business valuation method that is rigorous and uniform enough to allow for comparisons and comprehensive enough to include all societal stakeholders. The required solution needs to be flexible enough to cover all three business sectors in which the company operates. Finally, a company requires a method that can provide insights into stakeholder value alongside business value that can be usable in different ways—for decision-making, portfolio management, benchmarking, stakeholder and investor communication, and identifying new business opportunities.
The method developed by Merck is called the Sustainable Business Value (SBV). The Sustainable Business Value approach was developed along with Boston Consulting Group and was inspired by BCG’s Total Societal Impact (TSI) concept [
37]. TSI provides a more holistic look into impact valuation to help companies capture the broader social impacts of their core business on the economy, the environment, and society as a whole. In this sense, society is defined as the company’s stakeholders, investors, suppliers, customers, employees, consumers, and others who are directly or indirectly affected by the company’s products or business operations. A company’s SBV includes the impact of its products, services, and operations. It also includes the actual services and products created by the company and their impacts. SBV provides a comprehensive perspective across six standardized dimensions. Standardization allows for comparisons across different products, business units, and companies. Furthermore, applying a standard framework can shed light on areas of positive and negative impacts that managers were not previously aware of but which could provide a competitive advantage or trigger new business opportunities.
Based on the SBV, a company can make explicit decisions to adjust its core business to create a positive impact. To ensure this comprehensive perspective yields a conclusive picture, all impacts are quantified in monetary terms. The universal units of Euros and Dollars help to assess and compare impacts in different dimensions relative to each other.
In the following sections, the SBV dimensions and methods are described and applied to the initial pilot projects. The general approach consists of three steps. In the first step, it is necessary to understand the SBV dimensions. In the second step, it is necessary to understand the value chain of the selected projects and select elements from the value chain that are expected to have the highest impact out of the six defined dimensions. Thirdly, measurements in (or conversions into) monetary values need to be performed. Here, multiple concretization steps are needed. For each area, the inputs, outputs, and outcomes that contribute to the SBV need to be specified along with the monetary proxies.
3.1. Understanding the SBV Dimensions
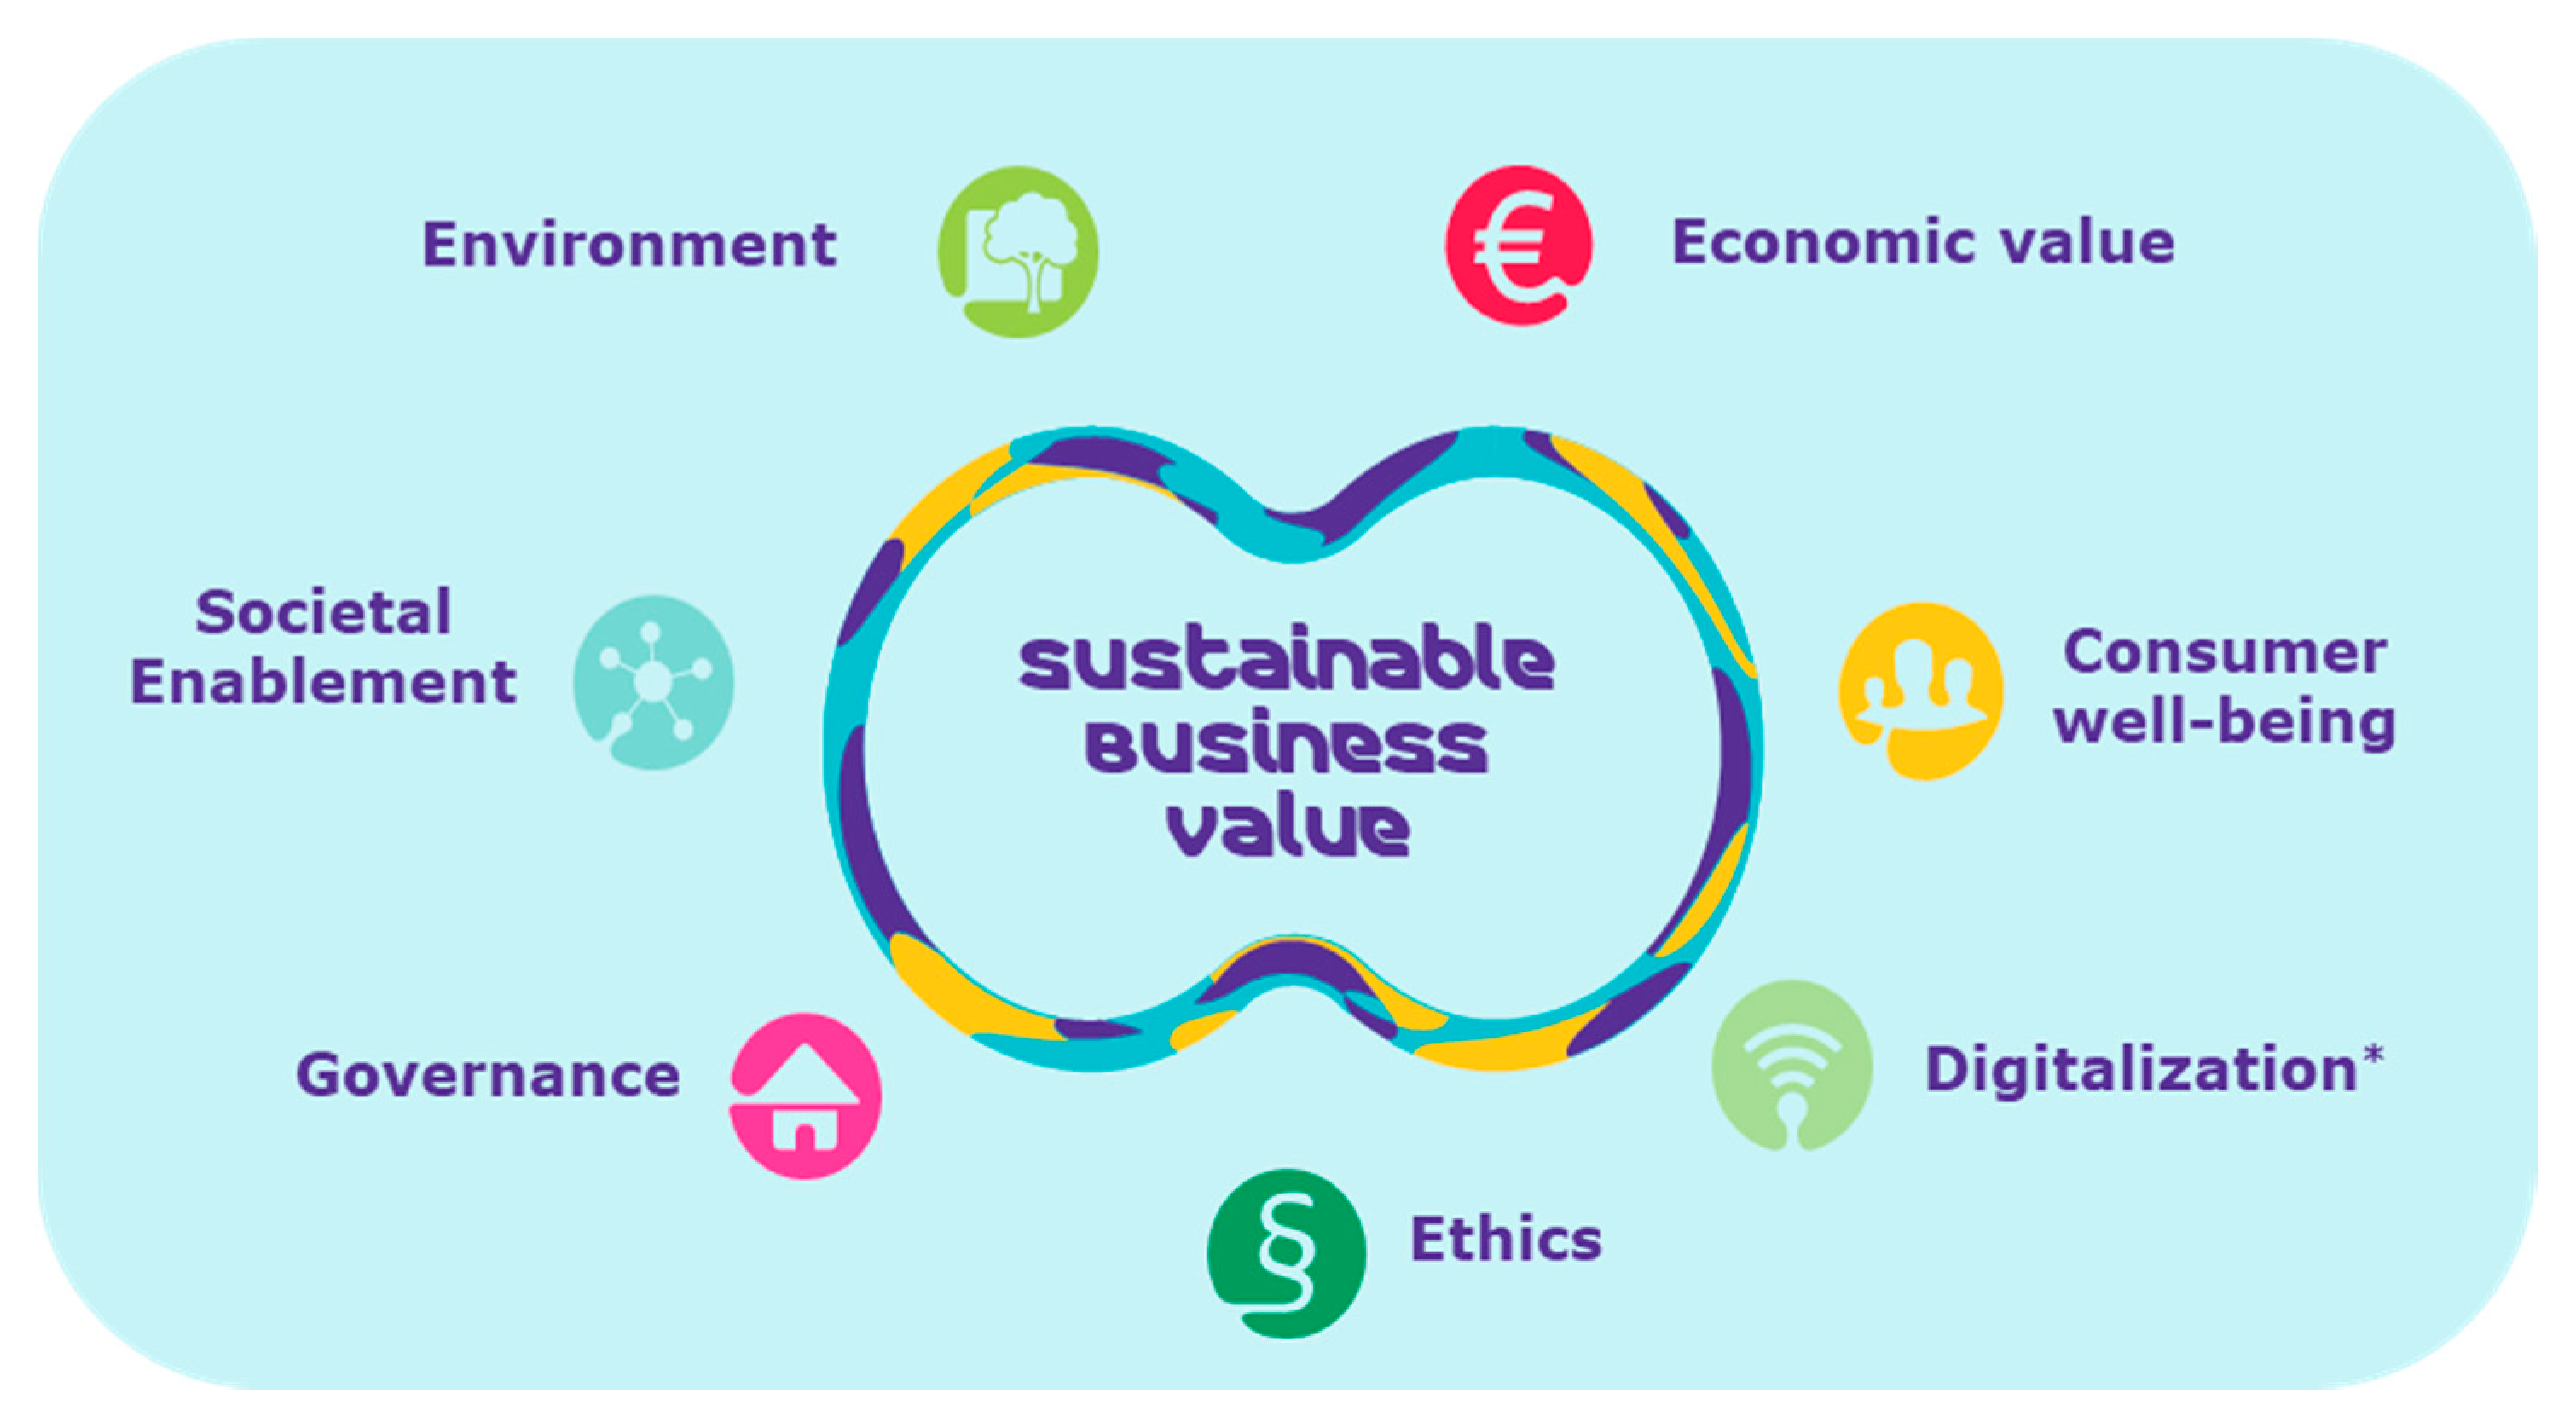
The SBV is not a single metric but rather a collection of measures and assessments across the value chain of a company, including its suppliers, distributors, and consumers. Having observed several factors (based on reporting standards and indices, as well as project experience), we grouped these factors into six dimensions showing a clear link between SBV performance and financial performance. The six dimensions of SBV (environment, economic value, consumer well-being, ethics, governance, and societal enablement) are depicted below in
Figure 1. A seventh dimension, “digitalization”, is currently under development and will reflect the impact of evolving digital business models on society.
The economic dimension encompasses the value generated for society through employment and business relationships. Economic value refers to individual wealth (income or company profits), societal wealth (taxes), and indirect contributions from factors such as the increased productivity of more diverse teams. The consumer well-being dimension quantifies (usually positive) the impacts of products on end users, such as increased health, safety, satisfaction, and enjoyment. The ethics dimension covers internal practices in supply chains and marketing, as well as influences on the industry standards in these areas. Besides the mode of doing business, the ethical dimension also highlights impacts from the content of products or services, such as increased transparency or safety for society. The environmental dimension includes all emissions, resources, land and water use, and the impact of waste via different recycling pathways. During production, most goods have negative impacts in the environmental dimension, which they may compensate for through energy and resource efficiency. Societal enablement is the umbrella term we use to summarize the impacts on the well-being of employees and communities through the availability and affordability of products and services, as well as through education. An example of a societal enablement impact would be the health benefits for people who changed their lifestyle due to a health awareness campaign; although these people may not have actually used the product, the health campaign went to market. Finally, the governance dimension covers internal diversity, equality, remuneration practices, and compliance mechanisms, such as audits.
3.2. Understanding the Value Chain
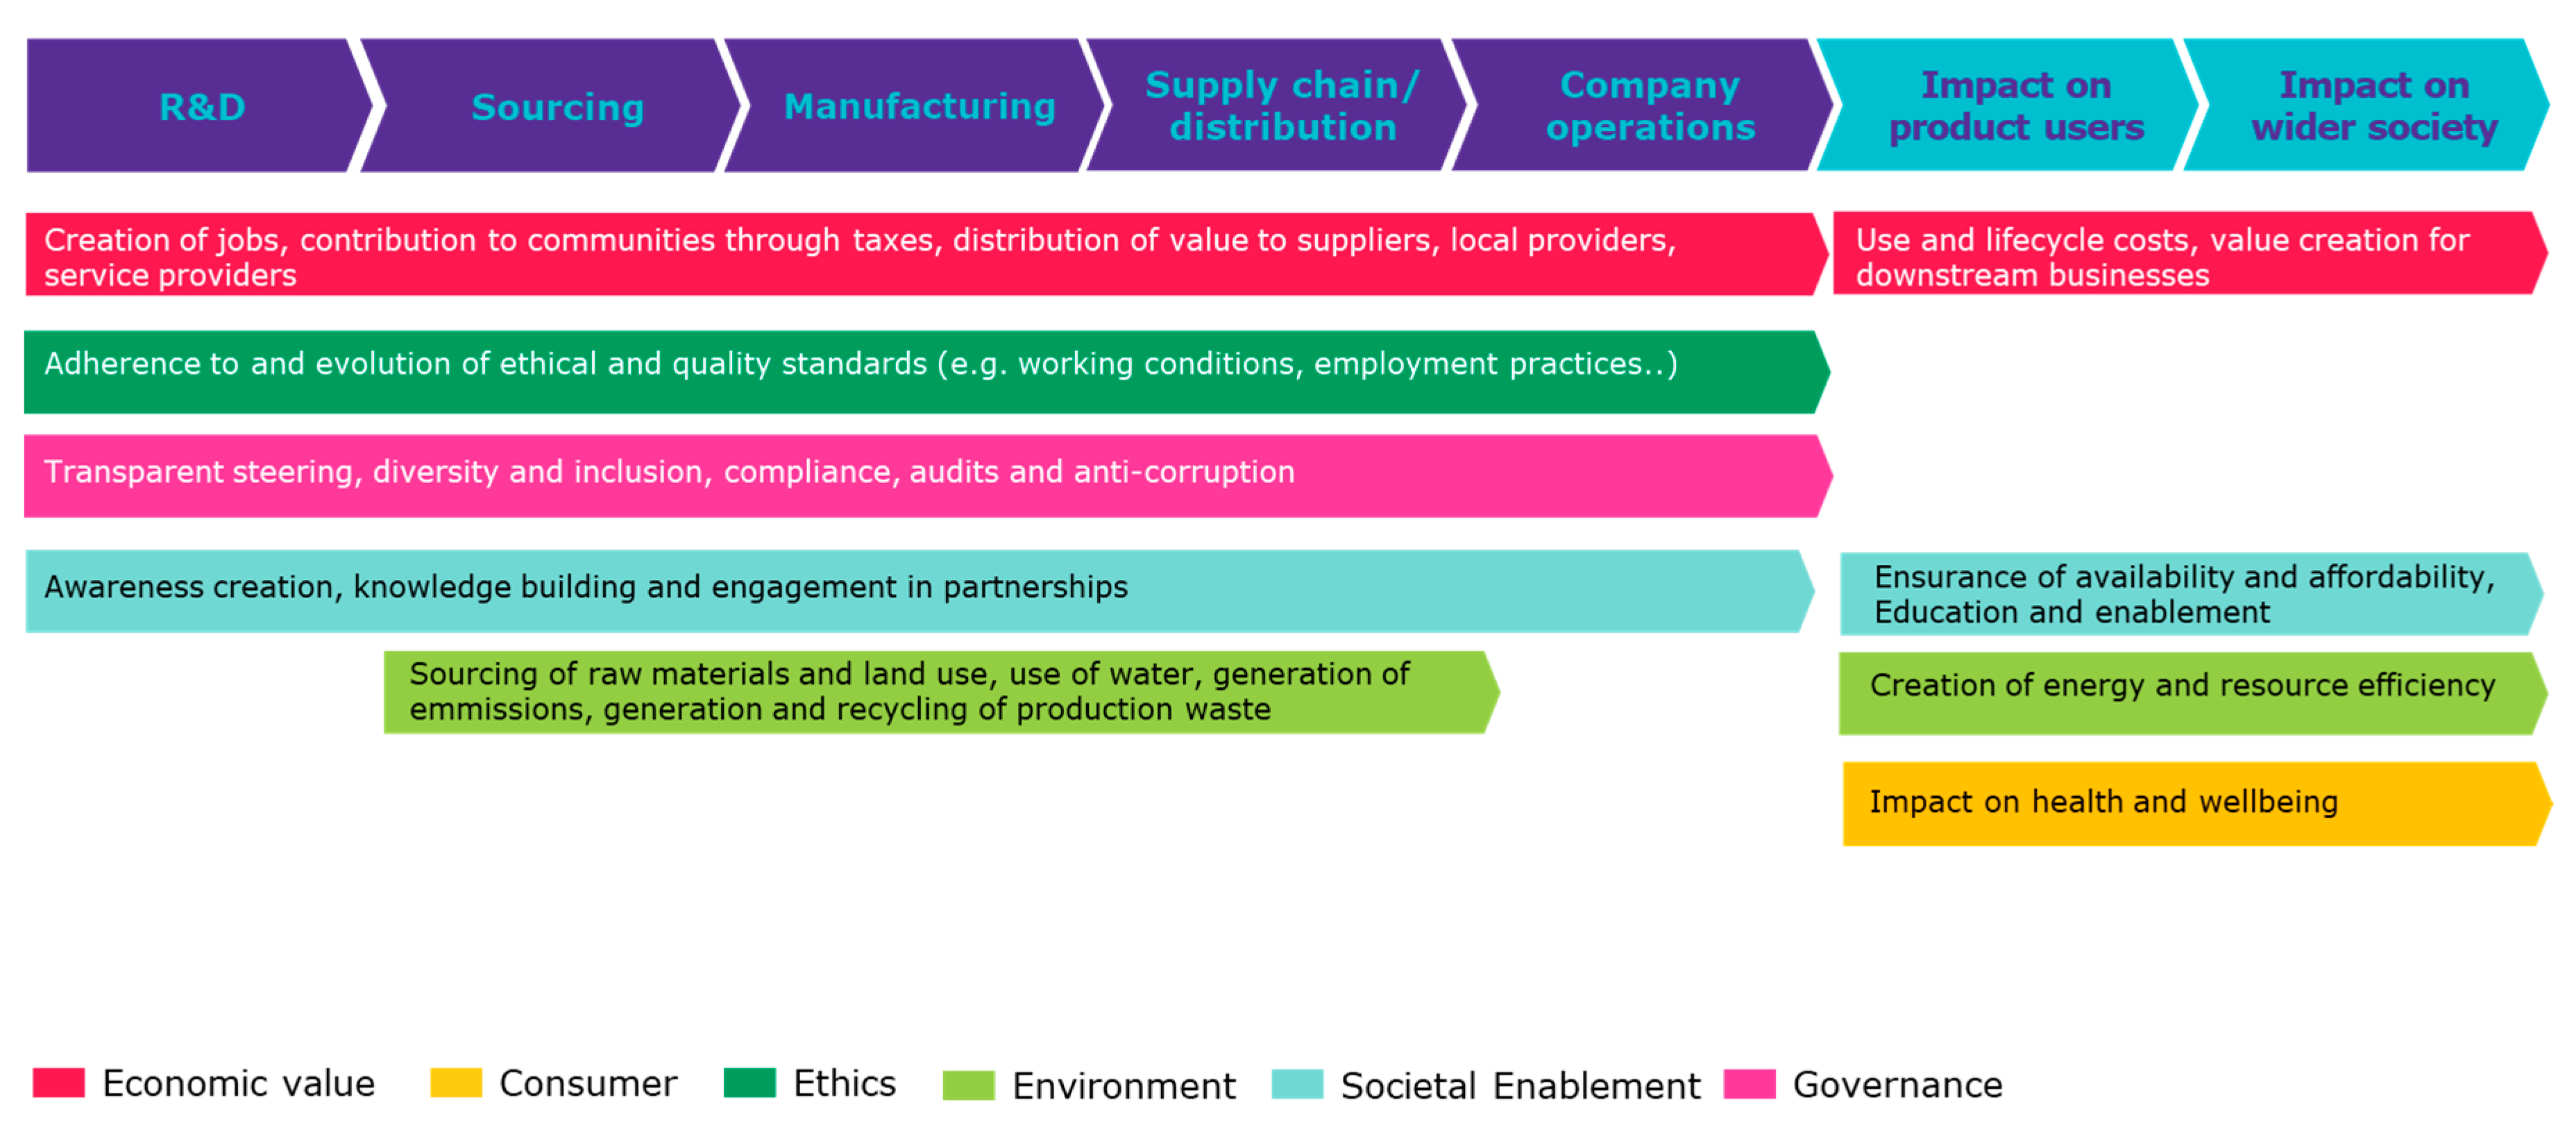
To apply the SBV assessment to a specific product, the six dimensions are mapped against the product’s value chain, as depicted in
Figure 2. This mapping identifies the areas of the product’s value chain where societal value is generated. Depending on the type of product, the impact value will be substantial in some areas and low in others. In practice, areas with a substantial expected impact will usually be chosen for quantification.
3.3. Quantifying the Outcomes
In some cases, the quantification of SBV is straightforward, such as the creation of individual wealth. To estimate the wealth created through jobs, the post-tax salaries of all employees along the value chain are summarized. Care should be taken to count only employment directly linked to the product and provided by the organization whose SBV is quantified; hence, the exact quantification may require some research within the organization. In principle, however, there usually exists a single true value for individual wealth created through jobs. In other dimensions, the societal impact needs to be quantified via proxies. Proxies assign a monetary value to a product’s impact, which is not usually measured in monetary units, such as the end user saving time (and money) by using the product. We established a set of reusable proxies for common types of impact, such as valuing one hour of the end user’s time saved as the GDP per hour in the country or region where the end user is located. Similarly, we value each kWh of electricity saved at the social cost of greenhouse gas emissions avoided by saving energy.
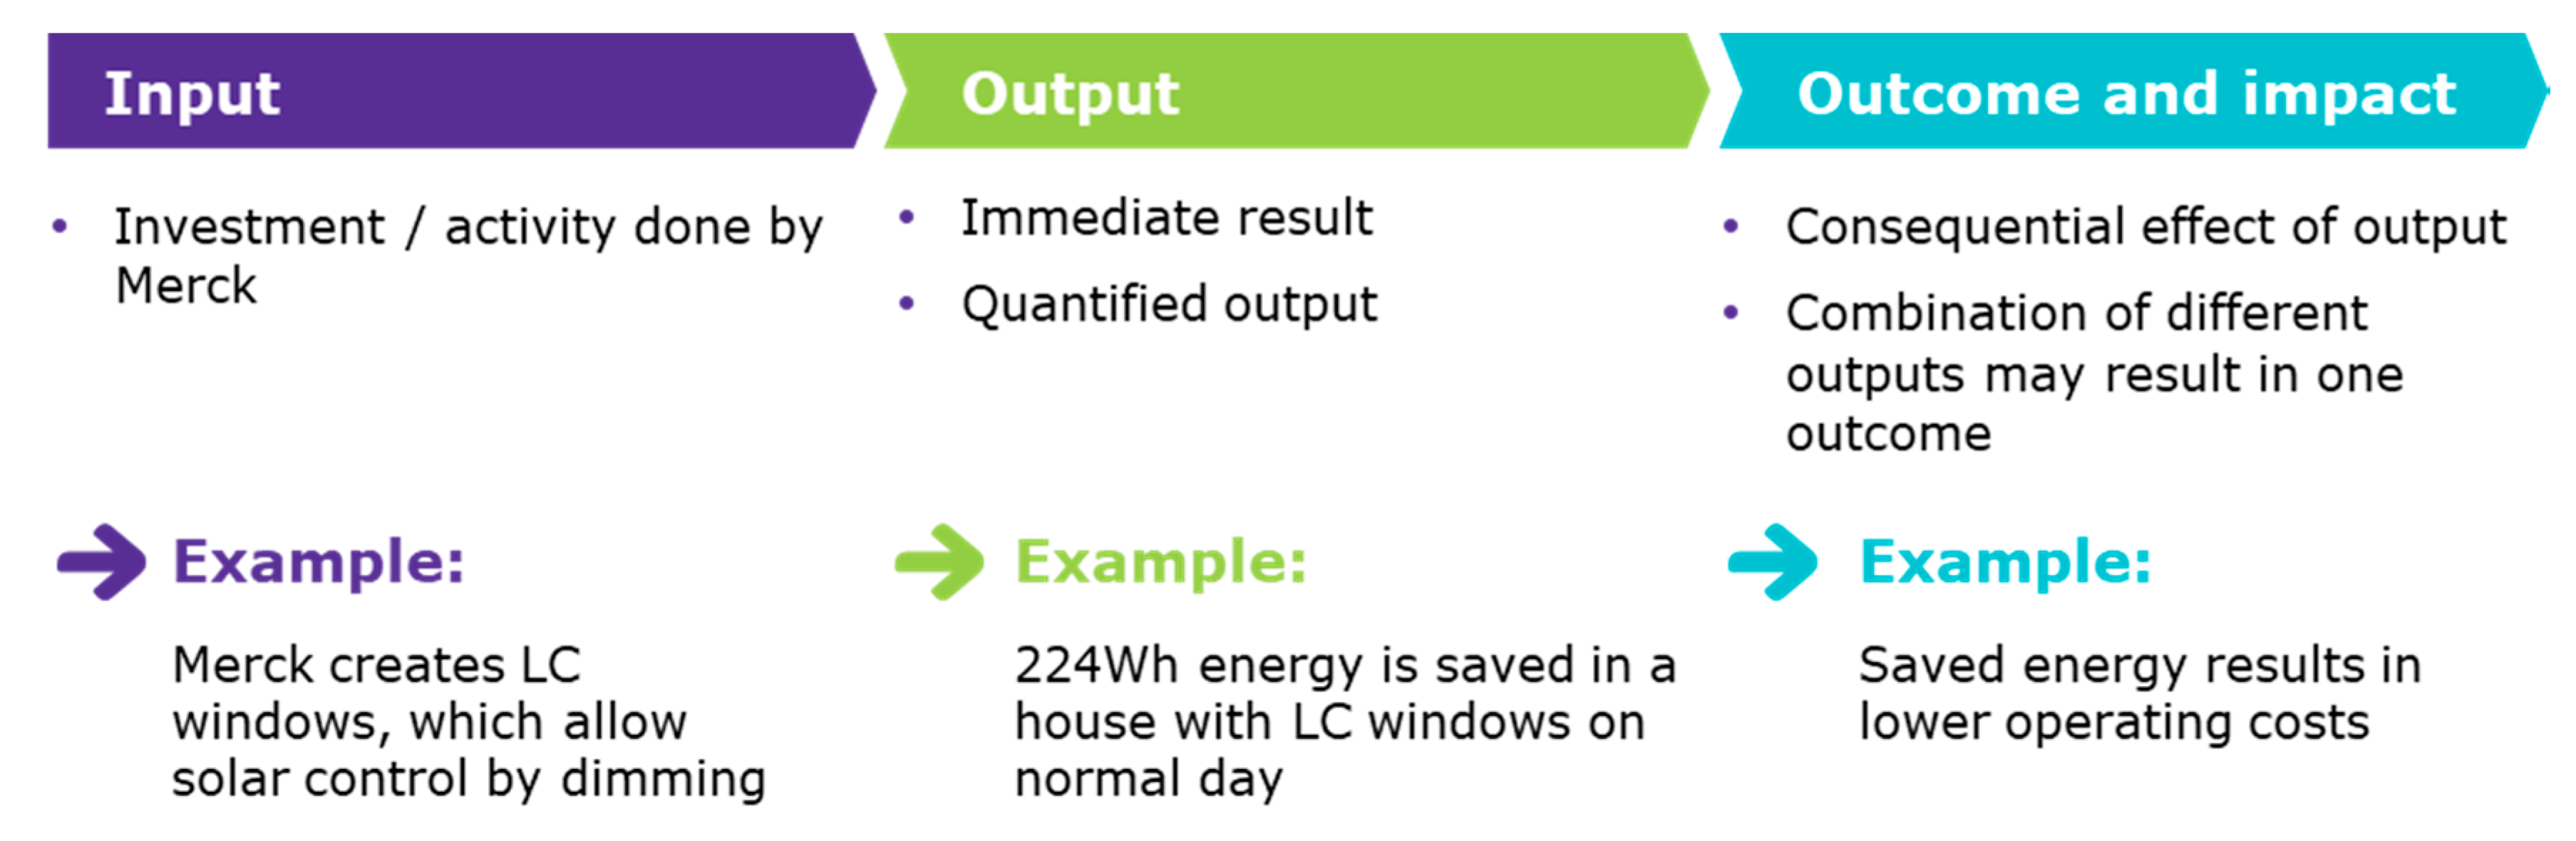
Selecting meaningful, widely applicable proxies can be challenging. We developed a monetary proxy by following a predefined process including three steps,
input–output–outcome, as depicted in
Figure 3.
The
input is a product, such as an insulation layer on a house that saves heating energy. The
output is the societal benefit from this effect, such as the avoided greenhouse gas emissions. The
outcome is the monetary proxy used to value societal benefits, such as the social cost of emissions. Along the steps of input–output–outcome, one should carefully consider the sensitivities introduced into the final impact estimate. For instance, the SBV contributions from energy consumption and efficiency will scale linearly with the value one assumes for the monetarized social cost of emissions. Such sensitivities should be discussed and can be visualized simply by plotting the SBV against the low, middle, and high estimates for the ingoing variable in question. For the social cost of emissions, a low estimate might be the current carbon price of ~25€ per ton of CO
2 set by the European Union Emissions Trading Scheme, while the OECD already demands a middle-ground of ~51€, and high estimates of the true cost can reach up to 100€, according to the Carbon Pricing Leadership Coalition. Sensitivity analyses can be used analytically to understand which assumptions inform the final total monetary societal estimates, as well as for planning purposes to examine which parameters would need adjusting to reach a certain goal, such as carbon neutrality. We list a number of examples for the input, output, outcome, and impact measures for different SBV dimensions in
Table 2.
While the input, output, and outcomes are separately identified for each SBV area, a specific scenario must be defined to establish a common context for quantification. This scenario fixes key variables, such as product quantity, geography, and time of product use. These variables will factor in each area’s quantitative estimate and must thus be fixed to facilitate overall judgement. In principle, these variables can be fixed with arbitrary values. Choosing a specific scenario is a key step in defining what conclusions can and cannot be drawn from the SBV results and hence should be discussed with leaders in depth. For instance, when evaluating a nascent business, one may set the scenario to assume a certain steady state after the initial growth period. While important, the scenario choice must not be absolute; for reporting purposes, cross sections of the data can be made to show the product’s impact in an intuitive setting (e.g., for a single end user).
When the scenario includes product use over a longer period, discounting societal impacts becomes a consideration. As with financial returns, one will usually prefer to achieve the same amount of positive impacts sooner rather than later due to inflation, opportunity cost, and general uncertainty. This time preference indicates that future impacts should be discounted to their net present value (NPV). However, sustainability considerations explicitly demand that we avoid undervaluing society’s future. If we assume that current capital markets do undervalue benefits to society and especially future benefits, the social discount rate may be lower than, for example, the cost of capital in standard NPV calculations. Social discount rates are an open field of research and discussion, with governments and think tanks using different rates. We currently use the expert consensus estimate of a constant social discount rate of 2 percent to discount the SBV in the range of years or decades [
38]. For longer timeframes (for instance, when considering climate change), more complex models are needed to avoid undervaluing societal risks and opportunities [
39].
The freedom to select areas for quantification and define a meaningful scenario while applying standardized SBV dimensions lends immense versatility to the SBV methodology. SBV can be assessed across product types (e.g., devices, services, and platforms), business models (e.g., business-to-consumer (B2C) vs. business-to-business (B2B)), and geographies. SBV areas can then be selected for quantification to highlight what matters most in the relevant context. For instance, the assessment of a business in China may incorporate the Chinese Social Credit Score in the governance dimension. Even before area selection, the process of defining a scenario can shed light on non-obvious product benefits. For instance, the societal impact of a B2B product may only be realized in part by the B2B client. Substantial impacts will likely affect end users with whom the producer has no contact. Identifying end users and quantifying their benefits can provide a compelling narrative for stakeholders such as regulators. If the relevant proxies are chosen, the quantified end user benefit can become a powerful sales pitch for a B2B client. For instance, employees in an office building benefit from architectural features such as offices lit by daylight. Therefore, these employees may become more productive. These end users generate societal impacts that manifest as value for their employer, providing substantial returns on investments in the architectures of their workplaces.
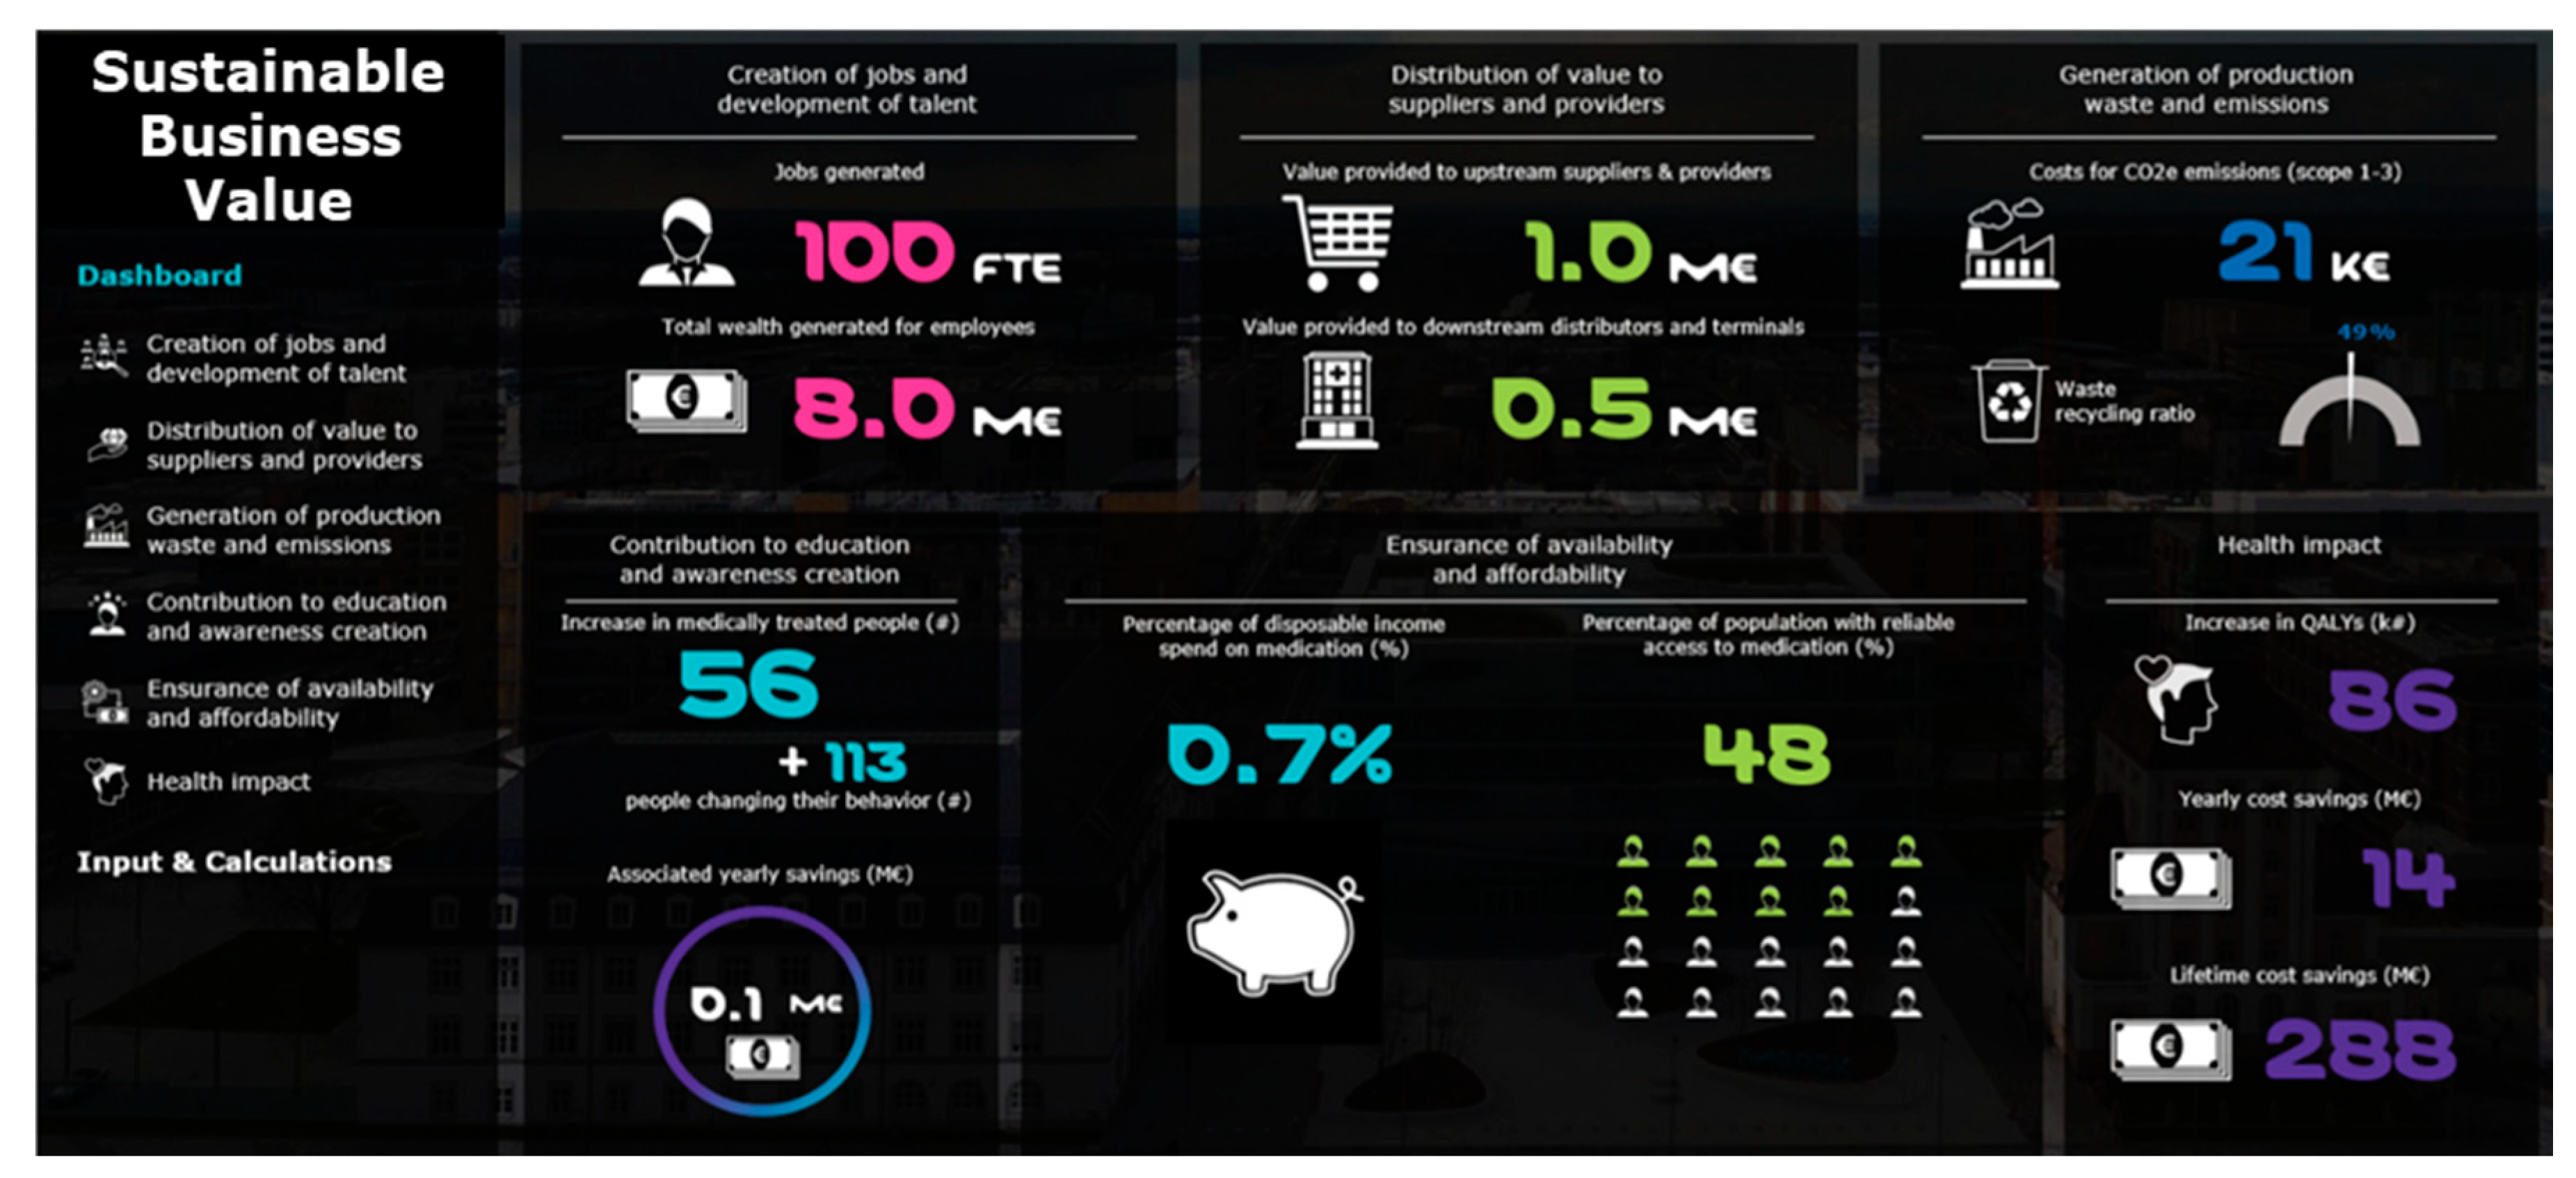
The versatility of the SBV methodology is further increased by its output format. If SBV is reported as a dashboard of absolute monetary values, comparisons can be made ex post in relevant areas. For instance, one can return to assess the relative societal impact of a business activity in relation to a newly identified alternative. One simply pulls the appropriate absolute number from the dashboard and performs the corresponding calculation for the alternative.
Figure 4 shows an example SBV dashboard for a healthcare activity.
4. Results
To pilot the SBV measurement, Merck’s type 2 diabetes prevention program in China was chosen. This is a business-to-customer (B2C) product in the healthcare line of operations of the company. This product was chosen for a pilot, because diabetes prevention is high on the agenda of many societies, addressing a globally growing need for healthier living. In addition, China is one of the largest and growing markets for Merck. Finally, according to the International Diabetes Federation, China is the country with the largest number of diabetic people in the world, with 116 million diabetics in 2019. In addition, up to 55 million of Chinese have impaired glucose tolerance. If left unaddressed, impaired glucose tolerance can lead to type 2 diabetes in a significant proportion of patients.
Merck’s prevention program for diabetes in China encompasses a variety of measures (e.g., lifestyle changes, nutrition, and awareness campaigns aimed at the general population and at health care professionals) that go beyond the traditional focus on treating a disease with medication (“beyond the pill” activities). The benefits of these “beyond the pill” activities for the wider society are usually not captured in more traditional health economic analyses. For these activities, we applied the SBV methodology along the entire value chain to capture the various dimensions and areas in which Merck is creating impact in China.
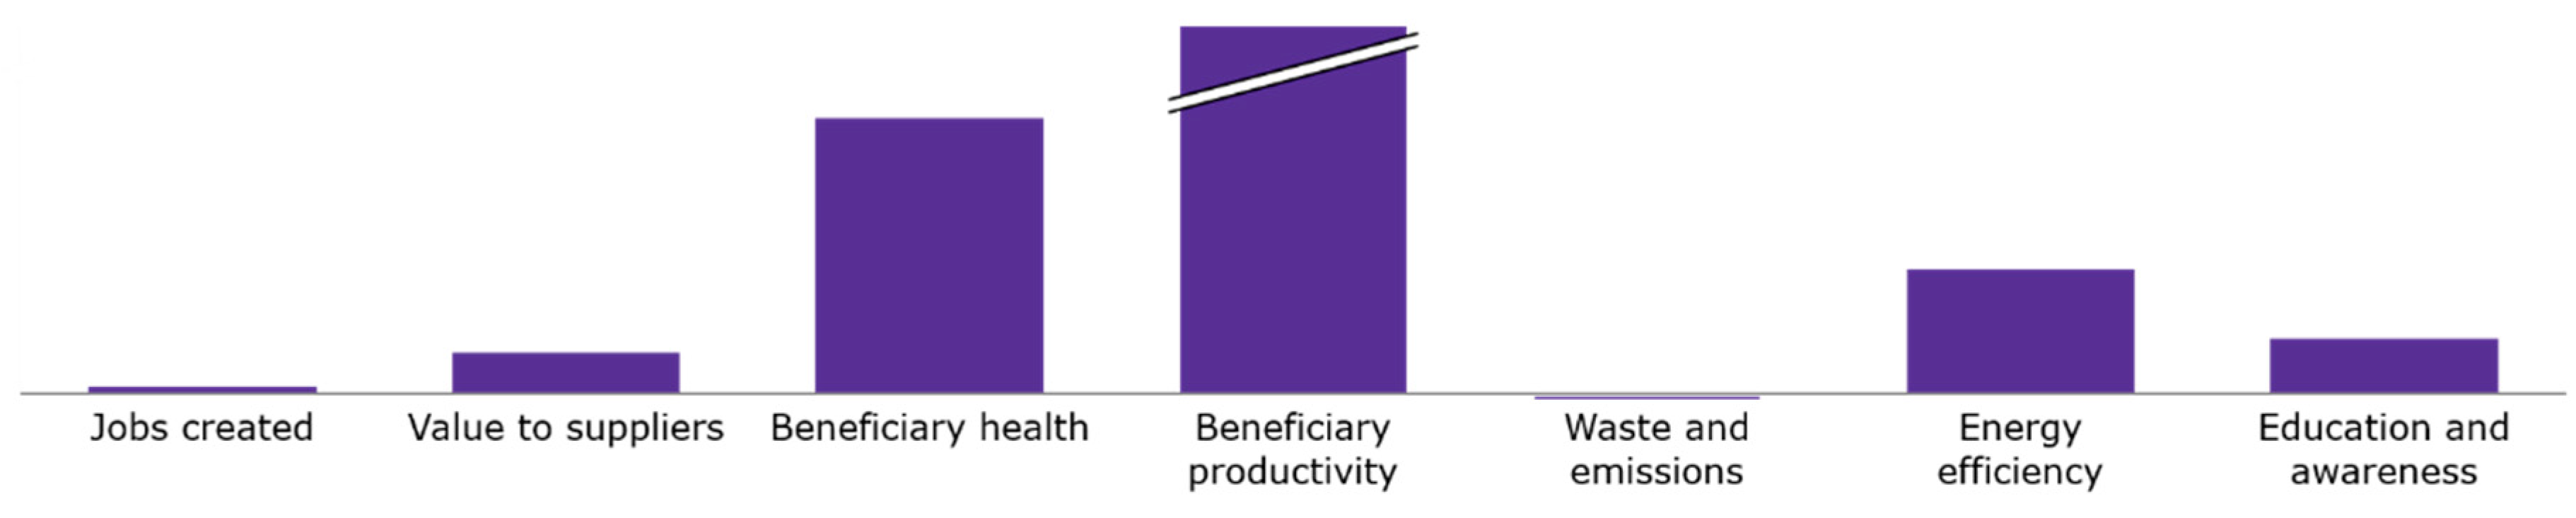
This type 2 diabetes prevention program was analyzed across the following prioritized SBV areas: jobs created and value distributed to suppliers and other local partners (the economic dimension), waste and emissions of production (the environmental dimension), benefits from medication (the consumer well-being dimension), benefits from increased awareness and education, and availability and affordability for patients (the societal enablement dimension). The largest SBV contributions were generated for patients who were reached with medication and educational programs, followed by educational programs, which raised awareness on type 2 diabetes prevention, improved well-being, and drove healthy lifestyle changes among the 40–60% of Chinese people who are at risk of diabetes. In line with the “Healthy China 2030” plan and supporting the Chinese authorities’ goals [
40]., our SBV analysis showed that Merck could not only contribute to population health and efficient use of the public health resources but would also drive economic value for both Chinese suppliers and employees, while striving for environmental and social sustainability.
To further validate the SBV approach in a B2B setting in the life sciences area of Merck’s operations, a second pilot was chosen: liquid crystal windows (LC windows). This dynamic glass facilitates the on-demand and automatic, fast, step-less regulation of sun irradiation levels without blocking daylight or view. Through their color neutrality, shape freedom, and switching speed, LC windows outperform other dynamic glazing technologies like electrochromic, thermochromic, and suspended particle devices. Again, six areas from the LC windows value chain were prioritized for the SBV assessment: jobs created (economic value), value distributed to suppliers (economic value), waste and emissions of production (environmental value), creation of resource and energy efficiency (environmental value), impact on health and productivity (consumer well-being), and benefits from education, awareness creation, and knowledge building (societal enablement dimension). The SBV analysis highlighted substantial benefits from increased office worker productivity and health (“light wellness”). For example, office workers with increased daylight and with views to the outdoor save about one week per worker per year through increased productivity and reduced sick leave. In addition, substantial further contributions from energy efficiency were calculated.
Figure 5 shows the relative SBV values for this pilot.
In both pilots of the SBV methodology, similar calculation logic was used for B2B (LC windows) and B2C (the type 2 diabetes prevention program) products for both the economic and environmental dimensions. The key difference was visible in societal enablement and consumer benefit. In the case of the B2C project (healthcare), the customer benefit was determined directly from customer medication, while the societal enablement benefit consisted of avoiding healthcare costs. On the other hand, B2B projects require other assumptions for beneficiary numbers and proxies for quantification. For example, education, knowledge building, and awareness creation in a B2B setting will usually target B2B customers rather than the ultimate beneficiaries.
For management teams, SBV estimates may be an informative, even intellectually entertaining, exercise. In stakeholder interactions, SBV provides arguments to maintain a social license to operate. Occasionally, the quantification exercise will also spawn a compelling marketing narrative. However, is there a financial case for incorporating SBV into a company’s strategy beyond assessing the status quo? This methodology readily highlights levers for maximizing SBV or ameliorating negative impacts, as the calculations show which variables drive the result. How will shareholders see these points—as opportunities or liabilities?
There are two mechanisms by which business decisions that increase SBV will also increase total shareholder returns (TSR). Moreover, in these cases, SBV serves as a proxy for long-term TSR that may otherwise be hard to quantify. As a proxy for long-term TSR, SBV thus facilitates decision-making towards sustainable growth.
The first mechanism through which SBV increases TSR is via the bottom line. Simply put, people are willing to pay for positive societal impacts. Such bottom-line increases happen if an increased societal impact also augments product worth for the end user. For instance, a banking app designed to be easier and quicker to use than the alternatives will have a positive societal impact by saving the end user’s productive time. Users may be willing to pay for these benefits directly. Taking the idea of SBV’s impact on the bottom line further, the end user and the party for whom the product’s worth is augmented can also be separated. This separation is common in the pharmaceutical industry. Pharmaceuticals positively impact society by improving patient health but are purchased by insurance companies. Insurance companies value alternative treatments by how much they reduce long-term healthcare spending. A new medication with superior health outcomes may, thus, be worth a premium to the payer, thereby augmenting the pharmaceutical company’s TSR and benefitting the insurer in a win–win situation.
A second mechanism by which SBV can protect or augment TSR is by averting negative impacts. For example, a product may have a negative SBV because it uses an emission-intensive technology. Improving this technology to reduce emissions would clearly increase the SBV. This benefit translates into TSR if one considers the trend towards increased carbon prices and other regulations to disincentivize the use of emission-intensive technologies. Such regulations would likely deter customers, with a negative impact on the TSR that can be avoided by decreasing emissions. The TSR might be further increased, as a business that actively tackles the climate challenge will secure its social license to operate and thereby increase its competitive position. While emission-intensive competitors will lose their market share and revenue streams, thus improving the results for players with an SBV-driven strategy.
There is a variation of the second mechanism, where measures to increase SBV will decrease the likelihood of future negative impacts: supply chain management. Environmentally and socially responsible supply chain options usually source their raw materials and services closer to the end market. Such options simply lower disruption risks, such as increases in distance and transparency. Even when reliant on long-distance business relationships, supply chains can be modified to increase their SBV through social contributions, governance, and employee education. The positive societal impacts will, in turn, support regional increases in resilience to weather and political disruption and thus stabilize the supply chain.
Beyond directly augmenting TSR, an SBV-driven strategy can also inspire employee productivity, engagement, and improve the recruiting and retention of valuable talent. This is because measures that increase SBV will often be in line with a company’s purpose, whether that purpose is an explicit, well-defined statement or more of a perceived sense of purpose among employees and other stakeholders [
41]. The synergies between discovering or augmenting one’s purpose and assessing SBV hinge on the concept of societal needs. While discovery of a company’s purpose starts with the question “what societal needs are we addressing?”, SBV offers a quantification of how well a company’s products address societal needs and thereby live up to their purpose. SBV can also highlight how products might be improved to increase their societal impact, thereby augmenting a company’s purpose as societal needs become met more fully. Beyond the impact of commercial products, SBV and purpose considerations also synergize when it comes to shaping corporate philanthropy. A quantitative SBV lens will favor programs that leverage a company’s unique capabilities and thus offer the best returns in impact per dollar invested in philanthropy. Similarly, corporate initiatives best serve to inspire employees and other stakeholders with a compelling narrative when they build on what the company does in its day-to-day business.
As the SBV methodology becomes more widely used, we hope to see the above mechanisms in action. Until data become available on how much an SBV-driven strategy can augment TSR, we must look to related concepts for evidence. For instance, the positive correlation between performance in ESG metrics and valuation multiples and returns [
37] indicates that sustainable business conduct does, indeed, pay off in financial terms.
5. Discussion
Every company has positive and negative environmental, social, and economic impacts on the world. We refer to these as SBV, which can provide a quantitative measure of stakeholder value. The strengths of SBV are that this method can be used to evaluate not just individual development projects but also products already on the market (to develop additional value propositions or identify new business opportunities), entire companies (for instance, in a merger and acquisition context or for the selection of partners for an innovation hub or accelerator), and sites (in interactions with regulatory stakeholders/municipalities). Investors and other company stakeholders can use SBV both internally and externally.
Merck has successfully applied the SBV methodology to measure its planned type 2 diabetes prevention program in China and its liquid crystal windows (LC windows) product. In both cases, Merck was able to demonstrate significant SBV via its direct product benefits and via related education and awareness programs. The SBV analysis helped to outline further business opportunities that could increase the total SBV.
Regarding current limitations, the SBV, as described here, solves some challenges, but there is still room for development. The standardization of proxies through an independent entity (e.g., the WHO defining how health benefits at the societal level should be quantified) could help in diffusing the SBV methodology across companies. Further research into the trade-off between different dimensions of SBV is also needed, such as how we should compare the value of avoiding emissions using the resulting health benefits. Moreover, we currently only include some dimensions of SBV, such as example availability and affordability, as enablers in the SBV model. More in-depth thinking is needed on whether and how to quantify these enablers.
Secondly, SBV as described here was developed and adapted for Merck and its products. Although the SBV method can be used at a product or technology level, and therefore be applied by companies of different sizes, including smaller and medium enterprises, other companies may have different foci and business models. For example, for business-to-consumer companies, the benefits from an end-consumer perspective are usually large, whereas in business-to-business settings, the end beneficiaries themselves often need to be determined. Moreover, Merck’s activity in healthcare results in a focus on knowledge and awareness-raising value. However, other companies might apply the SBV to different activities and value creation mechanisms. For example, a consumer product designer may choose to design for maximum SBV by selecting materials for ethical recyclability (for example, using just one material in shoe manufacturing). A logistics-heavy business may choose supply chain options for maximum SBV (such as by weighing the environmental impact of added weight during transport vs. reductions in recycling costs for glass vs. plastic bottles). Prospective founders with altruistic motives (individuals and governments) may compare different for-profit and non-profit business models.
Thirdly, some more far-reaching applications of this method are possible but would require cross-industry standards. Specifically, fund managers and other investors could use SBV to perform comparisons across companies and industries and to define SBV thresholds for inclusion in sustainable investment strategies. Governments could incorporate SBV estimates into how they tax businesses or products and adjust taxation to reward businesses who pay for their use of public goods through SBV. SBV offers practical guidance for companies and their stakeholders to provide a true and valid picture of Sustainable Business Value.
Finally, in addition to the developed six dimensions of sustainable business value, we considered digital impact as an additional under-researched key dimension. Digitalization will transform people’s lives and society. The use of digital science and digital tools (e.g., the rapid progress of Artificial Intelligence) might have an increasingly significant impact. For example, digitalization could impact the human rights of workers in both positive and negative ways. This aspect should thus become part of future investigations.


