Walkable Urban Environments: An Ergonomic Approach of Evaluation


Abstract
1. Introduction
2. The Human–Environment Interface to Link Ergonomics and Sustainability
2.1. An Approach to Urban Ergonomics Indicators
- The conventional walkability exercise: a walkability list is designed to assess a set of performances according to the perception of the urban spaces walked by the exercise participants (surveyors, interviewees); each item in the list is weighted and scored, so as to identify a rank of performance which may enable/hinder people walk the surveyed areas (typically a very specific origin/destination path, e.g., home-to-school) and decide whether they are walkable, and to what extent. To progress beyond this practice, walkability lists can be associated with weighted indicators, for which a range of performance targets are set. Performance targets, in turn, are reported according to threshold and optimal values. Surveyors can score the listed indicators and success can be claimed only when the performance targets are achieved.
- The study of walkability variables: after the detailed survey and the creation of the walkability list, the indicators are interpreted in terms of variables describing the dynamic relationships between the characteristics of the surveyed areas and the behaviour of their inhabitants. The variables can be disassembled and classified in terms of requirement/performance analysis within a BNets process. This gives rise to a structured system of variables classified in terms of needs, requirements and performance.
- Pp = performance score (e.g., A1);
- a,b,c = scores of the individual indicators calculated by the surveyors (e.g., A1.1, A1.2, A1.3);
- w1, w2, w3 = weights attributed to each indicator (e.g., wA1.1, wA1.2, wA1.3).
2.1.1. The Performance–Requirement Matrix
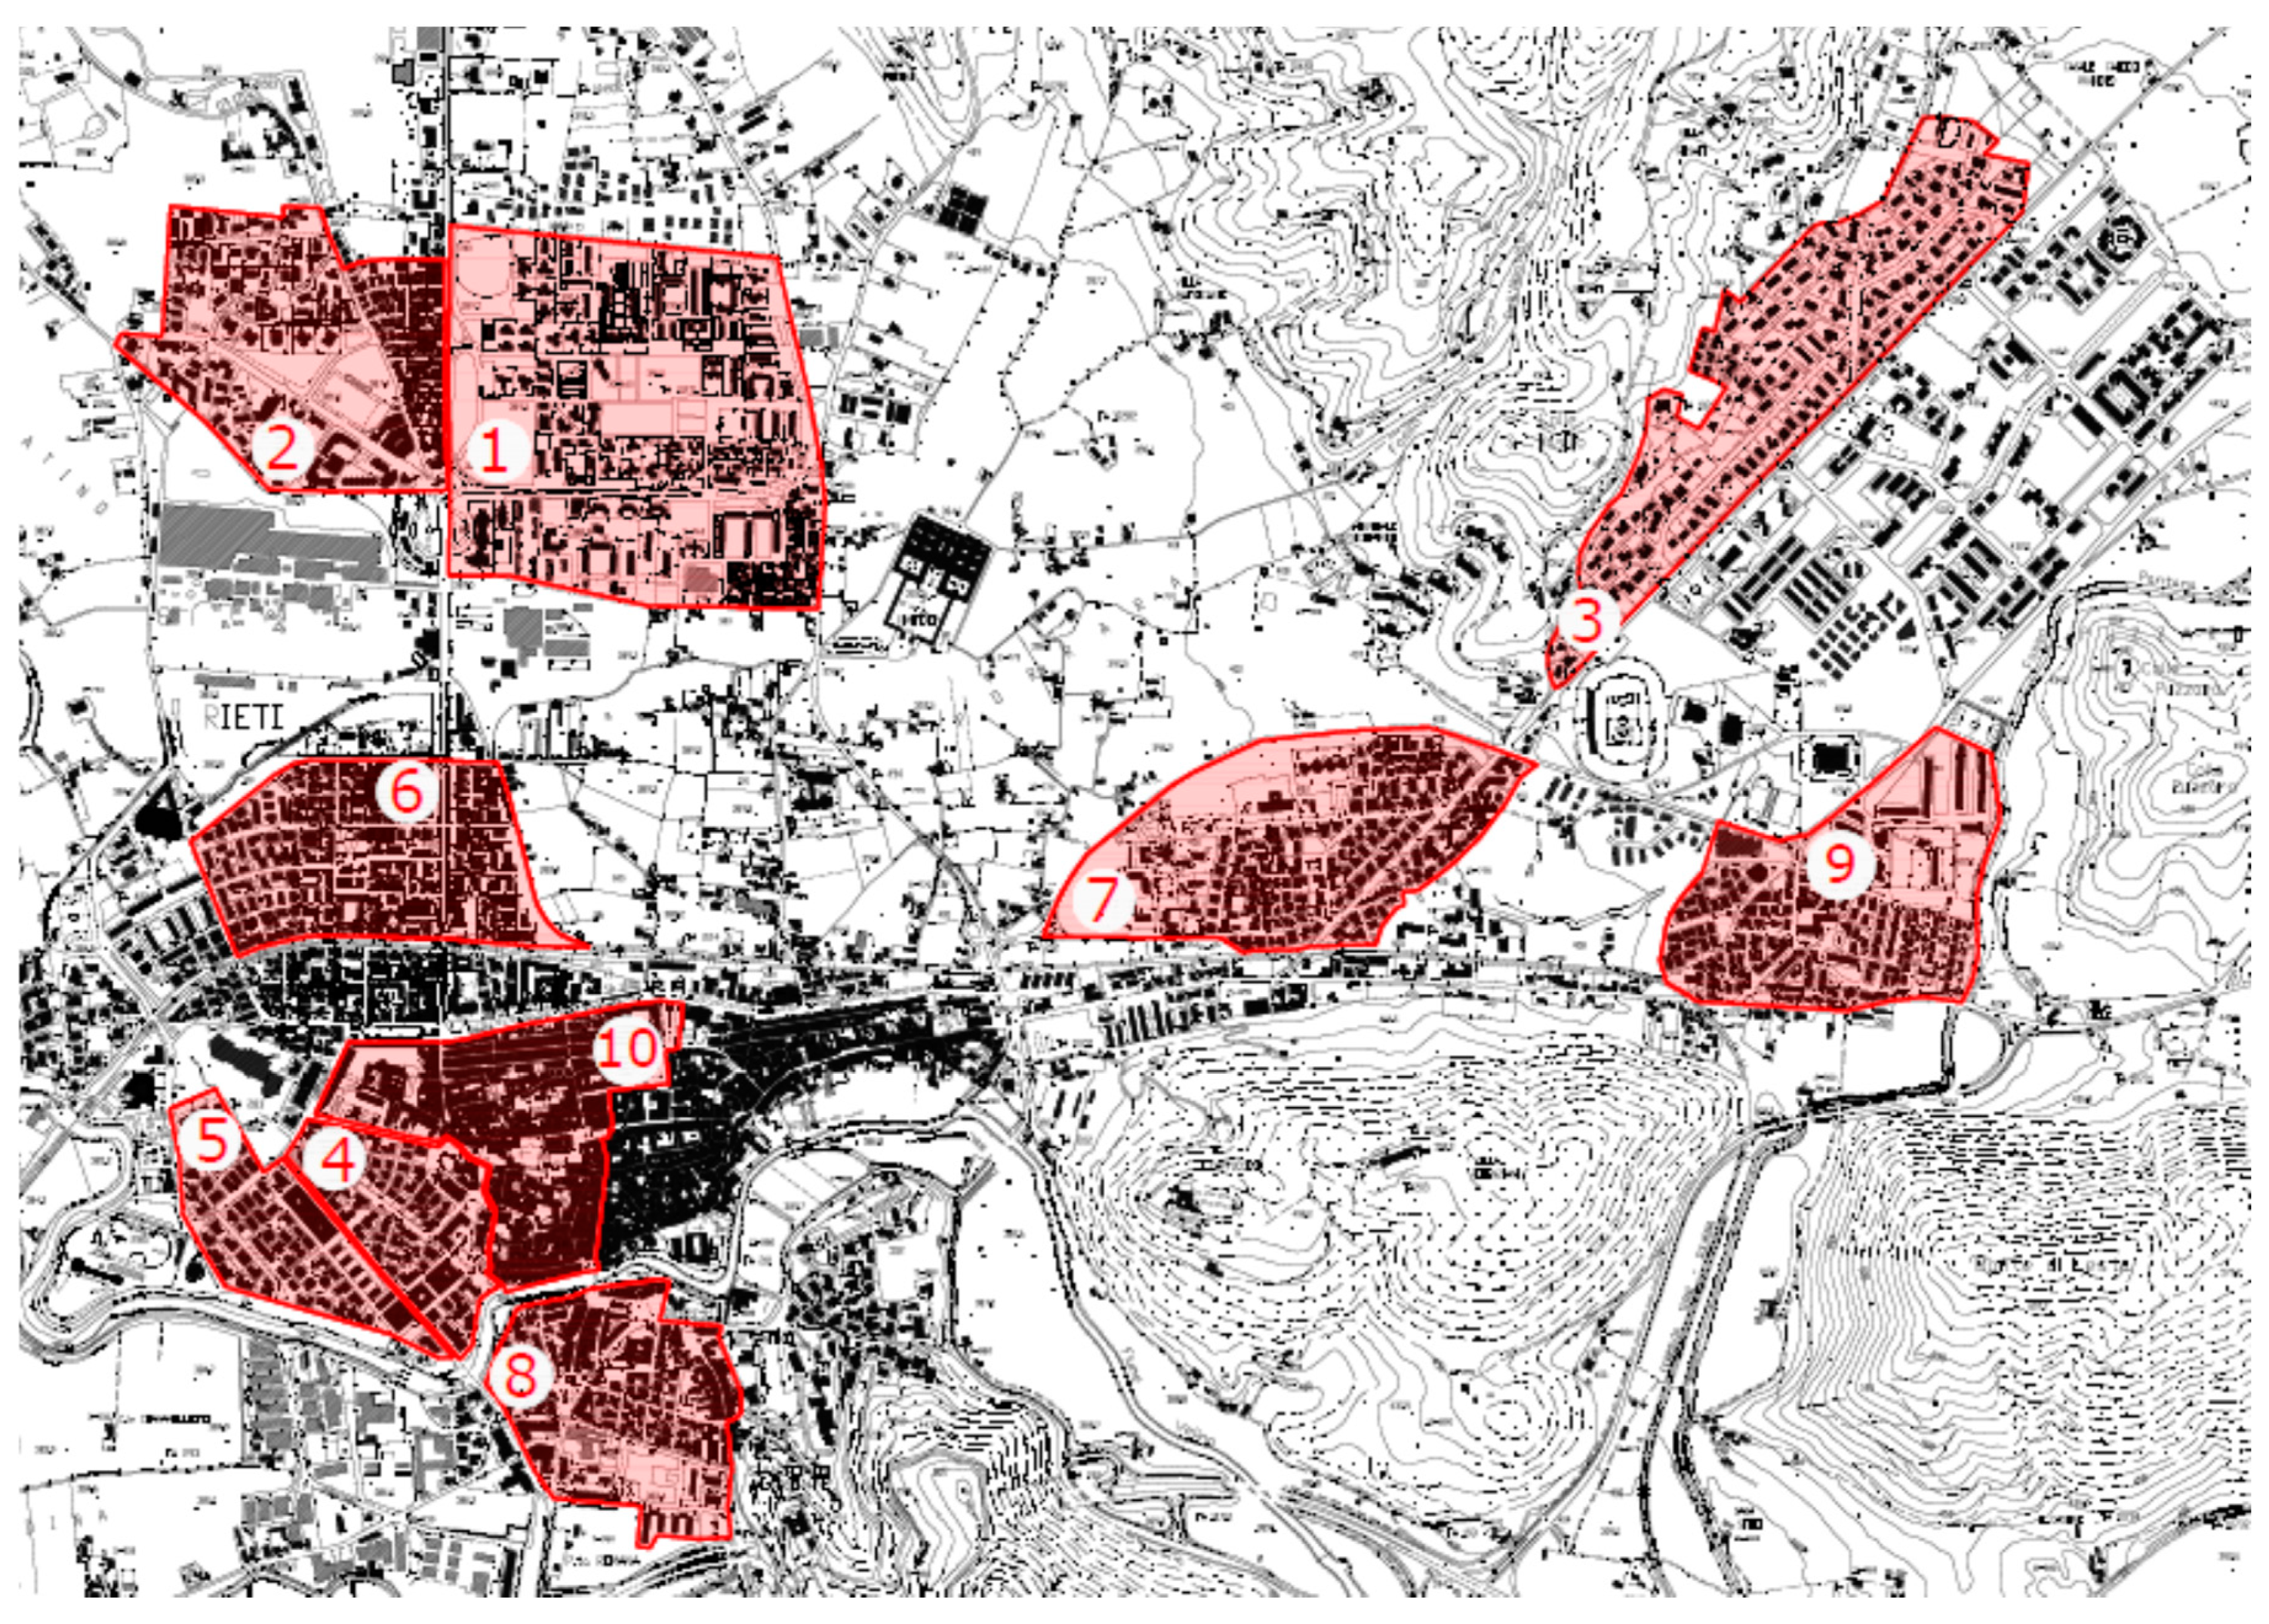
2.2. The Case Study
2.3. The Data Collection
3. The Bayesian Network Model
- Structural modelling: consisting of the definition of the model structure, which was carried out by determining the conditional independency among the variables;
- Dependency modelling: by calculating of the strength of conditional dependency among the variables.
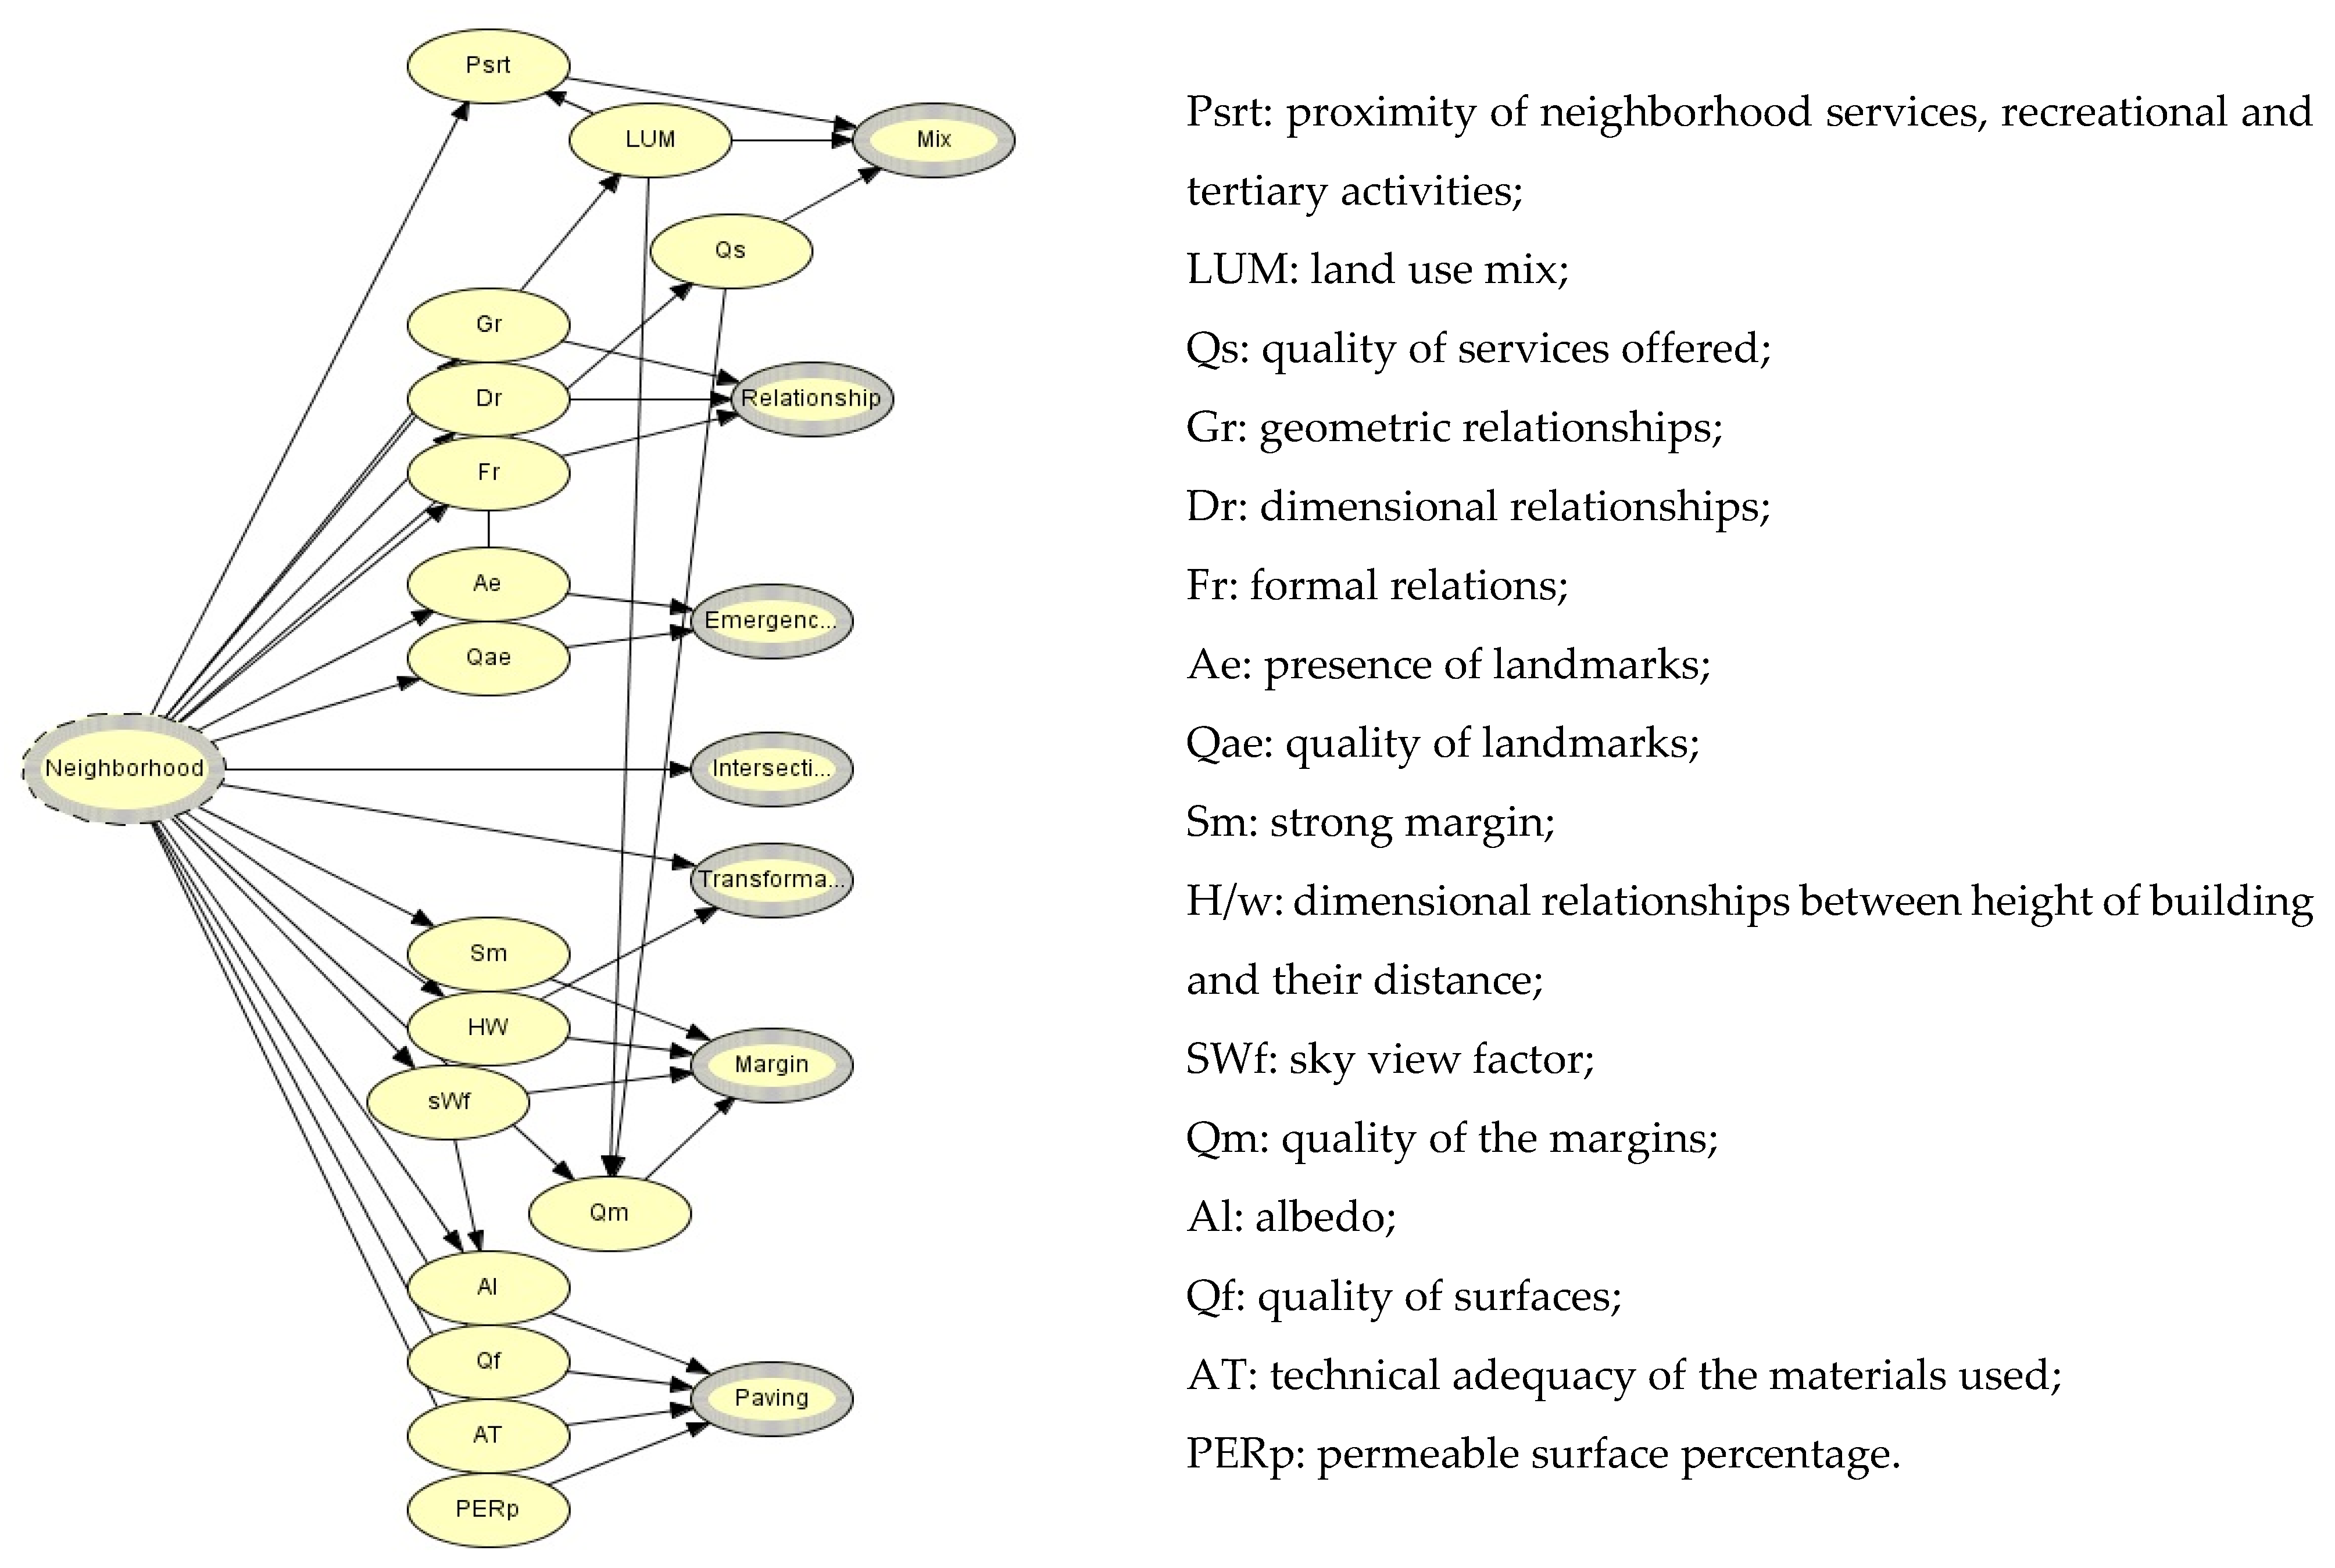
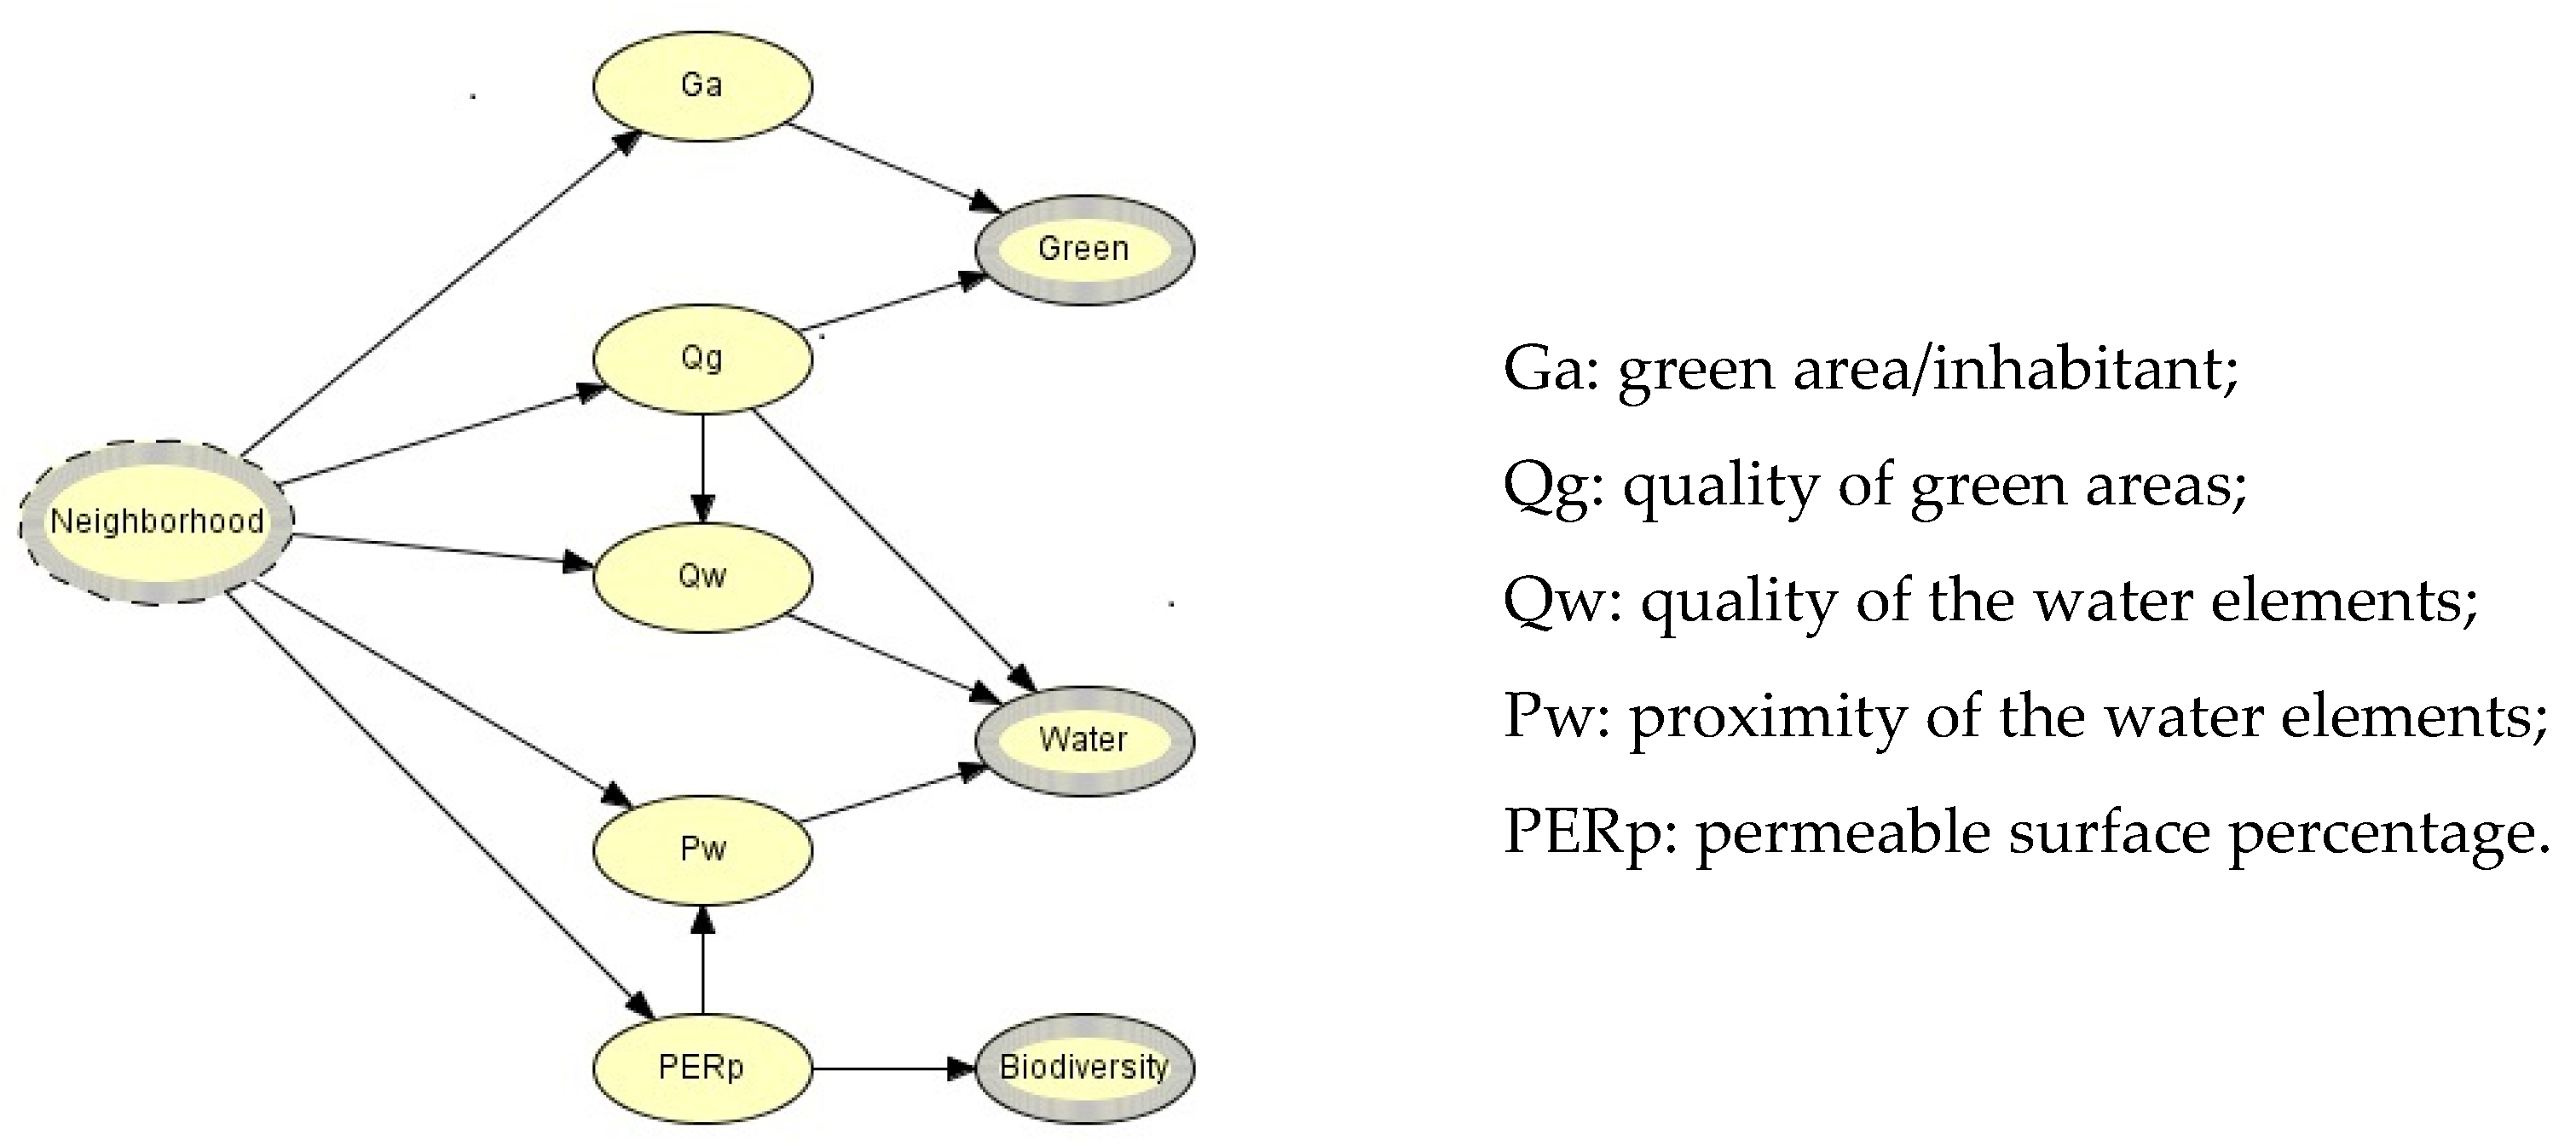
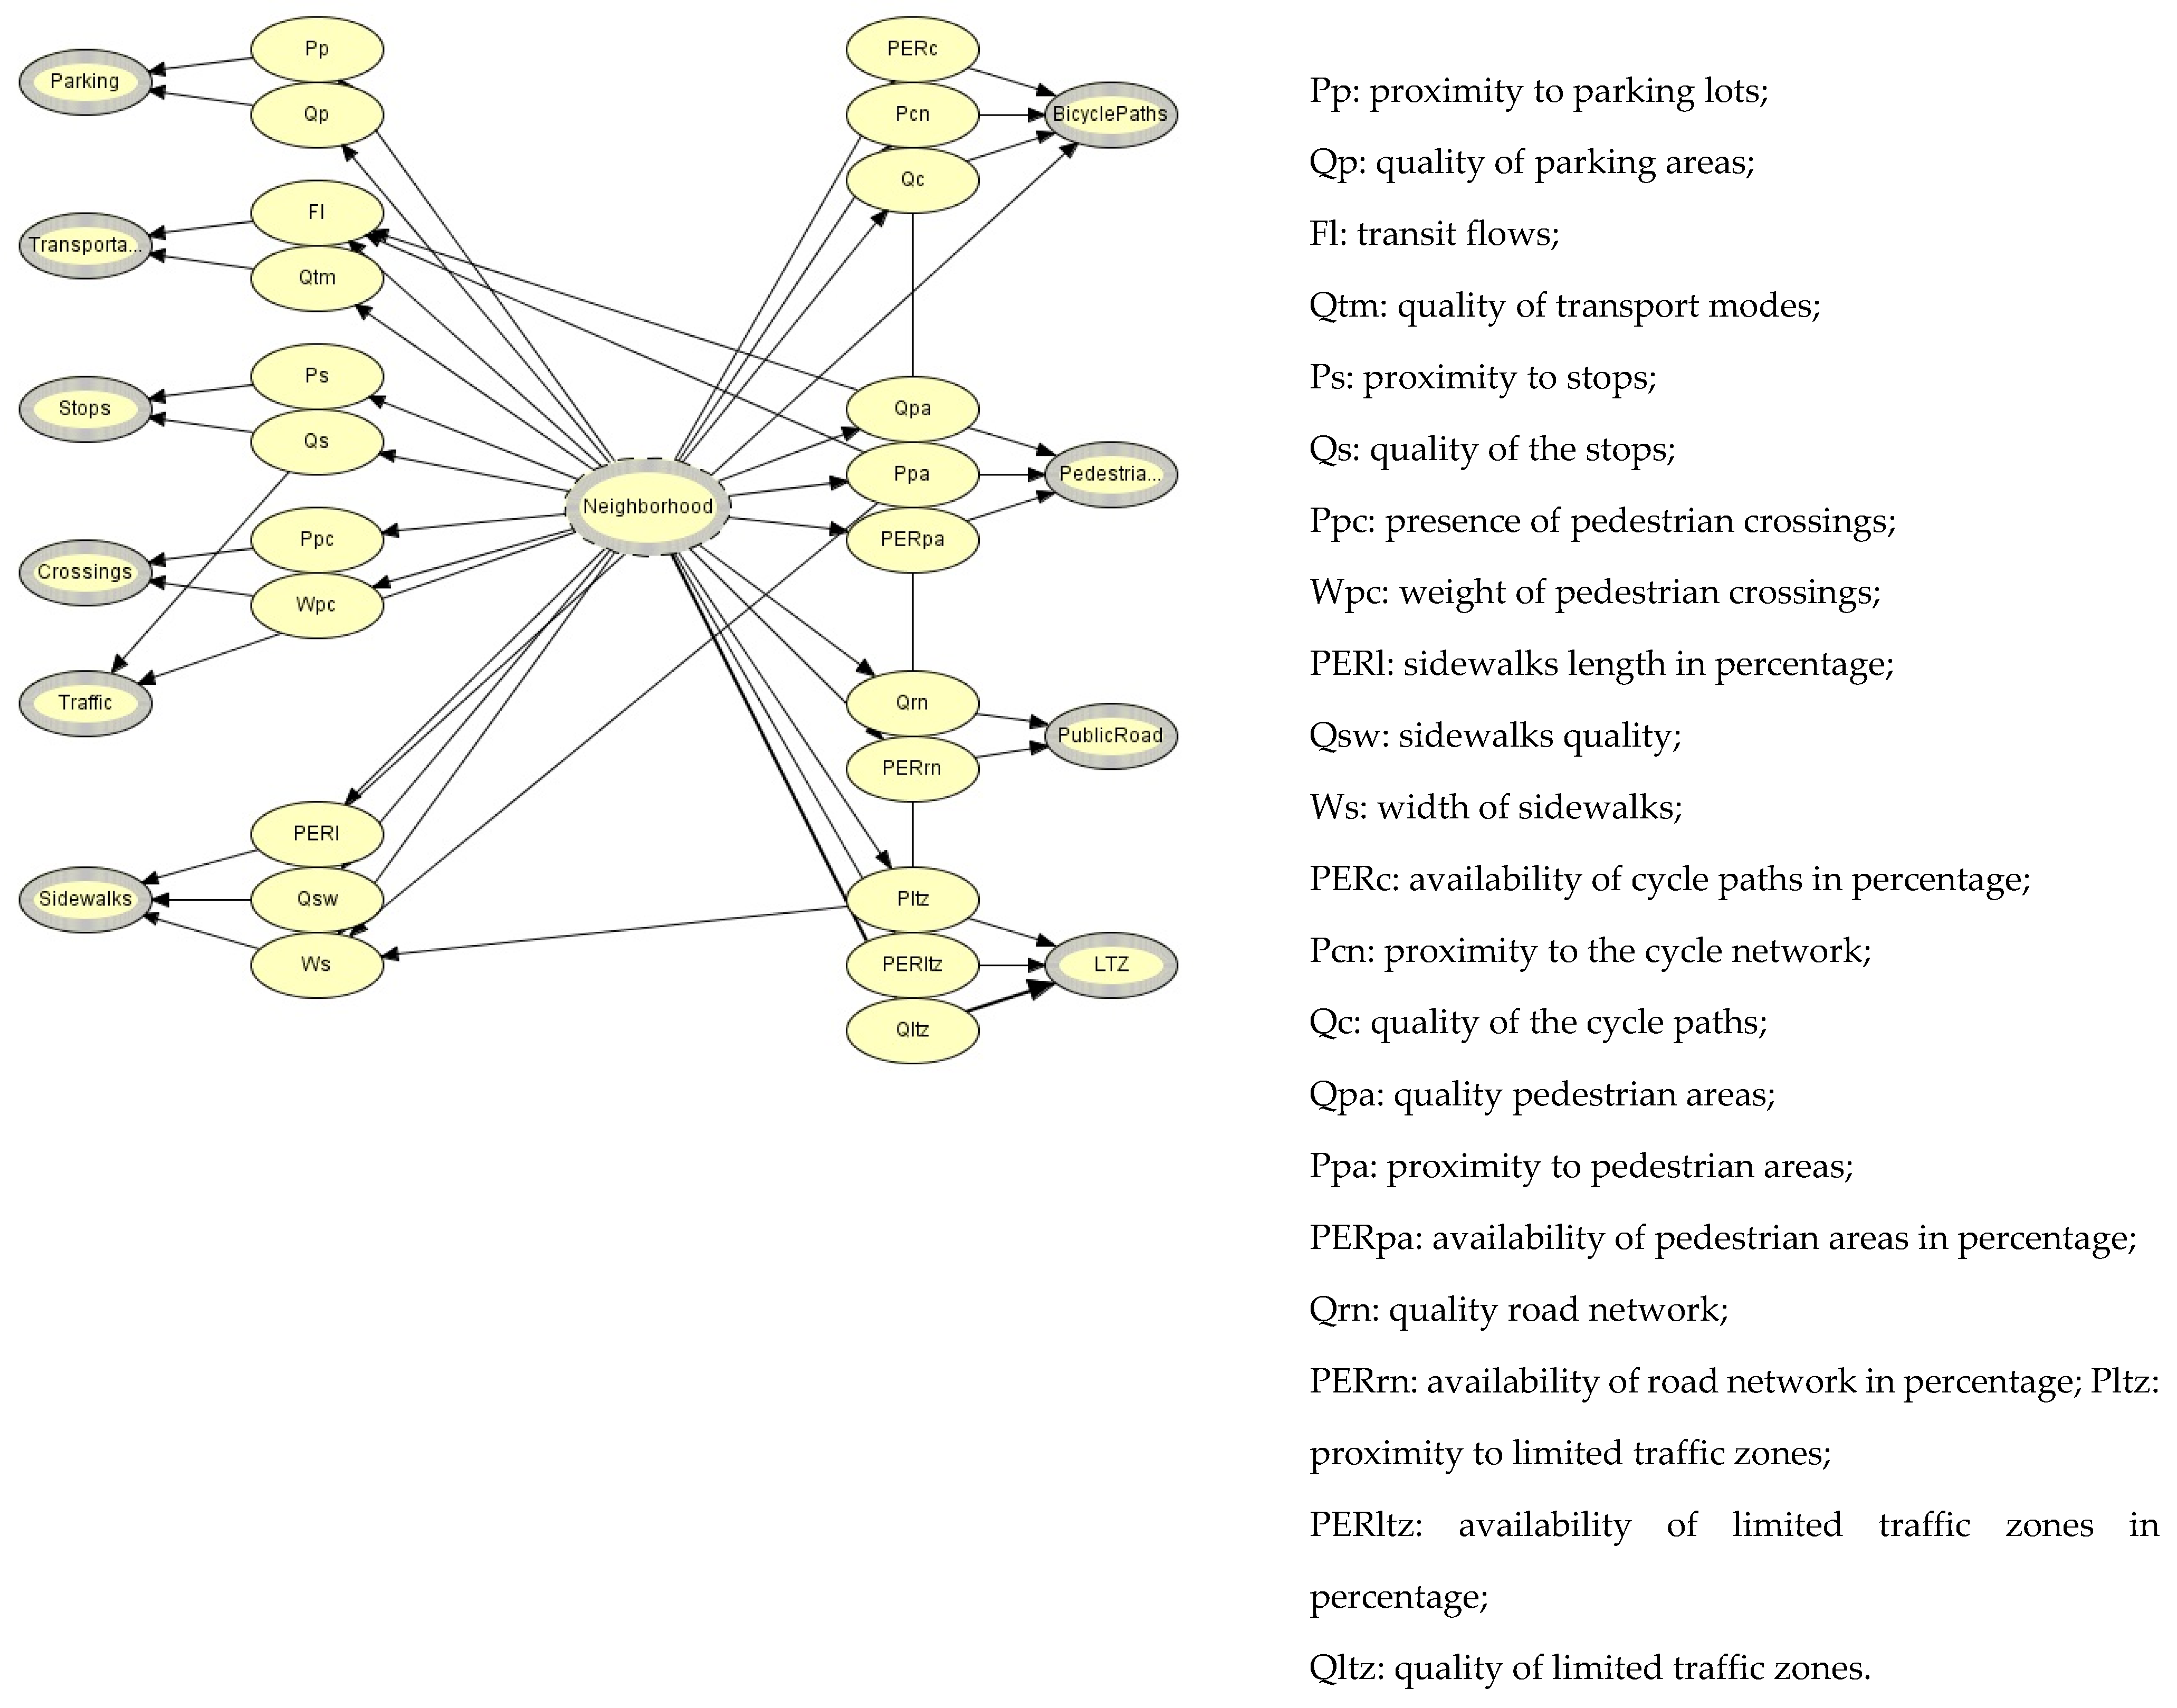
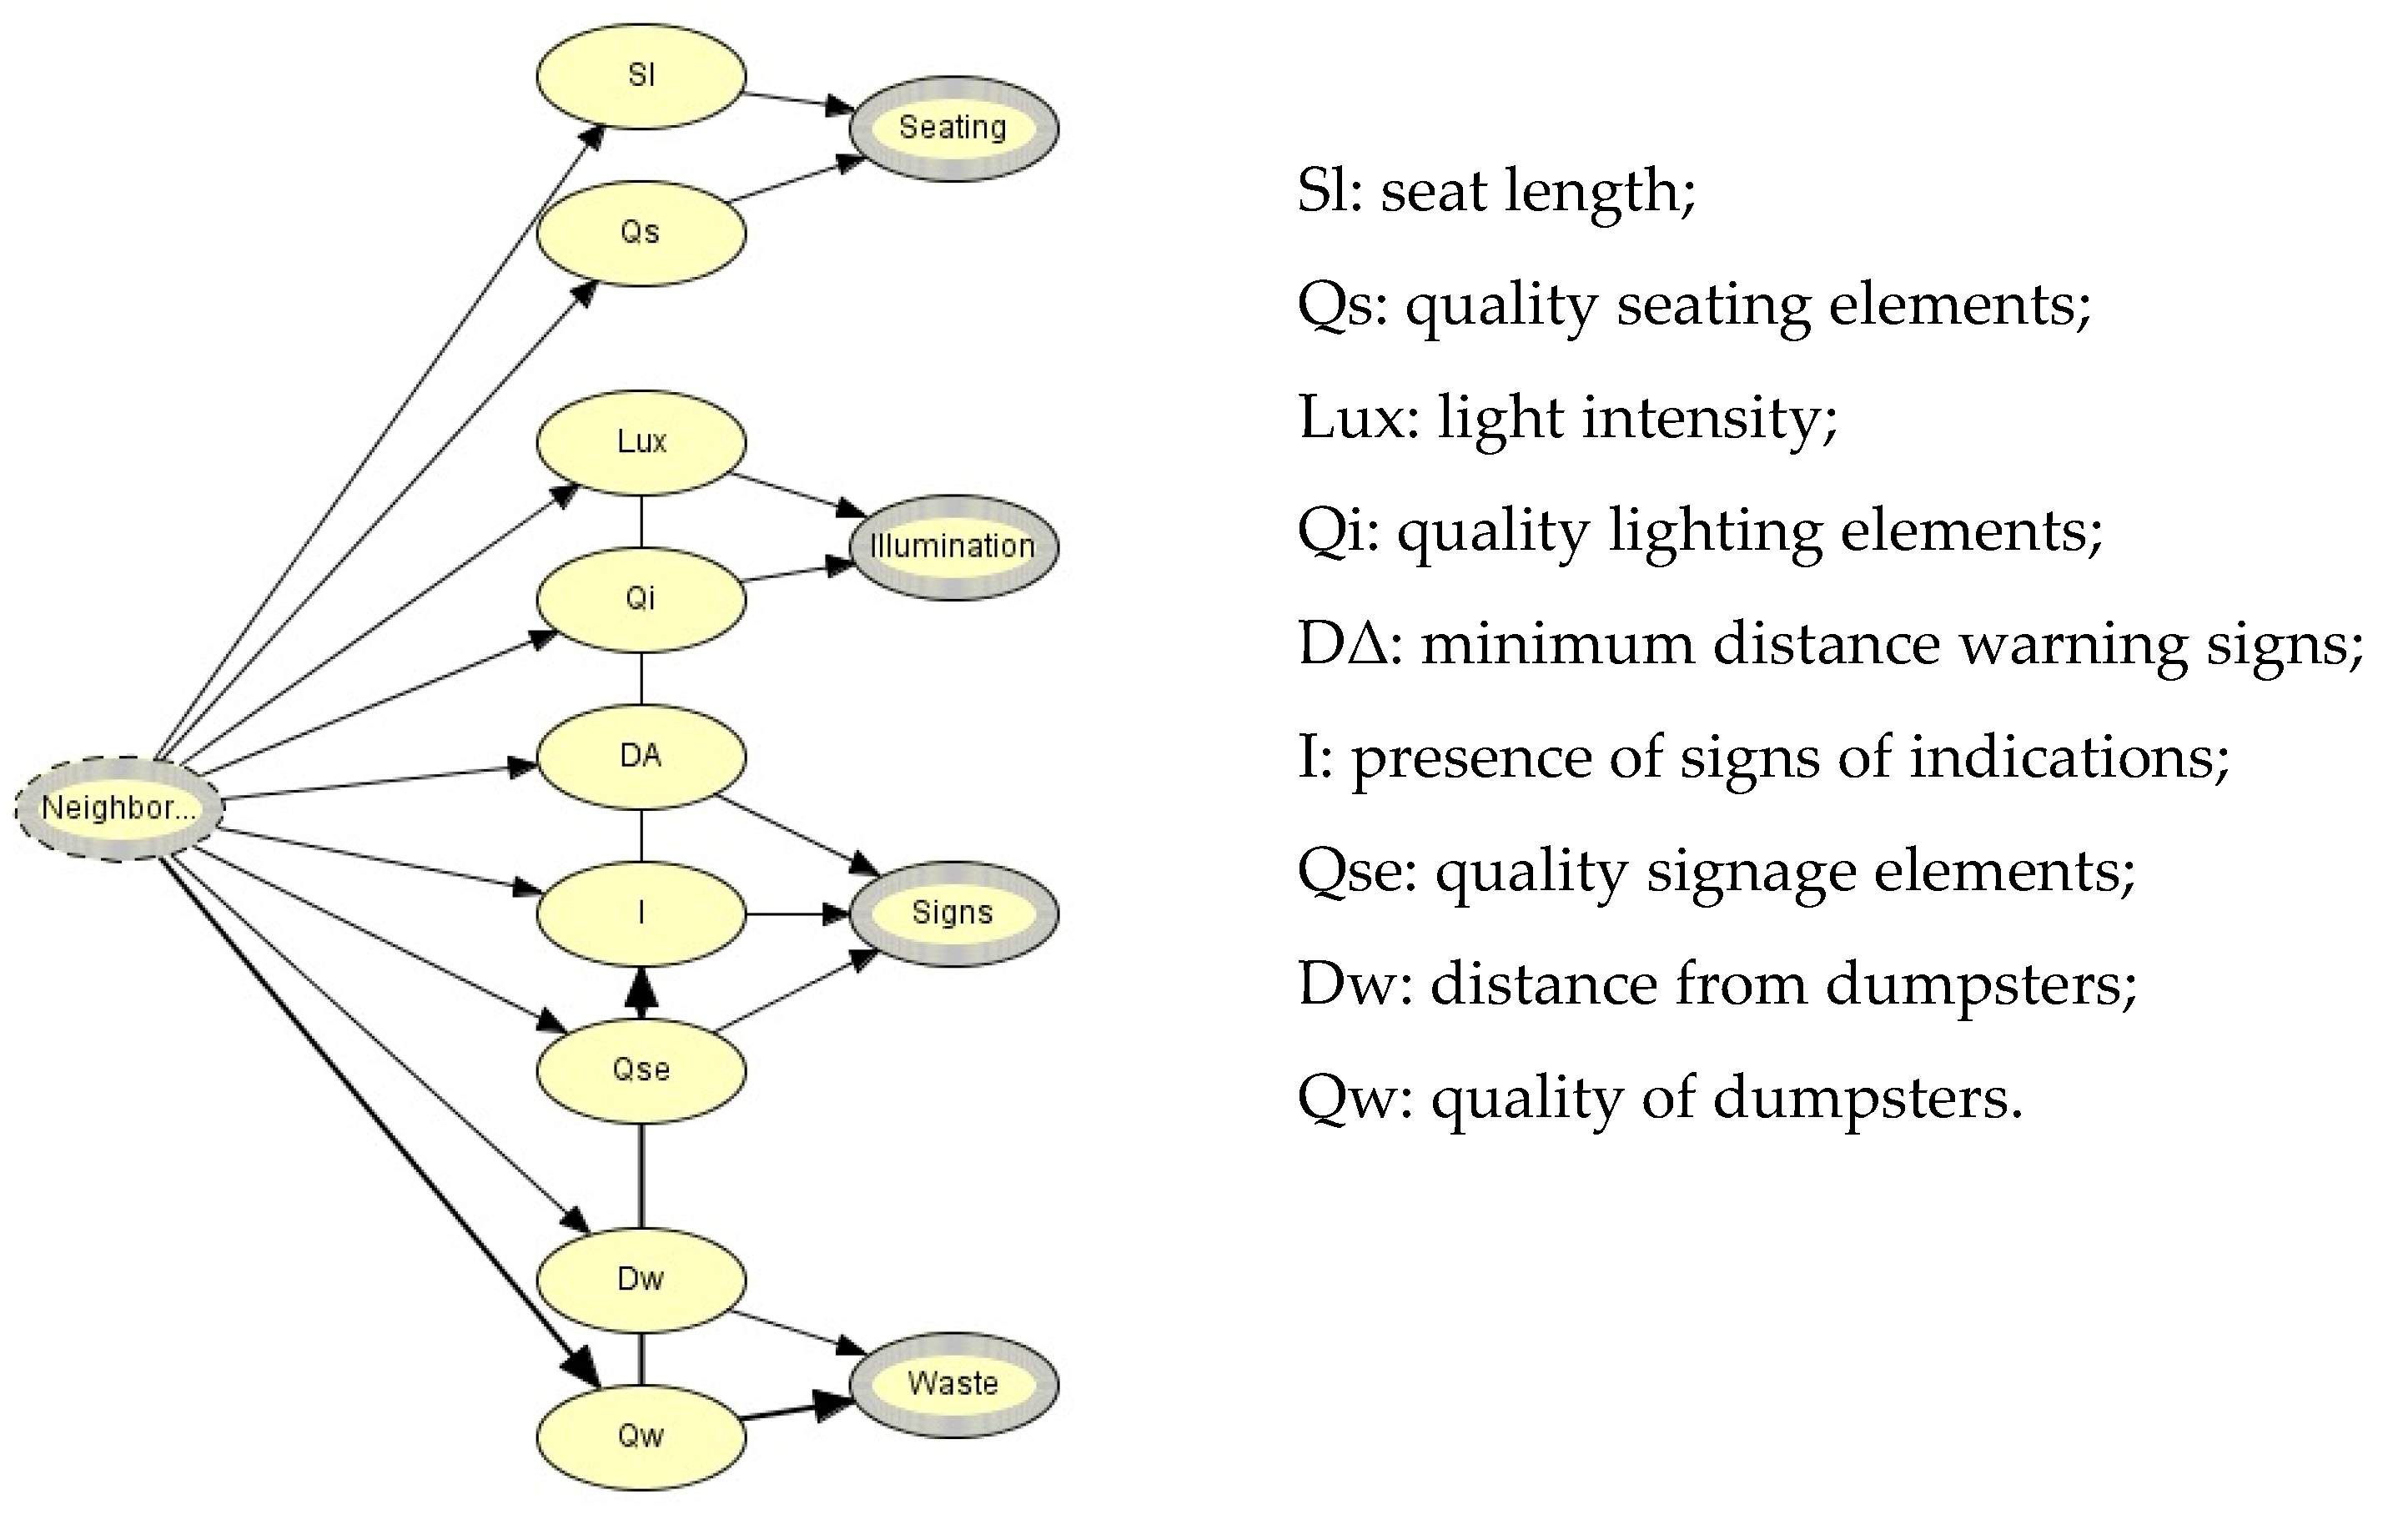
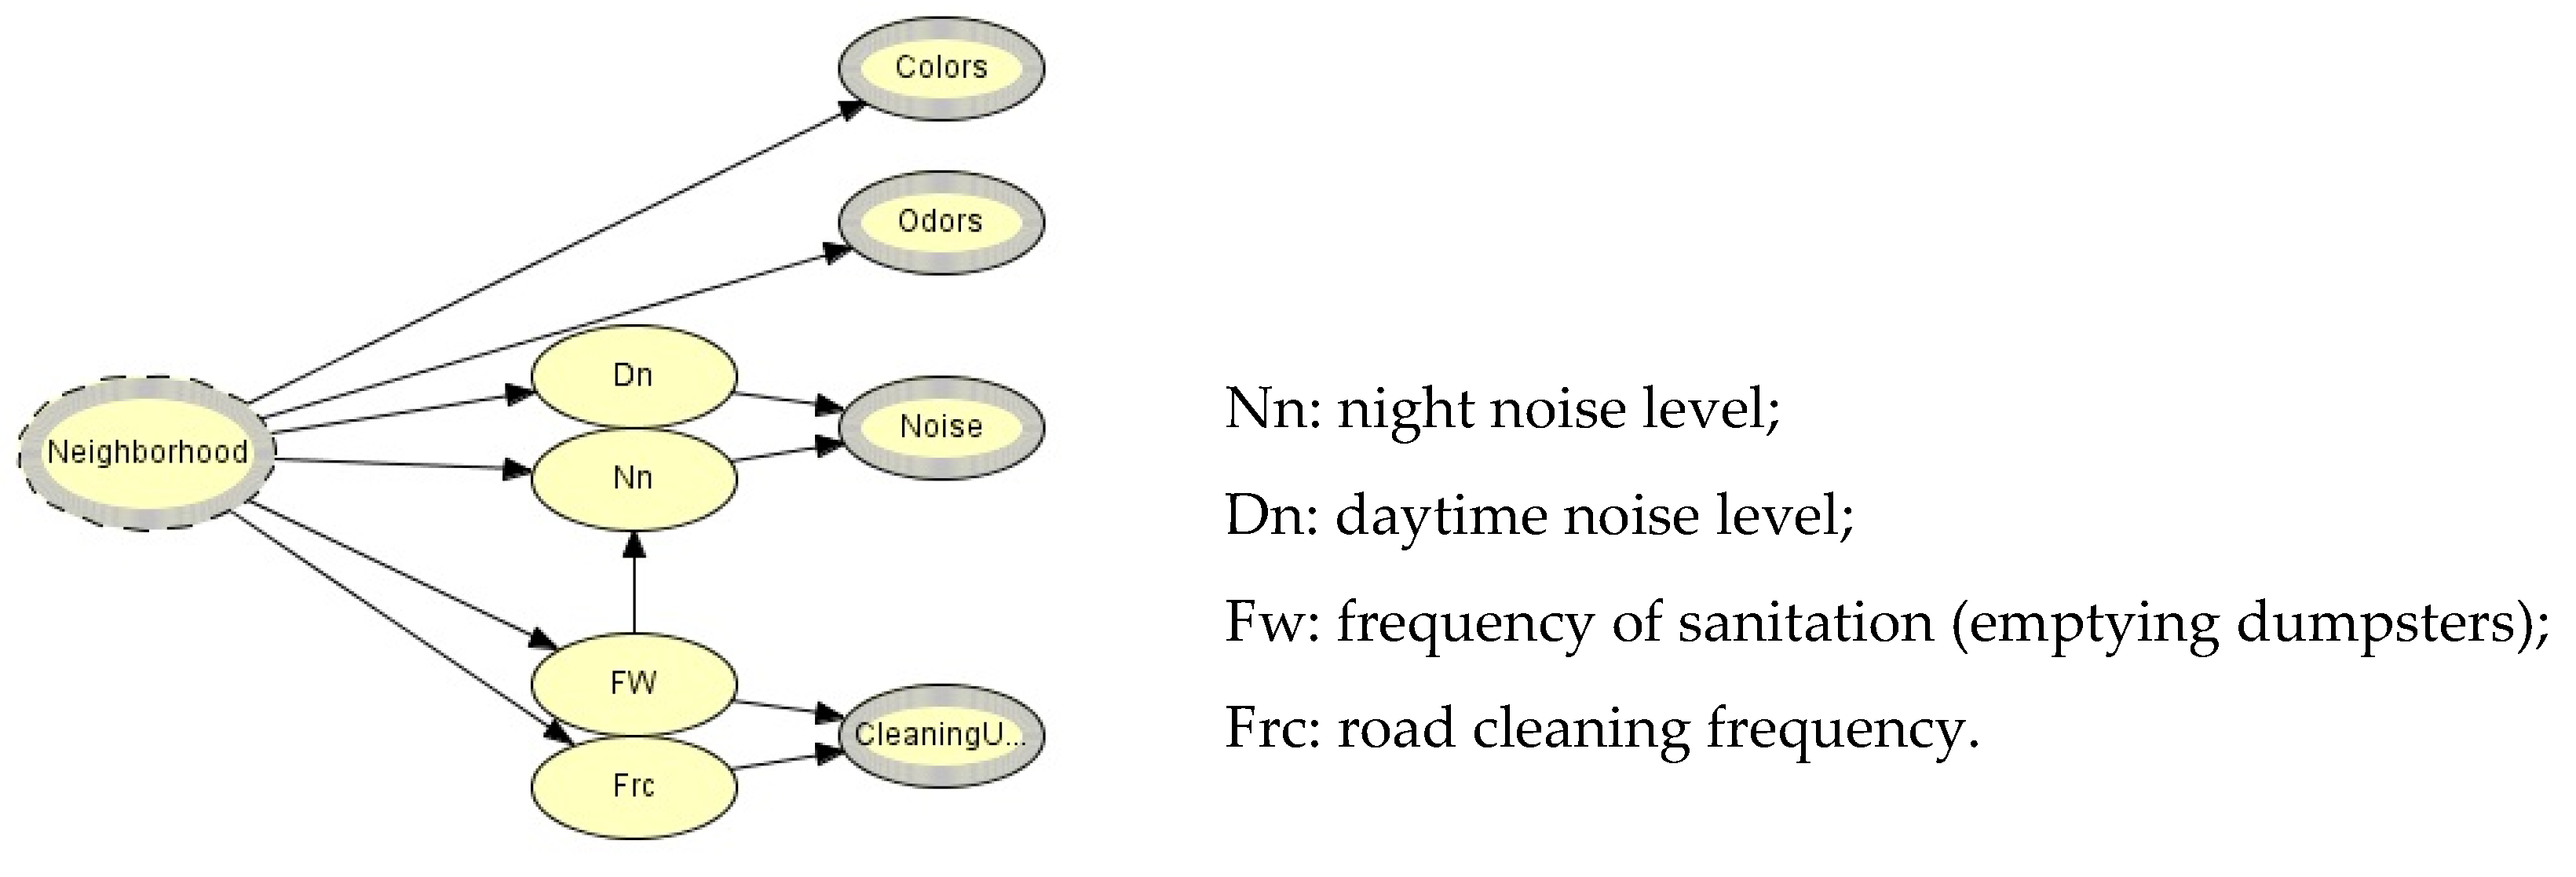
3.1. Level 1 Networks
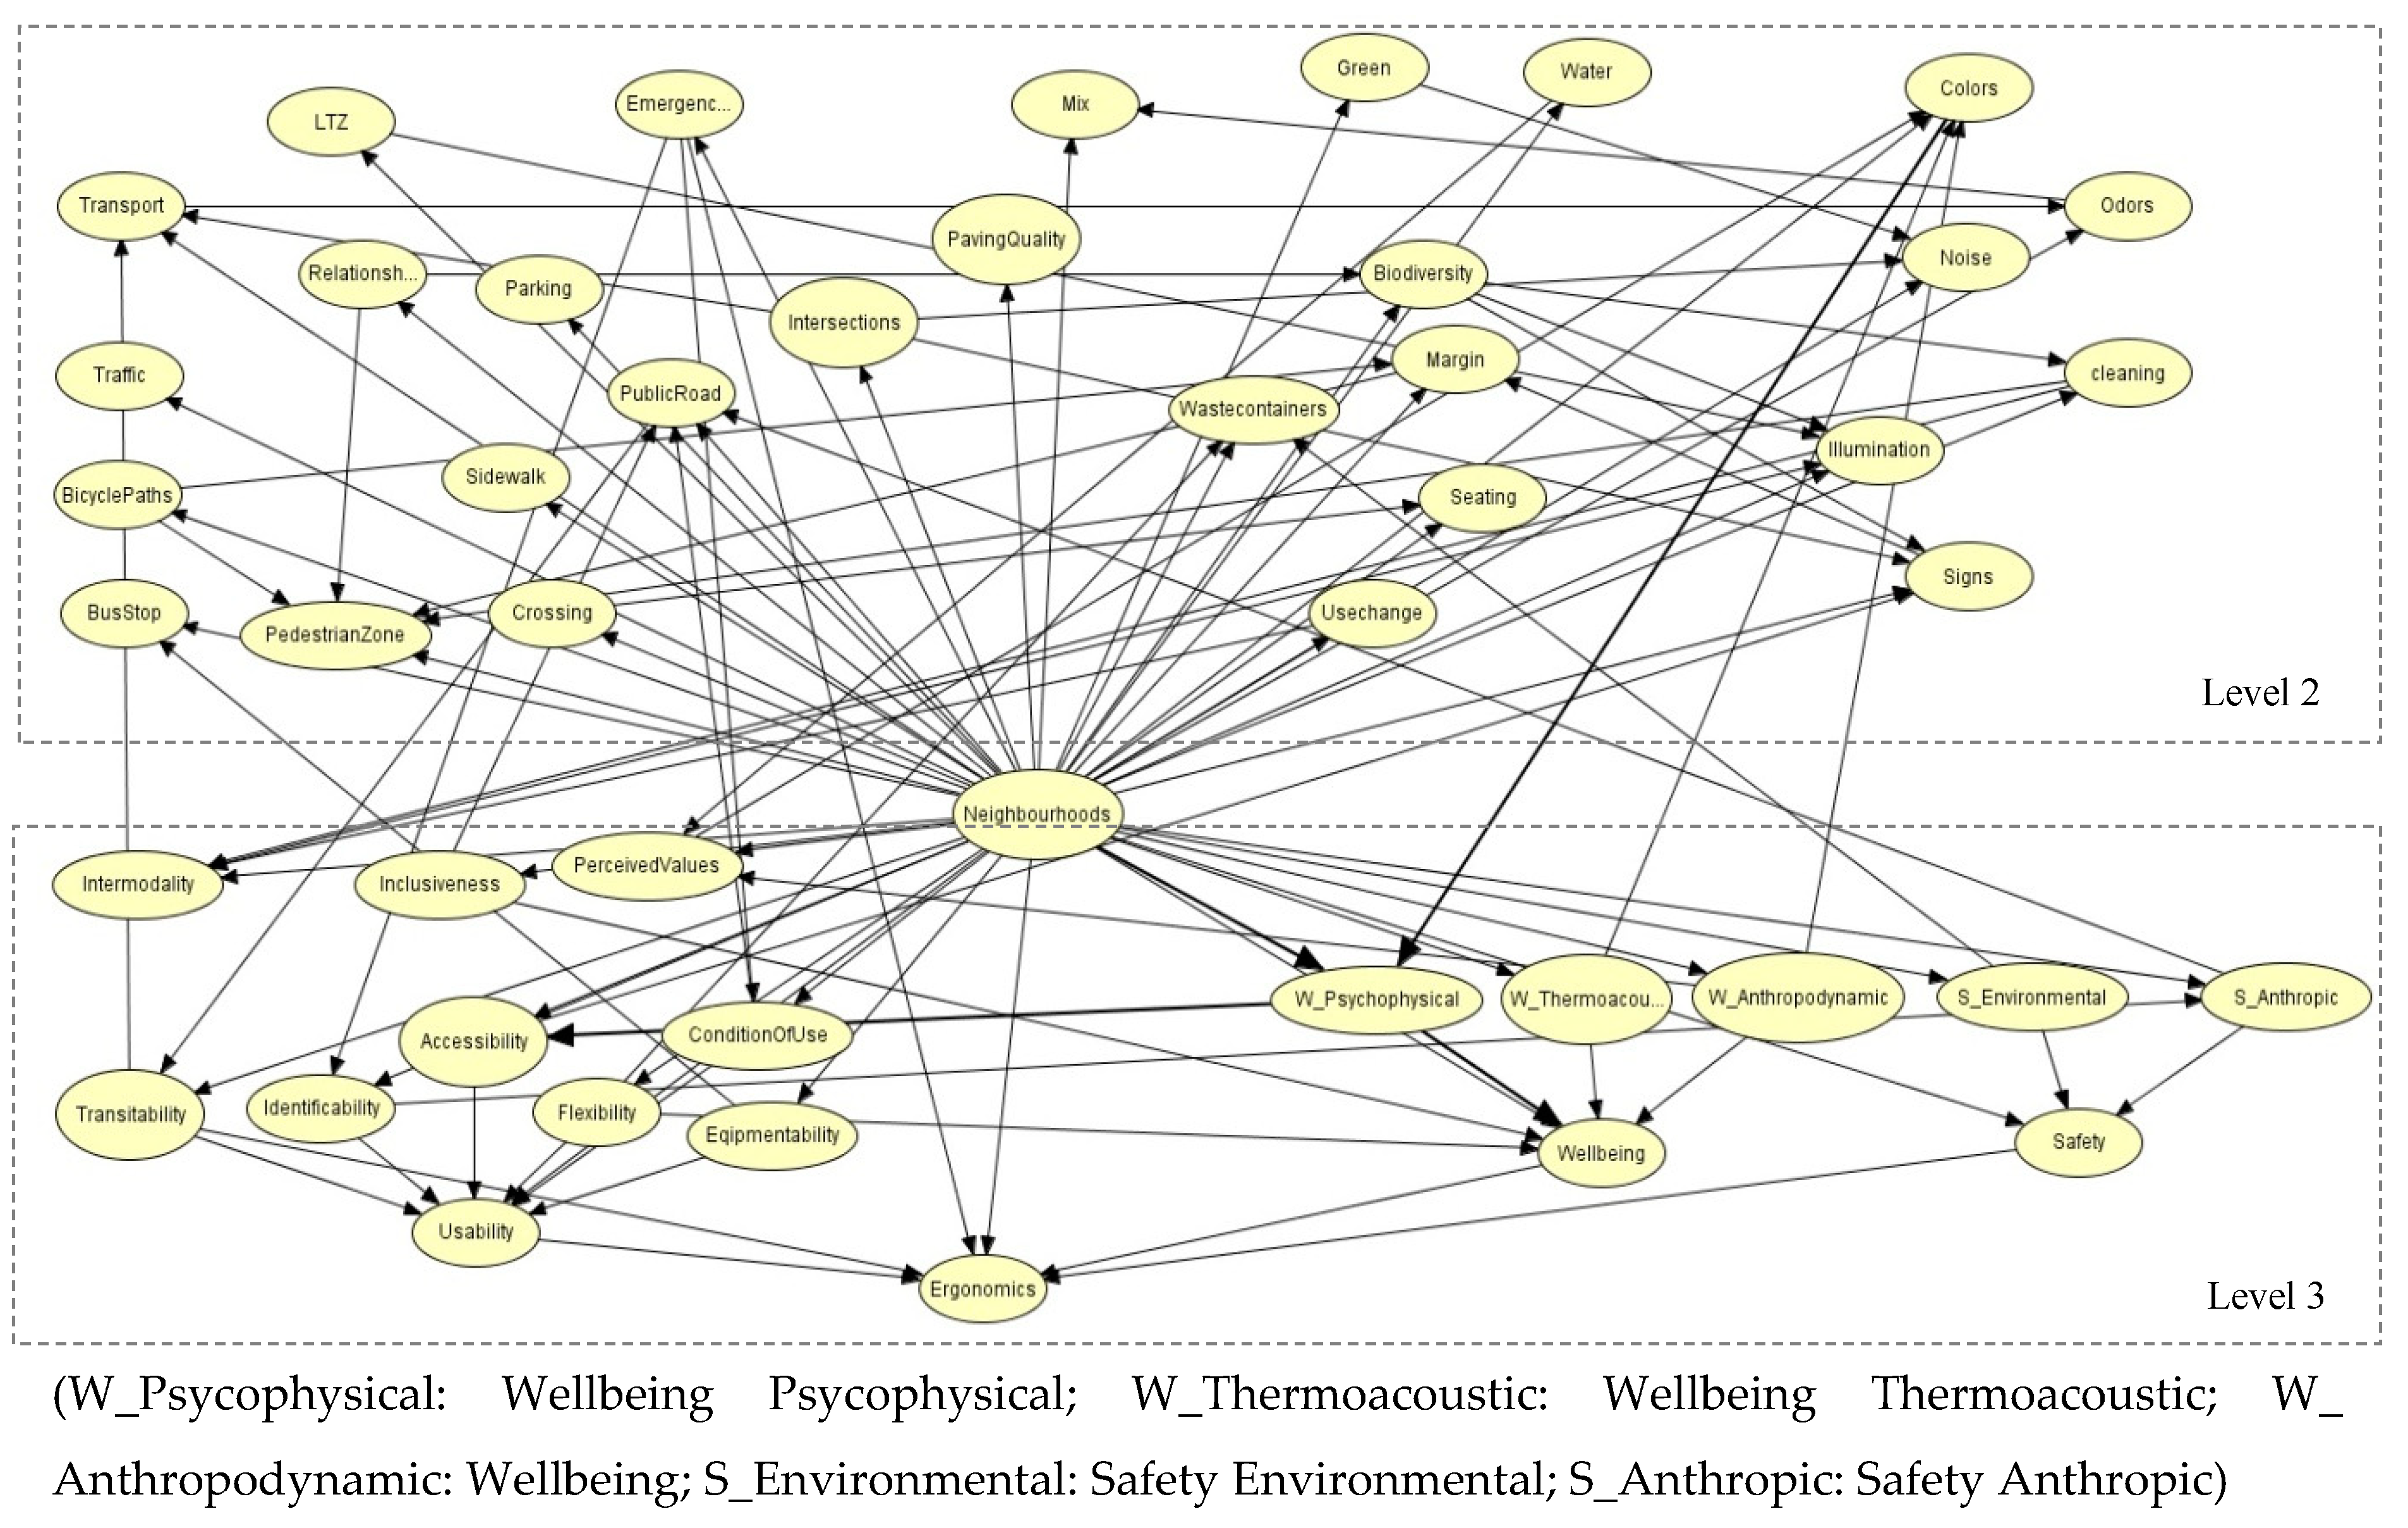
3.2. Level 2 and 3 Networks
4. Results Analysis
4.1. General Urban Ergonomic Indicators—Level 1 Network Analysis
4.2. The Overall Systemic Assessment—Levels 2 and 3 Analysis
4.3. General Trends
4.3.1. Environmental Factors
4.3.2. The Safety Issues
4.3.3. The Well-Being Issue
4.3.4. Mobility
5. Discussing Possible Advances
6. Concluding Remarks
Author Contributions
Funding
Conflicts of Interest
References
- World Health Organization. Saving Lives, Spending Less: A Strategic Response to Noncommunicable Diseases; World Health Organization: Geneva, Switzerland, 2018. [Google Scholar]
- World Health Organization. Global Action Plan on Physical Activity 2018/2030m More Active People for Healthier World; World Health Organization: Geneva, Switzerland, 2018. [Google Scholar]
- Capolongo, S.; Rebecchi, A.; Dettori, M.; Appolloni, L.; Azara, A.; Buffoli, M.; Capasso, L.; Casuccio, A.; Oliveri Conti, G.; D’Amico, A.; et al. Healthy design and urban planning strategies, actions, and policy to achieve salutogenic cities. Int. J. Environ. Res. Public Health 2018, 15, 2698. [Google Scholar] [CrossRef] [PubMed]
- World Health Organization. Preventing Chronic Diseases: A Vital Investment: WHO Global Report; World Health Organization: Geneva, Switzerland, 2005; p. 48. [Google Scholar]
- Jarrett, J.; Woodcock, J.; Griffiths, U.K.; Chalabi, Z.; Edwards, P.; Roberts, I.; Haines, A. Effect of increasing active travel in urban England and Wales on costs to the National Health Service. Lancet 2012, 379, 2198–2205. [Google Scholar] [CrossRef]
- Buck, C.; Eiben, G.; Lauria, F.; Konstabel, K.; Page, A.; Ahrens, W.; Pigeot, I. Urban Moveability and physical activity in children: Longitudinal results from the IDEFICS and I.Family cohort. Int. J. Behav. Nutr. Phys. Act. 2019, 16, 128. [Google Scholar] [CrossRef] [PubMed]
- McCormack, G.R.; Cabaj, J.; Orpana, H.; Lukic, R.; Blackstaffe, A.; Goopy, S.; Hagel, B.; Keough, N.; Martinson, R.; Chapman, J.; et al. A scoping review on the relations between urban form and health: A focus on Canadian quantitative evidence. Health Promot. Chronic Dis. Prev. Can. Res. Policy and Pract. 2019, 39, 187. [Google Scholar] [CrossRef] [PubMed]
- Nieuwenhuijsen, M.J. Influence of urban and transport planning and the city environment on cardiovascular disease. Nat. Rev. Cardiol. 2018, 15, 432–438. [Google Scholar] [CrossRef] [PubMed]
- Bird, E.L.; Ige, J.O.; Pilkington, P.; Pinto, A.; Petrokofsky, C.; Burgess-Allen, J. Built and natural environment planning principles for promoting health: An umbrella review. BMC Public Health 2018, 18, 930. [Google Scholar] [CrossRef] [PubMed]
- Bentley, R.; Blakely, T.; Kavanagh, A.; Aitken, Z.; King, T.; McElwee, P.; Giles, C.B.; Turrel, G. A longitudinal study examining changes in street connectivity, land use, and density of dwellings and walking for transport in Brisbane, Australia. Environ. Health Perspect. 2018, 126, 057003. [Google Scholar] [CrossRef]
- Knuiman, M.W.; Christian, H.E.; Divitini, M.L.; Foster, S.A.; Bull, F.C.; Badland, H.M.; Giles-Corti, B. A longitudinal analysis of the influence of the neighborhood built environment on walking for transportation: The RESIDE study. Am. J. Epidemiol. 2014, 180, 453–461. [Google Scholar] [CrossRef]
- Schipperijn, J.; Ried-Larsen, M.; Nielsen, M.S.; Holdt, A.F.; Grontved, A.; Ersboll, A.K.; Kristensen, P.L. A longitudinal study of objectively measured built environment as determinant of physical activity in young adults: The European youth heart study. J. Phys. Act. Health. 2015, 12, 909–914. [Google Scholar] [CrossRef]
- Harris, M.A.; Reynolds, C.C.O.; Winters, M.; Cripton, P.A.; Shen, H.; Chipman, M.L.; Cusimano, M.D.; Babul, S.; Brubacher, J.R.; Friedman, S.M.; et al. Comparing the effects of infrastructure on bicycling injury at intersections and non-intersections using a case–crossover design. Inj. Prev. 2013, 19, 303–310. [Google Scholar] [CrossRef]
- Sallis, J.F.; Cerin, E.; Conway, T.L.; Adams, M.A.; Frank, L.D.; Pratt, M.; Salvo, D.; Schipperijn, J.; Smith, G.; Cain, K.L.; et al. Physical activity in relation to urban environments in 14 cities worldwide: A corss-sectional study. Lancet 2016, 387, 2207–2217. [Google Scholar] [CrossRef]
- World Health Organization. Towards More Physical Activity in Cities Transforming Public Spaces to Promote Physical Activity—A Key Contributor to Achieving the Sustainable Development Goals in Europe; BMC Public Health: Copenhagen, Denmark, 2017. [Google Scholar]
- Frank, L.D.; Sallis, J.F.; Conway, T.L.; Chapman, J.E.; Saelens, B.E.; Bachman, W. Many pathways from land use to health: Associations between neighborhood walkability and active transportation, body mass index, and air quality. J. Am. Plan. Assoc. 2006, 72, 75–87. [Google Scholar] [CrossRef]
- Duncan, M.J.; Spence, J.C.; Mummery, W.K. Perceived environment and physical activity: A meta-analysis of selected environmental characteristics. Int. J. Behav. Nutr.Phys. Act. 2005, 2, 11. [Google Scholar] [CrossRef] [PubMed]
- Beenackers, M.A.; Foster, S.; Kamphuis, C.B.; Titze, S.; Divitini, M.; Knuiman, M.; van Lenthe, F.J.; Giles-Corti, B. Taking up cycling after residential relocation: Built environment factors. Am. J. Prev. Med. 2012, 42, 610–615. [Google Scholar] [CrossRef]
- Congiu, T.; Sotgiu, G.; Castiglia, P.; Azara, A.; Piana, A.; Saderi, L.; Dettori, M. Built environment features and pedestrian accidents: An italian retrospective study. Sustainability 2019, 11, 1064. [Google Scholar] [CrossRef]
- Fathi, S.; Sajadzadeh, H.; Sheshkal, F.M.; Aram, F.; Pinter, G.; Felde, I.; Mosavi, A. The role of urban morphology design on enhancing physical activity and public health. Int. J. Environ. Res. Public Health 2020, 17, 2359. [Google Scholar] [CrossRef]
- Shvetsov, Y.B.; Shariff-Marco, S.; Yang, J.; Conroy, S.M.; Canchola, A.J.; Albright, C.L.; Park, S.; Monroe, K.R.; le Marchanda, L.; Gomez, S.L.; et al. Association of change in the neighborhood obesogenic environment with colorectal cancer risk: The Multiethnic Cohort Study. SSM Popul. Health 2020, 10, 100532. [Google Scholar] [CrossRef]
- Cerin, E.; Conway, T.L.; Adams, M.A.; Barnett, A.; Cain, K.L.; Owen, N.; Christiansen, L.B.; van Dyck, D.; Josef, M.; Sarmiento, O.L.; et al. Objectively-assessed neighbourhood destination accessibility and physical activity in adults from 10 countries: An analysis of moderators and perceptions as mediators. Soc. Sci. Med. 2018, 211, 282–293. [Google Scholar] [CrossRef]
- D’Alessandro, D.; Arletti, S.; Azara, A.; Buffoli, M.; Capasso, L.; Cappuccitti, A.; Casuccio, A.; Cecchini, A.; Costa, G.; De Martino, A.M.; et al. Strategies for disease prevention and health promotion in urban areas: The erice 50 charter. Ann. Ig. 2017, 29, 481–493. [Google Scholar] [CrossRef]
- Chum, A.; O’Campo, P. Cross-sectional associations between residential environmental exposures and cardiovascular diseases. BMC Public Health 2015, 15, 438. [Google Scholar] [CrossRef]
- Malambo, P.; Kengne, A.P.; De Villiers, A.; Lambert, E.V.; Puoane, T. Built environment, selected risk factors and major cardiovascular disease outcomes: A systematic review. PLoS ONE 2016, 11, e0166846. [Google Scholar] [CrossRef] [PubMed]
- Kan, H.; Heiss, G.; Rose, K.M.; Whitsel, E.A.; Lurmann, F.; London, S.J. Prospective analysis of traffic exposure as a risk factor for incident coronary heart disease: The atherosclerosis risk in communities (ARIC) study. Environ Health Perspect. 2008, 116, 1463–1468. [Google Scholar] [CrossRef] [PubMed]
- Berry, T.R.; Spence, J.C.; Blanchard, C.; Cutumisu, N.; Edwards, J.; Nykiforuk, C. Changes in BMI over 6 years: The role of demographic and neighborhood characteristics. Int. J. Obes. 2010, 34, 1275–1283. [Google Scholar] [CrossRef] [PubMed]
- Garfinkel-Castro, A.; Kim, K.; Hamidi, S.; Ewing, R. Obesity and the built environment at different urban scales: Examining the literature. Nutr. Rev. 2017, 75, 51–61. [Google Scholar] [CrossRef] [PubMed]
- Brown, B.B.; Yamada, I.; Smith, K.R.; Zick, C.D.; Kowaleski-Jones, L.; Fan, J.X. Mixed land use and walkability: Variations in land use measures and relationships with BMI, overweight, and obesity. Health Place 2009, 15, 1130–1141. [Google Scholar] [CrossRef] [PubMed]
- Lopez, R.P.; Hynes, P.H. Obesity, physical activity, and the urban environment: Public health research needs. In Urban Health: Readings in the Social, Built, and Physical Environments of U.S. Cities; Hynes, H.P., Lopez, R., Eds.; Jones and Bartlett: Boston, MA, USA, 2009; pp. 169–185. [Google Scholar]
- Toker, Z. Walking beyond the socioeconomic status in an objectively and perceptually walkable pedestrian environment. Urban Studies Res. 2015, 2015. [Google Scholar] [CrossRef]
- Capolongo, S.; Rebecchi, A.; Buffoli, M.; Appolloni, L.; Signorelli, C.; Gaetano, M.; Daniela, D.A. COVID-19 and cities: From urban health strategies to the pandemic challenge. A decalogue of public health opportunities. Acta Biomed. 2020, 9, 13–22. [Google Scholar]
- D’Alessandro, D.; Buffoli, M.; Capasso, L.; Fara, G.M.; Rebecchi, A.; Capolongo, S. Green areas and public health: Improving wellbeing and physical activity in the urban context. Epidemiol. Prev. 2015, 39, 8–13. [Google Scholar]
- Ngom, R.; Gosselin, P.; Blais, C.; Rochette, L. Type and proximity of green spaces are important for preventing cardio-vascular morbidity and diabetes—A cross-sectional study for Quebec, Canada. Int. J. Environ. Res. Public Health 2016, 13, 423. [Google Scholar] [CrossRef]
- Triguero-Mas, M.; Gidlow, C.J.; Martínez, D.; de Bont, J.; Carrasco-Turigas, G.; Martínez-Íñiguez, T.; Hurst, G.; Masterson, D.; Donaire-Gonzalez, D.; Seto, E.; et al. The effect of randomised exposure to different types of natural outdoor environments compared to exposure to an urban environment on people with indications of psychological distress in Catalonia. PLoS ONE 2017, 12, e0172200. [Google Scholar] [CrossRef]
- Koohsari, M.J.; Mavoa, S.; Villanueva, K.; Sugiyama, T.; Badland, H.; Kaczynski, A.T.; Owen, N.; Giles-Corti, B. Public open space, physical activity, urban design and public health: Concepts, methods and research agenda. Health Place 2015, 33, 75–82. [Google Scholar] [CrossRef] [PubMed]
- Siiba, A. Active travel to school: Understanding the Ghanaian context of the underlying driving factors and the implications for transport planning. J. Transp. Health 2020, 18, 100869. [Google Scholar] [CrossRef]
- Nieuwenhuijsen, M.J. Urban and transport planning pathways to carbon neutral, liveable and healthy cities; A review of the current evidence. Environ. Int. 2020, 140, 105661. [Google Scholar] [CrossRef] [PubMed]
- Mackenbach, J.D.; Randal, E.; Zhao, P.; Howden-Chapman, P. The Influence of Urban Land-Use and Public Transport Facilities on Active Commuting in Wellington, New Zealand: Active Transport Forecasting Using the WILUTE Model. Sustainability 2016, 8, 242. [Google Scholar] [CrossRef]
- Corazza, M.V.; Guida, U.; Musso, A.; Tozzi, M. From EBSF to EBSF-2: A compelling agenda for the bus of the future: A decade of research for more attractive and sustainable buses. In Proceedings of the 2016 IEEE 16th International Conference on Environment and Electrical Engineering (EEEIC), Florence, Italy, 7–10 June 2016. [Google Scholar]
- Corazza, M.V.; Musso, A.; Karlsson, M.A. More accessible bus stops: Results from the 3ibs research project. In More Accessible Bus Stops Proceedings of the AIIT International Congress on Transport Infrastructure and Systems, Rome, Italy, April 10-12-2017; Wegman, F., Dell’Acqua, G., Eds.; CRC Press: Balkema, London, 2017; pp. 641–649. [Google Scholar]
- Unger, S.D. Integrating CBR and BN for Decision Making with Imperfect Information. Master’s Thesis, Norvegian University of Science and Technology, Trondheim, Norway, 2011. [Google Scholar]
- Richter, M.M.; Weber, R.O. Case Based Reasoning; Spinger: Berlin, Germany, 2013. [Google Scholar]
- Kjaerulff, U.B.; Anders, L.M. Bayesian networks and influence diagrams. Springer Sci. Bus. Media 2008, 200, 114. [Google Scholar]
- Glasgow Centre for Population Health. The Built Environment and Health: An Evidence Review; GCPH: Glasglow, UK, 2013; p. 14. [Google Scholar]
- Brownson, R.C.; Hoehner, C.M.; Day, K.; Forsyth, A.; Sallis, J.F. Measuring the built environment for physical activity. state of the science. Am. J. Prev. Med. 2009, 36, S99–S123. [Google Scholar] [CrossRef]
- Frank, L.D.; Sallis, J.F.; Saelens, B.E.; Lauren, L.; Cain, K.; Conway, T.L.; Hess, P.M. The development of a walkability index: Application to the neighborhood quality of life study. Br. J. Sports Med. 2009, 44, 924–933. [Google Scholar] [CrossRef]
- Giles-Corti, B.; Donovan, R.; Holman, C. Factors influencing the use of physical activity facilities: Results from qualitative research. Health Promot. J. Aust. 1996, 6, 16–21. [Google Scholar]
- Ewing, R.; Handy, S. Measuring the unmeasurable: Urban design qualities related to walkability. J. Urban Des. 2009, 14, 65–84. [Google Scholar] [CrossRef]
- OECD. Environment at a Glance Indicators; OECD Publishing: Paris, France, 2019. [Google Scholar] [CrossRef]
- OECD. OECD Work on Measuring Well-Being and Progress towards Green Growth. Available online: https://www.oecd.org/sdd/rioplus20%20to%20print.pdf (accessed on 20 June 2020).
- WHO Europe. Core Health Indicators in the WHO Europe Region. 2019. Available online: https://www.euro.who.int/__data/assets/pdf_file/0004/413239/CHI_2019_EN_WEB.pdf (accessed on 3 June 2020).
- World Health Organization. Development of Environment and Health Indicators for European Union Countries: Results of a Pilot Study: Report on a WHO Working Group Meeting. Bonn, Germany, 7–9 July 2004. Available online: https://apps.who.int/iris/handle/10665/107620 (accessed on 20 June 2020).
- Spiekermann, K.; Wegener, M. Modelling Urban Sustainability. Available online: http://www.spiekermann-wegener.de/pub/pdf/PROPOLIS_IJUS.pdf (accessed on 8 May 2019).
- D’Alessandro, D.; Assenso, M.; Appolloni, L.; Cappuccitti, A. The Walking Suitability Index of the Territori (T-WSI): A new tool to evaluate urban neighborhood walkability. Ann. Ig. 2015, 27, 678–687. [Google Scholar]
- D’Alessandro, D.; Appolloni, L.; Capasso, L. How walkable is the city? Application of the walking Suitability Index of the Territory (T-WSI) to the city of Rieti (Lazio Region, Central Italy). Epidemiol. Prev. 2016, 40, 237–242. [Google Scholar] [PubMed]
- Available online: https://iea.cc/what-is-ergonomics/ (accessed on 9 October 2020).
- Dul, J.; Bruder, R.; Buckle, P.; Carayon, P.; Falzon, P.; Marras, W.S.; Wilson, J.R.; van der Doelen, B. A strategy for human factors/ergonomics: Developing the discipline and profession. Ergonomics 2012, 55, 377–395. [Google Scholar] [CrossRef] [PubMed]
- Wilson, J.R. Fundamentals of ergonomics in theory and pactice. Appl. Ergon. 2014, 45, 5–13. [Google Scholar] [CrossRef] [PubMed]
- Gabriel, R.P.; Quillien, J. A search for beauty/a struggle with complexity: Christopher alexander. Urban Sci. 2019, 3, 64. [Google Scholar] [CrossRef]
- Zaffagnini, M. Progettare Nel Processo Edilizio; Edizioni Luigi Parma: Bologna, Italy, 1981. [Google Scholar]
- Appolloni, L.; D’Alessandro, S.; Cecere, C.; Patrizio, P. Ergonomics of Urban Areas: Testing a System for Multi-Criteria Evaluation; EdicomEdizioni: Monfalcone, Italy, 2014. [Google Scholar]
- Appolloni, L.; Corazza, M.V.; D’Alessandro, D. The pleasure of walking: An innovative methodology to assess appropriate walkable performance in urban areas to support transport planning. Sustainability 2019, 11, 3467. [Google Scholar] [CrossRef]
- Corazza, M.V.; Di Mascio, P.; D’Alessandro, D.; Moretti, L. Methodology and evidence from a case study in Rome to increase pedestrian safety along home-to-school routes. J. Traffic Transp. Eng. 2020. [Google Scholar] [CrossRef]
- Engwicht, D. Reclaiming Our Cities and Town; New Society Publishers: Philadelphia, PA, USA, 1992. [Google Scholar]
- Thompson, C.W. Activity, exercise and the planning and design of outdoor spaces. J. Environ. Psychol. 2013, 34, 79–96. [Google Scholar] [CrossRef]
- Koohsari, M.J.; Kaczynski, A.T.; Giles-Corti, B.; Karakiewicz, J.A. Effects of access to public open spaces on walking: Is proximity enough? Landsc. Urban Plan. 2013, 117, 92–99. [Google Scholar] [CrossRef]
- Chin, G.K.W.; Van Niel, K.P.; Giles-Corti, B.; Knuiman, M. Accessibility and connectivity in physical activity studies: The impact of missing pedestrian data. Prev. Med. 2008, 46, 41–45. [Google Scholar] [CrossRef]
- Lynch, K. The Image of the City; MIT Press: Cambridge, MA, USA, 1960. [Google Scholar]
- Manaugh, K.; Kreider, T. What is mixed use? Presenting an interaction method for measuring land use mix. J. Transp. Land Use 2013, 6, 63–72. [Google Scholar] [CrossRef]
- Moran, M.; Cauwenberg, J.V.; Hercky-Linnewiel, R.; Deforche, B.; Plaut, P. Understanding the relationships between the physical environment and physical activity in older adults: A systematic review of qualitative studies. Int. J. Behav. Nutr. Phys. Act. 2014, 11, 79. [Google Scholar] [CrossRef] [PubMed]
- Koohsari, M.J.; Sugiyama, T.; Lamb, K.E.; Villanueva, K.; Owen, N. Street connectivity and walking for transport: Role of neighborhood destinations. Prev. Med. 2014, 66, 118–122. [Google Scholar] [CrossRef] [PubMed]
- Rebecchi, A.; Buffoli, M.; Dettori, M.; Appolloni, L.; Azara, A.; Castiglia, P.; D’Alessandro, D.; Capolongo, S. Walkable Environments and Healthy Urban Moves: Urban Context Features Assessment Framework Experienced in Milan. Sustainability 2019, 11, 2778. [Google Scholar] [CrossRef]
- Kaczynski, A.; Mohammad, J.K.; Wilhelm Stanis, S.A.; Bergstrom, R.; Sugiyama, T. Association of street connectivity and road traffic speed with park usage and park-based physical activity. Am. J. Health Promot. 2014, 28, 197–203. [Google Scholar] [CrossRef] [PubMed]
- Schultz, C.L.; Sayers, S.P.; Wilhelm Stanis, S.A.; Thombs, L.A.; Thomas, I.M.; Canfield, S.M. The Impact of a Signalized Crosswalk on Traffic Speed and Street-Crossing Behaviors of Residents in an Underserved Neighborhood. J. Urban Health 2015. [Google Scholar] [CrossRef]
- Monteiro, F.B.; Campos, V.B.G. A Proposal of Indicators for Evaluation of the Urban Space for Pedestrians and Cyclists in Access to Mass Transit Station. Procedia Soc. Behav. Sci. 2012, 54, 637–645. [Google Scholar] [CrossRef][Green Version]
- Mertens, L.; Van Holle, V.; De Bourdeaudhuij, I.; Deforche, B.; Salmon, J.; Nasar, J.; Van de Weghe, N.; Van Dyck, D.; Van Cauwemberg, J. The effect of changing micro-scale physical environmental factors on an environment’s invitingness for transportation cycling in adults:an exploratory study using manipulated photographs. Int. J. Behav. Nutr. Phys. Act. 2014, 11, 88. [Google Scholar] [CrossRef]
- World Health Organization. Regional Office for Europe. Physical activity strategy for the WHO European Region 2016–2025; World Health Organization. Regional Office for Europe: Copenhagen, Denmark, 2016. [Google Scholar]
- Gehl, J. Life between Buildings, Using Public Space; Island Press: Washington, DC, USA, 1987. [Google Scholar]
- Valcovich, E.; Fernetti, V.; Stival, C.A. Un Approccio Ecosostenibile alla Progettazione Edilizia. Il Protocollo di Valutazione Energetico-Ambientale (VEA) della Regione Friuli Venezia Giulia; Alinea Editrice: Florence, Italy, 2011. [Google Scholar]
- Doran, G.T. There’s a S.M.A.R.T. way to write management’s goals and objectives. Manag. Rev. 1981, 70, 35–36. [Google Scholar]
- Corazza, M.V.; Favaretto, N. A methodology to evaluate accessibility to bus stops as a contribution to improve sustainability in urban mobility. Sustainability 2019, 11, 803. [Google Scholar] [CrossRef]
- D’Alessandro, D.; Appolloni, L.; Capasso, L. Public health and urban planning: A powerful alliance to be enhanced in Italy. Ann. Ig. 2017, 29, 453–463. [Google Scholar]
- Popov, V.I.; Capasso, L.; Klepikov, O.V.; Appolloni, L.; D’Alessandro, D. Hygienic Requirements of Urban Living Environment in the Russian Federation and in Italy: A comparison. Ann. Ig. 2018, 30, 421–430. [Google Scholar] [PubMed]
- UNI 11277:2008. Sostenibilità in Edilizia—Esigenze e Requisiti di Ecocompatibilità dei Progetti di Edifici Residenziali e Assimilabili, Uffici e Assimilabili, di Nuova Edificazione e Ristrutturazione. Available online: http://store.uni.com/catalogo/uni-11277-2008?josso_back_to=http://store.uni.com/josso-security-check.php&josso_cmd=login_optional&josso_partnerapp_host=store.uni.com (accessed on 8 October 2019).
- Capasso, L.; Faggioli, A.; Rebecchi, A.; Capolongo, S.; Gaeta, M.; Appolloni, L.; De Martino, A.; D’Alessandro, D. Hygienic and sanitary aspects in urban planning: Contradiction in national and local urban legislation regarding public health. Epidemiol. Prev. 2018, 42, 60–64. [Google Scholar] [PubMed]
- Lopez Lambas, M.E.; Corazza, M.V.; Monzon, A.; Musso, A. Rebalancing urban mobility: A tale of four cities. Urban Des. Plan. 2013, 166, 274–287. [Google Scholar] [CrossRef]
- World Health Organization. Constitution of World Health Organization (WHO); World Health Organization: Geneva, Switzerland, 1948. [Google Scholar]
- Frank, L.D.; Schmid, T.L.; Sallis, J.F.; Chapman, J.; Saelens, B.E. Linking objectively measured physical activity with objectively measured urban form: Findings from SMARTRAQ. Am. J. Prev. Med. 2005, 28, 117–125. [Google Scholar] [CrossRef] [PubMed]
- Ragnoli, A.; Corazza, M.V.; Di Mascio, P.; Musso, A. Maintenance priority associated to powered two-wheeler safety. WIT Trans. Built Environ. 2017, 176, 453–464. [Google Scholar]
- Ragnoli, A.; Corazza, M.V.; Di Mascio, P. Safety ranking definition for infrastructures with high PTW flow. J. Traffic Transp. Eng. 2018, 5, 406–416. [Google Scholar] [CrossRef]
- Cervero, R.; Kockelman, K. Travel demand and the 3Ds: Density, diversity, and design. Transp. Res. Part D Transp. Environ. 1997, 2, 199–219. [Google Scholar] [CrossRef]
- Canuto, R.; Amorim, L. Establishing parameters for urbanity. In Eighth International Space Syntax Symposium; Greene, M., Reyes, J., Castro, A., Eds.; PUC: Santiago, Chile, 2012. [Google Scholar]
- Dennis, M.; Scaletta, K.L.; James, P. Evaluating urban environmental and ecological landscape characteristics as a function of land-sharing-sparing, urbanity and scale. PLoS ONE 2019, 14, e0215796. [Google Scholar] [CrossRef]
- van Diepen, A.M.L.; Musterd, S. Lifestyles and the city: Connecting daily life to urbanity. J. Hous. Built Environ. 2009, 24, 331–345. [Google Scholar] [CrossRef]
- Castillo, H.; Pitfield, D.E. ELASTIC—A methodological framework for identifying and selecting sustainable transport indicators. Transp. Res. Part D Transp. Environ. 2010, 15, 179–188. [Google Scholar] [CrossRef]
- European Environmental Agency. Paving the Way for EU Enlargement—Indicators of Transport and Environment Integration TERM 2002; Office for Official Publications of the European Communities: Luxembourg, 2002. [Google Scholar]
- Lynch, A.J.; Mosbah, S.M. Improving local measures of sustainability: A study of built-environment indicators in the United States. Cities 2017, 60, 301–313. [Google Scholar] [CrossRef]


| Needs | Well-Being | Safety | Usability |
|---|---|---|---|
| Requirements | Sunshine exposure | Conflicts with motorized users | Architectural barriers’ removal |
| Winter exposure (>8 h) | Sidewalk on one side of the street | No grades to access buildings | |
| Summer exposure (<10 h) | Sidewalk on both sides of the street | Crossing equipped with ramp+grade | |
| Ventilation | Non-slippery surfaces | Rest facilities/equipment on hilly links | |
| Canyon effect | Signaled crossings | No grade between driveways and sidewalks | |
| Temperature | Unsignaled crossings | Accessible bus stops | |
| Vegetation, tree-lined link | Obstacles | Tactile-plantar route for visually impaired users | |
| Brick/stone surfaces | Dumpsters | Natural directions for visually impaired users | |
| Impervious surfaces for road and sidewalks | Ads markers | Rumble strips | |
| HVAC units along the street | Surfaces’ evenness | Equipment for hearing impaired | |
| Relative humidity | Avoidance of chinks and potholes | Maintenance | |
| Availability of natural surfaces (vegetation, bodies of water, etc.) | Avoidance of distresses | Distress density < 50% of the surface | |
| Noise | Slippery factors | Cleanness and Sanitation | |
| Traffic noise | Leaves | Availability of dumpster and bins | |
| Noise from working activities | Water | Road cleaning | |
| Public lighting | Ice | Graffiti removal | |
| Light poles only | Adaptability to events | ||
| Neon lights | Availability of route for emergency rescue | ||
| Glare | Possibility to enforce car-free areas | ||
| Reflecting surfaces | Possibility to remove urban furniture | ||
| Level of service (LoS) | |||
| Suitability of (LoS) for sidewalks | |||
| Suitability of urban furniture | |||
| Sidewalk evenness | |||
| Availability of universal design furniture |
| Category | Performance | Indicators | Measure Unit | Limit Value | Optimal Value | Score | Weight |
|---|---|---|---|---|---|---|---|
| Max/Min | |||||||
| A–Natural elements | A1. Vegetation | A1.1—Green area/inhabitant | m2/inhabitant | 9 | 20 | 0/10 | 60 |
| A1.2—Proximity to green area | m | ≤300 | ≤300 | 20 | |||
| A1.3—Quality of green area | bad/poor/mediocre/ sufficient/good/excellent | sufficient | excellent | 20 | |||
| A2. Bodies of water | A2.1—Proximity of elements | m | ≤300 | ≤300 | 0/10 | 60 | |
| A2.2—Quality of elements | bad/poor/mediocre/ sufficient/good/excellent | sufficient | excellent | 40 | |||
| A3. Protection of biodiversity | A3.1—Proximity to green area | m | ≤300 | ≤300 | 0/10 | 40 | |
| A3.2—Percentage of permeable surfaces | % | ≥30 | ≥30 | 40 | |||
| A3.3—Proximity to green corridor | m | 1000 > A3.3 ≥ 750 | A3.3 < 600 | 20 |
| Category | Performance | Indicators | Measure Unit | Limit Value | Optimal Value | Score | Weight |
|---|---|---|---|---|---|---|---|
| Max/Min | |||||||
| B—Built environment | B1—Functional mix | B1.1—Land use mix | B1.1—Entropy equation | ≥0.5 | 1 | 0/10 | 40 |
| B1.2—Proximity to business | m | ≤300 | ≤300 | 30 | |||
| B1.3—Quality of elements | bad/poor/mediocre/ sufficient/good/excellent | sufficient | excellent | 30 | |||
| B2—Hierarchy | B2.1—Hierarchical relationship | Yes/no | Yes | Yes | 0/10 | 40 | |
| B2.2—Dimensional relationship | Yes/no | Yes | Yes | 30 | |||
| B2.3—Formal relationship | Yes/no | Yes | Yes | 30 | |||
| B3—Landmarks | B3.1—Cultural and natural landmarks | Yes/no | ≥1 in the reference area | 1 everywhere | 0/10 | 60 | |
| B3.2—Quality of landmarks | Bad/poor/mediocre/ sufficient/good/excellent | sufficient | excellent | 40 | |||
| B4—Margins | B4.1—Strong margins | % compared to the edge length | ≥70 | ≥70 | 0/10 | 50 | |
| B4.2—Dimensional relationship H/W | m/m | 0.5 ≤ B4.2 < 1 | 1 | 10 | |||
| B4.3—Percentage of sky view | % of sky view | ≥70 | ≥70 | 30 | |||
| B4.4—Quality of margins | bad/poor/mediocre/ sufficient/good/excellent | sufficient | excellent | 10 | |||
| B5—Nodes | B5.1—Density of intersections | n/Km2 | 50 < B5.1 ≤ 70 | ≥130 | 0/10 | 100 | |
| B6—Surfaces | B6.1—Percentage of permeable surfaces | % | ≥30 | ≥30 | 0/10 | 20 | |
| B6.2—Reflective power | Albedo | >0.3 at least 50% of the surface | >0.3 at least 50% of the surface | 10 | |||
| B6.3—Technical adequacy | Yes/no | Yes | Yes | 30 | |||
| B6.4—Quality of surfaces | bad/poor/mediocre/ sufficient/good/excellent | sufficient | excellent | 40 | |||
| B7—Temporary uses | B7.1—Amount of time dedicated to temporary functions | [Hours spent for temporary uses/day] *100 | ≤10% | ≤10% | 0/100 | 100 |
| Category | Performance | Indicators | Measure Unit | Limit Value | Optimal Value | Score | Weight |
|---|---|---|---|---|---|---|---|
| Max/Min | |||||||
| C—Mobility | C1—Sidewalks | C1.1—Length of sidewalk | % of the total viability | ≥50 | ≥75 | 0/100 | 40 |
| C1.2—Width of sidewalk | m | ≥1.50 | 3.00 ≤ C1.2≤ 5.00 | 20 | |||
| C1.3—Quality of sidewalk | bad/poor/mediocre/ sufficient/good/excellent | sufficient | excellent | 40 | |||
| C2- Parking | C2.1—Proximity to parking area | m | ≤300 | ≤300 | 0/100 | 60 | |
| C2.2—Quality of parking area | bad/poor/mediocre/ sufficient/good/excellent | sufficient | excellent | 40 | |||
| C3—Transit supply | C3.1—Frequency and flow of public transportation | n/h | ≥ 4 | ≥ 6 | 0/100 | 60 | |
| C3.2—Quality of public transportation | bad/poor/mediocre/ sufficient/good/excellent | sufficient | excellent | 40 | |||
| C4—Transit stops | C4.1—Proximity to stops | m | ≤300 | ≤300 | 0/100 | 60 | |
| C4.2—Quality of stops | bad/poor/mediocre/ sufficient/good/excellent | sufficient | excellent | 40 | |||
| C5—Pedestrian crossings | C5.1—Presence of crossings | Yes/no –No every 100 m | 1 | >1 | 0/100 | 50 | |
| C5.2—Width of crossings | m | ≥2.50 | ≥4.00 | 50 | |||
| C6—Road (vehicle) traffic | C6.1—Traffic flow | n/h | 600 ≥ C6.1 > 300 | ≤300 | 0/100 | 100 | |
| C7—Bicycle paths (intermodality) | C7.1—Percentage of bicycle paths | % of the total road network | ≥50 | ≥50 | 0/100 | 30 | |
| C7.2—Proximity to paths | m | ≤300 | ≤300 | 50 | |||
| C7.3—Quality of bicycle paths | bad/poor/mediocre/ sufficient/good/excellent | sufficient | excellent | 20 | |||
| C8—Pedestrianization (intermodality) | C8.1—Percentage of pedestrian zones | % of the surface urban spaces | ≥50 | ≥50 | 0/100 | 30 | |
| C8.2—Proximity to pedestrian zones | m | ≤300 | ≤300 | 50 | |||
| C8.3—Quality of pedestrian zones | bad/poor/mediocre/ sufficient/good/excellent | sufficient | excellent | 20 | |||
| C9—Limited traffic zones—LTZ | C9.1—Percentage of limited traffic zones | % of the surface urban spaces | ≥40 | ≥40 | 50 | ||
| C9.2—Proximity to limited traffic zones | m | ≤300 | ≤300 | 30 | |||
| C9.3—Quality of limited traffic zones | bad/poor/mediocre/ sufficient/good/excellent | sufficient | excellent | 20 | |||
| C10—Public Roads | C10.1—Percentage of arterial roads | % of the surface urban spaces | ≤10 | ≤10 | 0/100 | 60 | |
| C10.2—Quality of road network | bad/poor/mediocre/ sufficient/good/excellent | sufficient | excellent | 40 |
| Category | Performance | Indicators | Measure Unit | Limit Value | Optimal Value | Score | Weight |
|---|---|---|---|---|---|---|---|
| Max/Min | |||||||
| D–Urban furniture | D1—Seats | D1.1–Length of seating | m/m2 every 3 m2 of space | 0.15 < D1.1 < 0.30 | ≥0.30 | 0/100 | 60 |
| D1.2–Quality of the seating | bad/poor/mediocre/ sufficient/good/excellent | sufficient | excellent | 40 | |||
| D2—Public Lighting | D2.1–Light flow | Lux | 15 < D2.1 ≤ 18 | 15 < D2.1 ≤ 18 | 0/100 | 60 | |
| D2.2–Quality of the light fixtures | bad/poor/mediocre/ sufficient/good/excellent | sufficient | excellent | 40 | |||
| D3–Signs | D3.1–Minimum distance from danger sign | m | ≥50 | ≥50 | 0/100 | 20 | |
| D3.2–Presence of information signs | No for each intersection | ≥1 | ≥1 | 40 | |||
| D3.3–Quality of signs | bad/poor/mediocre/ sufficient/good/excellent | sufficient | excellent | 40 | |||
| D4–Waste dump | D4.1–Distance between dumpsters | m | ≤ 150 | ≤ 150 | 0/100 | 60 | |
| D4.2–Quality of waste containers | bad/poor/mediocre/ sufficient/good/excellent | sufficient | excellent | 40 | |||
| D5–Shadows | D5.1–Percentage of shaded areas | % compared to open space | >30 | >50 | 0/100 | 50 | |
| D5.2–Transmission coefficient | % | 25 ≥ D5.2 > 15 at least 50% of surface | 15 ≥ D5.2 ≥ 0 at least 90% of surface | 15 | |||
| D5.3–Albedo | Albedo | >0.3 | >0.3 | 15 | |||
| D5.4–Quality of sun protection elements | bad/poor/mediocre/ sufficient/good/excellent | sufficient | excellent | 20 | |||
| E–Perceived environment | E1–Chromatic feature–colors | E1.1–Chromatic harmony | bad//mediocre/ good/excellent | good | excellent | 0/100 | 100 |
| E2–Olfactory feature–smells | E2.1–Presence of olfactory source | Yes/no–m | >300 | 0/100 | 100 | ||
| E3–External environment noise | E3.1–Daytime noise level | dB(A) | ≤57 | 0/100 | 50 | ||
| E3.2–Night-time noise level | dB(A) | ≤47 | 50 | ||||
| E4–Neatness | E4.1–Frequency of road cleaning | n/week | 2 < E4.1 ≤ 4 | >7 | 0/100 | 60 | |
| E4.2–Frequency of waste collection | n/day | ≥3 | ≥3 | 40 |
| HEI Human—Environment Interface | |||||||||||||||||||||||||||||||
|---|---|---|---|---|---|---|---|---|---|---|---|---|---|---|---|---|---|---|---|---|---|---|---|---|---|---|---|---|---|---|---|
| Human | Environment | ||||||||||||||||||||||||||||||
| Performance | |||||||||||||||||||||||||||||||
| Conditions and functions to meet users’ need | |||||||||||||||||||||||||||||||
| Walkability of the public realm | |||||||||||||||||||||||||||||||
| Urban fabric | Connectivity | Added values | |||||||||||||||||||||||||||||
| Natural element | Built environment | Mobility | Urban Furniture | Perception | |||||||||||||||||||||||||||
| Need | Requirement | A1 | A2 | A3 | B1 | B2 | B3 | B4 | B5 | B6 | B7 | C1 | C2 | C3 | C4 | C5 | C6 | C7 | C8 | C9 | C10 | D1 | D2 | D3 | D4 | D5 | E1 | E2 | E3 | E4 | |
| Conditions to bemaintained or a desired state to be achieved in the field of: | To make explicit users’ need, specifically for: | Vegetation | Water | Biodiversity | Functional mix | Hierarchy | Landmarks | Margins | Nodes | Surfaces | Temporary Uses | Sidewalks | Parking | Transit supply | Transit Stops | Pedestrian crossings | Road (vehicle) traffic | Bicycle paths | Pedestrianization | LTZ | Public Roads | Seats | Public Lighting | Signs | Waste dump | Shadows | Coloros | Smells | Noise | Neatness | |
| Well-being | Hygienic-environmental management | Sunshine/sunlight | A.11 A13 | B42 B43 | A.11 A13 D51 D52 D53 | ||||||||||||||||||||||||||
| Air quality | A.11 | A.21 | C61 | C71C81 C82 C83 | C71C91 C92 C93 | ||||||||||||||||||||||||||
| Ventilation | A.21 | B42 | |||||||||||||||||||||||||||||
| Hygrometric control | Temperature | A.11 | A32 | B42 | A32 | D51 D52 D53 | |||||||||||||||||||||||||
| Relative humidity | A.21 | ||||||||||||||||||||||||||||||
| Visual suitability | Lighting | D21 D22 | D21 D22 | ||||||||||||||||||||||||||||
| No glare | A32 B62 | D21 D22 | D51 D52 D53 | ||||||||||||||||||||||||||||
| Auditory suitability | Noise level | B12 | B42 | C61 | C101 C102 | C61 E31 E32 | |||||||||||||||||||||||||
| Ease | Levels of Service | B21 B22 C22 | B51 | C11 | C21 C22 | C31 C41 C42 | B22 B51 C32 | C52 | C72 C72 | B51 | B51 | D11 D12 | |||||||||||||||||||
| Safety | Risk prevention | Avoidance of conflicts with motorized users | C12 | C31 | C31 C32 | C51 C52 | A33 C71 C72 C73 | C81 C82 C83 | C91 C92 C93 | D21 D22 | D31 | ||||||||||||||||||||
| Obstacle/barrier-free sidewalks | C11 C12 C13 | D11 D12 | |||||||||||||||||||||||||||||
| Even sidewalk | C13 | ||||||||||||||||||||||||||||||
| No-slippery sidewalk | C13 | ||||||||||||||||||||||||||||||
| Usability | Maintenance | Cleanness and sanitation | B64 | C13 | C22 | C22 | C22 C32 | D41 D42 | E11 | B12 C61 D41 D42 E11 E12 E21 | B12 C61 | C61 D41 D42 E11 E12 E21 E 41 E42 | |||||||||||||||||||
| Flexibility | Adaptation to events | A.12 A.13 A.31 A.33 | A12 A21 B11 B12 | C12 | A12 A22 B13 | B51 | A12 A22 A13 B32 | C12 | C31 C32 | C81 C82 C83 | C91 C92 C93 | C101 C102 | D11 D12 | ||||||||||||||||||
| Relationships | Privacy | B23 | C13 | ||||||||||||||||||||||||||||
| Communication | A12 | A12 | A12 | B51 | C12 | C31 | D11 D12 | D31 D32 D33 | D12 | ||||||||||||||||||||||
| FEATURES | DISTRICT | SURFACE (m2) | POPULATION (unit) | POPULATION DENSITY (Inhabitants/km2) | |
|---|---|---|---|---|---|
| 1100s–1920s original settlement of the city with mixed land use including several landmarks | 10 | Historic center | 259,341 | 1771 | 6828.8 |
| 1920s–1990s residential, working class area, mix of building types: one- or two-family houses, two or three-storey apartment buildings (some within social housing projects) | 9 | Villa Reatina | 282,320 | 2303 | 8157.4 |
| 2 | Fassini | 307,985 | 2437 | 7912.7 | |
| 1950s–1980s residential middle-class areas, mix of detached and terraced houses, little villas, low-rise apartment blocks | 4 | Fiume dei Nobili | 119,400 | 824 | 6901.2 |
| 5 | Città Giardino | 124,408 | 1375 | 11,052.3 | |
| 8 | Borgo | 210,383 | 1849 | 8788.7 | |
| 6 | Regina Pacis | 175,874 | 2390 | 13,589.3 | |
| 1960s–1990s suburban residential areas, mix of prevalently low-rise apartment blocks and terraced houses | 1 | Micioccoli | 571,395 | 3562 | 6233.9 |
| 7 | Piazza Tevere | 273,879 | 1765 | 6444.5 | |
| 1970s–2000s mainly residential upper middle class area, consisting of single-family villas, little villas, terraced houses, small apartment blocks. | 3 | Zona Residenziale | 355,811 | 865 | 2431.1 |
| Total | 2,680,796 | 19,141 | |||
| HEI CATEGORIES NEIGHBORHOODS | NATURAL ELEMENTS | BUILT ENVIRONMENT | MOBILITY | URBAN FURNITURE | PERCEIVED ENVIRONMENT |
|---|---|---|---|---|---|
| 10 Centro Storico | |||||
 | body of water, vegetation | landmarks availability, strong margins, paving quality | pedestrianized areas | quality seating, availability of lighting, | chromatic harmony |
| 9 Villa Reatina | |||||
 | modest vegetation | poor presence of strong margins, low quality of margins | low availability of pedestrian crossing, lack of pedestrian areas, bicycle paths and LTZ | low availability of urban furniture | |
| 4 Fiume dei Nobili | |||||
 | modest vegetation | lack of strong margins, good quality of margins | low availability of pedestrian crossing, low availability of sidewalk, lack of pedestrian areas, bicycle paths | low availability of urban furniture | chromatic harmony |
| 1—Miccioccoli | |||||
 | no strong margins, no landmarks | low availability of pedestrian areas and bicycle paths | low availability of urban furniture | ||
| 2 Fassini | |||||
 | no strong margins, no landmarks | low availability of pedestrian crossing, lack of pedestrian areas, bicycle paths and LTZ | low availability of urban furniture | ||
| 7 Piazza Tevere | |||||
 | modest vegetation | no landmarks | lack of pedestrian areas, bicycle paths and LTZ | modest availability of urban furniture | |
| 8 Borgo | |||||
 | vegetation | functional mix, landmarks, strong margins | low availability of pedestrian crossings | low availability of urban furniture | |
| 6 Regina Pacis | |||||
 | low availability of functional mix, no landmarks | poor quality of sidewalk, low availability of pedestrian areas and bicycle paths | low availability of seating | noise level (daytime) | |
| 3 Zona Residenziale; | |||||
 | availability of vegetation | no functional mix | low availability of pedestrian crossings; lack of pedestrian areas, bicycle paths and LTZ | low availability of urban furniture | chromatic harmony |
| 5 Città Giardino | |||||
 | no landmarks | low availability and poor quality of sidewalk; low availability of bicycle paths | availability of lighting for pedestrian low availability of seating | noise level (daytime) |
| Neighbourhoods | 1.Micioccoli | 2.Fassini | 3.Zona Residential | 4.Fiume Dei Nobili | 5.Città Giardino | 6.Regina Pacis | 7.Piazza Tevere | 8.Borgo | 9.Villa Reatina | 10.Centro Storico | Average Scores Per Performance | Insufficient Score < 6 (%) * | |
|---|---|---|---|---|---|---|---|---|---|---|---|---|---|
| Natural Elements | Vegetation | 5.6 | 6.2 | 6 | 3 | 6.3 | 6 | 6 | 6.2 | 4 | 4.6 | 5.4 | 40 |
| Water | 3.2 | 5.2 | 0.3 | 4.8 | 3.6 | 4.4 | 4.3 | 6.4 | 4 | 6.4 | 4.3 | 80 | |
| Protection of biodiversity | 10 | 10 | 10 | 8 | 8 | 8 | 10 | 8 | 8 | 8 | 8.8 | 0 | |
| Built Environment | Functional mix | 7 | 5.6 | 2.4 | 8 | 8.1 | 5.7 | 8.6 | 8.1 | 5.5 | 7.8 | 6.7 | 40 |
| Hierarchy | 4 | 4 | 4 | 7 | 7 | 7 | 4 | 10 | 0 | 10 | 5.7 | 50 | |
| Landmarks | 0 | 0 | 0 | 0 | 0 | 0 | 0 | 6.8 | 6 | 9.2 | 2.2 | 70 | |
| Margin | 4.2 | 4.3 | 4.7 | 8.3 | 6.2 | 5.9 | 3.9 | 6.1 | 3.8 | 8.3 | 5.6 | 50 | |
| Nodes | 3 | 3 | 3 | 10 | 3 | 3 | 3 | 3 | 3 | 8 | 4.2 | 80 | |
| Paving quality | 7 | 7.3 | 7 | 6.5 | 6.3 | 6.3 | 7.2 | 6 | 7 | 6.1 | 6.7 | 0 | |
| Change of use | 2.5 | 7.5 | 0 | 7.5 | 2.5 | 0 | 2.5 | 6.3 | 0 | 5.6 | 3.4 | 70 | |
| Mobility | Availability of Parking | 9.1 | 6.9 | 6.8 | 7.7 | 7.7 | 7.2 | 6.4 | 7.4 | 7.1 | 7 | 7.3 | 0 |
| Public transportation | 3.4 | 2.2 | 2.4 | 3.3 | 2.5 | 2.3 | 2.6 | 2.7 | 2.5 | 3.3 | 2.7 | 100 | |
| Public transportation stops | 6,8 | 4,2 | 6,1 | 6,5 | 6,9 | 6,5 | 6,5 | 6,6 | 7,1 | 6,5 | 6.4 | 10 | |
| Pedestrian crossings | 6.2 | 3.1 | 0.4 | 5.5 | 3.2 | 4.2 | 4.4 | 3.3 | 1.8 | 3.3 | 3.5 | 90 | |
| Road (vehicle) traffic | 6.6 | 8.8 | 8.9 | 4.3 | 7.5 | 6.9 | 7.1 | 5.9 | 7.1 | 7.7 | 7.1 | 20 | |
| Sidewalks | 7.1 | 4.2 | 1.8 | 4.5 | 4.5 | 4 | 2.4 | 6.4 | 2 | 3.6 | 4.0 | 80 | |
| Availability of bicycle paths | 0.1 | 2.9 | 0 | 3.2 | 4.5 | 2.7 | 0.3 | 5.5 | 0 | 3.5 | 2.3 | 100 | |
| Availability of pedestrian zones | 5.5 | 2 | 5.4 | 6.9 | 6.2 | 2 | 5.5 | 7.9 | 3.8 | 8 | 5.3 | 60 | |
| Availability of LTZ | 0 | 0 | 0 | 3 | 1.5 | 2.9 | 0.8 | 7.6 | 0 | 8.9 | 2.5 | 80 | |
| Pres. public roads | 2 | 2.1 | 2.3 | 2.2 | 2.4 | 2.1 | 2.2 | 2.1 | 1.7 | 8.1 | 2.7 | 90 | |
| Urban furniture | Availability of Seating | 3.2 | 3 | 2.4 | 2.7 | 3.4 | 3 | 2.7 | 3.1 | 2.7 | 3.1 | 2.9 | 100 |
| Availability of lighting | 6.5 | 6.3 | 7.2 | 5.8 | 6.5 | 5.6 | 6.5 | 6.5 | 5.5 | 5.7 | 6.2 | 40 | |
| Availability of Sign | 4.9 | 4.8 | 4.8 | 5.2 | 5.4 | 4.4 | 4.6 | 4.5 | 4.1 | 5.4 | 4.8 | 100 | |
| Availability of dumpsters | 6.1 | 6.2 | 3.6 | 7.1 | 7.6 | 7.3 | 6.5 | 8 | 7.5 | 6.9 | 6.7 | 10 | |
| Pres. Protection | 0 | 0 | 0 | 0 | 0 | 0 | 0 | 0 | 0 | 0 | 0:0 | 100 | |
| Perceived environment | Colors | 4.4 | 5.1 | 6.8 | 5.3 | 6.8 | 4.5 | 4 | 5.3 | 4.5 | 6.4 | 5.3 | 70 |
| Odors | 10 | 6 | 6 | 10 | 6 | 6 | 6 | 6 | 6 | 10 | 7.2 | 0 | |
| Noise | 6.4 | 7.1 | 7.8 | 5.3 | 8 | 7.1 | 7.1 | 7.2 | 8 | 7.4 | 7.1 | 10 | |
| Neatness | 3.2 | 2.9 | 2.8 | 4.6 | 3.6 | 3.4 | 3.6 | 4.3 | 4.2 | 4.7 | 3.7 | 100 | |
| Insufficient score < 6 (%) | 58.6 | 65.5 | 65.5 | 58.6 | 48.3 | 65.5 | 62.1 | 37.9 | 65.5 | 37.9 | |||
| Neighbourhoods | Ergonomics Value (%) | Usability (%) | Well-Being (%) | Safety (%) |
|---|---|---|---|---|
| 1.Micioccoli | 42.0 | 45.1 | 42.2 | 40.1 |
| 2.Fassini | 40.9 | 42.8 | 42.4 | 38.3 |
| 3.Zona Residenziale | 45.9 | 46.0 | 49.3 | 44.9 |
| 4.Fiume dei Nobili | 45.8 | 49.0 | 47.7 | 42.9 |
| 5.Città Giardino | 48.6 | 50.4 | 51.6 | 46.8 |
| 6.Regina Pacis | 39.7 | 42.3 | 41.0 | 35.9 |
| 7.Piazza Tevere | 40.4 | 43.1 | 40.7 | 38.0 |
| 8.Borgo | 45.1 | 47.3 | 47.3 | 43.1 |
| 9.Villa Reatina | 36.6 | 38.5 | 38.4 | 32.0 |
| 10.Centro Storico | 57.1 | 61.8 | 59 | 54.9 |
© 2020 by the authors. Licensee MDPI, Basel, Switzerland. This article is an open access article distributed under the terms and conditions of the Creative Commons Attribution (CC BY) license (http://creativecommons.org/licenses/by/4.0/).
Share and Cite
Appolloni, L.; Giretti, A.; Corazza, M.V.; D’Alessandro, D. Walkable Urban Environments: An Ergonomic Approach of Evaluation. Sustainability 2020, 12, 8347. https://doi.org/10.3390/su12208347
Appolloni L, Giretti A, Corazza MV, D’Alessandro D. Walkable Urban Environments: An Ergonomic Approach of Evaluation. Sustainability. 2020; 12(20):8347. https://doi.org/10.3390/su12208347
Chicago/Turabian StyleAppolloni, Letizia, Alberto Giretti, Maria Vittoria Corazza, and Daniela D’Alessandro. 2020. "Walkable Urban Environments: An Ergonomic Approach of Evaluation" Sustainability 12, no. 20: 8347. https://doi.org/10.3390/su12208347
APA StyleAppolloni, L., Giretti, A., Corazza, M. V., & D’Alessandro, D. (2020). Walkable Urban Environments: An Ergonomic Approach of Evaluation. Sustainability, 12(20), 8347. https://doi.org/10.3390/su12208347