1. Introduction
Despite a relative abundance of land and land-based resources, population growth currently outpaces agricultural production in sub-Saharan Africa. Raising agricultural productivity is therefore increasingly seen as a necessary development trajectory to stimulate a domestic surplus which can be used to wean its countries off food imports, feed growing cities, and improve rural livelihoods. Among agricultural economists as well as policy-makers, reference is often made to the Asian Green Revolution and the role of intensified, smallholder-based cereal production in alleviating rural poverty, improving food security, and lowering urban food prices. Given the concentration of poverty in the rural areas of Africa and largely equitable land-holding structures, the smallholder-based agricultural development model has been advanced as a way of reducing poverty and setting African economies on the path to structural transformation and eventually modernization [
1].
Intensification under population pressure, according to the classical perspective advanced by Boserup [
2] (1965), leads to a reduction in fallow and higher use of manure and fertilizers and investments in mechanization bringing higher agricultural productivity over time, which is intensification. Conventional intensification successfully increases yields but is also linked to decreased biodiversity, for instance reduction in species richness [
3]. Although yields can be raised in the short term, for instance through external inputs or the exhaustion of natural resources, over time, falling land productivity may be the result of unsustainable production practices. Meanwhile, the replicability of the Asian smallholder model to an African context has been queried, given poorer infrastructure, lower initial smallholder productivity, rising climate-related unpredictability, weaker linkages to the industrial sector, and major changes in the global food system [
4,
5,
6,
7]. The Asian smallholder model has therefore been questioned on the grounds of environmental but also social sustainability.
In this context, several alternative intensification concepts have been advanced: ecological (EI) and agroecological (AEI) intensification, for instance, underline the ecological principles of environmental sustainability, focusing on maintaining ecosystem services [
8]. Sustainable agricultural intensification (SAI) has been put forward as an alternative intensification route, in which more food is produced from a given area, while simultaneously reducing environmental impacts, hence combining both environmental and social concerns [
9,
10]. As such, SAI presents a smallholder-based alternative to the Asian model, less focused on economic productivity and more concerned with environmental and social outcomes. Although the concept and especially its praxis have been criticized as vague and a way of green-washing productivist approaches, attention to the environmental and social consequences of agricultural intensification is warranted, especially in an African context where short term food security considerations may be pitted against longer term environmental sustainability.
The SAI concept has, to date, been riddled with methodological elusiveness, however; how sustainable intensification should be measured in space and time is not specified in the literature, nor are there concrete indicators or metrics tied to the concept [
11]. Within the natural sciences, yield—that is, the production of crops per unit land area—is the most common indicator of agricultural productivity followed by input efficiency and water efficiency [
12]. Within agricultural economics and the broader social sciences, productivity can be measured as production from a given area (yield) or the economic value of such production. The social sciences hence approach yields in terms of the use values of agricultural production to the producers, either as food or commodities. This narrower understanding of yields focused on human needs risks, downplaying the long-term environmental aspects of agricultural intensification.
The complexity of man–land relationships, in the context of largely agrarian-based livelihoods characterized by poverty, calls for combining data sources and theoretical approaches in new ways for exploring intensification both as a practical development route as well as a theoretical concept. Methodological advances in remote sensing paralleled with more than decadal time series at a global scale have added to the possibilities for measuring changes in agricultural productivity over time. In what follows, we compare such measurements with traditional social science survey data on grain yields collected on the ground, using remote sensing data covering the period 2001 to 2015 and quantitative survey data sampled at four points in time—2002, 2008, 2015, and 2018.
Tanzania has for several decades promoted smallholder-based intensification in maize and rice as a pro-poor development strategy, making it a relevant case for analyzing potential trade-offs between environmental and social sustainability. This paper uses the case of four villages in Tanzania to analyze the prospects for sustainable agricultural intensification using a mixed-methods, interdisciplinary approach. The aim of the article is threefold: methodologically, we wish to shed light on and contrast how productivity in smallholder-based agriculture can be measured; practically, we wish to identify land use practices that can be considered to be both socially as well as environmentally sustainable; finally, our theoretical aim is to problematize the concept of agricultural intensification further, wedding yield-based approaches with the more holistic (but vague) concept of sustainable agricultural intensification. In what follows, we start by tracing the theoretical heritage of the concept of intensification. We then discuss the policies and national trends in grain intensification in Tanzania, where many of the propositions of the theoretical literature have been applied in agricultural policies aimed to modernize smallholder agriculture as a way of raising yields and redressing food insecurity. The methodology section then presents the research design used and describes the study sites. We answer three research questions in the empirical sections: firstly, whether agricultural intensification is occurring in the study sites and whether it is sustainable. A second research question relates to land use practices and asks whether certain land use practices can be linked to sustainable intensification and what implications this holds for agricultural policy in Tanzania. Finally, we address the theoretical and methodological implications of the findings.
2. Theoretical Perspectives on Intensification
As noted in the introduction, theories of intensification, and more recently, sustainable agricultural intensification, trace their disciplinary origins to economics on the one hand and the natural sciences and agroecology on the other. These disciplines differ fundamentally in the sense that macro-economic change, or what is known as structural transformation, is the focus of economists, whereas the agroecological interest lies in the consequences for the environment and the long-term relationship between people and the environment.
Macro-level economic processes of structural transformation involve increasing agricultural productivity, while reducing dependence on agriculture in an economy as a whole, in terms of share of employment as well as GDP. Historically, this process occurred in the Western Hemisphere as countries industrialized, relying increasingly on manufacturing and services as sources of employment and growth. Staple crop intensification—that is, raising productivity mainly in cereals—is considered the starting point for this process of structural change as increased productivity in a country’s major food staple can produce a surplus of food that lowers food prices for growing urban populations, while improving rural livelihoods in countries where employment is largely tied to smallholder agriculture. Over time, commercial opportunities in the grain sector enable an exit from agriculture into manufacturing and migration from rural to urban areas [
13,
14,
15]. A more recent example of this trajectory is the Asian Green Revolution, where seed-fertilizer technology, mechanization, and commercialization encouraged widespread intensification in rice. In turn, this was accompanied by falling poverty and rapid economic growth in countries such as India, Indonesia, and the Philippines [
16]. While the Asian model has been successful in relation to such macro-level metrics, it has also been increasingly criticized as leading to high environmental costs and increasing social differentiation.
In contrast, the concept of sustainable agricultural intensification has been formulated as a way of shifting attention away from presumptions of replicability and the preoccupation with economic productivity found in conventional intensification models and methods. Sustainable agricultural intensification is non-prescriptive and locally focused. Originally defined as “producing more output from the same area of land while reducing the negative environmental impacts and at the same time increasing contributions to natural capital and the flow of environmental services” [
17], sustainable agricultural intensification is a normative concept focusing on outcomes [
18] rather than proposing a theory of social change or methodologies and techniques for how to achieve these outcomes. An early pre-occupation with environmental outcomes led to criticism of a lack of social concerns, and more recent developments of this literature have added an “explicit emphasis on a wider set of environmental as well as socially progressive outcomes” [
19]. As such, sustainable agricultural intensification combines social as well as environmental aspects of intensification. Nonetheless, the vagueness of the concept and its practical implications has prompted criticism that the discourse surrounding the concept is being appropriated by “productivist” interests as a way of green-washing interventions [
20,
21]. Methodologically, several measurement problems can be identified in relation to the concept of sustainable agricultural intensification—for instance, how to define a socially progressive outcome is immensely difficult, while issues of time and scale complicate measurement further.
While the perspectives on intensification have different theoretical roots, they are both concerned with changes in agricultural productivity over time—that is, increase in production on a given piece of land. In the case of sustainable agricultural intensification (SAI), this also involves reducing negative environmental impact and increasing natural capital. In the context of low-income, agriculturally based economies and rural livelihoods characterized by poverty, political and practical precedence has in many cases been given to raising land productivity.
3. National Policies on Grain Crop Intensification and Intensification Trends
Agricultural policy in Tanzania has focused on grain-based intensification since the early 1970s, aiming to encourage smallholder participation and productivity growth in maize and rice. Like several African countries, Tanzania has experimented with input subsidy schemes to increase the use of hybrid seeds and inorganic fertilizers. Three distinct phases of such schemes are described by Msuya, Isinika, and Dzanku [
22]. Between 1974 and 1984, major maize producing regions were targeted as recipients of comprehensive subsidies. Eventually, this phase ended as structural policies in the mid-1990s sought to decrease public spending, while the costs of the program became prohibitive. A partial subsidy for maize in particular was reintroduced in 2003, to counter falling yields and low production, marking the start of the second phase, which continued until the growing season of 2007/2008, when the National Agricultural Input Voucher Scheme (NAIVS) was introduced. This scheme was more comprehensive, providing a 50% subsidy for chemical fertilizers and improved seeds for maize and rice in six high-potential regions of the country (Iringa, Mbeya, Rukwa, Ruvuma, Kigoma, and Morogoro) [
23]. In 2011, the program was extended to 2015 and expanded to cover sixteen regions. The assumption was that farmers by the end of 2015 would have been sufficiently exposed to the new inputs to continue using them without subsidies. Criteria related to cultivated farm size (less than 1 ha) exclude farmers that are not smallholders from benefiting from the scheme. Where the availability of vouchers is lower than the number of eligible beneficiaries, farmers who had not been using inputs during the five years prior to the scheme and female-headed households were to be prioritized [
22,
23].
Whereas maize is the most important food and cash crop in the country, the Tanzanian government has identified rice as a potential cash crop and has engaged in a deliberate policy of encouraging rice production under the National Rice Development Strategy, launched in 2008. The policy aimed to double rice production by the year 2018, a goal which was achieved already in 2016 [
24,
25]. While rice production is still predominantly smallholder-based, an estimated 70% of all rice produced is rain-fed [
24]. Studies suggest that the sector is attracting the attention of large scale commercial farmers, both domestic [
26] and foreign [
27]. Morogoro Region is one of three regions where rice has historically been grown. Mechanization and commercialization has increased areas under rice as well as yields [
25,
28].
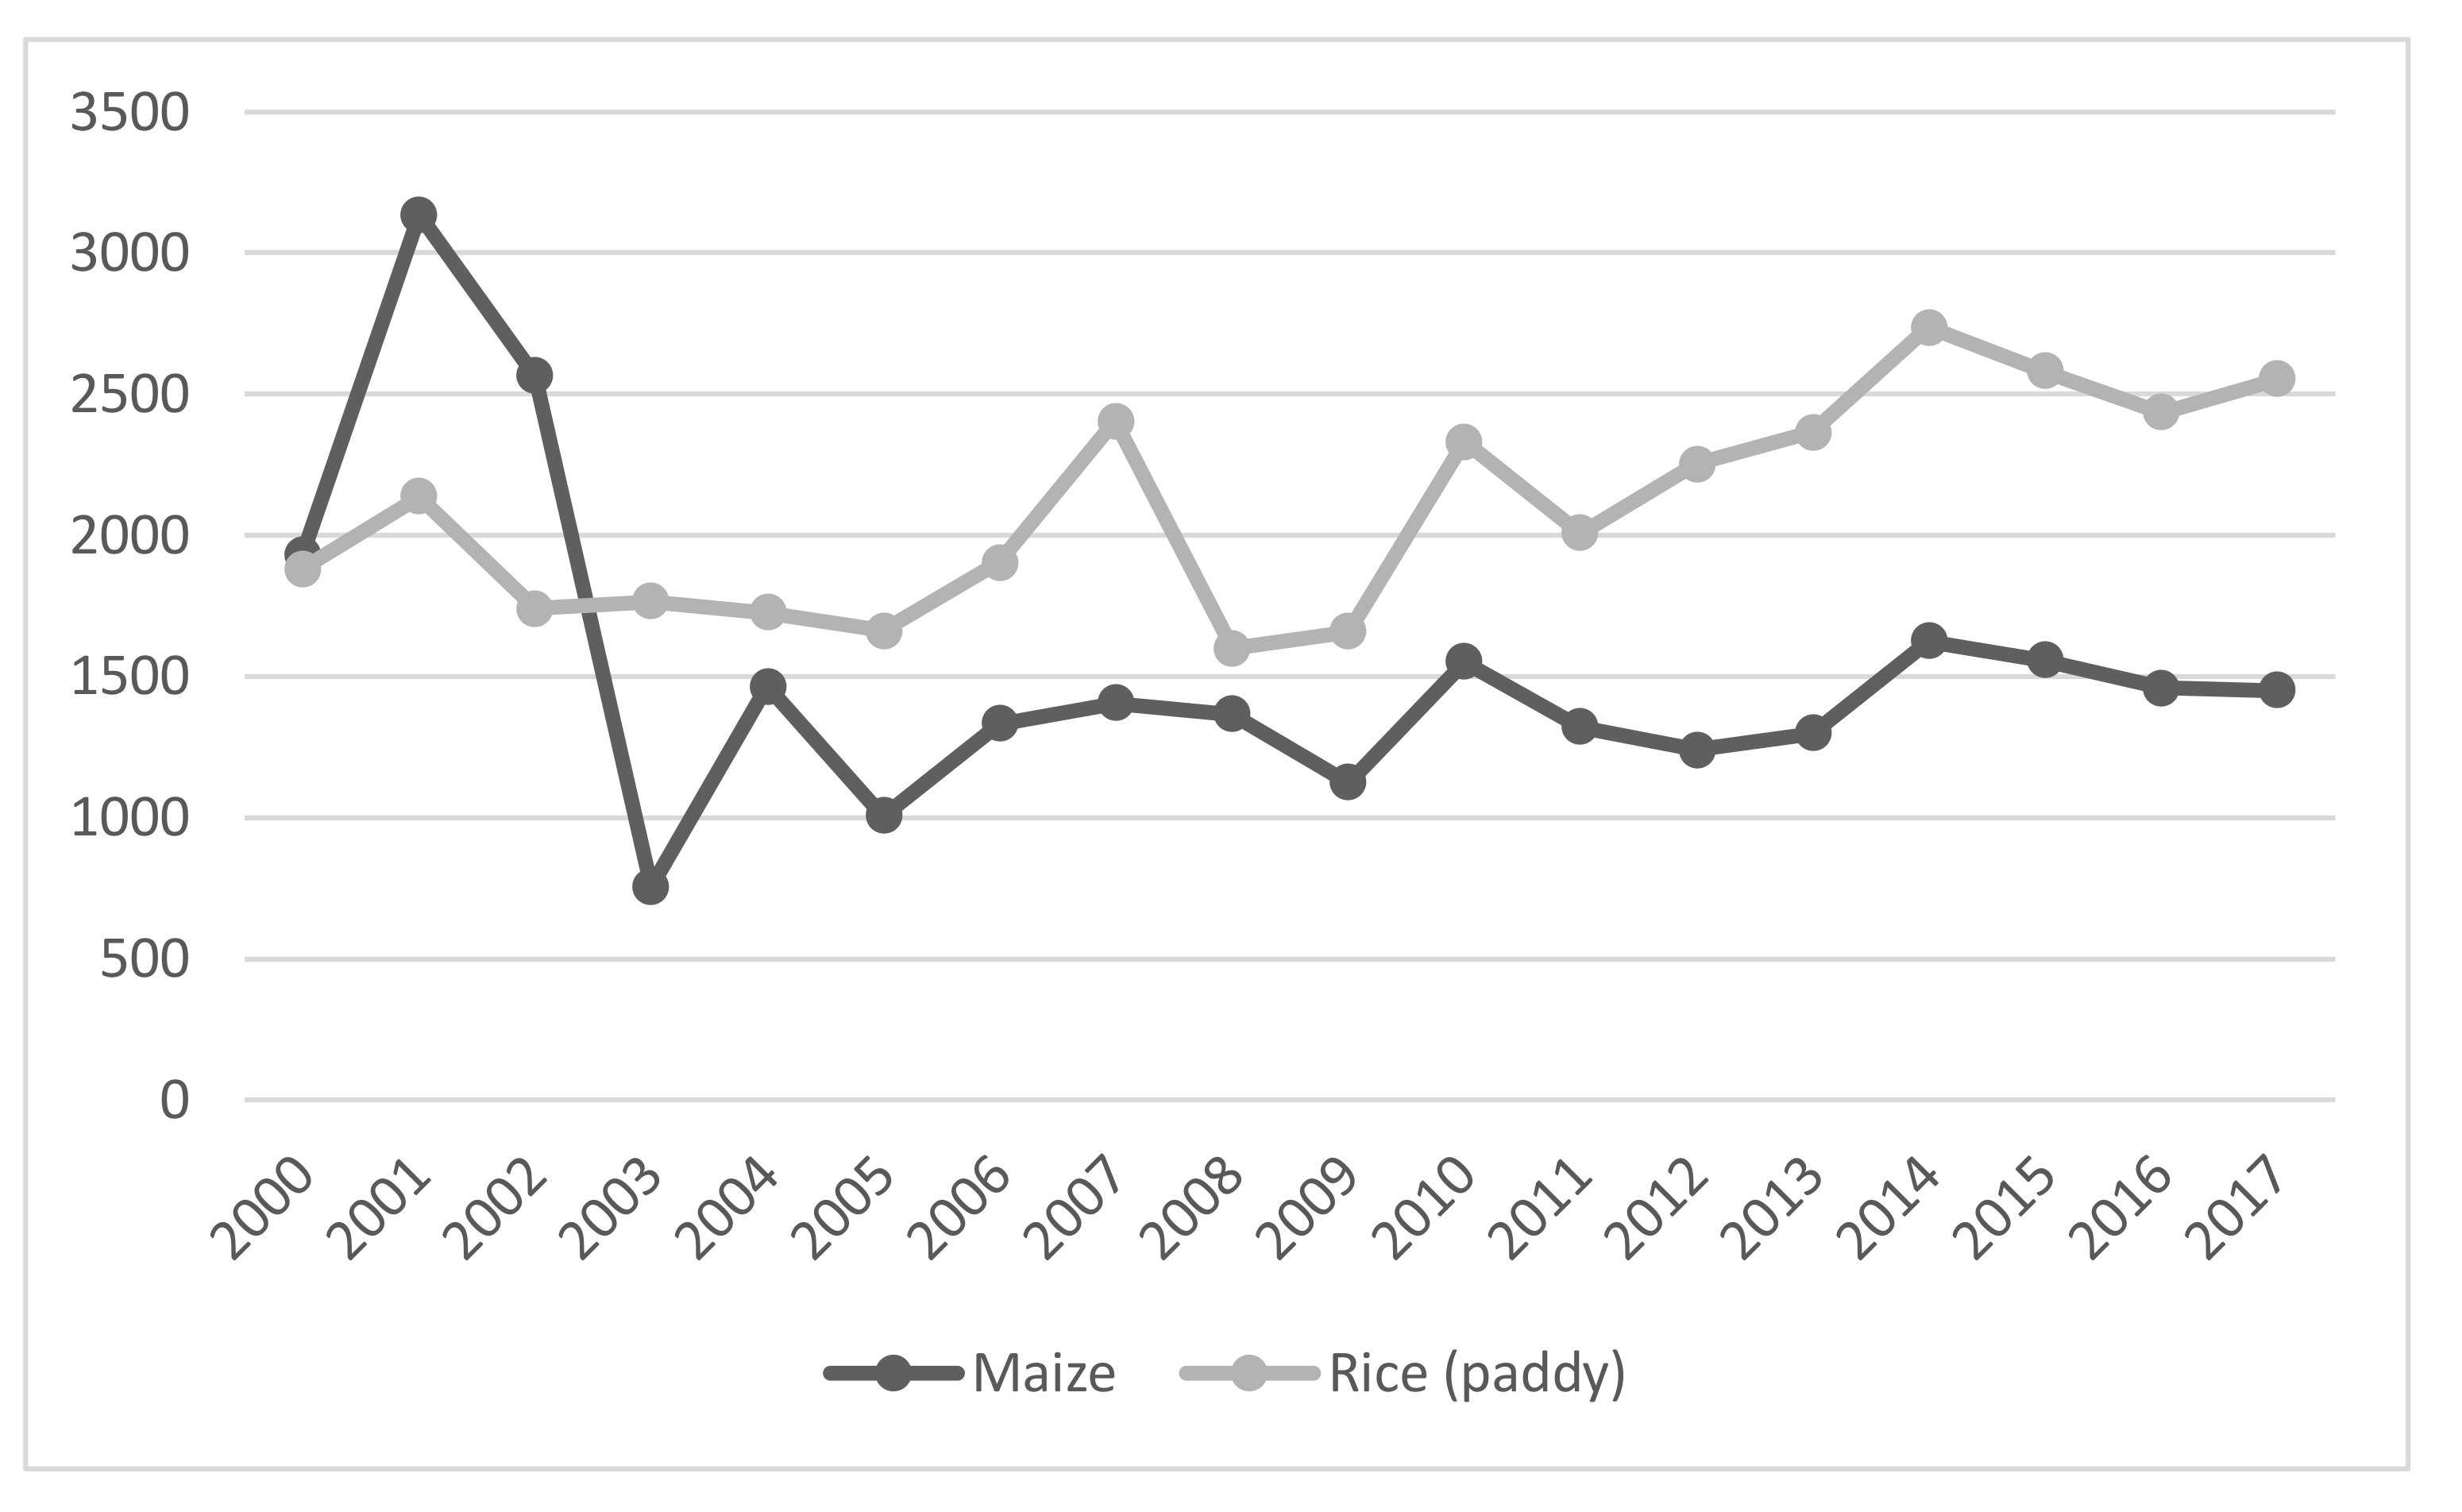
National estimates for maize and rice yields, based on FAO-stat 2019 (
Figure 1), suggest that maize yields initially dropped quite dramatically and then, remained largely stagnant during the timeframe of the project (2000–2018), while rice yields have risen gradually, especially during the past decade. In this sense, national policies aimed at increasing intensification in maize appear to have been ineffective. Whether the intensification that can be seen for rice is a response to such policies, market incentives or some combination of the two are not established in the literature, however.
4. Materials and Methods
This paper builds on three sets of data: we depart from a quantitative dataset which contains yield data for maize and rice that have been collected in four villages since the early 2000s. This is a sub-sample of a larger database—the Afrint database—which contains survey data for smallholder farm households collected in 23 villages in seven regions in three African countries—Malawi, Tanzania, and Zambia—at four points in time—2002, 2008, 2013/15, and 2017/18. These data are combined with two other types of data: remotely sensed spatial data on land productivity covering the period 2000–2015 and field observations and qualitative data collected in the villages in 2017 and 2018. Whereas the quantitative data and the remotely sensed data were used to establish patterns of changing production and yields, the qualitative data were collected to explain land use and livelihood dynamics at the micro-level that could be used to understand such changes over time. The data sources used are presented in
Table 1 and described in more detail in
Section 4.2 below.
4.1. The Afrint Database
Our point of departure is the Afrint project—a project which initially aimed to address the potential for a smallholder-based, Asian style Green Revolution in sub-Saharan Africa. The original focus of the project hence was a traditional perspective of intensification as measured in land productivity changes in the four main grain staples—rice, maize, wheat, and sorghum over time, see [
29]. To fulfill the aim of the original project, a multi-stage, purposive sampling of countries, regions, and villages was carried out, with nine countries being sampled in the maize and cassava belt. Over time, the number of countries has been decreased as funding opportunities have been erratic and in the final phase of the project, only three countries remain: Malawi, Tanzania, and Zambia.
Within each country, regions were selected that were considered to hold a latent, but unexplored, potential for agricultural intensification in grain crops. These regions were above average in terms of agroecology and commercialization, but did not include well recognized examples of agricultural intensification such as Mount Meru in Tanzania or Machakos in Kenya. Given these overarching selection criteria, regions were selected to provide variety in each country in terms of this potential. In the case of Tanzania, two regions were selected, Morogoro Region and Iringa Region, with Morogoro Region representing the more well-endowed region. Within each region, again, villages were purposively sampled to provide variety. Finally, a stratified, random sample was taken of the village population, with the sample being representative at the village level. The village is the smallest administrative unit and is governed by a village government, with several villages constituting a ward.
In the case of Tanzania, ten study sites (villages) were sampled, five in each region. For this study, we focus on four villages: Idete, Katurukila, Kitelewasi, and Ihemi. The quantitative sample consists of a total of 396 households (2018) for the full country sample, divided evenly among the study sites, meaning that the sample for each village is around forty households. Data were collected in 2002, 2008, 2015, and most recently, in 2018. Households have been resurveyed, providing the opportunity to follow changes over a time period of more than fifteen years. To deal with attrition due to death, one descendent has been sampled for each deceased household, while respondents that have left the village altogether have been replaced by new informants sampled from the village population.
The study unit is the farm household, with the survey being administered to the self-identified farm manager. This approach has some drawbacks—for instance, the obfuscation of intra-household relations and the possibility that the farm manager is not sufficiently knowledgeable about the activities of the other household members. Nonetheless, to be able to compare the data over time, the same study unit has been used throughout the various project phases. The farm manager generally overlaps with the household head, except for cases where the household is managed by a female de facto head of household, with a non-resident male household head staying elsewhere.
Given the initial focus on agricultural intensification in grain crops, the survey documents the cultivated area and production in rice, maize, sorghum, and wheat. For Tanzania, only rice and maize are of relevance however, since they have been the focus of government policy on food security, being the main staple crops. The survey asks the farmer to list the production and cultivated area of these crops for the current crop year as well as the two previous ones. In addition to production data, the survey also contains data on the use of agricultural inputs, such as hybrid seeds and inorganic fertilizer, land preparation technology, as well as commercialization. The quantitative data provide one measure of agricultural intensification; production data and data on cultivated area have been collected from the household head for maize and rice for the current year and the two previous years. These data enable the calculation of three-year averages for yields of maize and rice and tracing yield trends over time. Land productivity for agricultural land specifically can hence be calculated using this method. This can be contrasted and compared with the land productivity measurements collected from the sky through remote sensing.
In terms of statistical analysis, we rely on describing trends in the socioeconomic data over time, rather than statistical modelling approaches. This approach is warranted as the sample sizes are too small at the village level to enable econometric modelling. An analytical framework that is mainly descriptive redresses the high-dimensionality problem stemming from a combination of few data points/subjects (villages) and many parameters of relevance [
30]. We test for the statistical significance of changes in yield over time through T-tests and of differences in means between villages using one way ANOVA and Tamhane’s T 2 post hoc test.
4.2. Remote Sensing Data and Methodology
The remote sensing methodology builds on methods originally developed to support the assessment and reporting of land conditions for different countries of the world related to Sustainable Development Goal (SDG) 15 [
31]. SDG 15 promotes the sustainable development of life on land and sets out 12 targets to achieve the SDG 15 targets [
32]. The overarching goal is to combat desertification, aid in restoring degraded land and soil, and achieve a land degradation neutral world. Three sub-indicators and their associated metrics defined by the UNCCD are used to evaluate and report changes in land condition and of relevance for this study [
32]. They are land cover, land productivity, and carbon stocks. Land cover is the physical material covering the surface of the earth and the transition from one type of land cover to another can have both positive and negative outcomes depending on the context. Land productivity is the production of biomass within a land areal unit and is related to both cultivated biomass (measured as yields) and naturally occurring biomass production. Finally, carbon stocks are of minor importance to our analysis.
Land productivity is used as a proxy to assess the impact of biophysical factors and land use on land-based natural environments [
33]. Land productivity refers to the total above-ground net primary productivity (NPP) defined as the energy fixed by plants minus their respiration—this translates into the rate of biomass accumulation in an ecosystem. NPP, the amount of photosynthesized carbon stored as plant biomass, supplies essential ecosystem services such as the annual provision of crops and pasture, as well as adding to annual increments of woody biomass [
34]. Trends.Earth is a plug-in for the software Quantum GIS that measures three aspects of land productivity (see below) from remote sensing data and is used in the analysis in the following way [
35,
36].
Productivity State is used to detect recent changes in primary productivity, benchmarked against a baseline period. In this analysis, the baseline period is taken to be 2001–2011 and the period for which the recent changes are assessed is 2012–2015. This period largely overlaps with the survey period, hence providing temporal grounds for comparison.
Productivity Performance assesses local productivity relative to similar vegetation types in similar land cover types or bioclimatic zones throughout the study area and Productivity Trajectory assesses the rate of change in primary productivity over time on a pixel-by-pixel basis and performs a linear regression analysis, together with a Mann–Kendall non-parametric significance test (p-value ≤ 0.05) to identify significant positive and negative trends that would indicate potential improvement or degradation in land condition, respectively, compared to the baseline. To sum up, the methodology provides means to assess qualitatively and quantitatively how the agricultural landscape is transforming in terms of land degradation and productivity performance.
The inputs to Trends.Earth are satellite imagery from the Moderate Resolution Imaging Spectroradiometer (MODIS) time series dataset, land cover from the European Space Agency (ESA) CCI-LC, and district polygons from the Database of Global Administrative Areas (GADM) and they are used to contextualize village activity spaces.
From MODIS imagery, the Normalized Difference Vegetation Index (NDVI) is calculated. Vegetation index-based comparisons using multi-date satellite data methods have for a long time been proposed as a set of useful methodologies for change detection in land use and land cover [
37,
38,
39]. It is an index of plant “greenness” and as such, an index of the photosynthetic activity of vegetation [
40]. The NDVI has been correlated to many variables such as crop nutrient deficiency, final yield in small grains, the abundance of agricultural biodiversity, and long-term water stress [
37,
41]. This index offers opportunities for a systematic, repeatable, and spatially exhaustive study of vegetation in relation to human and natural ecosystems dynamics.
The CCI-LC dataset is 300 m resolution annual maps of land cover that come in 37 land cover classes defined by ESA. Seven categories are recommended by the UNCCD Land Degradation Target Setting Program and are used in this study: forest, grassland, cropland, wetland, artificial area, bare land, and water body. In Trends.Earth, land cover degradation is defined based on user defined qualifications of transitions from one land cover class to the other. This provides the flexibility of incorporating locally specific assessments of outcomes of land cover transitions, as well as the incorporation of perceived utilities of land cover change outcomes, as recognized by local land users.
To evaluate the consistency of trends in NPP, we use the Breaks For Additive Seasonal and Trend (BFAST) and residual trend analysis to dissociate the effects of local variations in rain and temperature (drivers of vegetation productivity) from other potential influences. Points for the analysis of time series for specific locations were purposively selected to represent locations that represented different characteristics of vegetation activity observed in the trend analysis. Classical seasonal decomposition using moving averages was used to filter and break down a time series into constituent elements. Such elements include the underlying trend, seasonal element, and the noise element, using the R-package called decompose. The BFAST algorithm was used to detect and characterize abrupt changes within the trend and seasonal components of time series. Greening and browning trends were computed using greenbrown, an R-package developed by Forkel, Carvalhais et al. [
42], with “greening” indicating positive trends in vegetation greenness, while browning indicates negative trends in evergreen vegetation. We select the land cover class
cropland for the GIS analysis, since this corresponds most closely with the agricultural land covered by the socioeconomic survey.
4.3. Qualitative Field Observations and Field Work
While remote sensing data (as well as the quantitative data) can monitor changes in land productivity over time, understanding the cropping practices related to such changes requires ground-truthing and qualitative sources of information. To this end, we have collected data from key informants and group discussions and carried out field observations at two different points in time. In November 2017, three of the communities were visited—Idete, Katurukila, and Kitelewasi. The sites at the time were selected on the basis of trends in the quantitative dataset, which suggested that the villages were experiencing inclusive, agricultural growth, based on increasing commercialization; see [
43].
The data collected in 2017 focuses largely on Idete and Katurukila, since growth in Kitelewasi appeared to stem largely from the settlement gradually transforming into a peri-urban village. In the other two villages, individual interviews were conducted with both spouses in 25 households in each village by a team of five research assistants. In addition, women heading their own households were sampled and interviewed. Interviewees were selected among the surveyed households and stratified by income per adult equivalent.
In addition, a number of focus group discussions and key informant interviews were carried out by the senior researchers in the project. The findings of these interviews have been reported elsewhere and show that agricultural growth was related to rice intensification and production specifically [
25].
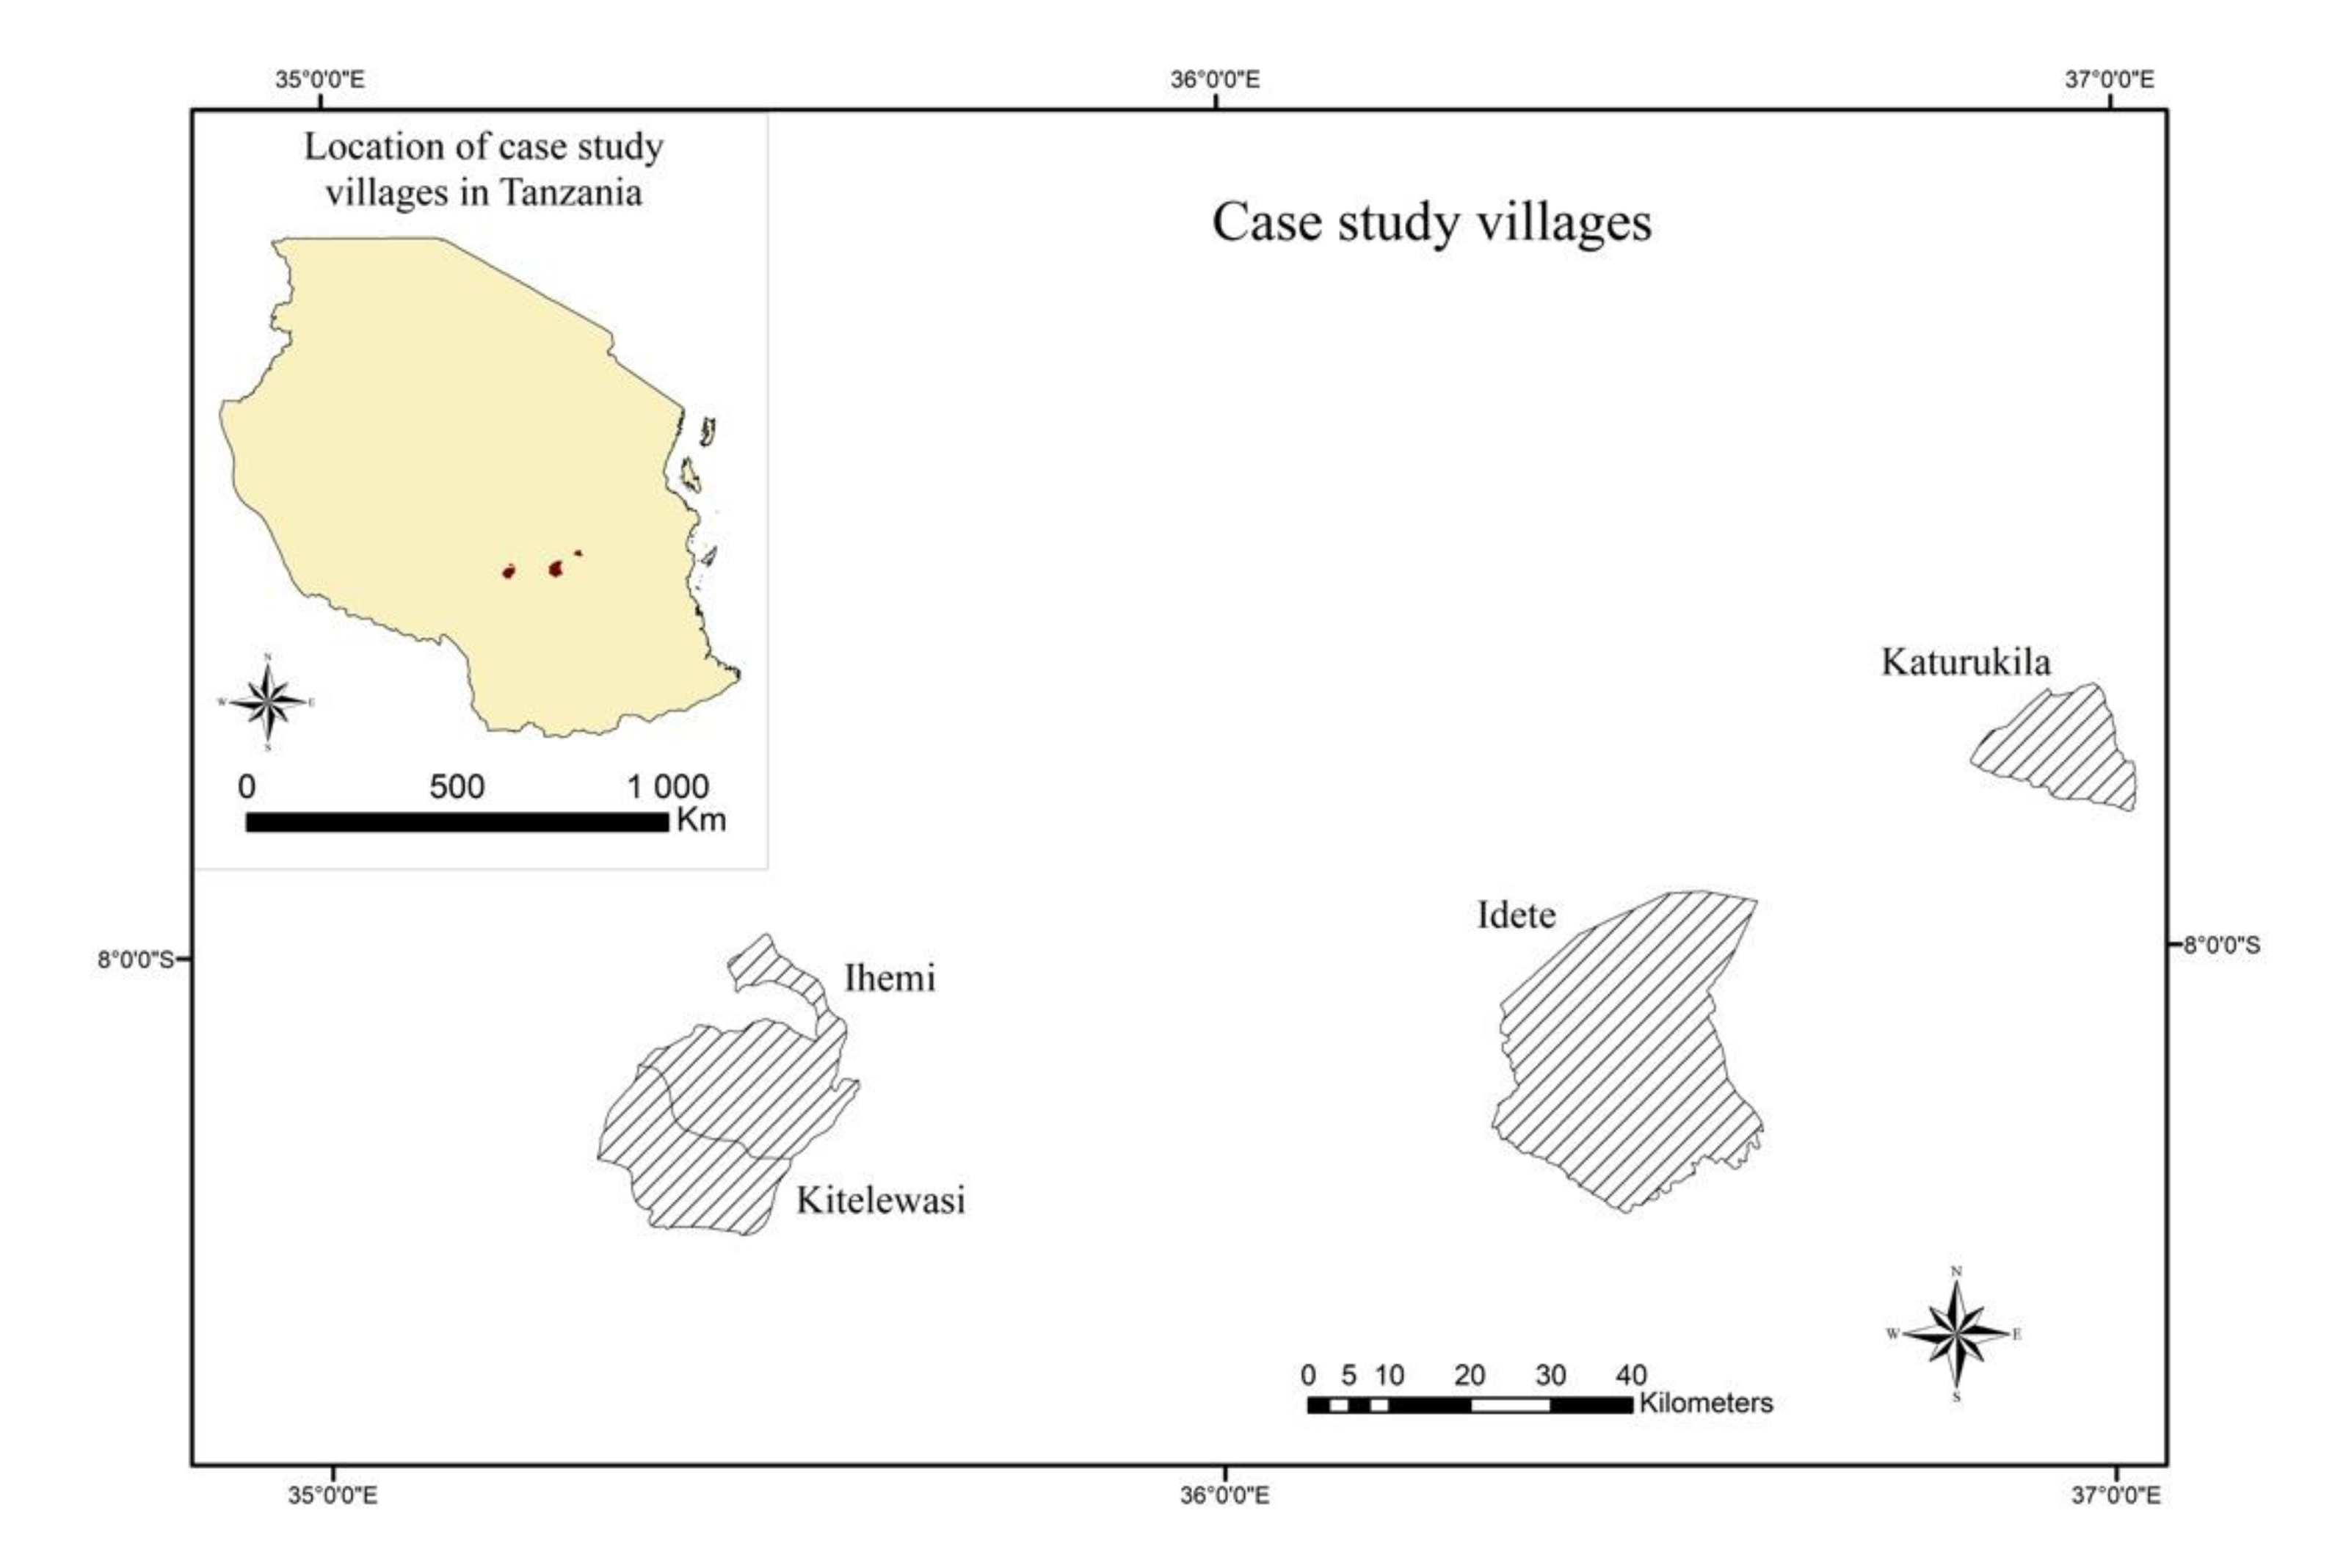
Towards the end of 2018, the three communities were visited again and an additional study site, Ihemi, was added. Ihemi was added as the fourth village since this provided variability in cropping patterns, useful for the GIS analysis (see
Figure 2 for a map of the study sites). Information on livelihood changes that can explain land use changes and changes in cropping patterns was collected through these interviews. The villages had been sampled on the one hand to follow up on earlier fieldwork, since a longitudinal perspective also with respect to the qualitative data was deemed to add depth to the analysis. Following up on this field work, ground-truthing of the GIS data specifically was undertaken by two of the authors of this paper, in September and October of 2018. Fieldwork in this latter phase involved field observations, speaking to farmers, and documenting land use patterns and production processes. Twenty-eight sites were sampled across the four villages, based on trends in the GIS data.
4.4. Site Descriptions
Morogoro study sites
Idete is located about 21 km from Ifakara town. Idete ward is composed of four villages—quantitative, socioeconomic data have been collected in one of these, known as Idete village. The village consists of around 700 households and close to 3000 people. Paddy is the main crop grown and it is highly commercialized, but is also used as the main staple food crop. Paddy is supplemented by maize, plantains, sweet potatoes, and vegetables in local production and diets. Land is relatively constrained, since the local prison owns large tracts of land. Part of this land is, however, rented out to farmers seeking to expand land under cultivation. Around a third of households rented land in 2015 [
25]. Paddy cultivation is rain-fed. Both paddy and maize are heavy feeders, leading to soil mining. Moreover, after, harvest herds of cattle from agropastoralists move in to feed on the remaining straw, contributing to further soil mining and soil degradation.
Katurukila village is one of several villages in Mkula ward and is located around 60 km from Ifakara town. It is more remote than Idete, also because it lacks regular public transport. Like in Idete, rice is a major cash and food crop, but Katurukila also has outgrower schemes for sugarcane, under the auspices of the Kilombero Sugar Company. Nonetheless, the option of participating as an outgrower is available only to a minority of well-situated farmers, as capital requirements are high to be able to participate. The village population, like in Idete, is around 3000 individuals. Due to the surrounding sugarcane plantations, and one national park, available land area for farm expansion and rental is limited. Small-scale irrigation of paddy occurs in the village.
Idete and Katurukila have a tropical climate with bi-annual rainy seasons, receiving a total annual rainfall of between 1200 and 1400 mm. The short rainy season falls between December and March and the long rains (known as Masika) fall between April and June.
Iringa Study Sites
Kitelewasi village is located about 5 km from the main highway road from Dar Es Salaam to Zambia. The village is close to Mafinga town and forms part of the town council. The village is estimated to have about 511 households (453 male-headed and 61 female-headed). Climatically, the village has suitable land and favorable weather conditions for agriculture. Soils are moderately fertile, normally dominated by yellow to red clays, favoring a diversity of land uses. The average rainfall ranges between 1000 and 1400 mm per annum, while temperatures range from 13 to 22 ºC, favoring the growth of most food and cash crops. The weather also favors growth of both tropical and some temperate fruits and some spices. Vegetation cover is mainly dominated by grasslands, exotic trees, some miombo woodlands, and shrubs.
Apart from maize production, the village is famous for brick making businesses. This activity has increased immigration into the village. Access to land is mostly through borrowing, although land is available for purchase. Only a handful of famers have land titles. The use of water pumps has increased the area of land under irrigation, which is carried out by small scale farmers
Ihemi is located in Iringa rural district. Maize is the main staple crop, produced by almost all respondents (99%) in the region, as the main food and cash crop. Other crops include beans, Irish potatoes, and other vegetables to feed an increasing urban population at Mafinga and other emerging smaller urban centers. Ihemi had a population of 505 households and the village stands out in terms of a high proportion (20%) of child-headed households (compared with less than 10% in the remaining nine villages in the quantitative sample). The farming system is dominated by maize, with relatively high levels of fertilizer use. Timber has also been increasing as an economic activity, with more households putting their land under timber or selling it off to timber investors.
5. Results
As noted earlier, the measurement of the process of intensification varies, with socioeconomic disciplines departing from yields—that is, production output measured either by volume or value per land unit. Inherent to the vagueness of the concept of sustainable agricultural intensification are problems of measurement, related to time and scale—at what length of time can intensification be pronounced as sustainable? At what spatial unit—the household, village, or even national level? The potential trade-offs between environmental and social sustainability are also many and largely unproblematized in the concept. With our data, we can do two things—on the one hand, we use the quantitative, socioeconomic data to gauge changes in yields over time with respect to maize and rice, and on the other, we can use the remotely sensed land productivity data to measure changes in land productivity over time. We can then compare and contrast the two sets of measurements. Initially, we present yield changes from survey data, followed by remotely sensed land productivity changes.
5.1. Measuring Yield Changes in Maize and Rice Using Socioeconomic Data
As a starting point, a difference in cropping patterns needs to be noted: only the respondents in the villages in Morogoro Region, Idete and Katurukila, grow both maize and rice, whereas in the Iringa villages, Ihemi and Kitelewasi, only maize is cultivated and here, it was universally grown during all four survey points. Maize hence takes on an important role as the primary staple crop in the Iringa villages. In the case of Idete and Katurukila, in Morogoro, rice (paddy) is the main staple crop, with nearly all respondents cultivating paddy throughout the sample rounds, and maize having a complementary role, being grown by 63% and 79% in the final data collection round (2018), a share that has been largely unchanged over time.
In terms of land use, the area under maize is largely similar, regardless of whether rice or maize is the dominant crop in the village, ranging from a low of 0.57 ha in Katurukila to 0.78 ha in the case of Ihemi. In the paddy producing villages, the area under paddy is much larger than the area under maize however—1.54 ha in the case of Katurukila and 1.24 ha in the case of Idete for 2018. Hence, in the Morogoro villages, the area under rice is generally considerably larger than that under maize, so rice is the dominant crop in terms of land use in these villages.
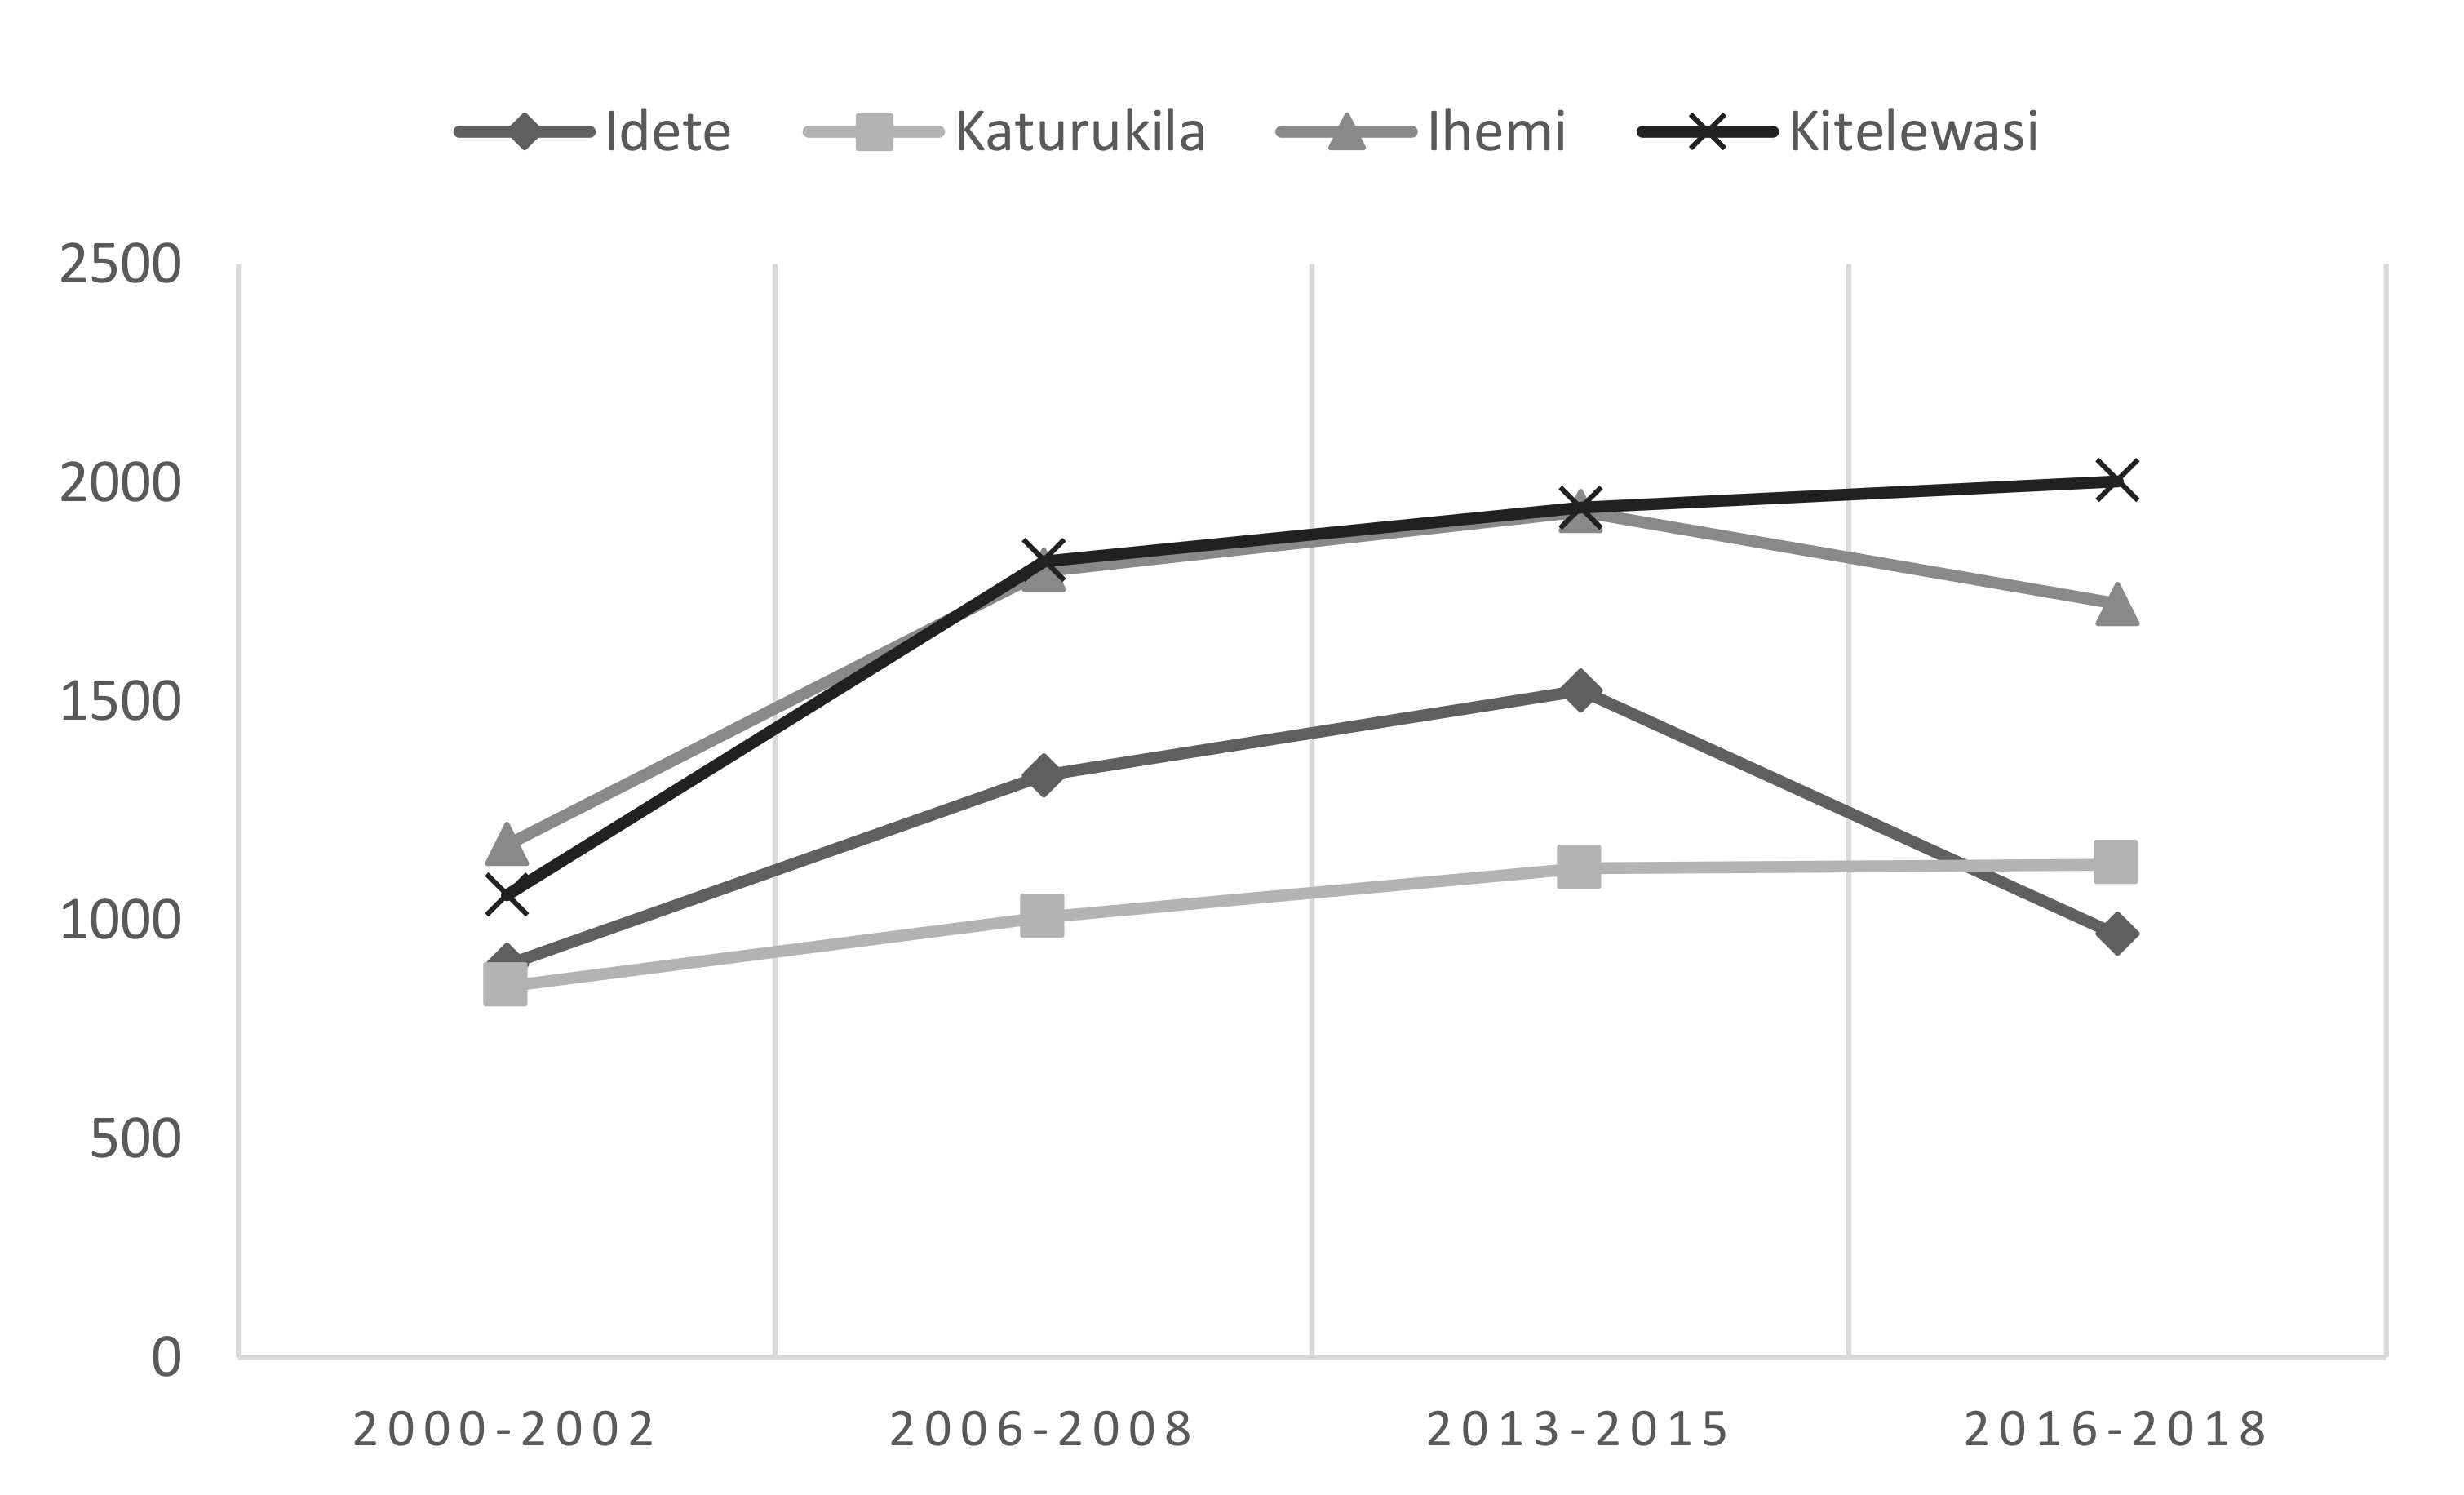
As suggested by
Figure 3, maize yields diverge between the villages, with the two villages in Morogoro having generally lower maize yields. For the final round of data collection, this difference was statistically significant between Idete and the two villages in Iringa Region and between Katurukila and Kitelewasi. The mean maize yield was more than twice as high at 2003 kg/ha in Kitelewasi, compared with 966 kg/ha in Idete. The other two villages were found in between these two, with 1126 and 1721 kg/ha for Katurukila and Ihemi, respectively. The differences in yield are not surprising, given the relatively smaller role of maize in Idete and Katurukila. As suggested by
Figure 3, maize yields have also been largely stagnant or decreased over time in these villages. Hence, intensification in maize has not occurred in these villages. In the case of Ihemi and especially Kitelewasi, yields have increased and in the latter case, almost doubled since the first phase of data collection.
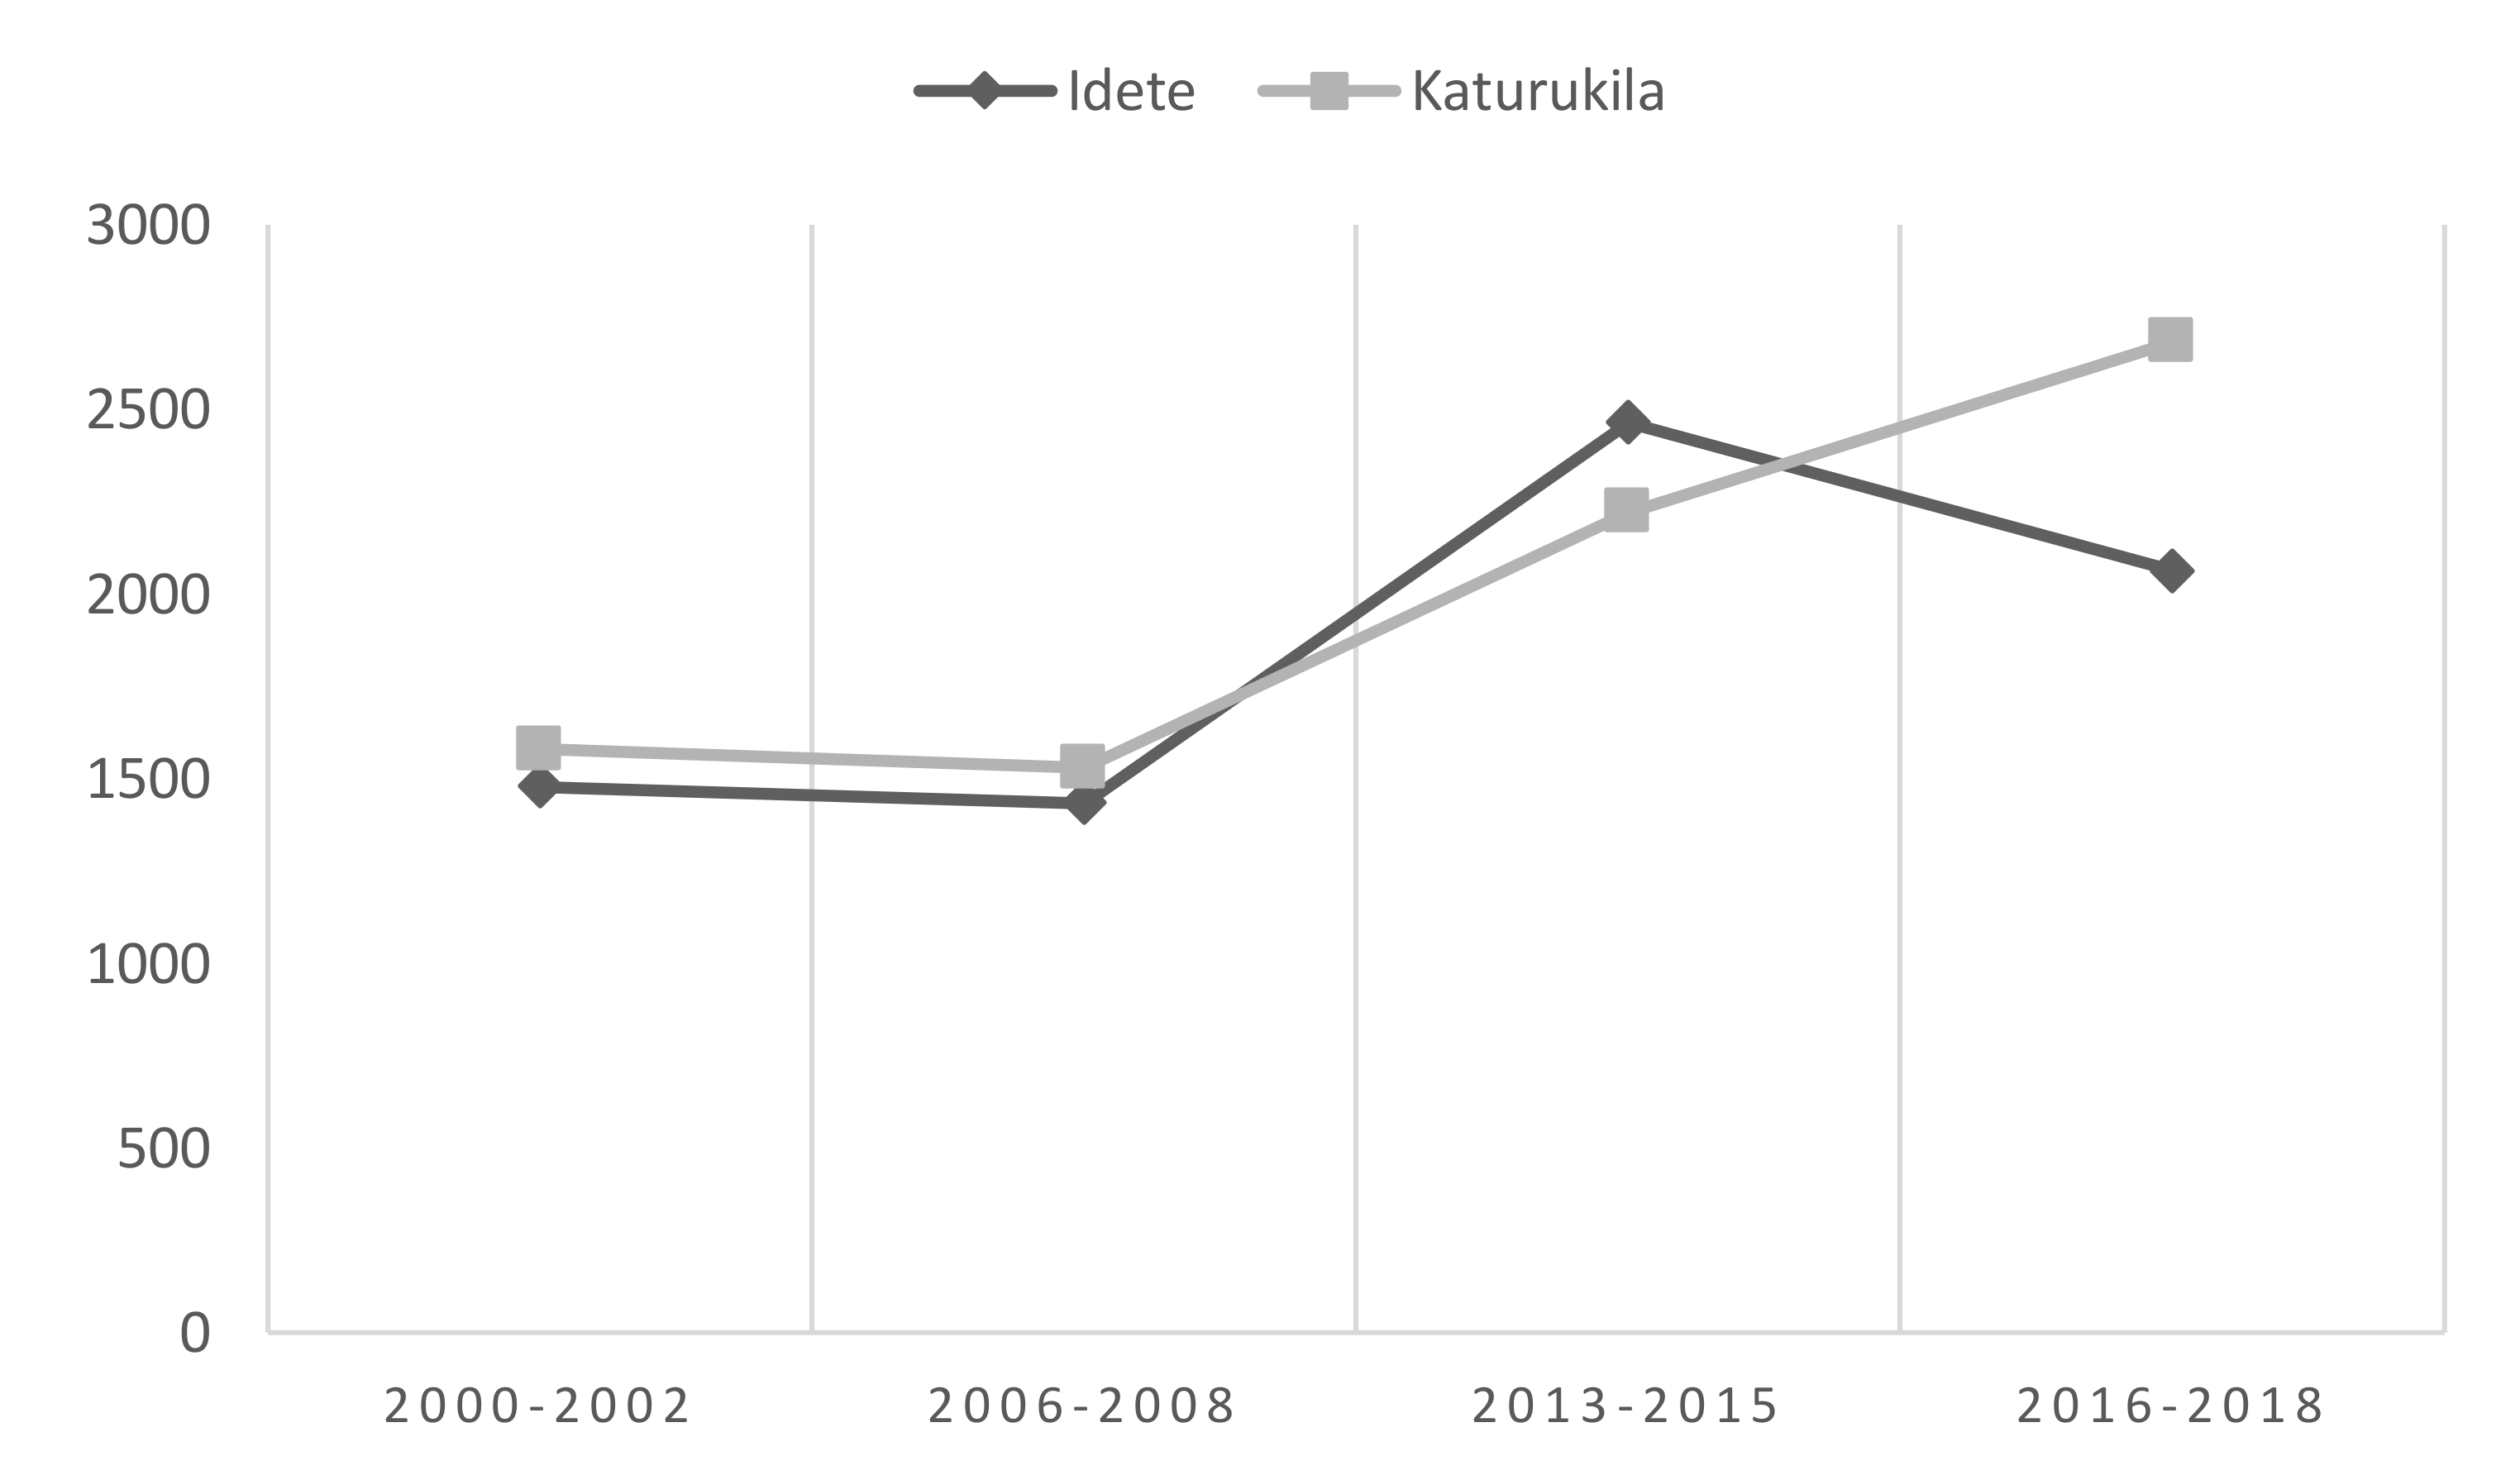
For rice yields, there is a large jump in yields between the second and third phases of the project, and then, as seen in
Figure 4, a slight drop in the case of Idete and a continued rise in Katurukila. The difference since the start of the project is quite remarkable in the case of Katurukila, where yields grew from 1579 to 2682 kg/ha, equivalent to a 70% increase. A smaller increase can be seen in Idete, from 1487 to 2062 kg/ha, corresponding to 40%. Both these differences are statistically significant at the 1% level. The jump in yield coincides with the period when the input subsidy was extended to rice since 2008 [
22].
In sum, therefore, over time, (statistically significant) yield increases—that is, intensification based on staple crops (either in maize or in rice) has occurred in the four study sites, when we consider the data from the quantitative survey. As suggested by an earlier study from two of the villages specifically [
25], as well as work drawing on the larger dataset [
44,
45,
46] and other studies using a number of large-scale datasets [
47] (including the Afrint dataset), the drivers behind intensification are closely linked to commercialization. Rising yields can, therefore, be seen as a response to improved market opportunities and rising prices. As such, socioeconomic surveys can shed light on production as an economic activity, but they can only tell us part of the story in terms of the environmental aspects of such production. Situating socioeconomic data in relation to broader land productivity changes is a fruitful way of capturing the environmental aspects of intensification over an extended period of time and can enable us to understand the long-term consequences of production responses on land productivity. Theoretically, a production response in relation to market opportunities can be achieved by mining soils and exhausting soil fertility with such consequences being felt only over time. While yields may be possible to attain through external inputs, in the long run, a fall in land productivity may be visible as a result of unsustainable production practices. Using remotely sensed data on land productivity enables us to contextualize the socioeconomic data in relation to broader land use changes and cropland productivity, going beyond the two grain crops. Essentially, the focus is shifted from the farmer to the landscape.
5.2. Tracing Changes in Land Productivity Over Time Using Remotely Sensed Data
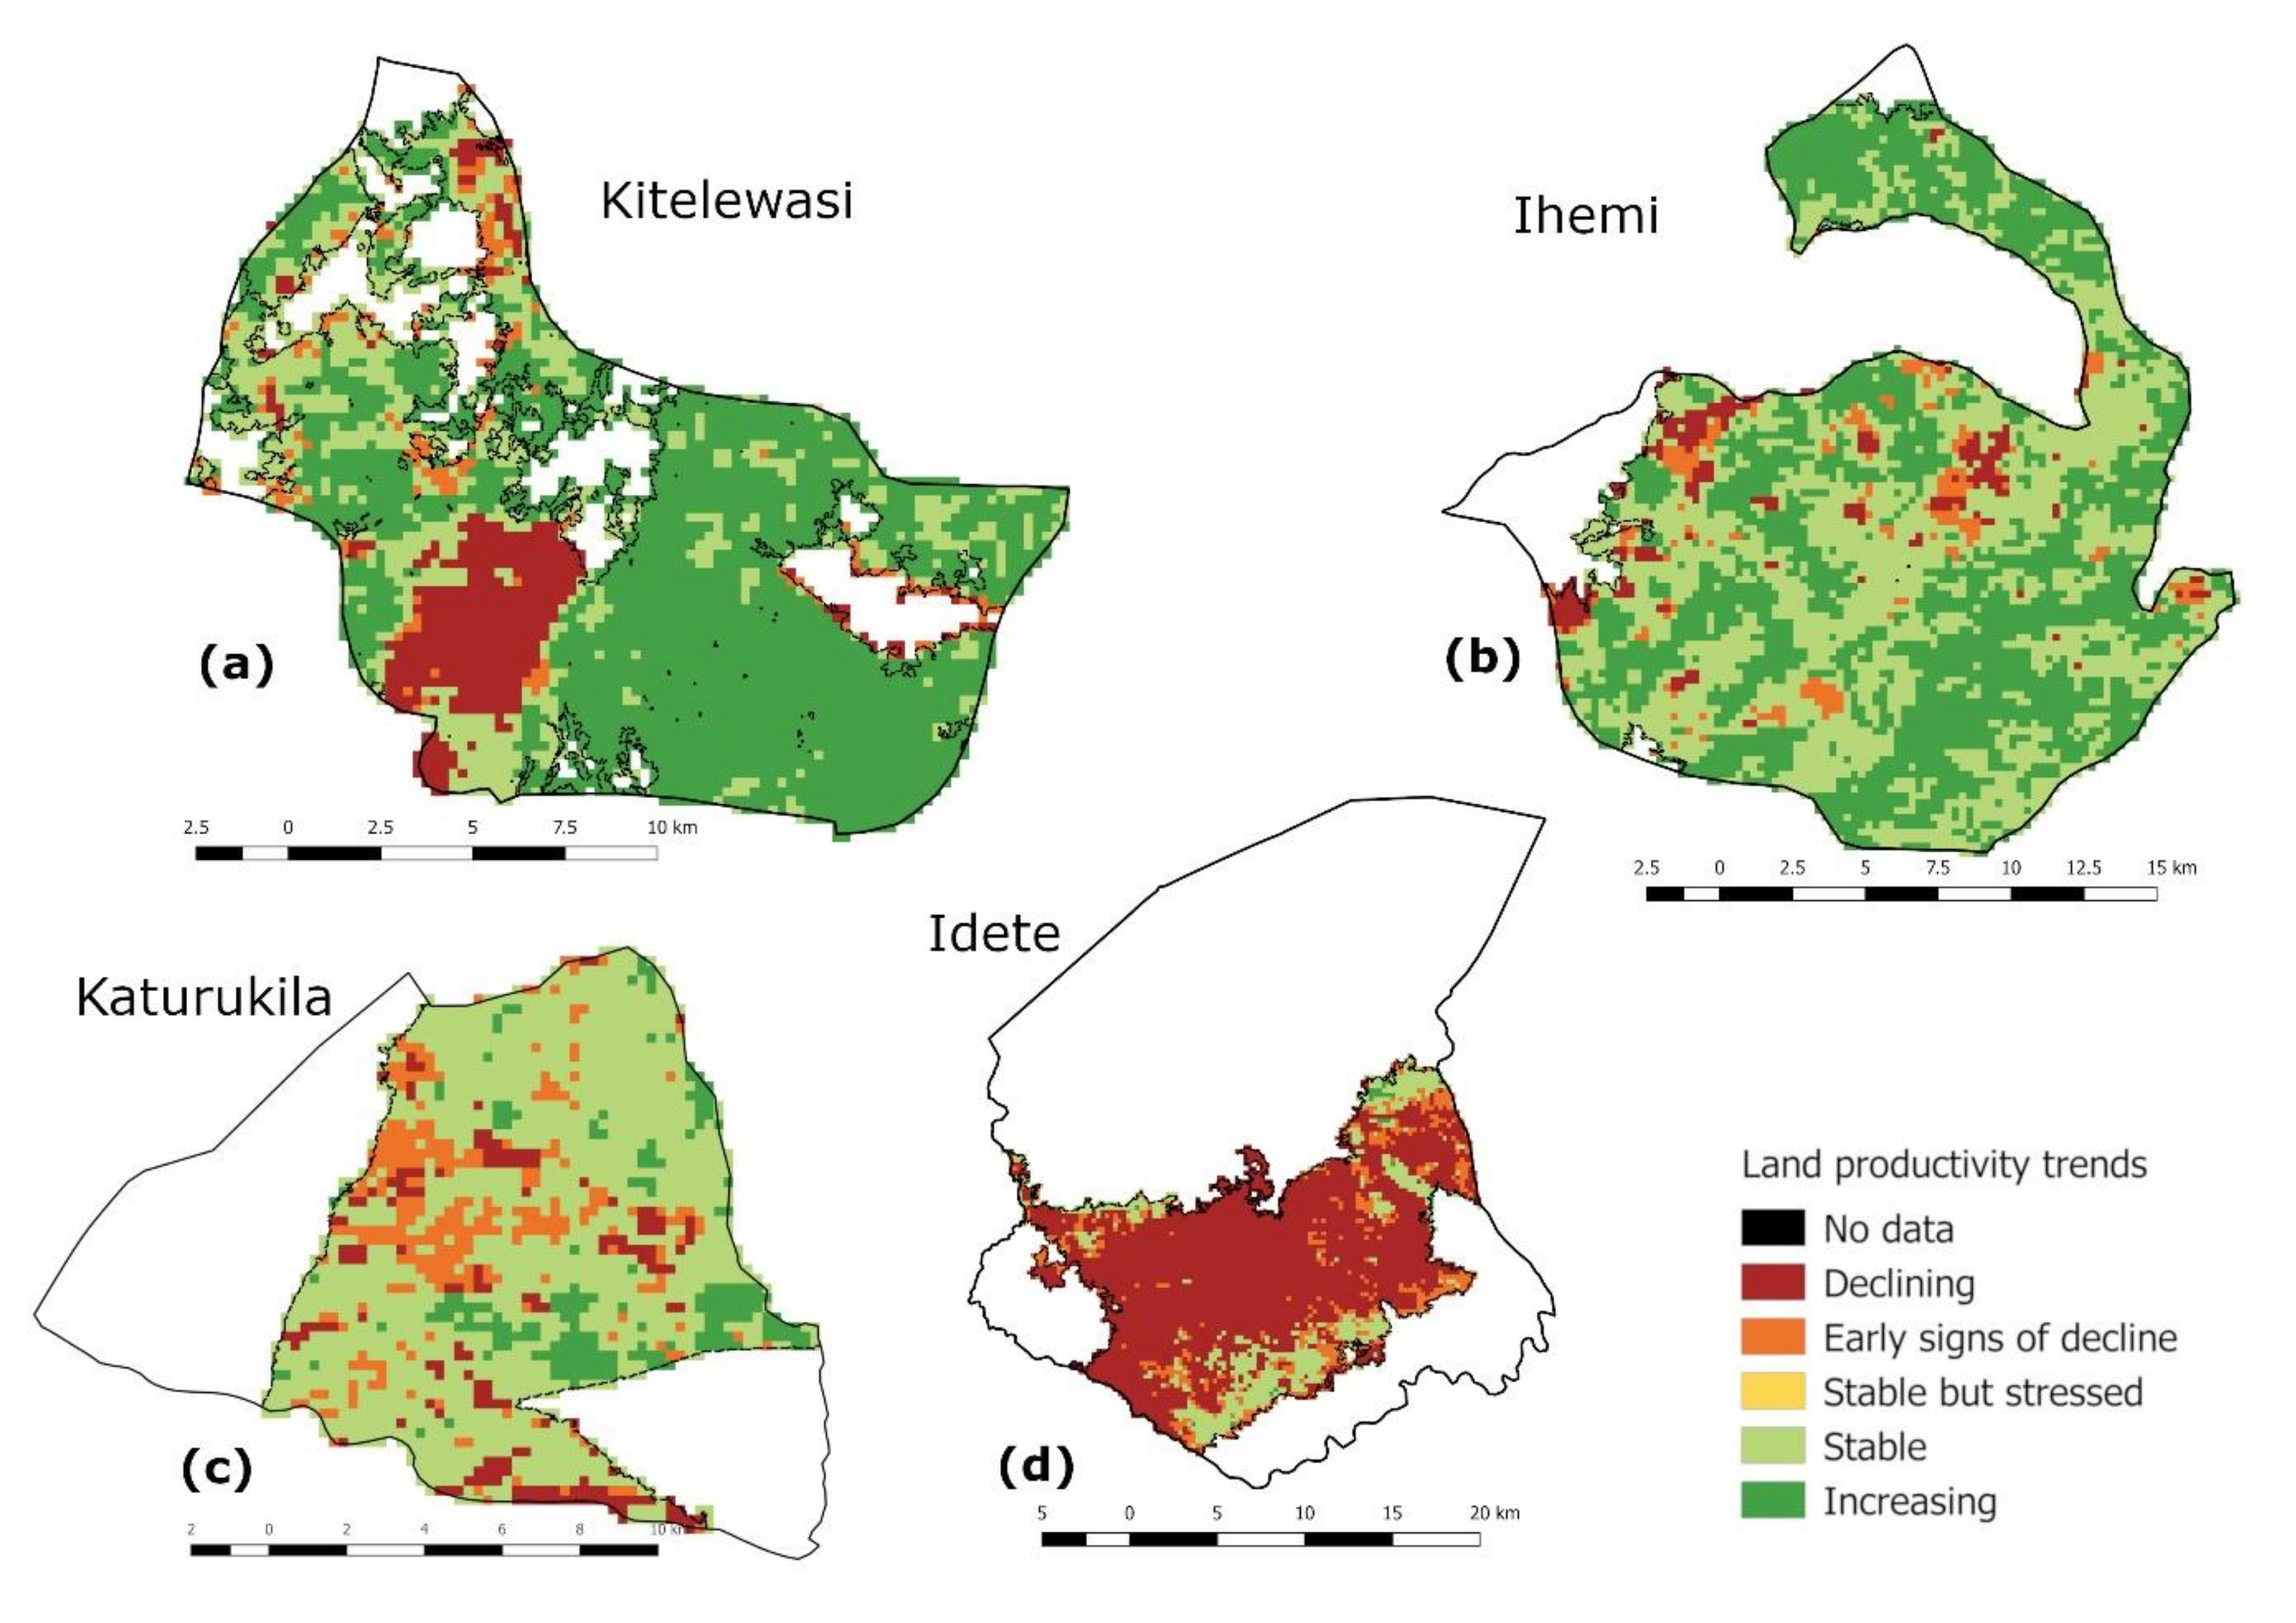
Trends in land use and land productivity can tell us whether the productivity of vegetation in the area is in a steady long-term trajectory of decline, showing early signs of decline, or is stable with signs of stress. The data for the four study sites are mixed—as seen in
Table 2, in general, the cropland areas selected in Iringa (Ihemi and Kitelewasi) have a much higher share of land with increasing productivity. Idete stands out as the most degraded of the four.
As seen in
Figure 5, areas of declining land productivity are widespread in the
Idete croplands. In general, the red areas correspond to smallholder farming areas, and the green areas to conserved forests and perennial monocultures. While the land area with declining productivity has increased remarkably in the case of Idete (see
Table 2), land uses have been largely unchanged for the village as a whole; indeed, there has been a slight increase in tree-covered areas, suggesting that cropland has not encroached on forestland (see
Table 3). Falling productivity in the case of Idete hence, seems to be related to a growing commercialization in paddy during the period 2013–2015 on a given area of cropland, limited by the constraints imposed by the rental market focused on the prison lands.
Land constraints appear to have led to falling productivity, as reflected also in the socioeconomic data for the latest period of data collection both for paddy and for maize (see
Figure 1 and
Figure 2).
In
Katurukila, most of the agricultural landscape remained stable in terms of productivity (68%), while 22% was degraded (
Table 2). While this is a large contrast to Idete, there may be cause for concern regarding future productivity decline. Like in Idete, land for smallholder use is constrained by external factors related to a neighboring national park. Nonetheless, the socioeconomic data suggest that both maize and paddy yields have risen during the project period, and this may have potential consequences for future land productivity trends. As suggested by
Figure 4, areas of decline are spatially concentrated, but there are also relatively large tracts of cropland showing early signs of decline. The socioeconomic survey misses an important part of the explanation for rising productivity, however, as it focuses only on staple crops, whereas sugarcane plays a central role in local land use patterns. A shift in land use away from maize and paddy towards sugarcane would be likely to increase the NDVI signal of the land at least in the short term. Croplands remain largely unchanged in terms of size, and tree covered areas show a slight increase over the study period (see
Table 4).
In
Kitelewasi, 57% of the total agricultural area showed improved productivity over the study period. The results from remote sensing analysis reflect the results derived from field surveys, where maize yields in Ihemi and Kitelewasi have shown improvements from 2000 to 2017, compared with those of Idete and Katurukila that instead suggest falling yields (
Figure 1). The role played by maize in this analysis is important as it is the main food source of the region and its most widely cultivated crop.
As shown by
Figure 5, areas of decline are strongly concentrated in Kitelewasi, whereas the remaining areas of cropland show increasing or stable productivity trends. Limited parts of the cropland point to early signs of decline—a large contrast to both Idete and Katurukila. Part of the explanation for these differences lies in changing patterns of land coverage: the area under tree-cover has increased by 32% in Kitelewasi (
Table 5), the explanation being a shift away from cropping towards timber production in local livelihoods.
The data for
Ihemi, finally, suggest a similar trend—indeed, the village has the lowest share of degraded land (8%).
Figure 4 also shows a scattered pattern of small pockets of land with declining productivity and land with early signs of decline, interspersed with much larger tracts of stable and increasing land productivity.
The explanation (like in Kitelewasi) lies in changing land use patterns—with an expansion of tree-covered areas and grasslands at the expense of croplands (
Table 6). Again, these changes are not captured by the socioeconomic survey, given its focus on grain crops. Although maize yields have increased, reflecting a process of intensification, the survey can therefore only provide part of the explanation for this intensification.
The combination of methods allows us to analyze patterns of intensification from a sustainability, but also, land use perspective. In the case of Idete, the rising yields in paddy found in the socioeconomic data, especially for the first three rounds of data collection, appear to have occurred at the expense of falling land productivity, as shown by the remote sensing data. In this sense, Idete illustrates a process of agricultural intensification focused on smallholders, driven by commercial incentives, but does not reflect the broader environmental aspects of such intensification. In the case of Katurukila, the findings are more mixed—here, yields in paddy as covered by the socioeconomic data have increased, but the share of degraded land is lower and there are also substantial areas of improved land productivity. The latter is related to a mixed-cropping system, where farmers appear to have shifted away from paddy to sugarcane with consequences for productivity. Finally, the two villages in Iringa (Kitelewasi and Ihemi) point to a process of rising yields in maize, as shown in the socioeconomic data, but also increasing land productivity related to broader change in land use among smallholders. Methodologically, the combination of both socioeconomic data as well as remotely sense data has enabled us to quantify land use changes driven by commercial prospects in the timber sector, which are difficult to measure through conventional socioeconomic surveys. Smallholders have adapted their livelihoods to these changes with consequences for sustainable intensification outside the grain sector, pointing to the forestry/agriculture nexus as a potential source of sustainable agricultural intensification.
5.3. Land Use Practices Related to Sustainable Agricultural Intensification
Particular farming practices are more conducive than others to a process that can be both socially as well as environmentally sustainable and farming and land use practices have a strong influence on land productivity. In the 28 locations sampled for field observations to ground-truth the remote sensing data, “farming practices” tend to be the main contributing factor to land improvement.
Conserved forests generally show strong positive productivity trends. This is the case of conserved forests in Katurukila and Kitelewasi. There are, however, cases where such conserved forests have been encroached into and converted into other productive uses, giving rise to declining productivity and degradation witnessed in the analysis of vegetation trends and land degradation. This is the case of recent deforestation in Idete for livestock keeping, food crop cultivation, and habitation. It was reported on the ground that deforestation began around 2006-08—an account that is confirmed by an analysis of breakpoints in the time series analysis of satellite data, even if these trends are difficult to discern from
Figure 4.
The potential trade-offs between conservation and raising land productivity and improving livelihoods need to be recognized, however. Rising population pressure among smallholders, in contrast to the expansion of large-scale commercial farming, is one source of encroachment that can be difficult to address without significant repercussions for local livelihoods. In the case of Katurukila, an adjacent national park prevents expansion of agricultural land, again to the possible detriment of local livelihoods. Nonetheless, for existing cropland specifically, rice yields have been rising in both of these villages, suggesting another trade-off between short term yield rises, driven primarily by commercial opportunities and land productivity. In the case of the Morogoro villages (Idete and Katurukila), improvements in agricultural livelihoods are reflected in socioeconomic outcomes such as rising living standards that are welcome enhancements of welfare among poor households. Here, seemingly, the progressive social outcomes of intensification can be contrasted with the negative environmental outcomes recorded for land productivity.
The growing importance of smallholder-based forestry for commercial purposes was captured both in the qualitative field visits and reflected in land classification changes. Driven by an increasing demand for timber related to increasing urbanization around Mafinga town, this has potentially positive consequences both for smallholder livelihoods as well as productivity. Nonetheless, changes in land use in response to commercial incentives are limited by the agroecological conditions of particular areas and as such, smallholder-based forestry may not be relevant in other parts of Tanzania.
Valleys that are watered naturally year-round tend to support intensive mixed crop farming, and as such, are associated with positive vegetation productivity trends as opposed to adjacent farmlands not found in such watered valleys. These valleys are also associated with land improvement (positive trends in vegetation productivity). Mixed intensive food crop farming (such as in year-round watered valleys) and intensive monocrops (such as in sugarcane plantations and teak forests) both tend to show stable or positive trends in land productivity over time. Farmers also report higher yields, relative to farms that are not situated in such opportune locations. With access to irrigation, local farmers can produce year-round, and achieve higher productivities for major crops. Nonetheless, it needs to be acknowledged that access to well-watered valleys is a likely source of social differentiation—studies attest to the unequal access, especially to permanent water resources based on, for example, gender and age [
48]. Improvements in irrigation and small-scale, community-managed schemes provide more scope for sustainable intensification. In general, data on the rice producing areas of Tanzania are considered to underestimate the existence of irrigation considerably [
49]. In the case of Katurukila, small-scale irrigation schemes have contributed to increased yields in rice, but this option may not be available to the majority of farmers.
Local land management skills can support practices aligned with agricultural intensification. In terms of skills enhancement, it is necessary to recognize that local and indigenous skills already exist—efforts towards skills in agricultural intensification should be additive where necessary. There is potential to leverage on the intensive practices characteristic of river and stream valleys to implement schemes in adjacent farms that can benefit from the know-how of valley practitioners. This can be done through technical support to improve the year-round cultivation potential of adjacent farms and skills-sharing schemes through farmer-to-farmer skills-sharing programs and networks.
While the environmental drawbacks of cereal monocropping are clear from the land productivity trends, the realities of smallholder livelihoods based on agricultural production also need to be acknowledged.
5.4. Theoretical and Methodological Implications
Theoretically, the concept of sustainable agricultural intensification has been criticized for being vague both conceptually as well as methodologically. The focus on normative outcomes (socially and environmentally sustainable agricultural intensification should be possible to achieve) rather than a theoretical concern with how these outcomes are achieved has been the focus of this criticism. A related point concerns the possible trade-offs between social and environmental concerns. The combination and triangulation of data sources that approach the concept of intensification both from the socioeconomic angle (surveys and qualitative methods) as well as the environmental (remotely sensed land productivity data) can fruitfully resolve some of the conceptual vagueness. In our case, access to longitudinal data also redresses some of the methodological vagaries of time and scale related to the concept of sustainable agricultural intensification as we can show and triangulate long-term trends in both these respects.
Methodologically, the approach we have used can be taken further by combining quantitative data on social outcomes (for instance, housing, income changes, education) with both socioeconomic and productivity data on environmental change. Qualitative data are, however, necessary to probe the questions of how socially progressive outcomes can be combined with long-term outcomes that are environmentally sound. The data from the qualitative field work suggest that land management and smallholder land use practices hold very real potential for sustainable agricultural intensification.
6. Discussion
We use an interdisciplinary approach to analyze intensification in the context of four Tanzanian villages. The combination of several methods is capable of resolving some of the theoretical and methodological vagueness found in sustainable agricultural intensification approaches. Both conventional socioeconomic surveys as well as remote sensing data are needed to capture social and environmental outcomes—as presumed by the concept of sustainable agricultural intensification. Importantly, remote sensing data also broaden the scope of intensification studies beyond the narrow focus on cereal crops found in both policies as well as socioeconomic studies. The results in this sense also indicate the poor environmental outcomes of cereal monocropping, even when social outcomes may be forthcoming.
Neither of these methods can tell us about the mechanisms behind certain changes, however—here, qualitative data are needed to shed light on why and how land use changes occur at the level of the smallholder. Local land management practices hold potential for both environmentally and socially sustainable outcomes if policies are attuned both to food security needs, but also environmental concerns and commercial opportunities that have consequences for rural livelihoods.
From a policy perspective, a focus on diversifying cultivation away from a one-sided focus on rice and maize in the quest towards intensification is important for enhancing both livelihoods as well as improving land productivity. The Asian model of agricultural intensification in this sense needs to be attuned to African realities, focusing on multifunctional landscapes and gardens based on inter-cropping and agroforestry as methods of land improvement.


 ,
, 
