Article

Women in Engineering: Almost No Gap at University but a Long Way to Go for Sustaining Careers

1
Graduate School of Education, Sejong University, 209 Neungdong-ro, Gwangjin-gu, Seoul 05006, Korea
2
Department of Architecture, Korea University, 145 Anam-ro, Seongbuk-gu, Seoul 02841, Korea
*
Authors to whom correspondence should be addressed.
Sustainability 2020, 12(20), 8299; https://doi.org/10.3390/su12208299
Submission received: 31 August 2020 / Revised: 6 October 2020 / Accepted: 7 October 2020 / Published: 9 October 2020
(This article belongs to the Section Sustainable Education and Approaches)

Abstract

:
Engineering is one of the career fields where women’s underrepresentation has been tenacious. In Korea, the government has made continuous efforts in the last decades to make a difference, yet the rate of women who pursue an engineering career pathway is still low. In this study, we analyzed 415 survey responses at a large private university in Korea to fulfill the aims of the current study: (1) to examine the gender difference on the 11 major- and career-related variables using t-test, (2) to test the adjusted social cognitive career theory (SCCT) model for the engineering undergraduate students’ intention to pursue an engineering career using path analysis. The independent t-test results revealed that the gender differences were found not in any major-related variable, but in three career-related variables, indicating the female students perceived their future career less vested than the male students. The path analysis results indicated that the adjusted SCCT model fitted to the data well and the relations among the variables were generally in the expected way with some exceptions. The highlighted implication is that removing systematic barriers and gender stereotype threats is as important as providing supports for gender equity in pursuing an engineering career.

1. Introduction

In Korea, engineering is acknowledged as a field that has led to the current economic status of Korea. Although we have made substantial changes during recent decades, the problems of the women’s underrepresentation in engineering fields is ongoing. According to the most recent nation-wide statistics [1], the percentage of the female students entering 4-year engineering undergraduate programs increased from 18.4% in 2009 to 25.3% in 2018. Women are increasingly more represented, but remain at less than one-third of the total students. Worse still, in the workforce in 2018, only 60.8% of the female engineering graduates stepped into the career fields, and that is substantially lower than the percentage of that of male (92.6%) who entered the engineering workforce. The promotion opportunities for women was even lower based on the data presenting that women’s share of management position in STEM workforce was only 10% in 2018. In this respect, for the past ten years in Korea, various programs were specifically designed and offered to female students of engineering and science through WISET (Woman in Science Engineering & Technology) and R-WISET (Regional office- Women in Science Engineering and Technology), which are similar to that of WISE program in the US and WISE campaign in the UK. Through these programs, female students at different levels of education, from middle school and high school, were introduced to engineering and science based programs to motivate, encourage, and maintain the level of interest for more recruitment of women to engineering. At the university level, diverse programs to improve the empowerment of female students and increase the gender awareness culture for more persistence of women in engineering [2].
The two aims of the current study were motivated by the following gaps in the literature. To date, there are very few studies that comprehensively compare the perception of the college students’ career choice motivation, current status related to their major, and their prospectss for future career simultaneously. By bringing those interesting features together, we can draw a more integrated picture of the perceptional differences between male and female students. In addition, this study also employed the integrative social cognitive career theory [3] that reflects social-cognitive, environmental, and behavioral factors together to explain the reason behind the low number of female students choosing engineering career paths. Besides, we included the distal outcome expectation on the future engineering career and perceived distal contextual barriers (negative prospectss on career as minority and perception of male dominance) to investigate the effects of the distal factors on the intention to pursue an engineering career path whereas the social cognitive career theory (SCCT) literature on engineering career development focused on the proximal variables related outcome expectation and contextual barrier or supports.
The process of the current study is, therefore, in three stages: one preliminary phase and two major phases. As the preliminary phase, we identified 11 major- or career-related factors of interest and tested the factor structure of each factor under a confirmatory factor analysis framework to investigate the factors more effectively than to use the original large number of variables. In the first major phase, we compared each composite mean score of the 11 major- or career-related factors between the male and female engineering students using an independent t-test. In the second major phase, we tested the adjusted integrative social construct career theory model for the intention to pursue an engineering career using path analysis under the structural equation modeling framework. The main research questions for the current study are as shown below.
Q1.
How do the female and male students of engineering differ in their motivation for major choice, major-related perceptions, and career-related perceptions?
Q2.
What effect do the social-cognitive, environmental, behavioral, and distal contextual factors have on the low number of female students choosing engineering career based on the adjusted integrated SCCT model of the intention to pursue an engineering career?

2. Literature Review

2.1. Women in Engineering as a Minority Group

A minority group is typically defined in two ways: by numbers, and by norms and power [4]. In that sense, the women in engineering major and career fields have been tenaciously a minority group in many parts of the world except for some countries (e.g., countries in Eastern Europe and Central Asia) [5,6]. In respect to the numbers, women represented 29.3% of the science, technology, engineering, and mathematics (STEM) workforce in 2016, globally [7]. When we focus on engineering, women constitute an even smaller portion of the workforce and degree earners across nations. For example, in the United States, women working in architecture and engineering were 15.7%, while those working in civil engineering were 13.9% in 2019 [6]. In the countries of European Union, women consisted of 26.7% of the bachelor’s degree holders in engineering on average in 2018, with variations across countries (from 13.7% in Switzerland to 35.9% in Sweden) [6]. In the United States, the women who held a bachelor’s degree in engineering and engineering technologies were 21.0% of the total degree holders. Interwound with the small numbers, norms and power have hardly been associated with women in the engineering major and careers. That is, the women in engineering have encountered a multitude of challenges, such as gender-based stereotype threats [8,9,10,11,12,13,14], lack of either role models or mentors [8,11,15,16], male-dominated organizational culture [8,17,18,19], and the glass ceiling which prevents promotion opportunities [20,21,22,23,24,25,26,27,28,29,30]. Although we have narrowed down the gender gap in engineering fields in the last decades [28,31,32,33], those challenges, namely, structural barriers for the women in engineering, have played a significant role in preventing more women stepping into the fields while discouraging their persistence in the fields [8,14,31,33,34,35,36].

2.2. Importance of Having More Women in Engineering in terms of Diversity and Sustainability

The imbalanced gender representation in engineering has been continuously under the attention of the government, industry, and academia, and gender parity has been regarded as the goal to be achieved for several reasons from the perspective of sustainability of the engineering field [1,6,31,37,38]. First, diversifying the perspectives in engineering workforce would promote “creativity, productivity, and innovation” (p. 2) [37]. For instance, the National Center for Women and IT reported that mixed-gender teams invented patents more often than single-gender teams. In addition, gender diversity facilitated a team’s collective intelligence [29,39] whereas the lack of diversity limited the sharing of different ideas [40]. Moreover, the organizations or corporates with more women presented higher performance [41,42,43], thus increasing the productivity and resulting in a better profit. Second, the job market in the engineering fields is growing rapidly and is expected not to be able to recruit enough number of qualified individuals as it stands now [44,45,46]. As one of the leading career fields that drives economic sustainability and a nation’s competitiveness, meeting the workforce demands in engineering is crucial. One possible solution for that is attracting more women into the fields while letting them fulfill their potential [8]. Last, but not least, increasing the numbers is the means and ends toward gender equality, even though it would take a long time to tear down the deep-rooted systematical biases and barriers in the male-dominant engineering majors and career fields. By increasing the number of women who choose engineering majors, we can assure that more women enter the engineering career fields and are retained [47]. When a sufficient level of diversity is achieved and retained, there will be a better recognition and reputation of the workplace, thus resulting in a higher retention of employees. Having more women means that having more role models for the girls who are interested and talented in engineering [15,48,49,50,51], and, eventually, more women are supposed to persist toward leadership positions. That possibly allows the current power dynamics and male-dominant culture to be changed [48]. This can be considered as a sustainable cycle of a work place, thus highlighting the importance of diversity; a better representation of women engineers.

2.3. Social Cognitive Career Theory and Integrative SCCT Model

Adapted from Bandura’s [52] social cognitive theory and Hackett and Betz’s [53] application to women’s career development, social cognitive career theory (SCCT) [54] has served as one of the major theoretical grounds for career development by integrating the contextual, personal, and behavioral determinants for career development. Moreover, SCCT has continuously evolved [55] by producing three interwound models of interest development, choice-making, and performance and persistence in education and career [54], and later by extending models to satisfaction and well-being within education and career domains [56], and career process tasks and challenges during career development [3]. The most comprehensive model was called the integrative SCCT model, which was introduced by Lent and his colleagues [3] to examine the social cognitive factors for engineering major adjustment across different gender and race/ethnicity groups. In the integrative SCCT model, they combined the core elements of the SCCT’s segmental models of satisfaction on major or career domains, major/career interest, choice, and persistence or performance [54,57]. In their integrative model, self-efficacy expectations were directly predicted by environmental supports/resources, personality traits/affective dispositions while outcome expectations were predicted by environmental supports/resources and self-efficacy expectations. In turn, interest was directly affected by self-efficacy expectations and outcome expectations, and satisfaction was directly predicted by environmental supports/resources, personality traits/affective dispositions, self-efficacy expectations, outcome expectations, and interest. Finally, persistence was predicted by environmental supports/resources, self-efficacy expectations, outcome expectations, interest, and satisfaction (for more information on the model, please, refer to the study [3]).

2.4. SCCT Empirical Studies on the Career Development in the Context of Higher Education

The core bivariate relationships among the variables of the social cognitive theories have been empirically tested for the career development of engineering students with either cross sectional or longitudinal data from the diverse backgrounds in terms of gender, race/ethnicity, sub-field of engineering, etc. Some studies supported the originally hypothesized relationships, but some counter evidence also exists.
Some studies supported the significant and positive relationship between self-efficacy and outcome expectations. For example, Lent and his colleagues [3] found that the relationship between self-efficacy and outcome expectation was in the positive direction while investigating the SCCT model of academic adjustment of 1377 engineering students from four universities with different racial compositions. In addition, the longitudinal study to test the SCCT model of academic adjustment of 732 engineering students also supported the same relationship [58].
The aforementioned two studies [3,58] found the positive and statistically significant relationship between self-efficacy and interest. Byars-Winston and his colleagues [59] also found the same supporting evidence with 223 students from various underrepresented racial/ethnic groups (i.e., African American, Latino/a, Southeast Asian, and Native American undergraduate students) majoring in either biological science and engineering. Flores et al. [60] investigated the model of academic satisfaction based on the SCCT model with 527 engineering students in a predominantly Latino/a university, and the results indicated a significantly positive relationship between self-efficacy and interest. In the recent study [61] of the integrative SCCT model, the same relationship was supported with the data from 1335 White and Latino/a engineering students.
The positive relationship between self-efficacy and goals (e.g., intention to pursue engineering careers, in our study) was supported by the two studies [60,61] mentioned above. In the study of the engineering, students’ social cognitive of academic persistence and performance across gender and race/ethnicity [62] supported the relationship between self-efficacy and academic persistence goal using the longitudinal data of the 908 engineering students from two state universities. Lee and her colleagues’ [63] study of the longitudinal test of SCCT’s academic persistence model with 172 participants also supported the relationship between self-efficacy and engineering goals. However, multiple studies [3,58,60] found that self-efficacy and persistence goals were not correlated significantly. Navarro and his colleagues [61] found that the relationship was significant for White men, but nonsignificant for Latino, Latina, and White women.
Regarding the relationships with the outcome expectations, multiple studies [59,60,62,63] supported the positive relationship between outcome expectation and interest. The relationship between outcome expectation and persistence goal was positive and significant in the studies [3,59,60,62] previously mentioned. The relationship between outcome expectation and satisfaction was supported by the studies Flore et al. [60] and Lent et al. [3,62]. However, some studies found inconsistent results. For example, the study on the longitudinal SCCT model for persistence intention with 551 engineering students reported that outcome expectation and intended persistence was not significantly related to each other [64]. Lent and his colleagues found that the relationship between expected outcome and interests was not statistically significant in the longitudinal investigation of the SCCT’s choice model with 116 engineering students at historically Black universities [65].

3. Methods

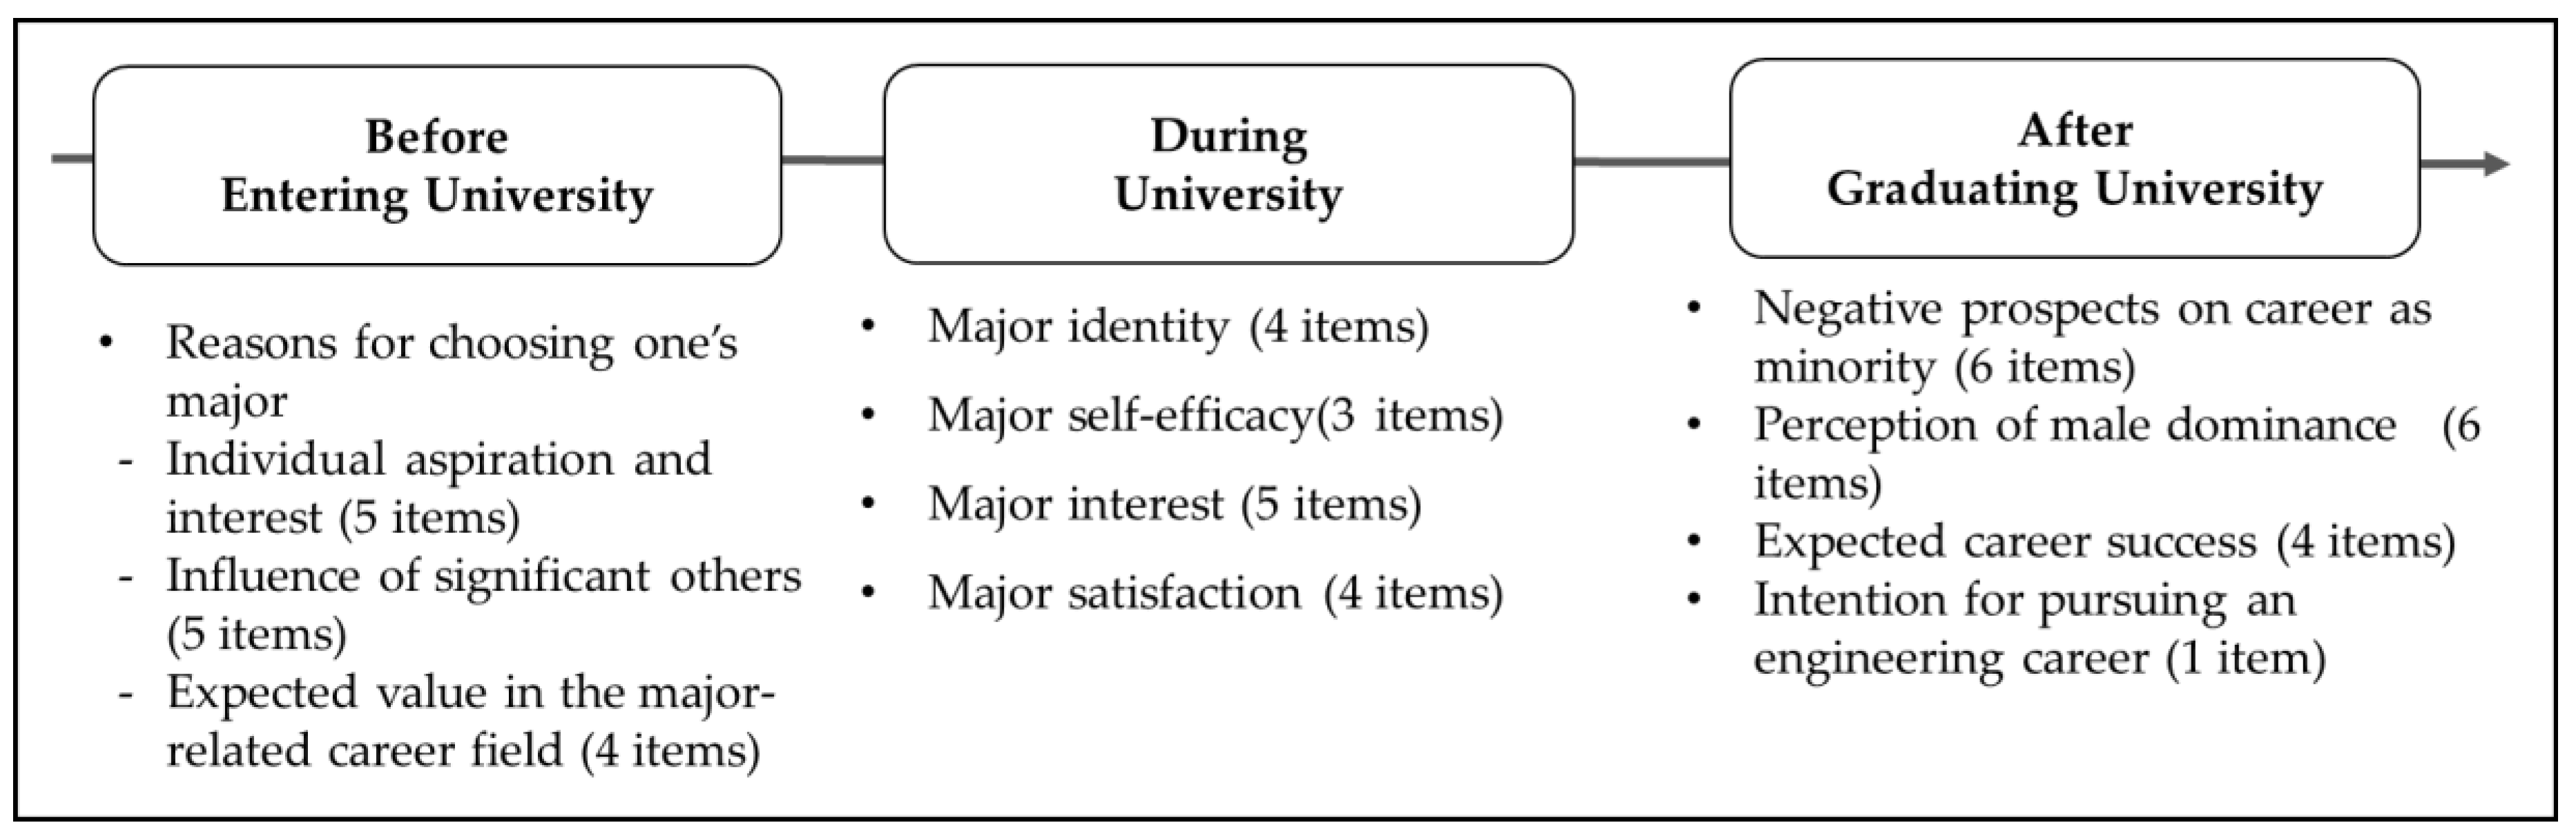
3.1. Survey Development and Variables of Interest

As a part of the R-WISET (Regional office- Women in Science Engineering and Technology program, the program director and the research professor in the innovation center for engineering education at a large private university in Seoul, Korea developed a survey instrument to investigate the engineering students’ perceptions on their major and major-related career fields. The survey included basic questions on sociodemographic information (e.g., gender, current major, grade level, etc.) and the questions on the reasons for having chosen one’s major with three separate categories (i.e., individual aspiration and interest, influence of significant others, expected value in the major-related career fields), major identity, major self-efficacy, major interest, major satisfaction, negative prospects on career as minority, perception of male dominance, expected career success, and intention to pursue an engineering career. Although the questions were given all at once, the questions can be categorized into three time-points: before, during, and after university studies. Figure 1 illustrates the major variables of interest organized into three time-points with the number of questions under each variable. For all items, the response options were Likert-type with 5-point (1: strongly disagree; 5: strongly agree).

3.1.1. Variables of “Before Entering University”

In order to trace the reasons for having chosen the current major of each participant, we selected three interesting (significant) categories: (1) individual aspiration and interest, (2) influence of significant others (e.g., family members, friends, teachers, etc.), and (3) expected value in the major-related career fields. The individual aspiration and interest category represents the reasons closely related to personal propensity and perceived fit, and it included five items (e.g., “I chose my current major to realize my dream job,”) while the influence of significant others category stands for somewhat passive reasons including five items (e.g., “I chose my current major due to my parents’ recommendation,”). The expected value in the major-related career fields category was considered as being the active reason driven by expected value in the future, and it consisted of five items (e.g., “The career fields of my major was highly recognized in our society.”).

3.1.2. Variables of “During University”

We identified four interesting variables: three of them were individual factors, and the other was a contextual factor. First, the individual factors were major identity, major self-efficacy, and major interest. The major identity factor included four items (e.g., “I think my major fits to my interest and aptitude,”), major self-efficacy consisted of three items (e.g., “I can get good grade in the classes of my major,”), and major identity had five items (e.g., “The classes in my major are intriguing.,”). Second, the contextual factor was the major satisfaction with four items (e.g., “I am satisfied with my major.”).

3.1.3. Variables of “After Graduating University”

We selected the four variables that reflect the participants’ perception on the major-related career fields after graduation. We developed four items (e.g., “I will be successful in the career fields of my major,”) representing expected career success. As distal contextual factors, we developed two constructs: negative prospects on career as minority and perception of male dominance. The negative prospects on career as minority included six items (e.g., “it is hard to find the role models who I can relate with in the career fields of my major,”) while the perception of male dominance included six items (e.g., “I think the culture of the career fields of my major would be male dominant,”) as well.

3.2. Data Collection Procedure and Participants

The data were collected in the engineering school at the same university between 1 November 2017 to 13 June 2018. Printed surveys were distributed to the students in five Architectural Design classes, in a chemical engineering class, and in the orientation for the new students of three engineering programs (Civil, Environmental, & Architectural Engineering, Mechanical Engineering, and Materials Science & Engineering) in addition to the students who participated in the R-WISET programs. To collect more data, we distributed the online survey link to the students majoring in engineering via email. The survey provided the explanation of the purpose of the survey and possible use of the survey data (without any private information) for future research and publications. Based on the information, each student could freely choose either to consent or not to consent to participate in this study.
We collected 509 completed surveys (389 printed surveys and 110 online surveys) checked with the participants’ consent. However, we excluded the 94 respondents’ data with either unanswered questions or insincere responses, and thus, a total of 415 participants’ responses were analyzed in the current study. The characteristics of the participants are presented in Table 1. The participants were dominantly male (71.15%) while the participants major consisted of Civil, Environmental, & Architectural Engineering (19.3%), Architecture (13.7%), Mechanical Engineering (5.8%), Industrial Engineering (3.4%), Materials Sciences & Engineering (30.1%), Electrical Engineering (7.0%), and Chemical Engineering (20.7%). The majority of the participants were freshmen (47.0%) while sophomores, juniors, and seniors were 11.6%, 23.9%, and 17.6%, respectively.

3.3. Data Analysis Methods

We conducted data analyses in three phases: (1) confirmatory factor analysis to examine the evidence of the structural validity for each of the 11 factors, (2) independent t-test to make cross-group mean comparisons between male and female students, and (3) path analysis to test the theoretical model for the intention to pursue an engineering career based on the social cognitive career theory. We conducted confirmatory factor analyses and independent t-test using Jamovi version 8.0 [66] while conducting the path analysis using MPlus 8.0 [67].

3.3.1. Confirmatory Factor Analysis

In the original survey, we included 47 questions, and each set of three to six questions were assumed to be dominated by one of the 11 major- or career-related factors in addition to the intention to pursue an engineering question. To simplify the analysis using higher-level factors, we tested each factor structure of the 11 factors (constructs) using confirmatory factor analysis (CFA). A total of 11 sets of one-factor CFA model were fitted to the data separately. To evaluate the model adequacy, we referred to the chi-square fit statistics and two more alternative model fit indices (i.e., the CFI: comparative fit index; the SRMR: standardized root mean residual). A significant chi-square indicates that the model does not fit to the data. However, the chi-square fit statistics tends to reject an acceptable model given a sizable sample, as in our study (Kline, 2010 [68,69]), and thus, we relied more on the other fit indices. According to Hu and Bentler [70], CFI values greater than 0.95 and 0.90 indicate excellent and acceptable fit, respectively. Regarding the SRMR, values close to or below 0.06 indicate a good fit [70]. Although the RMSEA (root mean square error of approximation) is also a frequently reported fit index, its inconsistent performance with other fit indices (i.e., CFI and SRMR) kept us from reporting it [71].

3.3.2. Independent t-test

We conducted a set of independent t-tests to compare the difference between the male and female students on the 10 major- and career-related factors (individual aspiration and interest, influence of significant others, expected value in the major-related career fields, major identity, major self-efficacy, major interest, major satisfaction, negative prospects on career as minority, perception of male dominance, expected career success). Once the tested one-factor model or modified one-factor model was established, we made a composite score by averaging the scores of the included items under each factor. In addition, we also compared the scores on intention to pursue an engineering career between the male and female students.

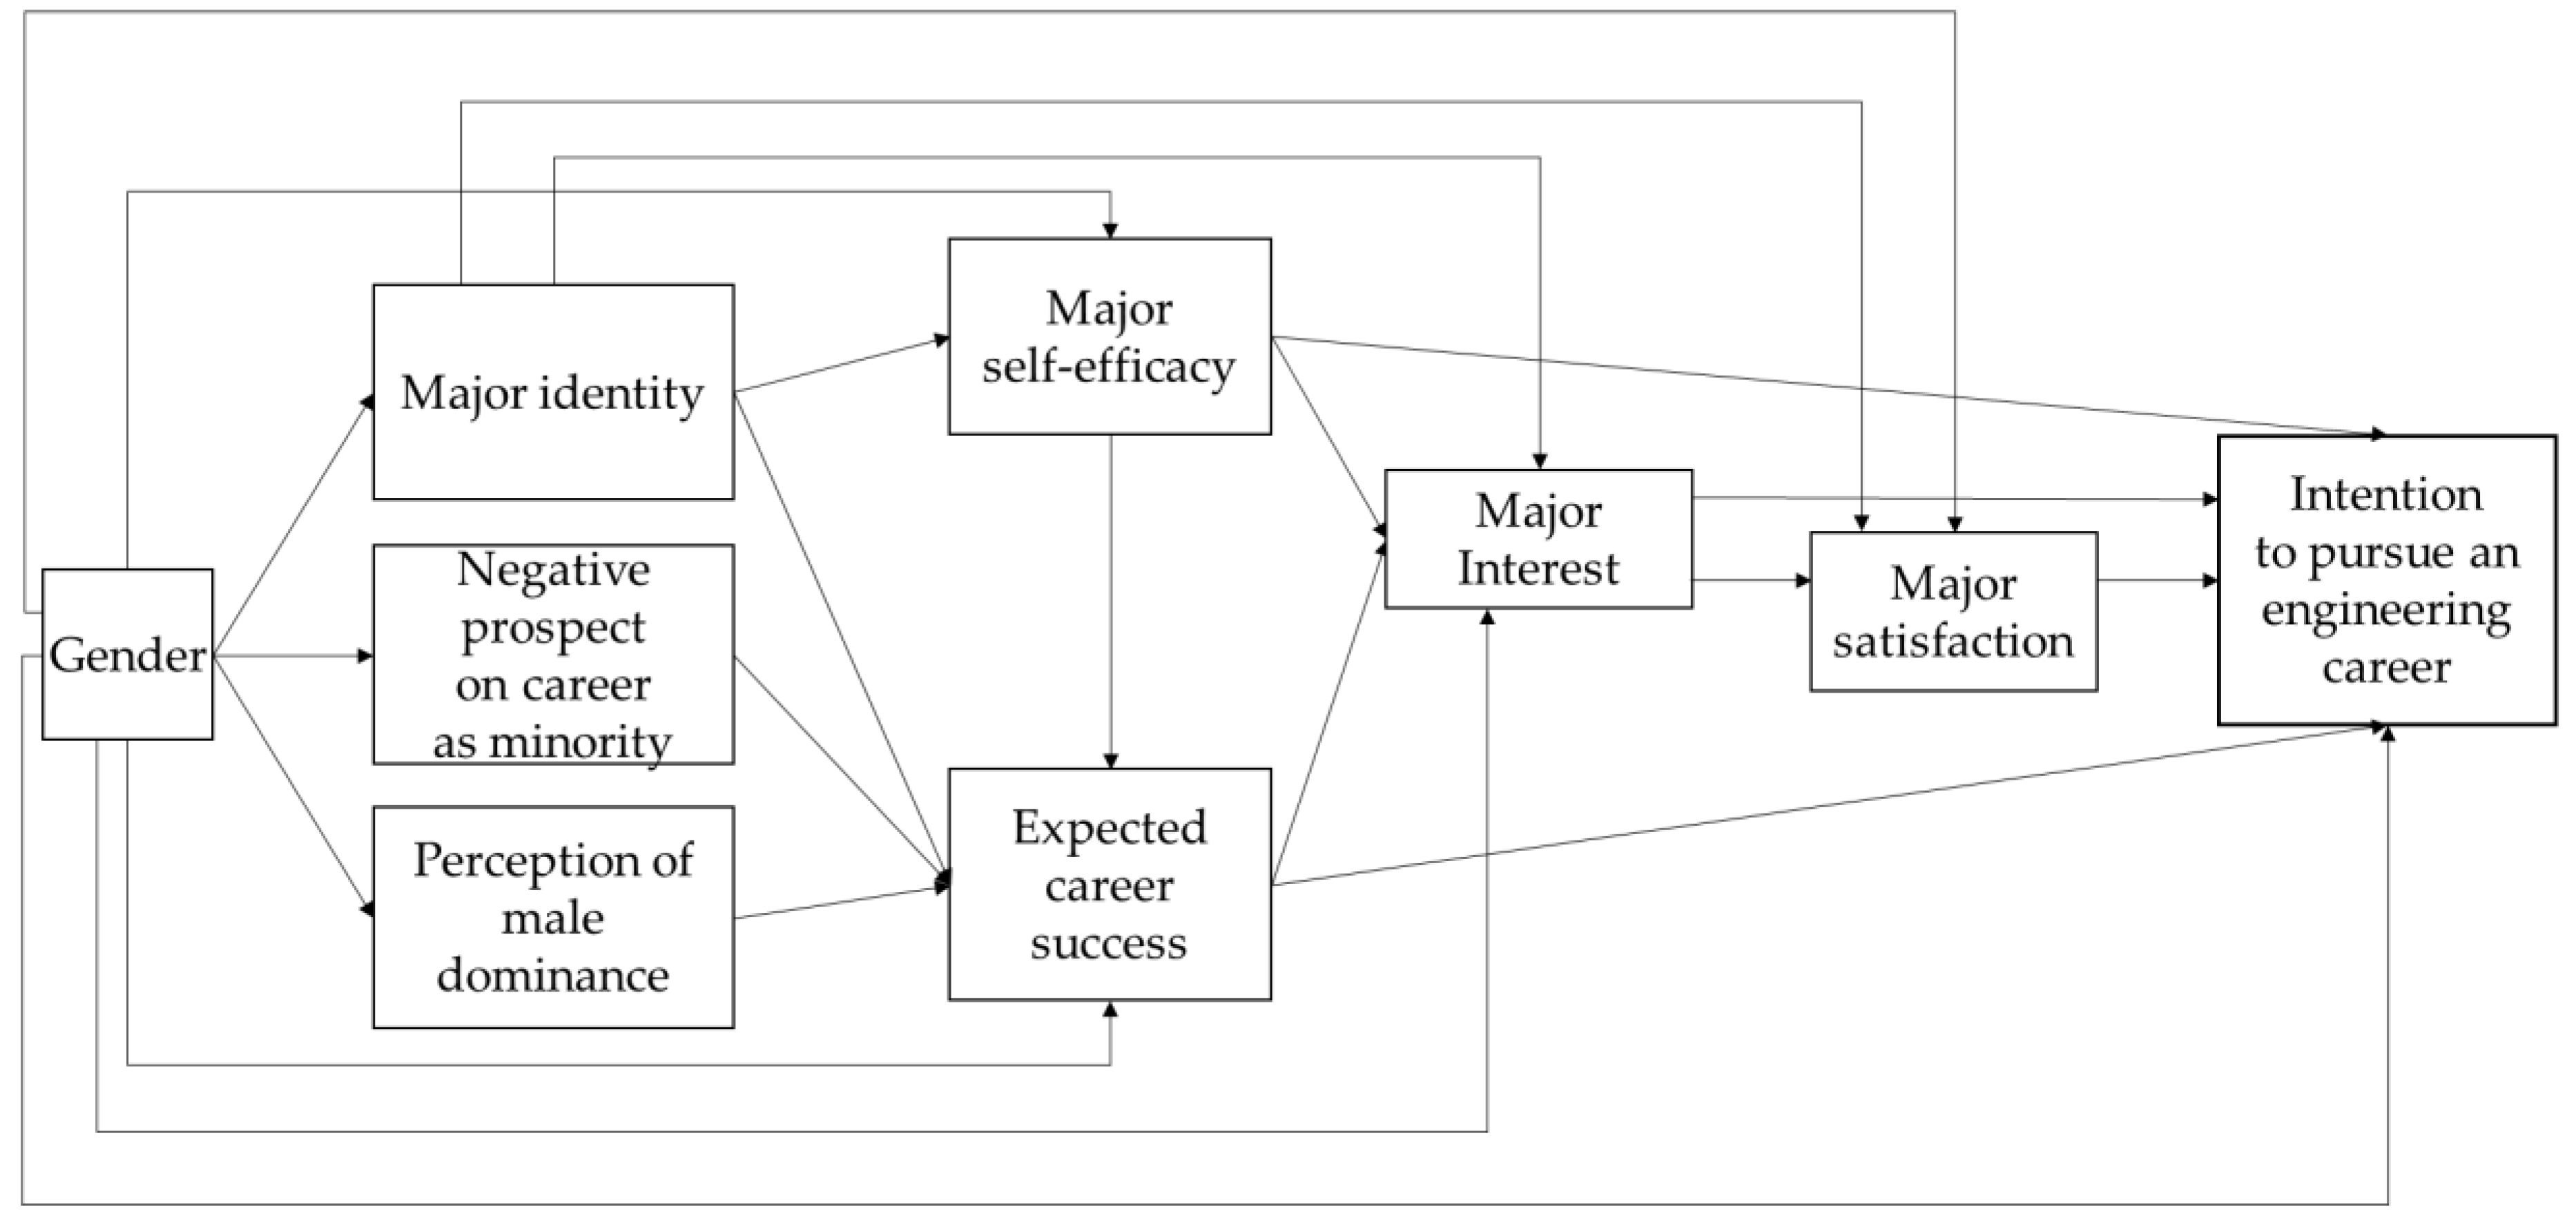
3.3.3. Path Analysis Model

The adjusted social cognitive career theory (SCCT) model for the intention to pursue an engineering career was tested using path analysis under the structural equation modeling framework. Unlike the ordinary regression analysis, a path analysis model can incorporate exogenous variables that are very close to the independent variables in an ordinary regression analysis model, and endogenous variables that can serve as both independent and dependent variables. Hence, the complex relations among variables in a theoretical model can be simultaneously tested using a path analysis model. Based upon the literature regarding the social cognitive career theory [55,61], we constructed the adjusted SCCT model with the core elements of the interest development model, choice model, and satisfaction model while adding the distal factors related to future career. The model included the personal factors (i.e., gender, major-related identity, major self-efficacy, major satisfaction), perceived environmental factors (i.e., negative prospects on career as minority and perception of male dominance), expected values (i.e., expected career success), interest (i.e., major interest), satisfaction (i.e., major satisfaction), and intention to pursue an engineering career, as shown in Figure 2.
In the model, the final outcome, intention to pursue an engineering career, was predicted by gender, major self-efficacy, expected career success, major interest, and major satisfaction. Next, major satisfaction was predicted by gender, major identity, and major interest, while major interest was predicted by gender, major identity, major self-efficacy, and expected career success. Then, major self-efficacy was predicted by gender and major identity, while expected career success was predicted by gender, major identity, negative prospects on career as minority, and perception of male dominance. In turn, major satisfaction, major identity, negative prospects on career as minority, and perception of male dominance were predicted by gender. To evaluate the adequacy of the tested model, we employed the same criteria used in the confirmatory factor analysis accordingly to Hu and Bentler’s [70] recommendation (CFI > 0.90; SRMR ≤ 0.06).
The correlations among the variables in the model are presented in Table 2.

4. Results

4.1. Confirmatory Factor Analysis

Table 3 provides the results of confirmatory factor analysis by factor including information on model fit indices and the range of factor loadings of the items under the tested factor. Additionally, Table 3 includes the values of Cronbach’s α for each factor. Each of the original one-factor models was supported with acceptable or excellent model fit by the CFI (0.94–0.98) and SRMR (0.02–0.04) values except for the individual aspiration and interest and major interest factor. For these factors, we allowed one error correlation between two items (the first and second items for both factors), which was indicated by the largest modification index in addition to the similar contents of the related items for each factor. All factor loadings were equal to or greater than 0.49, which indicated that a substantial relationship between a factor and the corresponding items was supported [72]. The Cronbach’ α values ranged from 0.76 to 0.90, which means adequate internal consistency reliability among the items under each factor. Therefore, we could legitimately use the composite mean score for each factor in the next analysis.

4.2. Paired t-Test Results

The independent t-test results are shown in Table 4. The results are presented aligned with the three-time points as follows.
First, we analyzed the three variables (individual aspiration and interest, influence of significant others, and expected value in the major-related career fields representing the reasons for choosing one’s major, to examine possible gender differences before entering university. According to the t-test results, the males and female students did not have different mean scores on any of the three variables, which implies that the male and female students were similarly motivated by the three factors when they chose their major before entering university.
Second, the tested variables of interest during university were the major identity, major self-efficacy, major interest, and major satisfaction. The t-test results indicated that none of the variables tested were significantly different between the male and female students. That means the male and female students perceived their level of major satisfaction, identity, self-efficacy, and interest similarly during university.
Third, the variables of interest after graduating university included negative prospects on career as minority, perception of male dominance, expected career success, and intention to pursue an engineering career. Interestingly, except for the intention to pursue an engineering career, the other three variables had significant mean difference between the male and female students. The females had higher mean score (Mean = 2.98, SD = 0.71) on the negative prospects on career as minority than the males (Mean = 2.62, SD = 0.70) while having higher perception of male dominance mean score (Mean = 2.68, SD = 0.83) than the male students (Mean = 2.35, SD = 0.92). On the contrary, the male students scored significantly higher (Mean = 3.63, SD = 0.76) on expected career success than the female students (Mean = 3.39, SD = 0.77). The effect sizes for negative prospects on career as minority, perception of male dominance, and expected career success, respectively, were 0.51, 0.37, and −0.31, which were between small (0.2) to medium effect (0.5) according to Cohen [73]. Interestingly, female (Mean = 3.90, SD = 1.91) students had the same level of intention to pursue an engineering career with the male (Mean = 3.97, SD = 73) students even though they had higher level of negative prospects on career as minority and perception of male dominance, while having lower level of expected career success.

4.3. Path Analysis

4.3.1. Model Evaluation

The chi-square of the adjusted social cognitive career theory model was statistically significant (χ2 = 85.155, df = 13, p < 0.001), which means the model and the data are significantly discrepant. Given the large sample size in the current study, the significant χ2 fit statistic might be too sensitive to reject an appropriate model, and thus, we relied more on the alternative fit indices; the CFI and SRMR. The CFI (0.94) and SRMR (0.06) indicated the model was good to reserve. Figure 3 illustrates the model with the statistically significant unstandardized/standardized path coefficient, while non-significant paths are expressed with dotted lines. The R2s for the five major outcome variables (major self-efficacy, expected career success major interest, major satisfaction, and intention to pursue an engineering career) were 0.36, 0.11, 0.40, 0.50, and 0.41, respectively. To interpret the R2s, 36% of the variability in expected career success was explained by gender, major identity, major self-efficacy, negative prospects on career as minority, and perception of male dominance, while 11% of the variability in major self-efficacy was explained by major identity. Then, 40% of the variability in major interest was attributed to major identity, major self-efficacy, and expected career success, and 50% of the variability in major satisfaction was explained by major identify and major satisfaction. In turn, 41% of the variability in intention to pursue an engineering career was explained by major identify, major self-efficacy, major interest, major satisfaction, and expected career success.

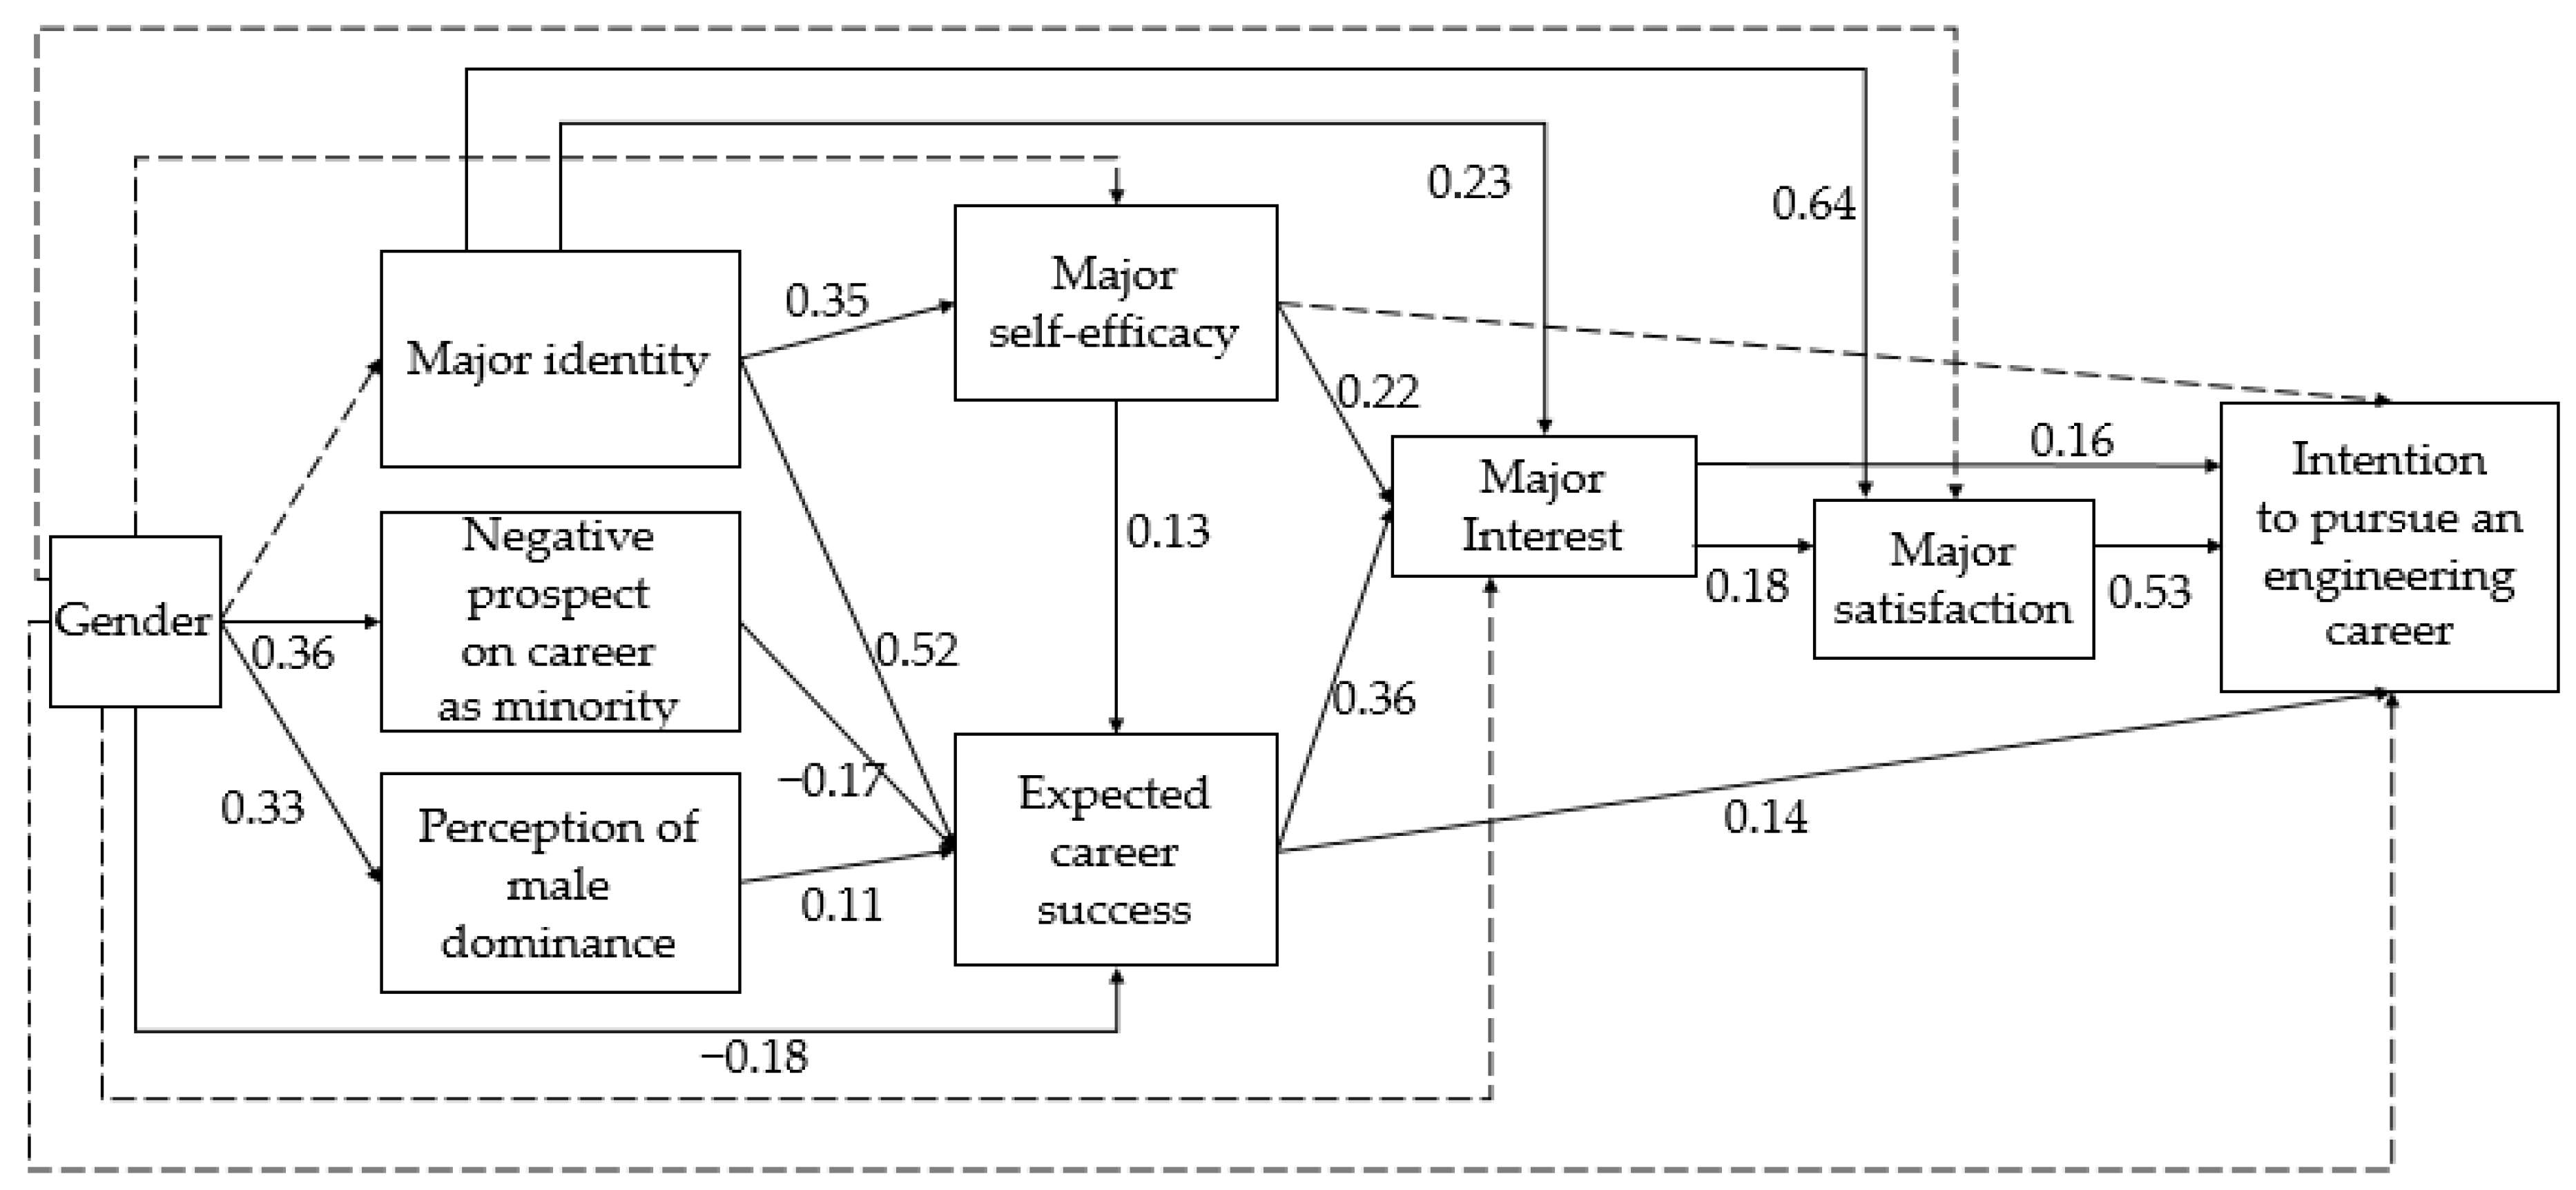
4.3.2. Model Parameter Estimates

The unstandardized and standardized path coefficients of the modified model are provided in Table 5. The variable gender was a categorical predictor with the male students as the reference group (male = 0; female = 1), and thus, the path coefficients with gender as an exogenous variable (i.e., independent variable) can be interpreted as the female students’ score on the endogenous variable (i.e., dependent variable) compared to that of the male students. The path coefficient (B = 0.36, SE = 0.08) from gender to negative prospects on career as minority implied that the female students scored 0.36 higher on that than the male students while the path coefficient (B = 0.33, SE = 0.10) from gender to perception of male dominance indicated that the female students scored 0.33 higher than their counterparts. On the contrary, the path coefficient (B = −0.20, SE = 0.07) from gender to expected career success meant that the female students rated lower on expected career success than the male students. For each path from gender to either of major self-efficacy, major interest, major satisfaction, or intention to pursue an engineering career was not statistically significant. That is, the female and male students had equivalent scores on major self-efficacy, major interest, major satisfaction, and intention to pursue an engineering career.
The remaining path coefficients indicated the relationship between quantitative exogenous and endogenous variables, and the interpretations were based on the standardized path coefficients. Each path coefficient should be interpreted as a conditional effect, in which the other predictors for the given outcome variables are controlled, and we omitted the explanation on the conditional effect for each path for parsimonious explanations. We reported the results based on each outcome variable from the left to the right in the model. First, the path coefficient (β = 0.35, SE = 0.05) from major identity to major self-efficacy implied that one standard deviation increase in major identity resulted in 0.35 increase in major self-efficacy. Second, the paths with expected career success as an outcome, all path coefficients were positive in their direction except for negative prospects on career as minority. To interpret the path coefficients, one standard deviation increases in major identity, major self-efficacy, and perception of male dominance, yielded 0.51 (SE = 0.04), and 0.14 (SE = 0.04), and 0.13 (SE = 0.05) standard deviation increase in expected career success, respectively, whereas one standard deviation increase in negative prospects on career as minority led to 0.16 (SE = 0.05) standard deviation decrease in expected career success. Among the four factors, major identity was the most influential factor for expected career success. Third, major interest was significantly predicted by major identity (β = 0.22, SE = 0.05), major self-efficacy (β = 0.26, SE = 0.04), and expected career success (β = 0.35, SE = 0.05), which indicated that one standard deviation increase in major identity, major self-efficacy, and expected career success led to 0.22, 0.26, and 0.35 standard deviation increase in major interest, respectively. Fourth, major satisfaction was significantly predicted by major identity (β = 0.61, SE = 0.04) and major interest (β = 0.17, SE = 0.04), which implies that one standard deviation in major identity and major interest yielded 0.61 and 0.17 increase in major satisfaction, respectively. Finally, in respect of the ultimate outcome (intention to pursue an engineering career) in the model, expected career success (β = 0.14, SE = 0.05), major interest (β = 0.12, SE = 0.05) and major satisfaction (β = 0.50, SE = 0.04) and were positively related to the outcome. To interpret the path coefficients, one standard deviation increase in expected career success, major interest, and major satisfaction resulted in 0.14, 0.12, and 0.50 standard deviation increases in intention to pursue engineering career, respectively. The most influencing factor for intention to pursue an engineering career was major satisfaction.
To sum up, the adjusted social cognitive career theory model fitted to the data well, but five of the path coefficients were not statistically significant. All path coefficients were in the expected direction except for the path coefficient from perception of male dominance to expected career success, which was in positive direction. We will discuss the possible reason for that in the next section.

5. Discussion

5.1. Findings and Implications

Based on the survey responses of the 415 engineering students in Korea, we investigated the gender difference on the major- and career-related variables using independent t-test after the confirmatory factor analysis as a preliminary step for reducing the original 47 variables to the 11 factors. Additionally, we examined the adequacy of the adjusted social cognitive career theory model including the core elements of the interest development, choice goal, and satisfaction models as well as the distal factors related to future career using path analysis. Our discussion on the findings and implications focused on the independent t-test results and path analysis results.

5.1.1. No Gender Gap on the Major-related Perception but Prominent Gap in Perceptions on the Future Career

The 11 major- and career-related variables were categorized into three important time points: before, during, and after university.
First, the three variables of the reasons for choosing one’s major were set out to examine the gender difference in the major choice motivation before entering university. The independent t-test results indicated that there was no gender gap across any of the three variables (individual aspiration and interest, influence of significant others and expected value in the major-related career fields). In other words, the female participants in the study chose their major motivated by each factor to the same extent with the male participants. Among the three variables, the female and male participants had the highest score on individual aspiration and interest while having the lowest score on influence of significant others. The finding implies that the direction of the recruitment programs (i.e., the WISET program in Korea for recruiting more girls into the engineering majors) should continue to promote the K-12 female students’ engineering interest and supporting them to find their engineering identity.
Second, the male and female participants had a similar level of major identity, major self-efficacy, and major interest as well as major satisfaction. Nevertheless, our expectation was that the female students would have a lower level on those variables given that the percentage of the female students has been persistently low in the engineering programs at the studied institution. One possible explanation for that is that the institution is one of the most prestigious engineering programs in Korea, and the female students in the programs were already highly motivated, talented, and competent. In addition, the engineering school had made continuous efforts to empower the female students through the R-WISET programs, such as the major-related competency development programs, leadership development programs, internship programs at real work places, mentoring programs, etc.
Third, the current study showed that the intent to graduate with an engineering degree does not translate directly to pursuing a career in engineering, particularly among female students [74]. This was clearly illustrated when asked about the individual’s future career prospects, the differences were evident. The female students foresaw a lower level of expected success in the major-related career field. They were also aware of and concerned about, women engineers being the minority in the male-oriented work place. In contrast, male students were neither aware nor bothered by the fact that female engineers are of extreme minority and the field continues to be strongly male-oriented. Therefore, there is an opportunity for a future study on ‘Peer interaction’, which seems to significantly affect students’ intention to attain an engineering degree or whether they see themselves in an engineering field 10 years on [74]. One surprising finding is that the female students wanted to step into the engineer career field as much as the male students despite their negative expectations and perception on the future career. However, the female students’ negative expectations and perception on the future career are not misconceptions, but the reality [1] that they are likely to encounter at the engineering work places.

5.1.2. The Adjusted SCCT Model Generally Consistent with Previous Findings

The adjusted SCCT model with perceptions on the distal contextual factors in future career had a fairly good model-data fit while most of the core relationships were generally in the same directions with the previous findings except for some cases. The positive relationship between major self-efficacy and expected career success was consistent with the findings from the study of Lent, Brown, and Steven [3] and the study of Lent, Miller, Smith, Watford, Hui, and Lim [58]. The relationship between major self-efficacy and major interest was also in a positive direction as in the previous studies [3,58,59,60,64]. We also found major interest and intention to pursue an engineering career, which was consistent with the findings of Lent et al. [75], where the relationship between interest and intended persistence goals was positive and significant. However, more studies reported nonsignificant relationships between interest and persistent goals [3,60,63,64]. The positive relationship between expected career success and intention to pursue an engineering career was consistent with that in the previous studies [3,60,63,64]. We also found the positive relationship between expected success and major satisfaction as in the studies [3,60,62], while the relationship between expected success and intention to pursue an engineering career is similar to the results of Lent et al. [3].

5.1.3. Gendered Impact of Distal Factors on Intention to Pursue an Engineering Career

As the newly added components in the adjusted integrative SCCT model in our study, we were most interested in the effect of negative prospects on career as minority as the distal factor related to future career (negative prospects on career as minority, perception of male dominance, and expected career success). The female participants had higher scores on negative prospectss on career as minority and perception of male dominance while having lower scores on expected career success. In turn, negative prospects on career as minority was negatively related to expected career success. From the post hoc analysis on the mediation effect, only negative prospects on career as minority showed significant negative indirect effect (β = −0.06; SE = 0.03) between gender and expected career success. The direct effect of gender (β = −0.06; SE = 0.03) was still significant at 0.05 alpha level, which means that the female student had lower expected career success than the male student even after controlling for the indirect effect of negative perception on career as minority. However, we could not find any significant indirect effect of expected career success between negative prospects on career as minority and intention to pursue an engineering career. That is, perception on the distal barrier could not affect the female students’ firm intention for persistence. Interestingly the perception of male dominance was positively related to expected career success for both female and male students. This finding was the opposite result to what was expected. One possible explanation is that the female participants in our study are one of the most high-achieving and highly motivated groups in Korea, and their proactivity and need for achievement might prevent them from being disheartened by the male-dominanted career environment.

5.2. Limitations and Suggestions for Future Studies

The findings of the current study should be understood based upon the following limitations. The identified limitations are derived from the sampling procedure, different modes of the survey administration, cross-sectional data collection, unconsidered factors, and study design.
First, the data analyzed in the current study were collected at one large private university, which is regarded as one of the most prestigious engineering school in Korea. In addition, we could not employ random sampling procedure while relying on the so-called ‘convenient sampling’ procedure. Therefore, the results of the study may not be applicable to the students with different characteristics or from different locations. In particular, the female engineering participants in the current study might be more proactive, goal-oriented, and grittier than the female engineering student in different universities.
Second, the data collection was done in two modes: one was the paper-and-pencil based survey and the other was the online-based survey. The different methods of survey administration possibly confounded the results of the study. For example, it was probable that the students who responded to the paper-and-pencil based survey might have provided more socially desirable answers to the survey questions due to the psychological pressure (e.g., the effect of the proximal presence of their instructors) than those who responded to the online survey. Hence, future studies should administer a survey to each participant in a consistent way. Otherwise, a future study should test whether there is any difference between the different modes of survey administration.
Third, a more reliable result could be deciphered if the survey continues to be ‘longitudinal’, rather than a ‘spot’ or ‘cross-section’. This means that we not only conduct a ‘one-off’ survey asking for answers to questions based on different phases of their lives, but also track students from freshmen through graduation so that we can also understand if and when changes in perceptions occur. To figure out the students’ perceptional changes over time, future studies should address the similar issues of our study based on longitudinally collected data. Specifically, intention to pursue an engineering career might not be directly converted to an actual engineering career choice. Therefore, a follow-up data collection for the actual career choice might add more light to the career development of the women in engineering.
Fourth, we did not include either participants’ university performance (e.g., GPA) or participants’ actual perception on the institutional culture/environment related to male dominance which might play important role in the model. Thus, future studies have to consider including these variables in the model. In this study, an individual was asked about before, during, and after graduating university. In addition, it would be worthwhile investigating whether to extend the survey to include questions on the influence or the effect of programs such as mentoring and networking, run by R-WISET, WISET at university, on the perception of future career in engineering. This aspect could be the critical turning point of R-WISET, WISET programs so as to cultivate a more positive outlook of engineering as a future career for female students.
Finally, we cannot make any causal inference among the variables since we did not employ an experimental design. Even though we interpreted the path analysis results with the expression ‘predict’, that does not mean true causations. Instead, the audience should be aware that the expression just represents the direction of the arrow in the path model. Therefore, to investigate the causal relationships among the variables in the model, the experimental-design studies are imperative.

6. Conclusions and Final Remark

R-WISET, WISET programs in Korea made tremendous efforts to motivate and encourage girls to consider or pursue an engineering major. The results of the survey show that such programs have been a great driving force behind encouraging and motivating female students to embark on studying engineering as their major at university. However, studies showed that female students are hesitant to challenge male-dominated cultural norms that have been established in engineering departments [76,77]. This pattern continues in the work place where women engineers do not challenge when encouraged to take on roles that emphasized the ‘people side’ of engineering rather than developing the technical engineering career [78] (p. 604). This is the typical ‘gendered organizational culture’ that exists in the engineering field. In this regard, a future study in the importance of more ‘inclusive education’ for both male and female students with female mentors who can illustrate work–life issues as well as building a more comparable empathy between male and female students. However, this approach will take years to show any ‘real’ cultural changes in the workplace. Until fairly recently, WISET offered programs only for the female students, but in the last year, the percentage of male students’ participation allowance has been increased to almost 40%. This is a good representation of the realization that building an empathetic relationship between the genders at university level that will bring about less bias working environment in the future. This will also help to foster an organizational culture that promotes gender equity and fairness, as well as increase women’s representation in the work place [79]. However, as the results of the survey showed in this research, there is an underlying lack of awareness in males that they do not realize themselves as biased, which is a fundamental problem that needs to be addressed. What needs to be done as an action for promoting a change in the work place is the change of the ‘system’ which could include regulatory approaches. If we take the example of the example of three children of different heights watching a baseball match over the fence; if all three are treated ‘equally’ and given a box each to stand on, there could be a child who still cannot see over the fence. If, on the other hand, individuals are given different numbers of boxes to stand on, then all children have access to the game. They are treated ‘equitably’, but some have to stand on boxes to watch the game. However, if we remove the solid fence, the cause of the inequity is addressed. In this case, all three children can see the match without any supports or accommodations. The systematic barrier has been removed. This change can only be brought about through a continuous ‘inclusive education’ in the long run at the university level. Other complementary actions, such as more affirmative action policies, for example, mandated regulations on increasing the representation of women on the boards of engineering companies, could be implemented for a faster shift in the gender balance. When this ultimate change through continuous education, with changes in policies and system, is made, then we can expect a dramatic change in the representation of female engineers in the work place worldwide, thus securing better and healthier sustainability of engineering education institutions and work places.

Author Contributions

Conceptualization, E.J. and J.Y.E.K.; methodology, E.J. and J.Y.E.K.; formal analysis, E.J.; investigation, J.Y.E.K.; writing—original draft preparation, E.J. and J.Y.E.K.; writing—revision and editing, E.J. and J.Y.E.K. All authors have read and agreed to the published version of the manuscript.

Funding

The data collection was done by the R-WISET program which was funded by the Korea Center for Women in Science, Engineering and Technology’s Regional Women Empowerment in STEM programs.

Conflicts of Interest

The authors declare no conflict of interest.

References

  1. Center for Women in Science, Engineering & Technology. 2009–2018 Report on Women and Men in Science, Engineering & Technology; Center for Women in Science, Engineering & Technology, 2020. [Google Scholar]
  2. Han, K.H.; Park, J.H.; Kang, H.J. Engineering and Gender: How to Deal with It is Engineering Edcuation?: From the Experiences of Women Into Engineering (WIE) Program in Korea. J. Eng. Educ. Res. 2010, 13, 38–51. [Google Scholar]
  3. Lent, R.W.; Brown, S.D. Understanding and facilitating career development in the 21st century. In Career Development and Counseling: Putting Theory and Research to Work; John Wiley & Sons: Hoboken, NJ, USA, 2013; Volume 2, pp. 1–26. [Google Scholar]
  4. Gardikiotis, A. Minority influence. Soc. Personal. Psychol. Compass 2011, 5, 679–693. [Google Scholar] [CrossRef]
  5. World Economic Forum. Gender Equality in STEM is Possible. These Countries Prove it. Available online: https://www.weforum.org/agenda/2019/03/gender-equality-in-stem-is-possible/ (accessed on 25 July 2020).
  6. Catalyst Women in Science, Technology, Engineering, and Mathematics (STEM): Quick Take. Available online: https://www.catalyst.org/research/women-in-science-technology-engineering-and-mathematics-stem/ (accessed on 25 July 2020).
  7. UNESCO Institute for Statistics. Women in Science; UNESCO Institute for Statistics: Montreal, QC, Canada, 2019; p. 55. [Google Scholar]
  8. Makarem, Y.; Wang, J. Career experiences of women in science, technology, engineering, and mathematics fields: A systematic literature review. Hum. Resour. Dev. Q. 2019, 31, 91–111. [Google Scholar] [CrossRef]
  9. Smeding, A. Women in Science, Technology, Engineering, and Mathematics (STEM): An Investigation of Their Implicit Gender Stereotypes and Stereotypes’ Connectedness to Math Performance. Sex Roles 2012, 67, 617–629. [Google Scholar] [CrossRef] [Green Version]
  10. Powell, A.; Dainty, A.; Bagilhole, B. Gender stereotypes among women engineering and technology students in the UK: Lessons from career choice narratives. Eur. J. Eng. Educ. 2012, 37, 541–556. [Google Scholar] [CrossRef]
  11. Anderson, V. Identifying special advising needs of women engineering students. J. Coll. Stud. Dev. 1995, 36, 322–329. [Google Scholar]
  12. Steffens, M.C.; Jelenec, P.; Noack, P. On the leaky math pipeline: Comparing implicit math-gender stereotypes and math withdrawal in female and male children and adolescents. J. Educ. Psychol. 2010, 102, 947–963. [Google Scholar] [CrossRef]
  13. Tiedemann, J. Parents’ gender stereotypes and teachers’ beliefs as predictors of children’s concept of their mathematical ability in elementary school. J. Educ. Psychol. 2000, 92, 144. [Google Scholar] [CrossRef]
  14. Saucerman, J.; Vasquez, K. Psychological Barriers to STEM Participation for Women Over the Course of Development. Adultspan J. 2014, 13, 46–64. [Google Scholar] [CrossRef]
  15. Herrmann, S.D.; Adelman, R.M.; Bodford, J.E.; Graudejus, O.; Okun, M.A.; Kwan, V.S.Y. The Effects of a Female Role Model on Academic Performance and Persistence of Women in STEM Courses. Basic Appl. Soc. Psychol. 2016, 38, 258–268. [Google Scholar] [CrossRef]
  16. Nauta, M.M.; Epperson, D.L.; Kahn, J.H. A multiple-groups analysis of predictors of higher level career aspirations among women in mathematics, science, and engineering majors. J. Couns. Psychol. 1998, 45, 483. [Google Scholar] [CrossRef]
  17. Evetts, J. Managing the technology but not the organization: Women and career in engineering. Women Manag. Rev. 1998, 13, 283–290. [Google Scholar] [CrossRef]
  18. Sagebiel, F.; Dahmén, J. Masculinities in organizational cultures in engineering education in Europe: Results of the European Union project WomEng. Eur. J. Eng. Educ. 2006, 31, 5–14. [Google Scholar] [CrossRef]
  19. Baron, J.; Burton, M.D.; Hannan, M. Engineering bureaucracy: The genesis of formal policies, positions, and structures in high-technology firms. J. Law Econ. Organ. 1999, 15, 1–41. [Google Scholar] [CrossRef]
  20. De Welde, K.; Laursen, S. The Glass Obstacle Course: Informal and Formal Barriers for Women. Ph.D. students in STEM fields. Int. J. Gend. Sci. Technol. 2011, 3, 571–595. [Google Scholar]
  21. Tang, J. The glass ceiling in science and engineering. J. Socio Econ. 1997, 26, 383–406. [Google Scholar] [CrossRef]
  22. Maskell-Pretz, M.; Hopkins, W.E. Women in Engineering: Toward a Barrier-Free Work Environment. J. Manag. Eng. 1997, 13, 32–37. [Google Scholar] [CrossRef]
  23. England, J.W.; Duffy, R.D.; Gensmer, N.P.; Kim, H.J.; Buyukgoze-Kavas, A.; Larson-Konar, D.M. Women attaining decent work: The important role of workplace climate in Psychology of Working Theory. J. Couns. Psychol. 2020, 67, 251–264. [Google Scholar] [CrossRef]
  24. Faye Krueger, S. The Glass Ceiling: Exploring the Leadership Journey of Men and Women in High-Tech. Ph.D. Thesis, University of San Diego, San Diego, CA, USA, August 2020. [Google Scholar]
  25. Guy, S. Fixing the “Broken Rung” in the Ladder to Success. SWE Magazine, 4 March 2020. [Google Scholar]
  26. Samuel, R.; Omar, R.; Hassian, U. Barriers to Women’s Advancement in the Malaysian Private Enterprises. Int. J. Acad. Res. Bus. Soc. Sci. 2020, 10, 11–19. [Google Scholar]
  27. Shivani Inamdar, S.C. In Implications for Women Leadership. In Proceedings of the ICGR 2020 3rd International Conference on Gender Research, Reading, UK, 2–3 April 2020; Academic Conferences and Publishing Limited: Reading, UK, 2020; p. 108. [Google Scholar]
  28. Bryson, A.; Theodoropoulos, N. In 2B|Gender Equality. In Proceedings of the Applied Research Conference CIPD, Dublin, Ireland, 22–23 January 2020; p. 24. [Google Scholar]
  29. Anderson, W.S. The changing face of the wildlife profession: Tools for creating women leaders. Hum. Wildl. Interact. 2020, 14, 15. [Google Scholar]
  30. Chan, F.M. Female Engineer Officers: Breaking the Glass Ceiling. Ph.D. Thesis, World Maritime University, Malmo, Sweden, November 2019. [Google Scholar]
  31. Hill, C.; Corbett, C.; St Rose, A. Why so Few? Women in Science, Technology, Engineering, and Mathematics; American Association of University Women: Washington, DC, USA, 2010. [Google Scholar]
  32. Schmitt, M. In Women Leaders in Engineering: The Role of Career Orientation. In Proceedings of the ICGR 2020 3rd International Conference on Gender Research, Reading, UK, 2–3 April 2020; Academic Conferences and Publishing Limited: Reading, UK, 2020; p. 220. [Google Scholar]
  33. Blackburn, H. The Status of Women in STEM in Higher Education: A Review of the Literature 2007–2017. Sci. Technol. Libr. 2017, 36, 235–273. [Google Scholar] [CrossRef]
  34. Szelényi, K.; Denson, N.; Inkelas, K.K. Women in STEM Majors and Professional Outcome Expectations: The Role of Living-Learning Programs and Other College Environments. Res. High. Educ. 2013, 54, 851–873. [Google Scholar] [CrossRef]
  35. Piatek-Jimenez, K.; Cribbs, J.; Gill, N. College students’ perceptions of gender stereotypes: Making connections to the underrepresentation of women in STEM fields. Int. J. Sci. Educ. 2018, 40, 1432–1454. [Google Scholar] [CrossRef]
  36. Hunt, J. Why do Women Leave Science and Engineering? ILR Rev. 2015, 69, 199–226. [Google Scholar] [CrossRef]
  37. Corbett, C.; Hill, C. Solving the Equation: The Variables for Women’s Success in Engineering and Computing; ERIC: Techapi, CA, USA, 2015. [Google Scholar]
  38. Bogue, B.; Cady, E.T.; Shanahan, B. Professional Societies Making Engineering Outreach Work: Good Input Results in Good Output. Leadersh. Manag. Eng. 2013, 13, 11–26. [Google Scholar] [CrossRef]
  39. Woolley, A.W.; Chabris, C.F.; Pentland, A.; Hashmi, N.; Malone, T.W. Evidence for a Collective Intelligence Factor in the Performance of Human Groups. Science 2010, 330, 686–688. [Google Scholar] [CrossRef] [Green Version]
  40. Phillips, K.W.; Liljenquist, K.A.; Neale, M.A. Is the pain worth the gain? The advantages and liabilities of agreeing with socially distinct newcomers. Personal. Social Psychol. Bull. 2009, 35, 336–350. [Google Scholar] [CrossRef]
  41. Barker, L.; Mancha, C.; Ashcraft, C. What is the Impact of Gender Diversity on Technology Business Performance: Research Summary. 2014. Available online: https://www.ncwit.org/sites/default/files/resources/impactgenderdiversitytechbusinessperformance_print.pdf (accessed on 25 July 2020).
  42. Catalys. The Bottom Line: Connecting Corporate Performance and Gender Diversity; Catalyst: New York, NY, USA, 2004. [Google Scholar]
  43. Carter, N.M.; Wagner, H.M. The Bottom Line: Corporate Performance and Women’s Representation on Boards (2004–2008); Catalyst: New York, NY, USA, 2011; p. 1. [Google Scholar]
  44. Fayer, S.; Lacey, A.; Watson, A. BLS Spotlight on Statistics: STEM Occupations-Past, Present, And Future; U.S. Bureau of Labor Statistics: Washington, DC, USA, 2017.
  45. Hewlett, S.A.; Luce, C.B.; Servon, L.J.; Sherbin, L.; Shiller, P.; Sosnovich, E.; Sumberg, K. The Athena factor: Reversing the brain drain in science, engineering, and technology. Harv. Bus. Rev. Res. Rep. 2008, 10094, 1–100. [Google Scholar]
  46. Wayne, J.; Russel, J. Declining Interest in Engineering Studies at a Time of Increased Business Need. Book: Universities and Business: Partnering for Knowledge Society, Part V. Available online: https://www.worldexpertise.com/Declining_Interest_in_Engineering_Studies_at_a_Time_of_Increased_Business_Needs.htm (accessed on 31 July 2020).
  47. Dennehy, T.C.; Dasgupta, N. Female peer mentors early in college increase women’s positive academic experiences and retention in engineering. Proc. Natl. Acad. Sci. USA 2017, 114, 5964–5969. [Google Scholar] [CrossRef] [Green Version]
  48. De Celis, I.L.-R.; De Bobadilla, S.F.; Velasco-Balmaseda, E.; Alonso-Almeida, M.D.M.; Intxaurburu-Clemente, G. Does having women managers lead to increased gender equality practices in corporate social responsibility? Bus. Ethic A Eur. Rev. 2014, 24, 91–110. [Google Scholar] [CrossRef]
  49. Milgram, D. How to recruit women and girls to the science, technology, engineering, and math (STEM) classroom. Technol. Eng. Teach. 2011, 71, 4. [Google Scholar]
  50. Sonnert, G.; Fox, M.F.; Adkins, K. Undergraduate Women in Science and Engineering: Effects of Faculty, Fields, and Institutions Over Time. Soc. Sci. Q. 2007, 88, 1333–1356. [Google Scholar] [CrossRef]
  51. Drury, B.J.; Siy, J.O.; Cheryan, S. When Do Female Role Models Benefit Women? The Importance of Differentiating Recruitment From Retention in STEM. Psychol. Inq. 2011, 22, 265–269. [Google Scholar] [CrossRef]
  52. Bandura, A. Social foundations of thought and action. Englewood Cliffs NJ 1986, 1986, 23–28. [Google Scholar]
  53. Hackett, G.; Betz, N.E. A self-efficacy approach to the career development of women. J. Vocat. Behav. 1981, 18, 326–339. [Google Scholar] [CrossRef]
  54. Lent, R.W.; Brown, S.D.; Hackett, G. Toward a Unifying Social Cognitive Theory of Career and Academic Interest, Choice, and Performance. J. Vocat. Behav. 1994, 45, 79–122. [Google Scholar] [CrossRef]
  55. Lent, R.W.; Brown, S.D. Social cognitive career theory at 25: Empirical status of the interest, choice, and performance models. J. Vocat. Behav. 2019, 115, 103316. [Google Scholar] [CrossRef]
  56. Lent, R.W.; Brown, S.D. Social Cognitive Career Theory and Subjective Well-Being in the Context of Work. J. Career Assess. 2008, 16, 6–21. [Google Scholar] [CrossRef]
  57. Lent, R.W.; Brown, S.D. Integrating person and situation perspectives on work satisfaction: A social-cognitive view. J. Vocat. Behav. 2006, 69, 236–247. [Google Scholar] [CrossRef]
  58. Lent, R.W.; Miller, M.J.; Smith, P.E.; Watford, B.A.; Hui, K.; Lim, R.H. Social cognitive model of adjustment to engineering majors: Longitudinal test across gender and race/ethnicity. J. Vocat. Behav. 2015, 86, 77–85. [Google Scholar] [CrossRef]
  59. Byars-Winston, A.; Estrada, Y.; Howard, C.; Davis, D.; Zalapa, J. Influence of social cognitive and ethnic variables on academic goals of underrepresented students in science and engineering: A multiple-groups analysis. J. Couns. Psychol. 2010, 57, 205–218. [Google Scholar] [CrossRef] [PubMed] [Green Version]
  60. Flores, L.Y.; Navarro, R.L.; Lee, H.-S.; Addae, D.A.; Gonzalez, R.; Luna, L.L.; Jacquez, R.; Cooper, S.; Mitchell, M. Academic satisfaction among Latino/a and White men and women engineering students. J. Couns. Psychol. 2014, 61, 81–92. [Google Scholar] [CrossRef] [PubMed] [Green Version]
  61. Navarro, R.L.; Flores, L.Y.; Legerski, J.-P.; Brionez, J.; May, S.F.; Na Suh, H.; Slivensky, D.R.; Tapio, F.; Lee, H.-S.; Garriott, P.O.; et al. Social cognitive predictors of engineering students’ academic persistence intentions, satisfaction, and engagement. J. Couns. Psychol. 2019, 66, 170–183. [Google Scholar] [CrossRef]
  62. Lent, R.W.; Miller, M.J.; Smith, P.E.; Watford, B.A.; Lim, R.H.; Hui, K. Social cognitive predictors of academic persistence and performance in engineering: Applicability across gender and race/ethnicity. J. Vocat. Behav. 2016, 94, 79–88. [Google Scholar] [CrossRef] [Green Version]
  63. Lee, H.-S.; Flores, L.Y.; Navarro, R.L.; Kanagui-Muñoz, M. A longitudinal test of social cognitive career theory’s academic persistence model among Latino/a and White men and women engineering students. J. Vocat. Behav. 2015, 88, 95–103. [Google Scholar] [CrossRef]
  64. Navarro, R.L.; Flores, L.Y.; Lee, H.-S.; Gonzalez, R. Testing a longitudinal social cognitive model of intended persistence with engineering students across gender and race/ethnicity. J. Vocat. Behav. 2014, 85, 146–155. [Google Scholar] [CrossRef]
  65. Lent, R.W.; Sheu, H.-B.; Gloster, C.S.; Wilkins, G. Longitudinal test of the social cognitive model of choice in engineering students at historically Black universities. J. Vocat. Behav. 2010, 76, 387–394. [Google Scholar] [CrossRef]
  66. Jamovi Project. Jamovi (Version 0.8) [Computer Software]. 2017. Available online: https://www.jamovi.org/ (accessed on 20 May 2020).
  67. Muthén, L.K. Mplus: The Comprehensive Modelling Program for Applied Researchers: User’s Guide; Muthen & Muthen: Los Angeles, CA, USA, 2018; p. 5. [Google Scholar]
  68. Kline, R.B. Principles and Practice of Structural Equation Modeling; Guilford publications: New York, NY, USA, 2015. [Google Scholar]
  69. Brown, T.A. Confirmatory Factor Analysis for Applied Research; Guilford publications: New York, NY, USA, 2015. [Google Scholar]
  70. Hu, L.; Bentler, P.M. Cutoff criteria for fit indexes in covariance structure analysis: Conventional criteria versus new alternatives. Struct. Equ. Model. A Multidiscip. J. 1999, 6, 1–55. [Google Scholar] [CrossRef]
  71. Lai, K.; Green, S.B. The Problem with Having Two Watches: Assessment of Fit When RMSEA and CFI Disagree. Multivar. Behav. Res. 2016, 51, 220–239. [Google Scholar] [CrossRef]
  72. Tabachnick, B.G.; Fidell, L.S.; Ullman, J.B. Using Multivariate Statistics; Pearson: Boston, MA, USA, 2007; Volume 5. [Google Scholar]
  73. Cohen, J. Statistical Power Analysis for the Behavioral Sciences; Academic Press: Cambridge, MA, USA, 2013. [Google Scholar] [CrossRef]
  74. Amelink, C.T.; Creamer, E.G. Gender Differences in Elements of the Undergraduate Experience that Influence Satisfaction with the Engineering Major and the Intent to Pursue Engineering as a Career. J. Eng. Educ. 2010, 99, 81–92. [Google Scholar] [CrossRef]
  75. Lent, R.W.; Lopez, F.G.; Sheu, H.-B.; Lopez, A.M. Social cognitive predictors of the interests and choices of computing majors: Applicability to underrepresented students. J. Vocat. Behav. 2011, 78, 184–192. [Google Scholar] [CrossRef]
  76. Parker, A.; Ingram, S. Gender and Collaboration: Communication Styles in the Engineering Classroom; Fernwood Publishing Company, Limited: Halifak, NS, Canada, 2004. [Google Scholar]
  77. Goodman, I. Final Report of the Women’s Experiences in College Engineering (WECE) Project; Goodman Research Group. Inc.: Cambridge, MA, USA, 2002. [Google Scholar]
  78. Cardador, M.T. Promoted Up but Also Out? The Unintended Consequences of Increasing Women’s Representation in Managerial Roles in Engineering. Organ. Sci. 2017, 28, 597–617. [Google Scholar] [CrossRef]
  79. Gibson, S.K. Mentoring of Women Faculty: The Role of Organizational Politics and Culture. Altern. High. Educ. 2006, 31, 63–79. [Google Scholar] [CrossRef]
Figure 1. Illustration of the survey structure categorized into three time-points.
Sustainability 12 08299 g001
Figure 2. The adjusted social cognitive career theory model for the intention to pursue an engineering career.
Sustainability 12 08299 g002
Figure 3. The model with the unstandardized path coefficient; The nonsignificant paths are shown in dotted line; ** p < 0.01; *** p < 0.001.
Sustainability 12 08299 g003
Table 1. Participants’ gender, major, and grade.
CategoryN%
Gender
Male29571.1
Female12028.9
Major
Civil, Environmental, & Architectural Engineering8019.3
Architecture5713.7
Mechanical Engineering245.8
Industrial Engineering143.4
Material Sciences & Engineering12530.1
Electrical Engineering297.0
Chemical Engineering8620.7
Grade
Freshman19547.0
Sophomore4811.6
Junior9923.9
Senior7317.6
Table 2. Correlation among the variables in the proposed model.
12345678
1. Major identity
2. Major self-efficacy0.33 ***
3. Major interest0.50 ***0.41 ***
4. Major satisfaction0.69 ***0.21 ***0.47 ***
5. Negative prospects a−0.12 ***0.10 ***0.06 ***−0.09 ***
6. Perception of male dominance−0.05 ***0.20 ***0.15 ***0.01 ***0.64 ***
7. Expected career success0.57 ***0.32 ***0.55 ***0.58 ***−0.15 ***0.01 ***
8. Intention to pursue b0.50 ***0.19 ***0.42 ***0.62 ***−0.11 ***−0.00 ***0.48 ***
Note: a Negative prospects on career as minority; b Intention to pursue an engineering career; * p < 0.05; ** p < 0.01; *** p < 0.001.
Table 3. Internal Consistency Reliability and Confirmatory Factor Analysis Results.
Time CategoryVariable # of Itemsα1CFA Results
Modelχ2dfCFISRMRRange of Stand. FLs3
Before Entering UniversityIndividual aspiration and interest50.87One-factor223.71 ***40.980.030.68–0.84
Influence of significant others50.81One-factor 33.50 ***50.960.040.49–0.85
Expected value in the major-related career fields40.83One-factor21.12 ***20.970.030.58–0.86
During UniversityMajor identity40.87One-factor 17.25 ***20.980.020.66–0.86
Major self-efficacy30.76One-factor 0.004041.0040.0040.60–0.88
Major interest60.87One-factor245.84 ***80.970.030.64–0.80
Major satisfaction40.85One-factor 18.59 ***20.980.020.55–0.90
After Graduating UniversityNegative prospects on career as minority60.78One-factor45.79 ***90.940.040.54–0.75
Perception of male dominance60.90One-factor100.41 ***90.950.040.59–0.90
Expected career success40.88One-factor 29.97 ***20.970.030.67–0.93
1 Cronbach’s α; 2 Modified model with one error correlation between the first and second items; 3 Range of standardized factor loadings; 4 Since the model was just-identified, the values of model fit indices were not meaningful; *** p < 0.001.
Table 4. Independent t-test Results.
Time CategoryVariableFemaleMalet-ValueCohen’s d1
Mean (SD)Mean (SD)
Before Entering UniversityIndividual aspiration and interest3.68 (0.77)3.65 (0.81)0.38-
Influence of significant others2.04 (0.75)2.16 (0.90)−1.38-
Expected value in the major-related career fields3.23 (0.86)3.32 (0.84)−0.96-
During UniversityMajor identity3.55 (0.77)3.58 (0.75)−0.33-
Major self-efficacy 3.04 (0.83)3.12 (0.78)−0.93-
Major interest3.28 (0.74)3.34 (0.79)−0.65-
Major satisfaction3.57 (0.77)3.55 (0.82)0.22-
After Graduating UniversityNegative prospects on career as minority2.98 (0.71)2.62 (0.70)4.71 ***0.51
Perception of male dominance2.68 (0.83)2.35 (0.92)3.41 ***0.37
Expected career success3.39 (0.77)3.62 (0.76)−2.83 **−0.31
Intention to pursue an engineering career 3.97 (0.73)3.90 (0.91)0.73-
1 Cohen’s d effect sizes were presented only if the given mean difference was statistically significant; **p < 0.01; *** p < 0.001.
Table 5. Model Parameter Estimates (Path Coefficients).
ParameterB (SEB)β (SEβ)
Gender → Negative prospectsa0.36 (0.08)***-
Gender → Perception of male dominance0.33 (0.10)**-
Gender → Expected career success−0.18 (0.07)**-
Gender → Major interest0.05 (0.07) -
Gender → Major satisfaction0.05 (0.06) -
Gender → Intention to pursueb0.10 (0.07) -
Gender → Major self-efficacy−0.07 (0.08) -
Major identity → Major self-efficacy0.35 (0.05)***0.33 (0.04)***
Major identity → Expected career success0.52 (0.04)***0.51 (0.04)***
Major self-efficacy → Expected career success0.13 (0.04)***0.14 (0.04)**
Negative prospectsa → Expected career success−0.17 (0.06)**−0.16 (0.05)**
Perception of male dominance → Expected career success0.11 (0.04)*0.13 (0.05)*
Major identity → Major interest0.23 (0.05)***0.22 (0.05)***
Major self-efficacy → Major interest0.22 (0.04)***0.26 (0.04)***
Expected career success → Major interest0.36 (0.05)***0.35 (0.05)***
Major identity → Major satisfaction0.64 (0.04)***0.61 (0.04)***
Major interest → Major satisfaction0.18 (0.04)***0.17 (0.04)***
Major self-efficacy → Intention to pursueb−0.01 (0.05)−0.01 (0.04)
Expected success in career → Intention to pursueb0.14 (0.06)*0.14 (0.05)*
Major interest → Intention to pursueb0.16 (0.06)*0.12 (0.05)*
Major satisfaction → Intention to pursueb0.53 (0.05)***0.50 (0.04)***
Note. a Negative prospects on career as minority; b Intention to pursue an engineering career; B: unstandardized path coefficient; SEB: standard error of B; β: standardized path coefficients; SEβ: standard error of β; * p < 0.05; ** p < 0.01; *** p < 0.001.

