Article

Text Mining National Commitments towards Agrobiodiversity Conservation and Use

by
Stella D. Juventia
1,2,
Sarah K. Jones
1,
Marie-Angélique Laporte
1,
Roseline Remans
3,
Chiara Villani
3 and
Natalia Estrada-Carmona
1,*
1
The Alliance of Bioversity International and CIAT, Parc Scientifique Agropolis II, 34397 Montpellier, France
2
Farming Systems Ecology Group, Wageningen University & Research, 6700 AK Wageningen, The Netherlands
3
The Alliance of Bioversity International and CIAT, Via del Tre Denari, 472/a, 00054 Maccarese (Fiumicino), Italy
*
Author to whom correspondence should be addressed.
Sustainability 2020, 12(2), 715; https://doi.org/10.3390/su12020715
Submission received: 19 October 2019 / Revised: 8 January 2020 / Accepted: 17 January 2020 / Published: 19 January 2020
(This article belongs to the Section Sustainable Engineering and Science)

Abstract

:
Capturing countries’ commitments for measuring and monitoring progress towards certain goals, including the Sustainable Development Goals (SDGs), remains underexplored. The Agrobiodiversity Index bridges this gap by using text mining techniques to quantify countries’ commitments towards safeguarding and using agrobiodiversity for healthy diets, sustainable agriculture, and effective genetic resource management. The Index extracts potentially relevant sections of official documents, followed by manual sifting and scoring to identify agrobiodiversity-related commitments and assign scores. Our aim is to present the text mining methodology used in the Agrobiodiversity Index and the calculated commitments scores for nine countries while identifying methodological improvements to strengthen it. Our results reveal that levels of commitment towards using and protecting agrobiodiversity vary between countries, with most showing the strongest commitments to enhancing agrobiodiversity for genetic resource management followed by healthy diets. No commitments were found in any country related to some specific themes including varietal diversity, seed diversity, and functional diversity. The revised text mining methodology can be used for benchmarking, learning, and improving policies to enable conservation and sustainable use of agrobiodiversity. This low-cost, rapid, remotely applicable approach to capture and analyse policy commitments can be readily applied for tracking progress towards meeting other sustainability objectives.

1. Introduction

Identifying effective interventions to achieve the Sustainable Development Goals (SDGs) requires methods for measuring and monitoring progress towards the SDG targets [1]. Quantifying progress towards those goals to inform policymakers and the general public requires a wide array of indicators [2]. Composite indices, where indicators are aggregated to measure multidimensional concepts that cannot be captured by any single indicator, have been widely used to assess countries’ performances in policy evaluation and public engagement [3]. As argued by Moldan et al. [2], composite indices facilitate a simplified comparison of countries, which stimulates competition, making them an effective behaviour change tool. While some indices are used to measure progress towards a specific SDG, e.g., the Environmental Performance Index (EPI) which aligns with SDG 15 [4], others provide a collective measurement across multiple goals, e.g., the SDG Gender Index [5], or all the 17 SDGs, e.g., the SDG Index and Dashboards [6]. Most of the indicators used, including the 232 global indicators recommended by the UN Statistical Commission, are based on field data (used directly or as model inputs), e.g., air pollution levels, life expectancy at birth estimated from mortality rates observed in a given year, and overfishing based on fish population biomass [4,7,8,9]. Progress measurements based on field data reflect how a country as a whole is performing, which is a result of many factors and multiple players.
National policies and strategies can complement field data sources, providing insights into governments’ committed strategies and actions in relation to each SDG target. Combining these two data sources provide a more holistic assessment of a country’s profile—where it stands and the directions it is taking. Field data reflect the current status but these may not (yet) reflect the impact of current policies in place at the time a measurement is taken. In contrast, commitments found in national policies and strategies implicitly or explicitly reflect country intentions to achieve targets. Policies act as one of the major drivers of change by shaping resource allocation and political development [10]. For example, Stoate et al. [11] highlight that the largest decrease in pesticide sales in Europe were seen in countries enforcing specific policies on pesticide reduction. However, variation in monitoring methods between countries, among other aspects, makes short-term assessment and comparisons difficult. Nevertheless, while the utilization of field data has been widely applied in many indices, studied, and discussed, the value and feasibility of capturing countries’ commitments as part of the assessment, is underexplored.
Text mining, which combines information extraction, machine learning, and data mining techniques, has been increasingly used as an exploratory approach in metadata analyses to discover new information by automatic extraction of a set of search terms and the relationship between terms from various unstructured text-based sources [12,13]. Several studies have shown the potential of text mining in effectively addressing human limitations in time and cognition in various disciplines given the rate of growth in scientific publications [14,15,16,17,18].
The Agrobiodiversity Index [19,20,21] is one of the first indices to attempt to score values based on both field data and information sourced from official documents (i.e., legislation and strategies). The Index aims to assess the ‘status’ of agrobiodiversity as well as to what extent ‘commitments’ and ‘actions’ of a country are contributing to conserve and use agrobiodiversity for creating sustainable food systems at a country level; and it seeks to iteratively update its methodology as improved data and interpretation approaches become available. The Index results can be used to help track progress towards selected targets under SDG 2, 12, 13, and 15 [20] and to highlight opportunities for using crop, farm, and agricultural landscape diversity to reduce agricultural risks and increase the sustainability and resilience of food systems.
The Agrobiodiversity Index was used in 2019 to calculate national-level commitments to using and conserving agrobiodiversity for sustainable food systems, for 10 countries [21]. For this, the Agrobiodiversity Index team used text mining to extract potentially relevant sections of policy documents, followed by manual sifting and scoring of agrobiodiversity-related commitment levels. Assessments of commitment levels from policy documents cannot be used to claim that agrobiodiversity conservation and use happens due to the presence of policies; measuring policy effectiveness would require in-depth country analysis [22]. However, creating an enabling policy environment is the first step towards action. The Agrobiodiversity Index country results represent the first application of text mining that we know of to extract information from multiple national policy documents to measure commitments across multiple countries [21]. This semiautomated approach enables analysis of a much larger number of official documents than would be possible with solely manual input.
In this research, we present the text mining methodology used in the Agrobiodiversity Index country application [21], to which all of the authors of this paper contributed. We analyse the effect of using all versus a subset of the Agrobiodiversity Index commitment subindicators to calculate national commitment levels, and the effect of using all versus a subset of policy and strategy documents available in global repositories. We slightly adapt the Agrobiodiversity Index methodology used in [21] based on this analyses and use our adapted methodology to calculate commitment scores for nine countries based on an analysis of 1194 official national policy and strategy documents. Finally, we explore options for increased automation of the commitment scoring methodology based on the number of occurrences of agrobiodiversity-related search terms and the number of source documents containing at least one of these terms per country. Through these analyses we respond to three main research questions: (1). What is the level of commitment towards agrobiodiversity conservation and use for sustainable food systems, across nine countries? (2). What is the difference between commitment scores based on documents from global versus national public policy repositories for one in-depth case (India)? (3). What are the strengths and weaknesses of the Agrobiodiversity Index methodology used in [21] for scoring a country’s commitment levels?

2. Materials and Methods

2.1. Text Mining Methodology

The text mining methodology consists of three main steps: (1) identifying the search terms associated with conservation and sustainable use of agrobiodiversity (Section 2.1.1); (2) conducting text mining across retrieved official documents to extract sentences containing these search terms (Section 2.1.2); and (3) manually scoring each sentence according to the level of commitment expressed for calculating the overall commitment score (Section 2.1.3).

2.1.1. Identifying Meaningful Search Terms to Assess Commitments

The Agrobiodiversity Index can be used to assess national commitments to conserving and using agrobiodiversity for (1) healthy diets; (2) sustainable agricultural production; and (3) current and future use options, which constitute the three ‘pillars’ of the Agrobiodiversity Index [20,21]. Each pillar contains one indicator used to assess country commitment levels related to the pillar. Each of these three indicators includes two types of subindicators: general and specific. General subindicators are designed to assess general and broad commitments towards sustainable food systems under each pillar (e.g., commitment to achieving healthy and sustainable diets), whereas the specific subindicators are designed to capture specific commitments to using or conserving agrobiodiversity (e.g., commitment to diversifying diets). The Agrobiodiversity Index team, through literature review and consultations with external experts, developed a comprehensive list of search terms related to each subindicator (see Table 1 and Supplementary Material 1).
The Agrobiodiversity Index country results for 2019 used 302 search terms to identify relevant commitments and determine national commitment scores for 10 countries [21]. For the present paper, we used the same search terms. We grouped syntactically similar search terms within each subindicator (hereafter called search term groups) for analysis and reporting purposes. For example, the search terms ‘diversified farm’, ‘diversity of farm’, and ‘farm diversity’ were grouped into the search term group ‘farm diversi*’. See Supplementary Material 1 for the full list of search terms, search term groups, subindicators, and indicators.

2.1.2. Identifying Documents

The latest Agrobiodiversity Index country report [21] calculated national commitments scores based on official documents classified as legislation or strategies and tagged as related to nutrition, agriculture, environment, or genetic resources for each country. These documents were downloaded from international public policy repositories (i.e., the GINA database [23] and the FAOLEX database [24]) in November 2018 and included national, subnational, official, and not official documents. For this paper, we calculated national commitments scores using only national and official documents aiming to better capture national-level commitments.
The final set of official documents used for the analysis in this paper included 1194 documents spanning nine case study countries. Following the Agrobiodiversity Index methodology [20], these official documents were converted to text files using several tools: pdftotext version 4.01 [25], Textract Python library [26], and optical character recognition tool—Tesseract released under GPL v3 license. The Python Natural language toolkit [27] was used to identify occurrences of each agrobiodiversity-related search term (see Table 1) contained in these text files and extract the sentence containing the search term as well as following and previous sentences to aid interpretation (code available at: https://github.com/marieALaporte/commitment-score).

2.1.3. Scoring the Level of Commitment

Following the Agrobiodiversity Index methodology [20], a trained analyst cleaned, translated (where necessary), and then scored each sentence extracted from the text mining to determine the level of commitment associated with the identified search term (see Table 2). Each analyst received clear guidelines on how to score commitment levels and their scoring was randomly checked by a more experienced analyst to ensure consistency. Each extracted sentence is associated with one search term. If an extracted sentence contains more than one search term, there will be two exact same extracted sentences for each of the different search terms. Hence search terms associated with a single subindicator may be assigned different commitment scores. Sentences received commitment scores of 0, 1, 2, or 3 using the Agrobiodiversity Index scoring guidelines summarized in Table 2.
Contrary to the Agrobiodiversity Index methodology [20,21], here we only considered specific subindicator scores aiming to capture commitments specifically related to agrobiodiversity rather than commitments to sustainable food systems overall. Score calculation followed the Agrobiodiversity Index [20] procedures where the subindicator score was based on the maximum score achieved across all search terms relating to that subindicator. For example, if a country achieved a score of “3” for the search term ‘crop diversification’ and a score of “0” for the search term ‘multiple crops,’ where both search terms are associated with the level of commitment towards ‘crop diversity’ subindicator, the country’s score for this subindicator would be 3. The equations used to calculate the indicator and overall commitment scores are as follows:
Indicator   score   x i = M 1 3 × 100 % + M 2 3 × 100 % + + M n 3 × 100 % n ,
Overall commitment score X = x 1 + x 2 + x 3 3 ,
where xi is a single indicator; X is all three indicators; n is the number of subindicators in the indicator; Mn is the maximum recorded score in the nth specific subindicator; and xn is the score of the nth indicator (score calculations followed the Agrobiodiversity Index [20]). We tested using the median instead of the mean as a measure of central tendency, since medians are generally more appropriate for ordinal data. Nonetheless, using medians posed two main challenges: (1) it failed to capture small but existing national commitments for some countries, and (2) it resulted in illogical ranking of countries, such that some countries with a few weak and a few strong commitments, e.g., Ethiopia, scored better than other countries with stronger commitments, e.g., India (for more details, see Supplementary Material 2). Hence, we opted to use the mean consistent with the Agrobiodiversity Index [20,21], which other research has shown can be a better measure of central tendency in some cases [28].

2.2. Case Studies

2.2.1. Country Selection

We focused on nine out of the ten countries analysed in the Agrobiodiversity Index [21]. The original ten included countries from the Americas (Peru and the United States of America), Europe (Italy), Asia (India), Africa (Ethiopia, Kenya, Nigeria, South Africa), and Australia. These countries were selected to cover: (1) different continents, and (2) different languages to accommodate the team’s capacity to translate and interpret. The selection prioritized countries where Bioversity International had strong collaborations with national policymakers to facilitate the use of the Agrobiodiversity Index results in decision-making. China was excluded from the analysis in this paper to ensure cross-country scores were strictly comparable. This is because the commitment assessment reported in the Agrobiodiversity Index [21] was conducted entirely manually (i.e., without using text-mining) due to technical challenges when using optical recognition tools on Chinese texts.

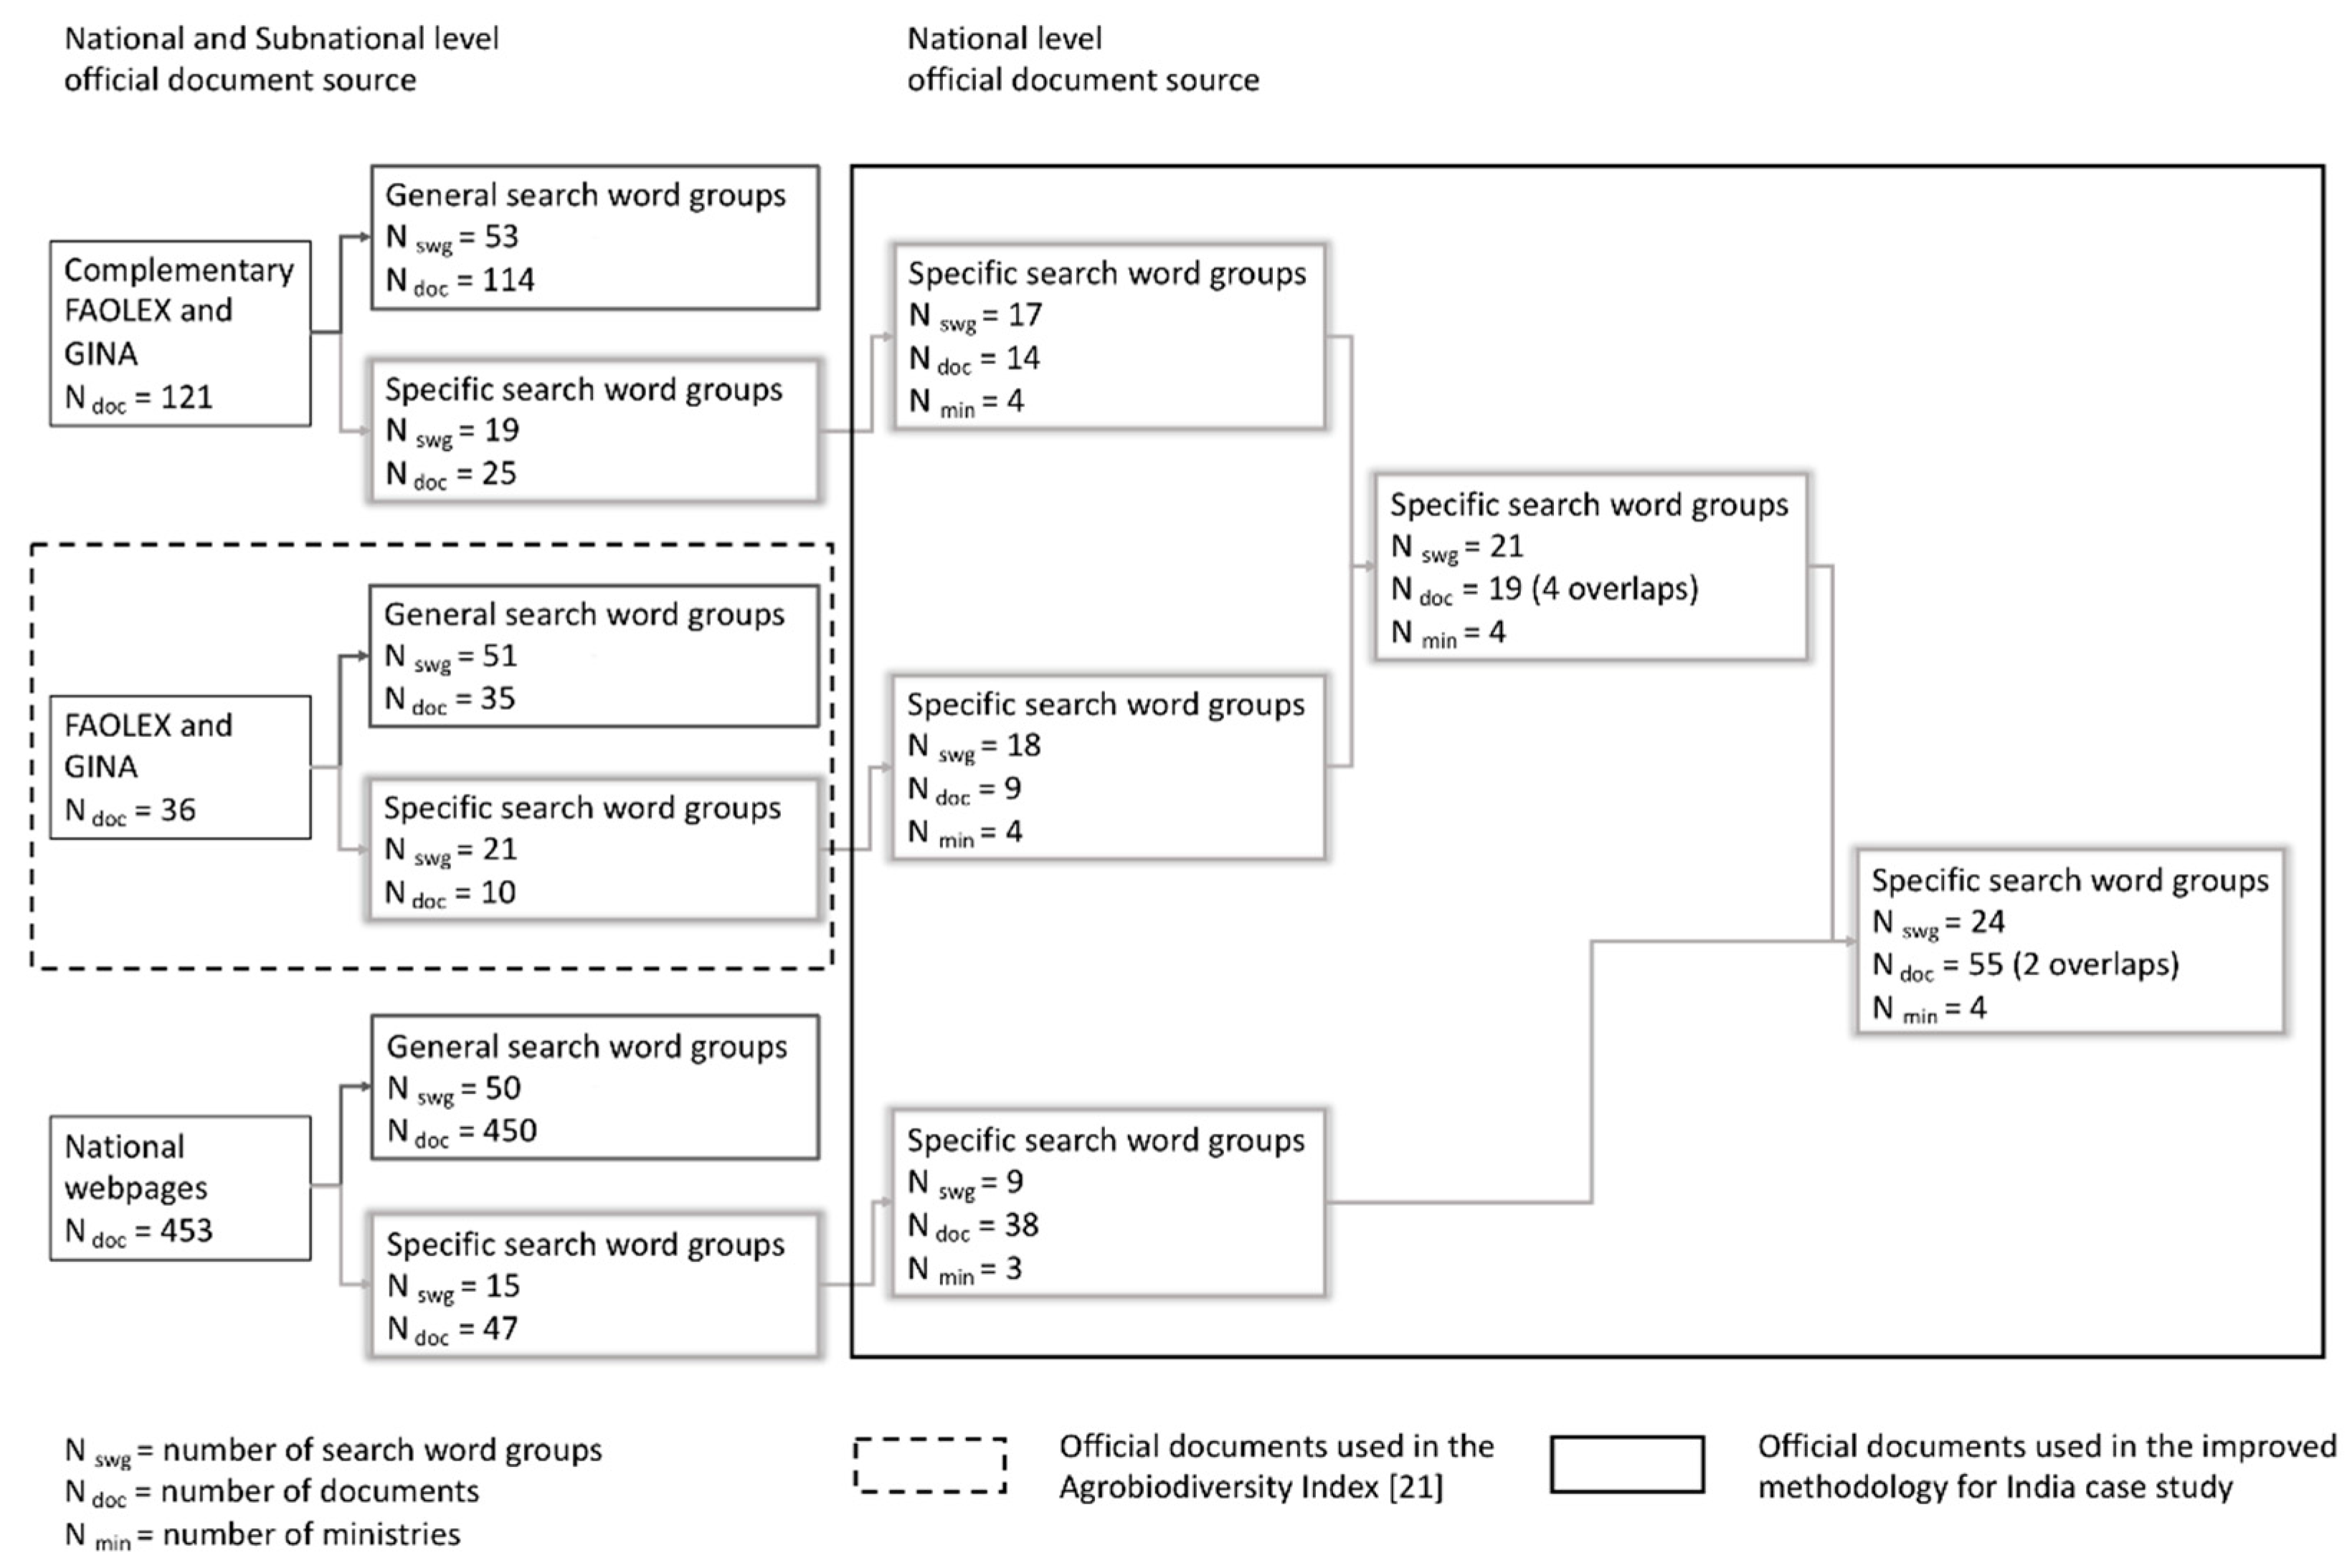
2.2.2. Document Sourcing Strategies: India Case

India was used as a case study to verify if global public policy repositories (i.e., FAOLEX and GINA) are comprehensive and include the official documents found in the national public policy repositories (i.e., webpages of agrobiodiversity related ministries). The Agrobiodiversity Index country application [21] searched for “policy” and “legislation” types of official documents and documents linked to four of the themes (“Agricultural and rural development,” “Cultivated plants,” “Environment,” “Food and nutrition”) listed in FAOLEX and GINA. Here, we complemented this search by including “regulation” document types as well the remaining thematic categories excluded in the original search (i.e., “Fisheries and aquaculture,” “Forestry,” “Land and soil,” “Livestock,” “Mineral resources and energy,” “Sea,” “Water,” “Wild species and ecosystems”). In parallel, we downloaded all official documents and reports publicly available on the Indian ministries’ webpages including the Agriculture and Farmers Welfare, Chemicals and Fertilizers, Consumer Affairs Food and Public Distribution, Environment Forest and Climate Change and Rural Development. An automated script was used to retrieve all pdf documents publicly available under “Acts and Rules” and/or “Schemes” tabs on each ministry webpage where official documents are often stored in the Indian case. Next, we text-mined these documents using the search terms and scoring methods as described in Section 2.1. We combined the document search found in the Agrobiodiversity Index [21] and the complementary search and compared it with those found in national repositories. We recorded and compared the number of used search term groups; the number of sources containing the search term groups; the ministries that issued the respective documents; and the subindicator, indicator and overall commitment scores across repositories. We compared the scores using a simple linear regression.

2.2.3. Country Scoring Differences and Ranking

Moving from subindicators scores to an Overall score demands to aggregate those values. The aggregation method (e.g., mean, mode) has an impact on countries Overall score and therefore ranking. For instance, we explored the differences in the countries ranking with a cumulative link model (clm) and logit function for ordinal data (Model 1, Equation. (1)). Model 1 uses the 18 subindicator scores as the response variables and the nine-countries as explanatory variables. We performed a one-way analysis of deviance (ANODE) to check whether mean response variable values differed significantly between countries and we used Tukey’s honestly significant difference (HSD) as a post-hoc test to identify specific pairs of countries whose scores significantly differed. For these analyses, we used the statistical program R, version 3.5.1 [29], the “Ordinal” package [30] and the “lsmeans” package [31].
Model1 <- clm(subindicator_score ~ country, link=”logit”).

2.2.4. Factors Predicting National Commitment Scores

The methodology to score national commitment levels used in the Agrobiodiversity Index [21] generates information for each country on the occurrence of agrobiodiversity-related search terms across all documents searched, and the number of individual documents that contain at least one agrobiodiversity-related search term and thus represents unique data sources. We explored the possibility of using the number of search terms in each subindicator (occurrences count) or the number of unique data sources per subindicator (source count) to rank countries by their commitment levels, as a fully automated alternative to manual scoring. For this, we used the Spearman rank correlation coefficient to check for associations between ‘occurrence count’ or ‘source count’ and maximum score per subindicator (Supplementary Material 4). We used generalized linear models (GLM) with a negative binomial distribution and number of occurrences (occurrence count) or the number of sources (source count) as the response variable (Model 2a-b, Equation. (2)). We selected GLMs because these models are well suited to dealing with count data [32]. We performed a one-way analysis of variance (ANOVA) to check whether mean response variable values differ significantly between countries and used Tukey’s honestly significant difference (HSD) as a post-hoc test to identify specific pairs of countries whose response scores significantly differed. For these analyses, we used the R package “lm4” [32] and “lsmeans” [31].
Model2a <- glm.nb(occurrence_count ~ country);
Model2b <- glm.nb(source_count ~ country).

3. Results

3.1. Methodological Improvements

The countries’ scores presented here involved three main methodological changes for improving the text mining methodology proposed by the Agrobiodiversity Index [20,21] (Table 3). The Agrobiodiversity Index [21] and this paper scores are highly and significantly correlated (see Supplementary Material 3 for further details). The lower indicator scores in this paper, suggest that including general, subnational, and non-official documents could in fact inflate the commitments score. Estimating the scores in this paper took less time than those in the Agrobiodiversity Index [21] given the reduction in the workload for scoring the sentences with the 183 general search terms across subindicators.

3.2. Levels of Commitment towards Agrobiodiversity Conservation and Use across Nine Countries

Search term groups occurrences across subindicators and indicators facilitate overviewing the most commonly used and the missing search term groups across countries. Further, based on these occurrences, we identified common strategies towards agrobiodiversity conservation and use across the nine countries.

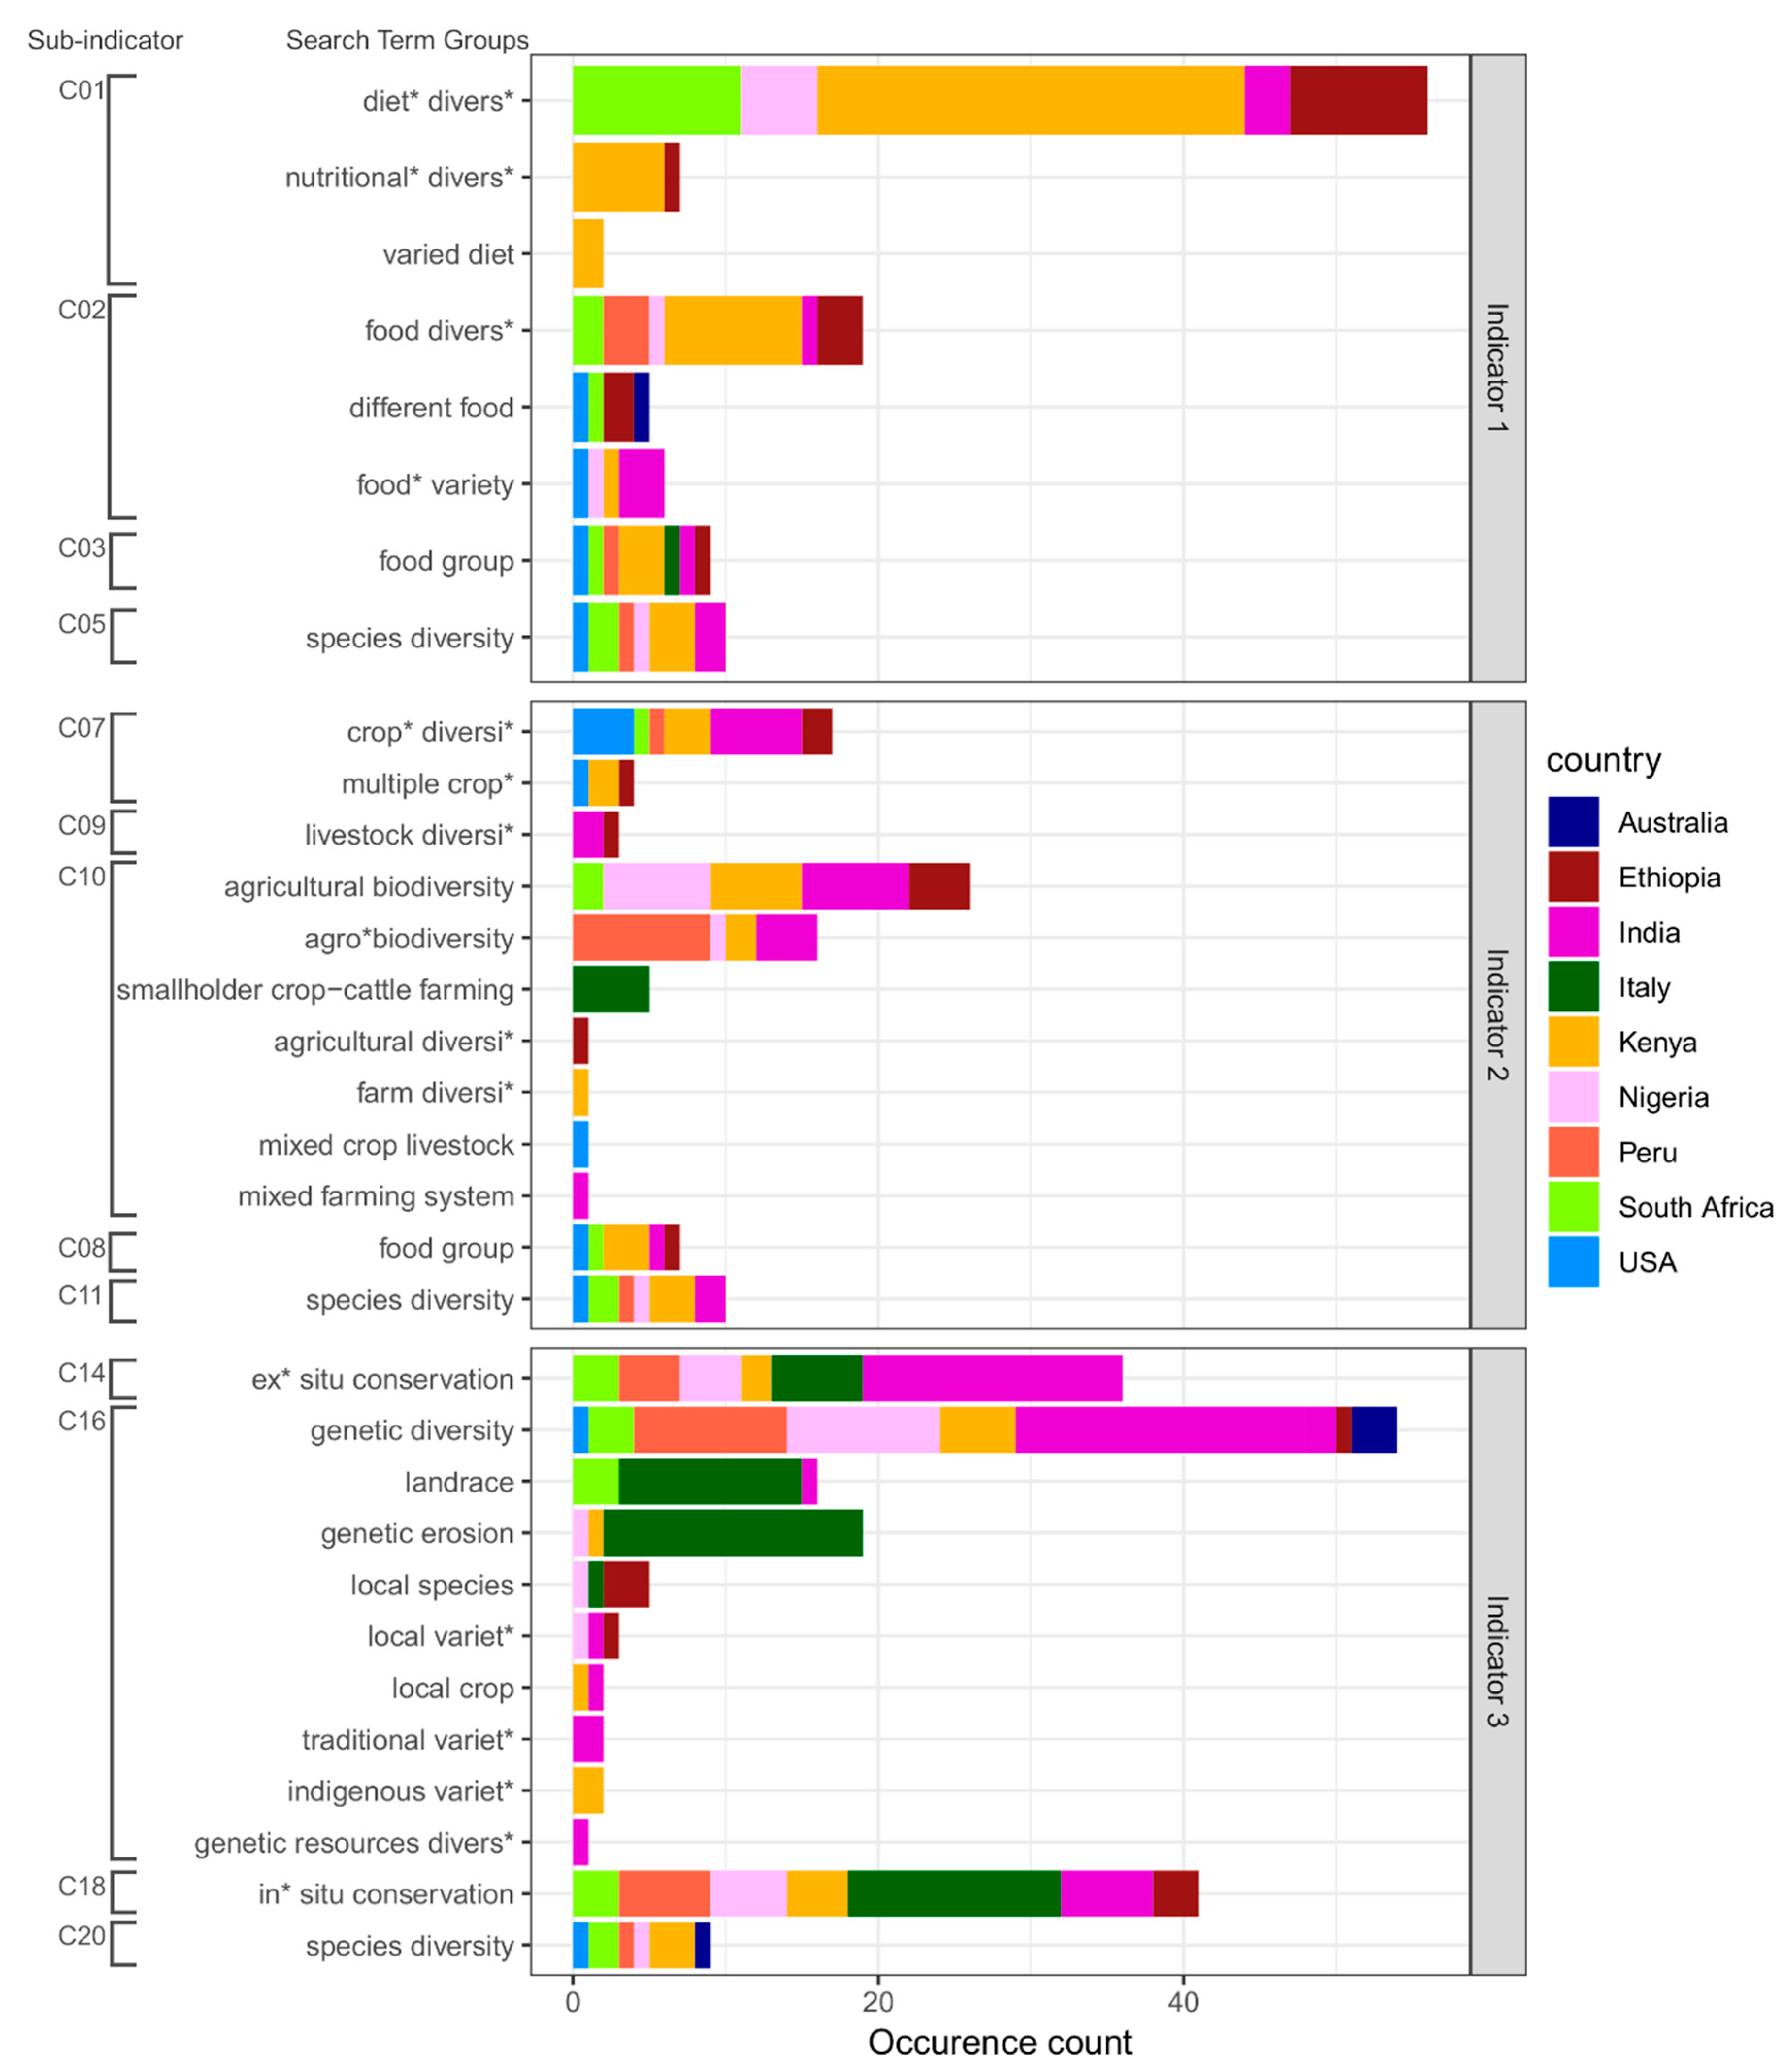
3.2.1. Common and Missing Search Term Groups

Most of the retrieved policy sources mentioning ‘specific’ and ‘general’ search terms from FAOLEX and GINA fell under the score “0—not applicable” (69%; 826 documents), suggesting that the search term groups are commonly mentioned but often refer to an external body or document. The remaining 368 documents (31% total retrieved documents) contained search term groups scored as mention (score = 1), strategy (score = 2), or target (score = 3). A total of 112 (30%) of these sources contained ‘specific’ search term groups and 92 documents were official documents at the national level.
Around half (i.e., 29) of the 62 specific search term groups were mentioned in a policy document by at least one country (see Supplementary Material 1). Specific search term groups not found (33) in the official documents included search terms under subindicators Varietal Diversity (C06, C13, C21), Seed Diversity (C19), and Functional Diversity (C15).
Indicator 2 on sustainable agriculture had the highest percentage of search term groups used (12 out of 20, 60%), followed by indicator 1 on healthy diets (eight out of 17, 47%) and indicator 3 on current and future use options (12 out of 34, 35%). Nonetheless, the cumulative occurrence indicates that policy documents more commonly mention search terms linked to indicator 3 (190 occurrences) followed by indicator 1 (113 occurrences) and indicator 2 (92 occurrences) (Figure 1).
None of the search term groups were used by all nine countries, yet search term groups such as “genetic diversity,” “species diversity,” and “food group” were commonly used across countries (Figure 1). We found that Kenya and India had the most extensive use of search term groups as they expressed commitments by using non-commonly used search term groups, such as “varied diet,” “farm diversi*,” “mixed farming system,” “traditional varie*,” and “genetic resources divers*” (Figure 1). India and Italy were the countries with higher occurrences in indicator 3; Kenya in indicator 1; and various countries in indicator 2. Overall, countries with economies in development tend to use more search terms in their legislation than countries such as the USA, Italy, or Australia (Figure 2).

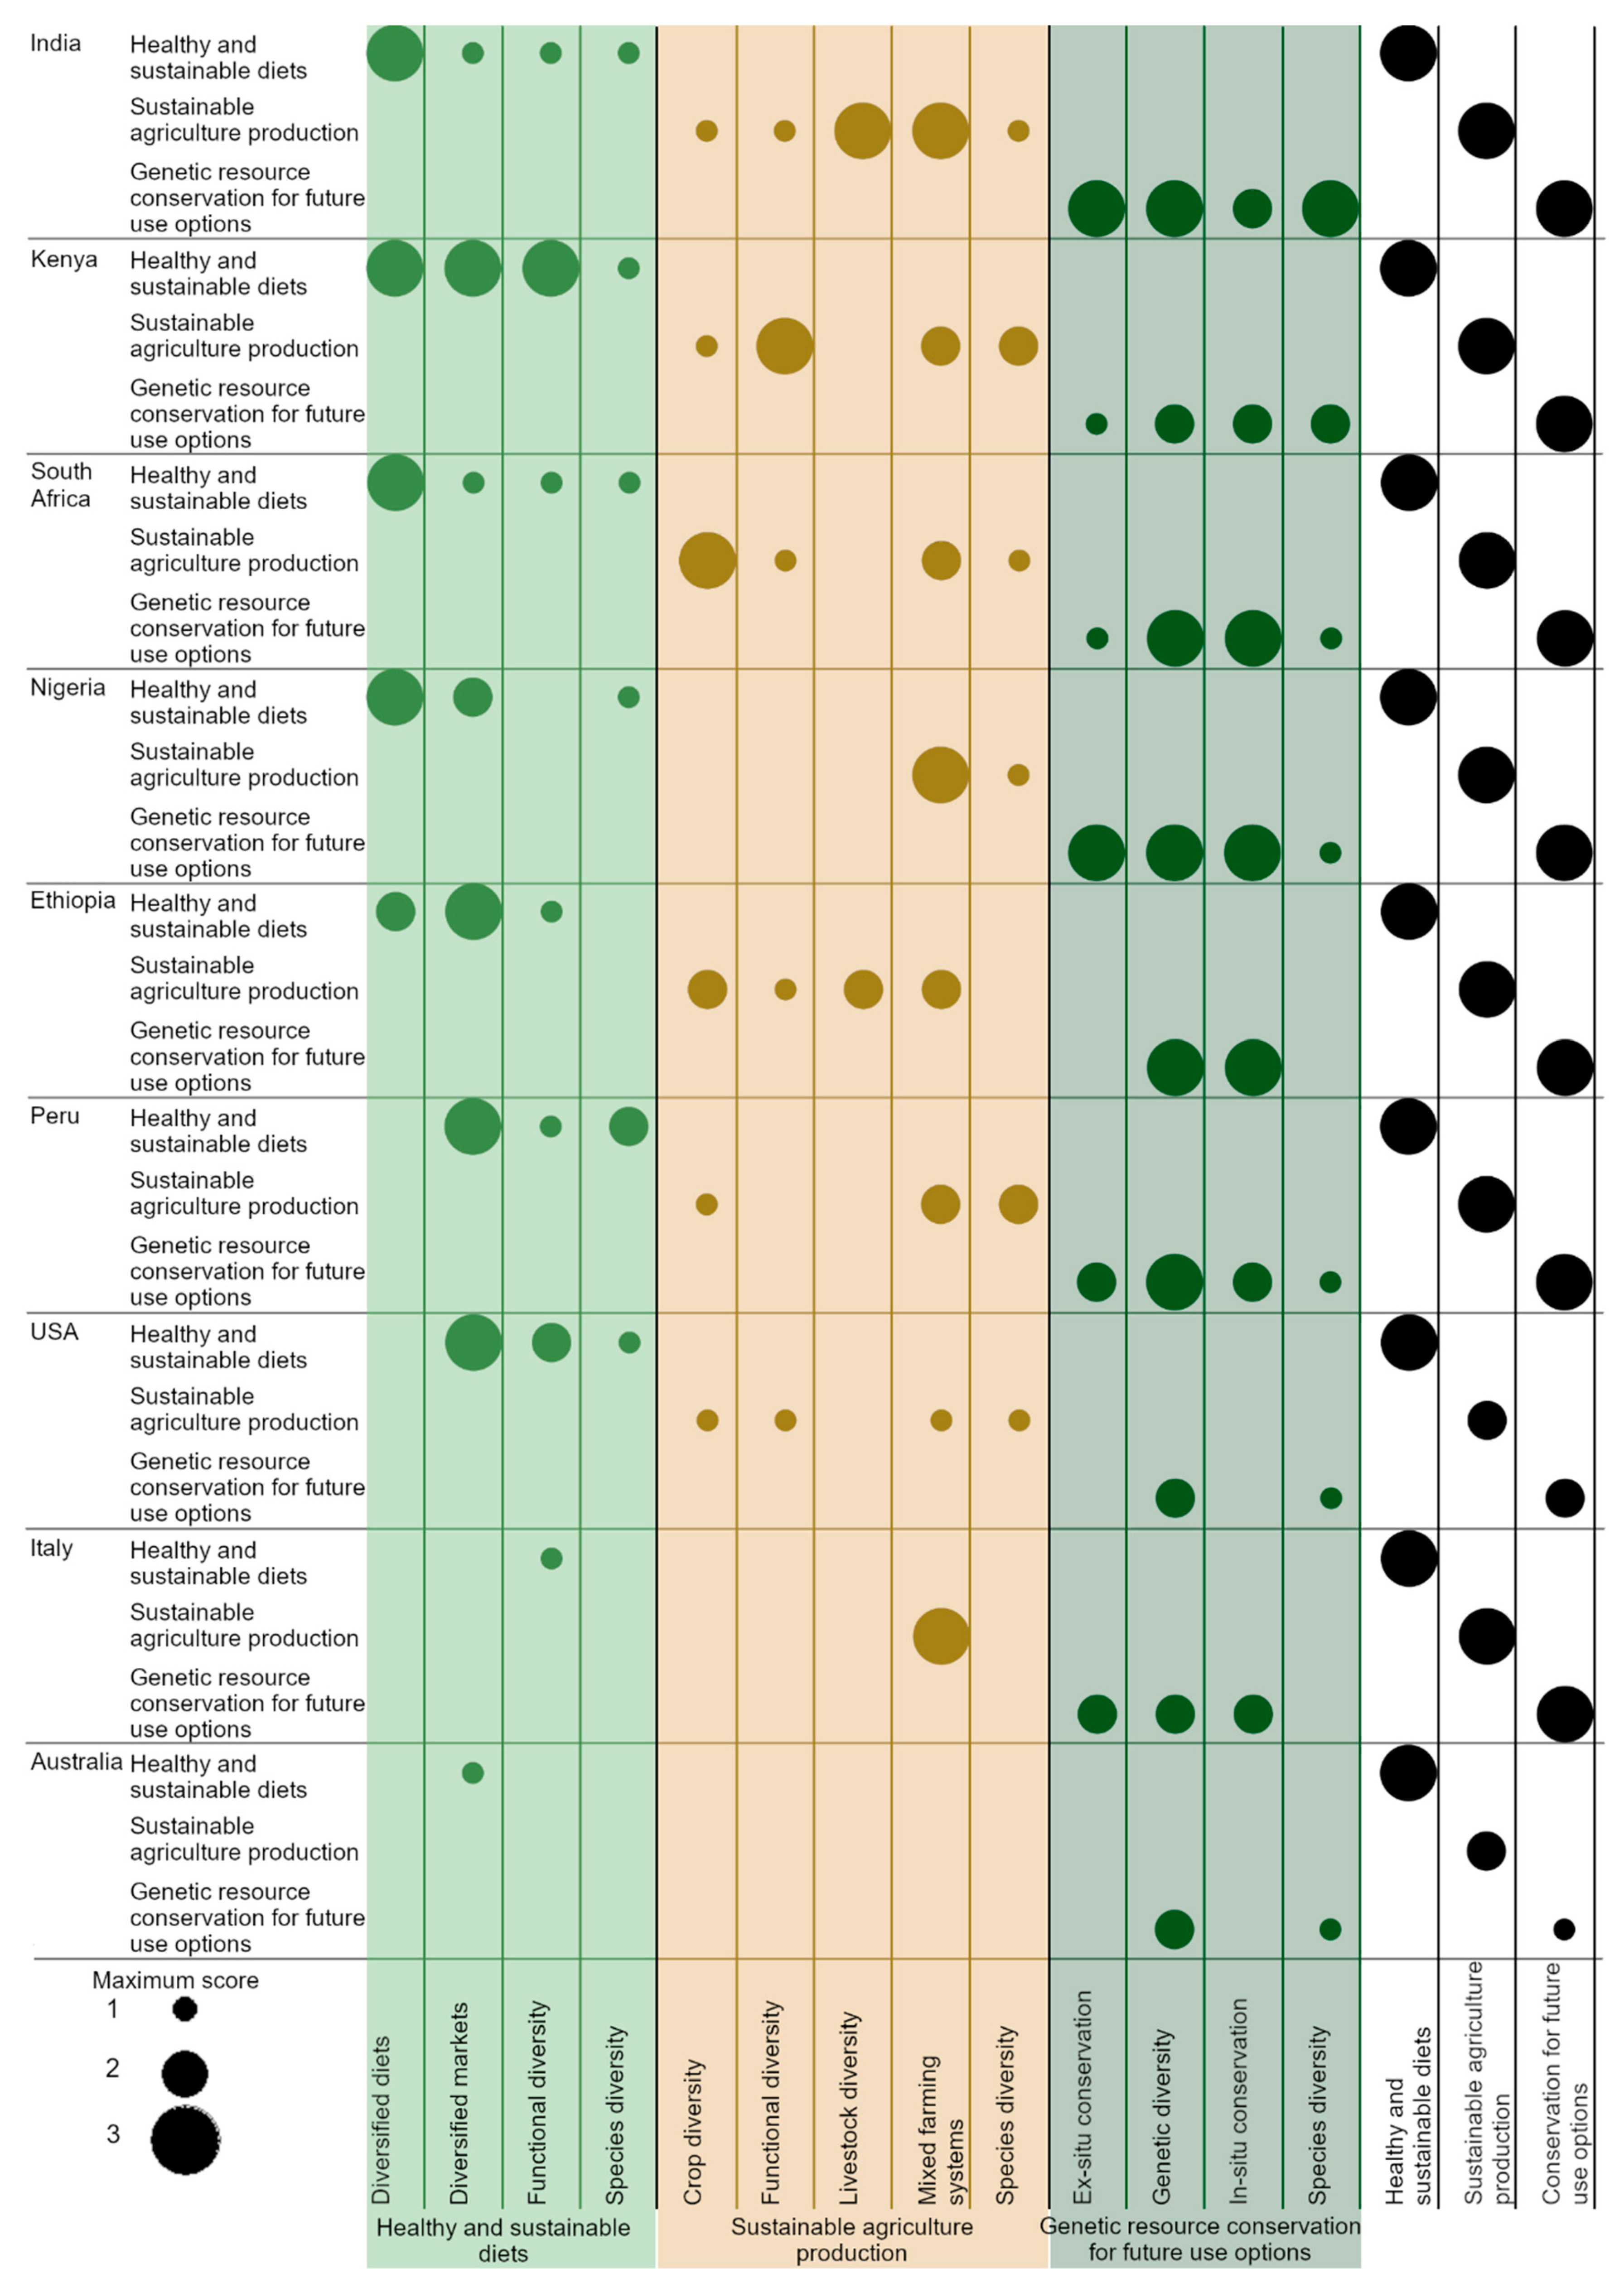
3.2.2. Common Country Strategies towards Agrobiodiversity Conservation and Use

Across the nine countries assessed, India has the highest number of subindicators showing targets (six subindicators score “3”), followed by Nigeria (five subindicators score “3”), South Africa and Kenya (four subindicators score “3”), Ethiopia (three subindicators score “3”), Peru (two subindicators score “3”), USA and Italy (one subindicators score “3”), while Australia has no subindicators scoring “3” (Figure 2 and Table 4 country ranking Model 1). The integration of agrobiodiversity varies across sectors. In most countries, the strongest commitments (i.e., scores “2” and “3”) are in conserving and using agrobiodiversity for genetic resource management and healthy diets, while we found slightly weaker commitment levels relating to agrobiodiversity in agricultural production (Figure 2). Countries have commitments related to 13 out of the 18 specific subindicators, i.e., there are no commitments to a sustainable use or conservation of agrobiodiversity represented by five of the subindicators: varietal diversity (C06, C13, C21), functional diversity (C15), and seed diversity (C19). Some countries, such as Australia, Italy, and the United States, have made commitments to using and conserving relatively few distinct types of agrobiodiversity, while other countries, notably India, Kenya, Ethiopia, Peru, and South Africa are committed to conserving and using a wider range of agrobiodiversity (Figure 2).

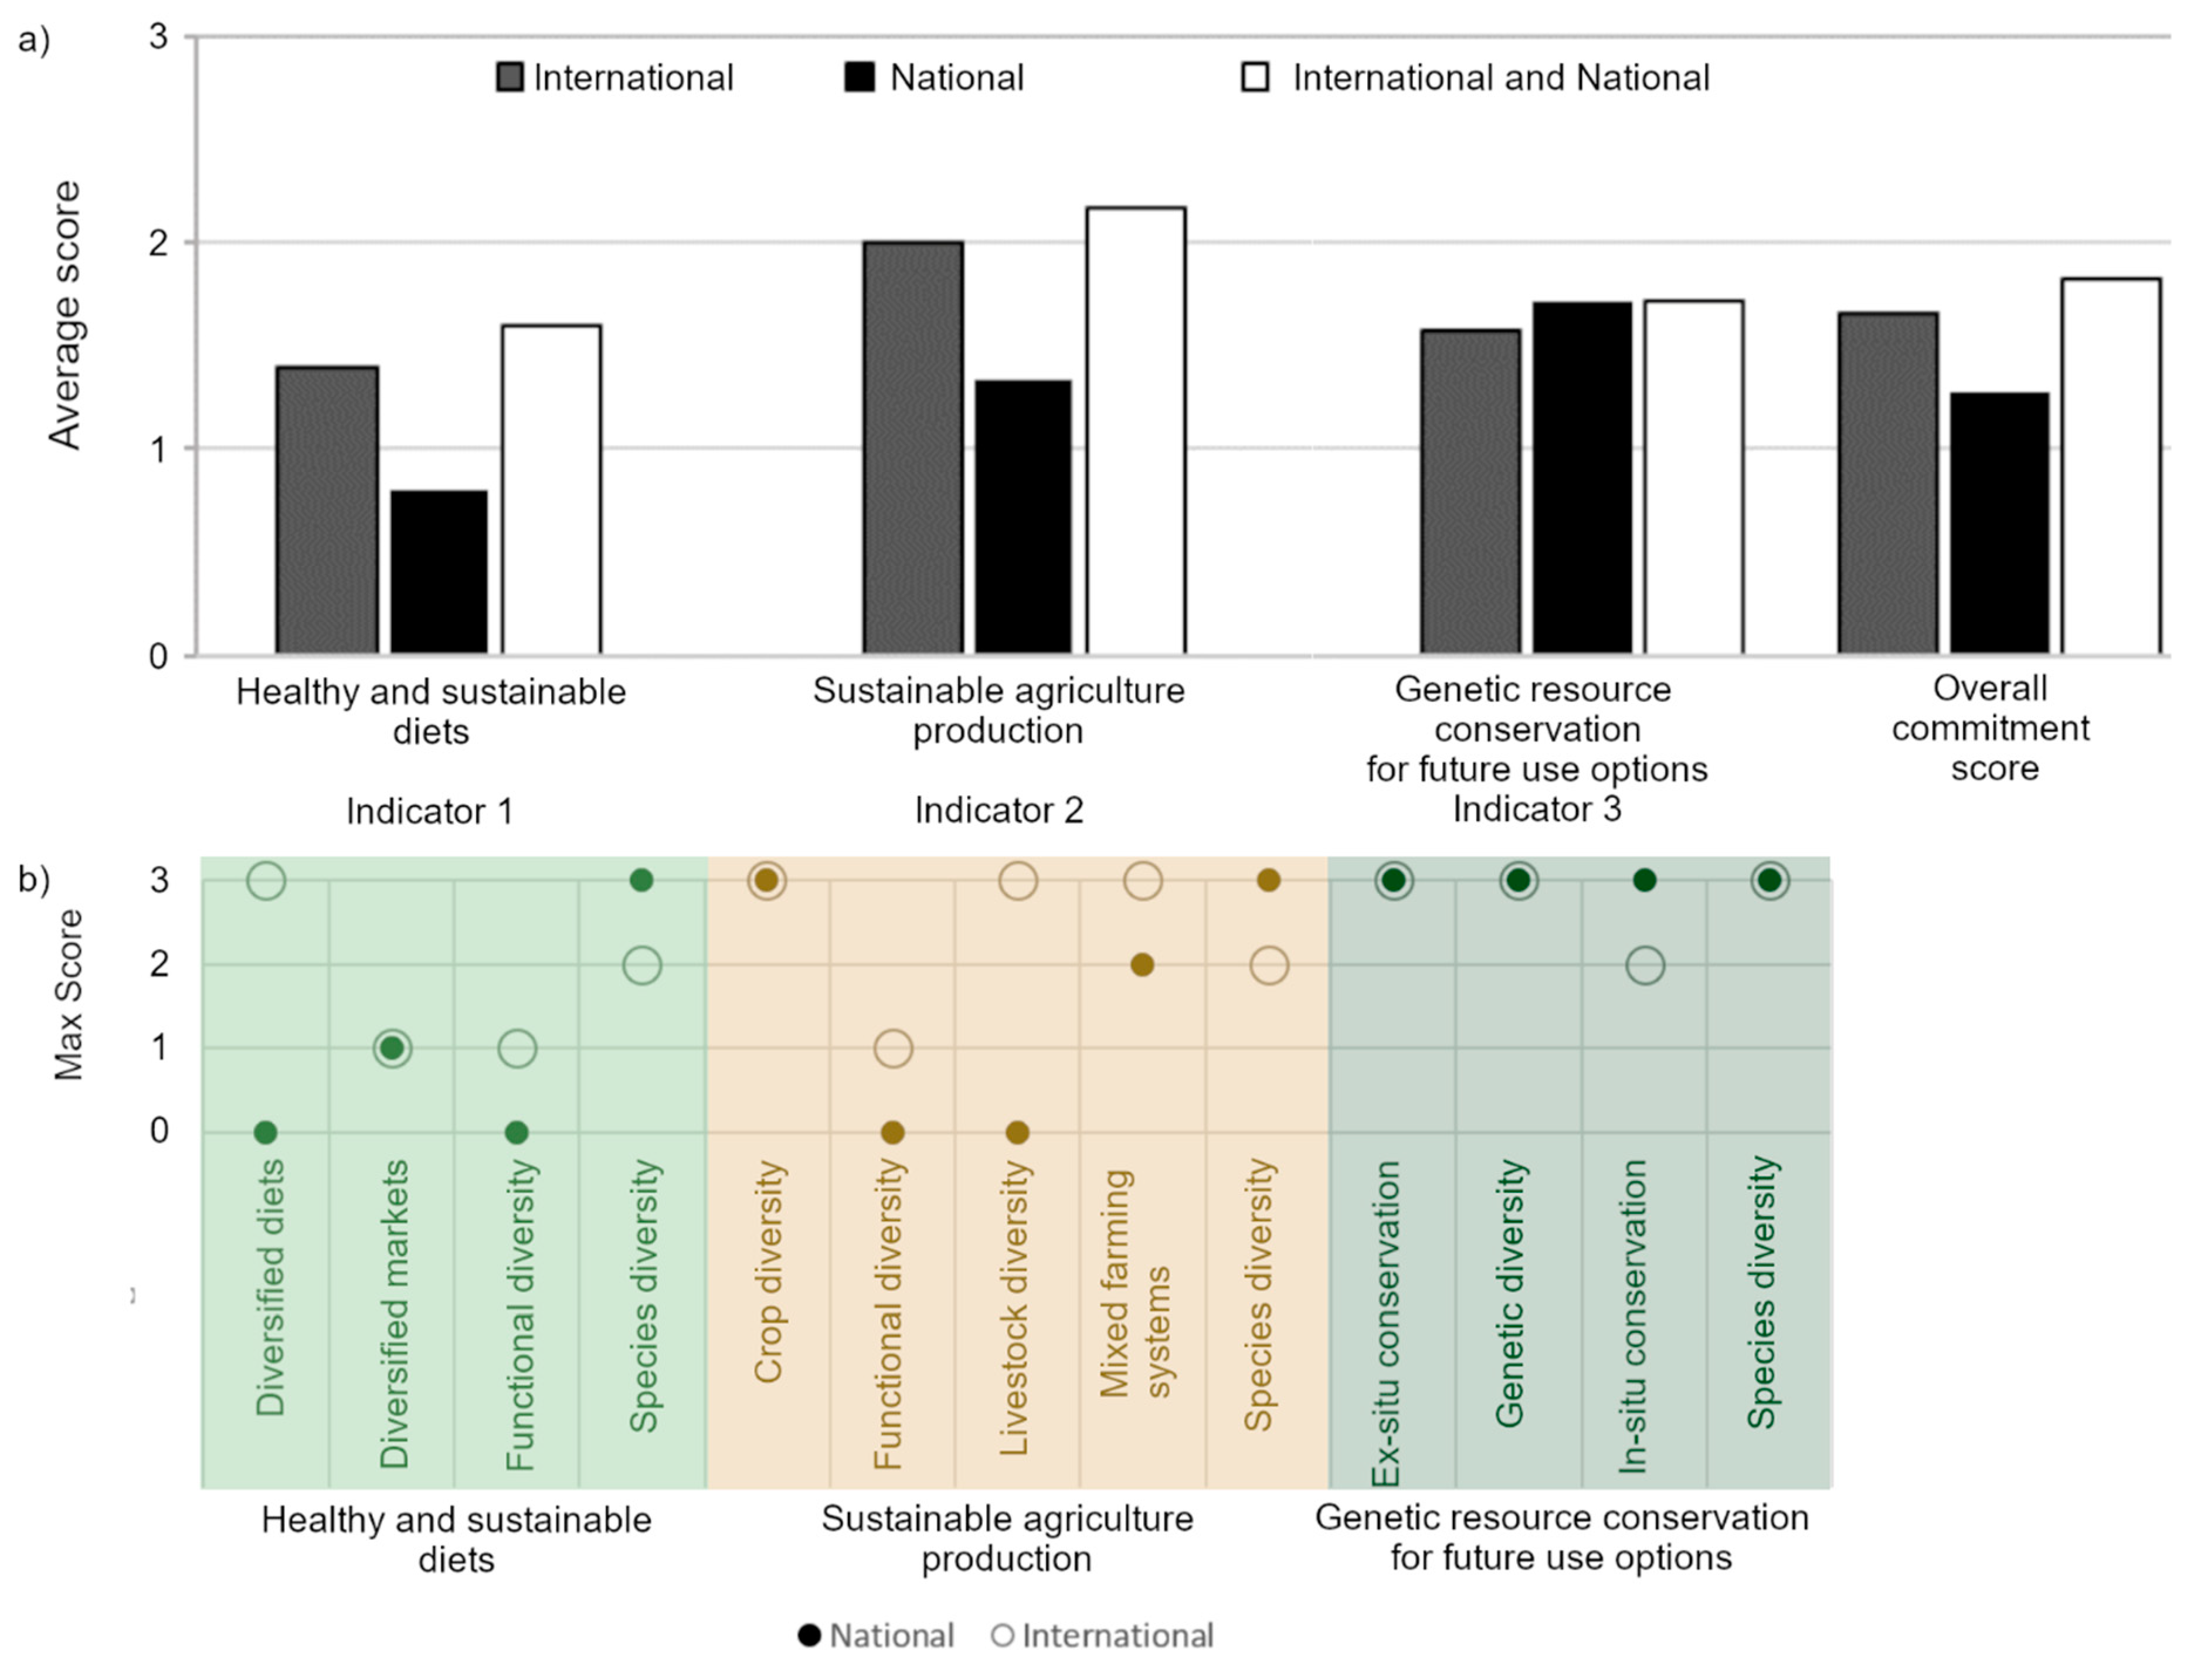
3.3. The Difference between Commitment Scores Based on Documents from International and National Public Policy Repositories (India as In-Depth Case Study)

The search for Indian official documents in international and national public policy repositories in (FAOLEX and GINA, and ministries) yielded 1642 documents in total. Results show that 610 official documents contained a search term group; and 24 out of 63 specific search term groups were found (Figure 3). Complementing the search in FAOLEX and GINA yielded three new search term groups (from 18 to 21) and increased the total number of documents from nine to 19, suggesting that the commitment analysis should retrieve documents using all three types of policy documents (policy, regulation, and legislation) and all search themes available to be of sufficient scope (Figure 3).
In contrast, the search for official documents from the national public policy repositories resulted in fewer search term groups (9), yet it yielded twice as many documents (38). We found a few overlapping documents across the original search, the complementary search in international and national public policy repositories. Four Indian ministries issue official documents found in FAOLEX and GINA: The Ministry of Agriculture and Farmers’ Welfare, the Ministry of Environment, Forests and Climate Change, the Ministry of Law and Justice, and the Ministry of Health and Family Welfare. We were unable to find any official documents from the Ministry of Health and Family Welfare in the search for national public policies.
Commitment scores resulting from documents retrieved from national repositories were lower compared to those from FAOLEX and GINA, despite the larger number of documents found in the national repositories and the low number of overlapping documents. However, the combination of documents retrieved from FAOLEX and GINA with those from national repositories increased the overall commitment score for India (Figure 4a). This is because the “local species” search term group occurred in official documents found in national repositories and resulted in higher commitment scores for subindicator species diversity (indicator 1 and 2), and in-situ conservation (indicator 3), thereby positively contributing to all three indicators and overall score (Figure 4b). Nonetheless, our results suggest that FAOLEX and GINA are a relatively reliable international public policy source to evaluate country commitments, at least for the Indian case.

3.4. Strengths and Weaknesses of the Current Methodology for Scoring a Country’s Commitments and Ranking

Results from Model 1 show that countries’ ranking is divided into two statistically-different groups with Australia belonging to the group with the lowest commitment score and Kenya and India belonging to the group with the highest score (p < 0.005). The rest of the countries are in between the two groups. The country ranking from Model 1 matches the ranking obtained from the average Overall Scores in both, the Agrobiodiversity Index [21] scores and this paper (Figure 2; Table 4). Our findings indicate that the more frequently an agrobiodiversity-related term is used and the larger the number of different policy documents, the more likely a commitment is to be made, thus the tendency to find higher the score (occurrence count and source count correlation with the maximum score per search term group R2 = 0.32 and R2 = 0.52, p < 0.05 respectively, Supplementary Material 4). For instance, Model 2a which is based on the number of search term groups (occurrence count) showed a more similar result with Model 1. In Model 2a, Australia ranked the lowest and Kenya ranked the highest in two well differentiated groups as in Model 1 (Table 4). India, nonetheless, was grouped with Italy, both ranked in the third and fourth position in Model 2a, contrary to Model 1 where Italy is ranked in the eighth position and in a different group (Table 4). The remaining countries fell in the same group, suggesting that Model 2a could broadly group and rank countries, with the large limitation of favouring countries frequently mentioning search term groups with low target or strategies. In contrast, Model 2b based on the number of official documents proved to be a poor predictor of country ranking (Table 4).

4. Discussion

We presented the semiautomated approach used in the Agrobiodiversity Index [20,21] to capture and assess national commitments to agrobiodiversity conservation and use for sustainable food systems, based on national policy documents. We tested the effect of policy document sourcing strategy and subindicator type on national commitment scores for nine countries, and explored options for automating the rank ordering of country commitment levels based on the occurrence of agrobiodiversity-related search terms and on the number of source documents. The results demonstrate: (i) there are significant differences in national agrobiodiversity related commitment levels across the nine countries, with potential implications for attainment of Sustainable Development Goals (SDG) 2, 12, 13, and 15; (ii) global repositories are reliable sources for finding food system-related national policy and strategy documents in the Indian context; (iii) including subnational source documents and overly general search terms in Agrobiodiversity Index commitment assessments is likely to inflate national commitment scores; and (iv) fully automated approaches could be used to broadly rank countries in terms of their commitment levels.

4.1. Cross-Country Results and Implications for Global Policy

India and Kenya were consistently found to have the strongest commitments to agrobiodiversity use and conservation for sustainable food systems using the Agrobiodiversity Index methodology [21] or the approach applied in this paper, while Australia had the weakest. This has implications for national and global policy. For example, while Australia has made commitments of varying strength to achieving food-system sustainability, it has made very few commitments on harnessing agrobiodiversity to achieve these aims according to our results. This represents a missed opportunity to utilize food-system diversity to meet malnutrition targets under SDG 2, sustainable production targets under SDG 2 and 12, and conservation targets to help meet SDG 13 and 15. In contrast, India has made strong commitments to using and conserving agrobiodiversity across all three pillars in the Agrobiodiversity Index. India is thus much more likely to use the full potential of agrobiodiversity across the SDGs.
The Agrobiodiversity Index’s text-mining approach could easily be adapted to assess national commitments to meet other global policy agendas, such as cutting carbon emissions (SDG 13), ensuring safe water access (SDG 6), achieving gender equality (SDG 5) and ending poverty (SDG 1). This could facilitate the identification of potential policy trade-offs and complementarities across the different dimensions of the SDGs and help policymakers prioritise policy interventions [33].

4.2. Policy Sourcing Strategies

Verification of results using the Indian case showed that in general, FAOLEX and GINA may serve as better repositories than national public policy repositories for identifying agrobiodiversity relevant policies. There are three main reasons for this, mainly related to practicality and effectiveness. First, the complexity of the structure of national repositories (i.e., ministries’ webpages) considerably limits the automatization of the document extraction process before the text mining can be performed. For instance, the webpage structure for each ministry differs, and official documents that are linked to commitments may be stored under different tabs (e.g., “Acts and Rules” for the Ministry of Environment, Forest and Climate Change and “Programmes and Schemes” for the Ministry of Agriculture and Farmers’ Welfare). This may have increased the risk of missing relevant documents and could explain the absence of documents issued by the Ministry of Health and Family Welfare in the ministries’ webpages search. Second, there is a much higher number of non-official documents found on ministries’ webpages than in FAOLEX and GINA. In the case of India, the search retrieved documents such as reports, meeting minutes, and working groups discussions, requiring extra time to sort and select potentially relevant documents. Therefore, the process of manually checking the documents to exclude non-official and subnational documents and to accurately count the number of sources due to (spelling) errors in document titles is a limitation and could be time-consuming. Third, fewer search term groups were captured from documents retrieved from the ministries’ webpages than from those retrieved from FAOLEX and GINA. This largely explains the lower indicator-level commitment scores calculated based on documents in national repositories, except for indicator 3 on Current and Future Options Use. The higher scores associated with documents retrieved from the combined search of FAOLEX, GINA, and national repositories highlight the importance of countries playing an active role by reporting to international public policy repositories. Adding national public policy repositories on top of FAOLEX and GINA would not be feasible given the constraints mentioned above. As such, though we have verified that FAOLEX and GINA are the most appropriate public policy repositories, the commitment scores still depend, to a large extent, on individual countries’ efforts to report their legislations and strategies to international public policy repositories.

4.3. Importance of Search Term and Data Selection

National commitments to agrobiodiversity use and conservation are likely to change through time, in accordance with the (increasing) global efforts to meet the SDGs and Aichi Biodiversity Targets or other goals. The initial list of search terms used in any text-mining effort is key in determining the success of the methodology in terms of recall performance and precision [34]. The list of search terms used in the Agrobiodiversity Index [21] was the result of an iterative process of numerous formal and informal discussions with stakeholders from public and private institutions [20]. However, 55% of search term groups were still not used by any of the nine countries studied. We recommend future analyses explore whether this is indeed due to lack of commitments by the target countries, or inefficiency of these search term groups in capturing relevant commitments. For example, search term groups may be inefficient if they are too complex (e.g., “nutritious and sufficient food,” “erosion of crop genetic diversity”) or if there is a mismatch between science and policy terminology. Analyses of multi-word terms, and their syntactic and semantic relationships could be conducted using the co-occurrence matrix in the Natural Language Processing (NLP) technique through powerful prediction models, such as GloVe: Global Vectors for Word Representation [35].
Removing general search terms as classified in [21], and removing subnational documents from the data sources, resulted in a country commitment ranking that was very similar to when these terms and documents were retained. However, commitment scores were significantly lower. This implies that retaining these documents and search terms inflates country commitment scores which could be misleading and delay action to introduce policy interventions in areas that lag behind. We, therefore, recommend that general search terms and subnational documents are removed from future national level Agrobiodiversity Index assessments.
Other improvements could include weighting commitment scores based on the type and level of the policy containing the commitment in the national hierarchy, to capture commitments included in mainstream versus marginal policy. However, understanding the policy hierarchy across countries could be challenging.

4.4. Semi and Fully Automated Methodologies

Using text mining compared to solely manual methods offers a major advantage—the reduction in time required to conduct the analysis. Policy commitment studies are often limited to relatively small subsets of countries (e.g., 2012 Climate Action Tracker Country Assessment [36]; 2013 GLOBE Study [37]). Searching manually for agrobiodiversity related terms through all potentially relevant official documents available in a country would be very time-intensive and prone to human error. The application of text mining allows for a rapid systematic and comprehensive exploration of a large amount of unstructured text-based sources [38]. The Agrobiodiversity Index method for determining commitment levels, from retrieving official documents to assigning scores to individual sentences, can be applied to a single country in a comparatively short period of time. Nonetheless, the methodology is highly dependent on the judgment and scoring of the trained analyst(s) for properly scoring the identified search terms. Hence, while semiautomated approaches offer high potential, peer-verification, double-entry and putting in place strategies to detect errors in the manual scoring component are mechanisms that should go in tandem with the scoring process to help prevent human-induced error [39].
The method for assessing commitment levels used in the Agrobiodiversity Index and adapted in this paper could also be applied at subnational levels if suitable documents can be identified, which is of high relevance in federate countries. The approach is highly scalable and could be readily applied to support monitoring progress in other sectors, such as for tracking progress towards achieving climate change targets or the SDGs. The scalability will further improve in time with advances in artificial intelligence to text mine and potentially even score the extracted paragraphs. The incorporation of text mining for national commitment analysis into other global indices would allow for a more holistic assessment of countries’ performances.
Finally, our paper shows fully automated approaches to commitment scoring based on search term occurrences, can broadly rank countries in terms of their general commitment levels. Further research is needed to verify whether this result holds when a greater number of countries are included in the analysis. However, it potentially offers a powerful approach for rapidly assessing country commitments around the globe on a repeat-basis based on openly accessible data sources, provided language barriers in text-mining applications can be overcome [40] notably for Chinese characters [41]. Developing national-level, globally applicable measures such as these is critical for tracking national progress on SDG attainment and stimulating business buy-in [42].

5. Conclusions

Effective monitoring tools are critical to policy learning and improvements. We presented the novel text mining methodology used in the Agrobiodiversity Index, the calculated commitments scores for nine countries, and methodological improvements. We demonstrated that integrating text-mining and manual scoring is a relatively rapid approach to evaluating national agrobiodiversity-related commitments across hundreds of source documents. The approach is readily transferable to other policy domains. The semiautomated approach identifies targets and strategies reflected in official national documents, providing a low-cost, remotely applicable, rapid alternative to field-based data collection and together with a more holistic assessment of a country’s performance. The study provide an overview of countries’ strategies and their levels of commitment which vary significantly between the nine countries, covering a wide range of regions. Using the one in-depth case of India, our results suggest that FAOLEX and GINA are a relatively reliable international public policy repositories for the purposes of evaluating country commitments. The study shows that a larger number of search term occurrences and document sources tend to result in higher commitment scores (e.g., ‘strategy’, ‘target’). Nonetheless, none of both factors can be used alone to predict countries ranking appropriately, depending therefore on the judgment and scoring of the trained analyst(s).
The three main Agrobiodiversity Index methodological improvement tested here included using (1) only national-level official documents, (2) specific subindicators, and (3) wider policy types and search terms when retrieving the documents from international public policy repository. We cannot unequivocally state that addressing the three changes increases the accuracy of the overall score, but it does increase the clarity and robustness for estimating overall scores across countries. The methodology presented here for measuring countries’ commitments towards using and preserving agrobiodiversity is flexible and can be further developed and applied across the world and policy domains. However, the applicability depends on the availability of policies and strategies documents that are made available in international public policy repositories—FAOLEX and GINA in this case. Therefore, countries’ policy sharing in these repositories is encouraged to allow for a more complete assessment of performance and collective progress across countries.

Supplementary Materials

The following are available online at https://www.mdpi.com/2071-1050/12/2/715/s1, Supplementary Material 1: Search term group and search term list. Supplementary Material 2: Overall commitment score calculated with various measurements of central tendency. Supplementary Material 3: Scoring based on national policies and strategy documents and specific subindicators only. Supplementary Material 4: Distribution and correlation between occurrence count, source count, and maximum score per search term group across nine case study countries using specific subindicators and national policies. Supplementary Material 5: Model 1, 2a, and 2b model-predicted response variables, standard error, and significance test.

Author Contributions

Conceptualization, N.E.-C., S.K.J., R.R., and S.D.J.; methodology, S.K.J., M.-A.L., S.D.J., N.E.-C. and R.R., data collection, S.D.J., S.K.J., M.-A.L. and C.V.; formal analysis, S.D.J., M.-A.L., N.E.-C. and S.K.J.; writing—original draft preparation, S.D.J.; writing—review and editing, all authors. All authors have read and agreed to the published version of the manuscript.

Funding

This project was financially supported by the European Commission (FOOD/2016/378-156 and FOOD/2017/391-245) and the Italian Development Cooperation.

Acknowledgments

We thank Catalina Rodriguez and Mateo Garzón Rivera for research support and implementation at the start of the Agrobiodiversity Index commitment measurement phase. We are grateful to the entire Agrobiodiversity Index team and collaborators for thoughtful discussions that helped shape the paper. We also extend our gratitude to scientists from The Indian Council of Agricultural Research who provided critical feedback on the Agrobiodiversity Index during a workshop held in NASC Complex, New Delhi, 15–16 April 2019. We thank the reviewers for their insightful and constructive comments to improving the manuscript. We thank Vincent Johnson (Bioversity International Science Writing Service) for English and technical editing of this paper.

Conflicts of Interest

The authors declare no conflict of interest. The funders had no role in the design of the study; in the collection, analyses, or interpretation of data; in the writing of the manuscript, or in the decision to publish the results.

References

  1. Lu, Y.; Nakicenovic, N.; Visbeck, M.; Stevance, A.-S. Policy: Five priorities for the UN sustainable development goals. Nat. News 2015, 520, 432. [Google Scholar] [CrossRef] [Green Version]
  2. Moldan, B.; Janoušková, S.; Hák, T. How to understand and measure environmental sustainability: Indicators and targets. Ecol. Indic. 2012, 17, 4–13. [Google Scholar] [CrossRef]
  3. Nardo, M.; Saisana, M.; Saltelli, A.; Tarantola, S.; Hoffman, A.; Giovannini, E. Handbook on Constructing Composite Indicators: Methodology and User Guide; In OECD Statistics Working Paper, No. 2005/03; OECD Publishing: Paris, France, 2015. [Google Scholar] [CrossRef]
  4. Wendling, Z.A.; Emerson, J.W.; Esty, D.C.; Levy, M.A.; de Sherbinin, A. 2018 Environmental Performance Index; Yale Center for Environmental Law Policy: New Haven, CT, USA, 2018; Available online: https://epi.yale.edu/ (accessed on 19 October 2019).
  5. Equal Measures 2030. Harnessing the Power of Data for Gender Equality: Introducing the 2019 EM2030 SDG Gender Index; Plan International USA: Washington, DC, USA, 2019. [Google Scholar]
  6. Schmidt-Traub, G.; Kroll, C.; Teksoz, K.; Durand-Delacre, D.; Sachs, J.D. National baselines for the Sustainable Development Goals assessed in the SDG Index and Dashboards. Nat. Geosci. 2017, 10, 547. [Google Scholar] [CrossRef]
  7. Halpern, B.S.; Longo, C.; Hardy, D.; McLeod, K.L.; Samhouri, J.F.; Katona, S.K.; Lester, S.E.; O’Leary, J.; Ranelletti, M.; Rosenberg, A.A.; et al. An index to assess the health and benefits of the global ocean. Nature 2012, 488, 615. [Google Scholar] [CrossRef] [PubMed] [Green Version]
  8. IAEG-SDGs. Update on the Work to Finalize the Proposals for the Global Indicators. 2016. Available online: https://unstats.un.org/unsd/statcom/47th-session/documents/BG-3-Update-finalize-proposals-for-SDG-global-indicators-E.pdf (accessed on 19 October 2019).
  9. UNDP. Human Development Indices and Indicators 2018: Statistical Update; UN: New York, NY, USA, 2018. [Google Scholar] [CrossRef]
  10. Pierson, P. When Effect Becomes Cause: Policy Feedback and Political Change. World Politics 1993, 45, 595–628. [Google Scholar] [CrossRef]
  11. Stoate, C.; Boatman, N.D.; Borralho, R.J.; Carvalho, C.R.; De Snoo, G.R.; Eden, P. Ecological impacts of arable intensification in Europe. J. Environ. Manag. 2001. [Google Scholar] [CrossRef] [PubMed]
  12. Chaix, E.; Deléger, L.; Bossy, R.; Nédellec, C. Text mining tools for extracting information about microbial biodiversity in food. Food Microbiol. 2019, 81, 63–75. [Google Scholar] [CrossRef]
  13. Salloum, S.A.; Shaalan, K.; Al-Emran, M.; Monem, A.A. Using text mining techniques for extracting information from research articles. In Intelligent Natural Language Processing: Trends and Applications; Springer: Cham, Switzerland, 2018; Volume 740, pp. 373–397. [Google Scholar] [CrossRef]
  14. Aureli, S. A comparison of content analysis usage and text mining in CSR corporate disclosure. Int. J. Digit. Account. Res. 2017, 17, 1–32. [Google Scholar] [CrossRef] [Green Version]
  15. Nunez-Mir, G.C.; Iannone, B.V.; Pijanowski, B.C.; Kong, N.; Fei, S. Automated content analysis: Addressing the big literature challenge in ecology and evolution. Methods Ecol. Evol. 2016, 7, 1262–1272. [Google Scholar] [CrossRef] [Green Version]
  16. Tamames, J.; de Lorenzo, V. EnvMine: A text-mining system for the automatic extraction of contextual information. Bmc Bioinform. 2010, 11, 294. [Google Scholar] [CrossRef] [Green Version]
  17. Tobback, E.; Naudts, H.; Daelemans, W.; Junqué de Fortuny, E.; Martens, D. Belgian economic policy uncertainty index: Improvement through text mining. Int. J. Forecast. 2018, 34, 355–365. [Google Scholar] [CrossRef]
  18. Westergaard, D.; Stærfeldt, H.H.; Tønsberg, C.; Jensen, L.J.; Brunak, S. A comprehensive and quantitative comparison of text-mining in 15 million full-text articles versus their corresponding abstracts. PLoS Comput. Biol. 2018, 14, e1005962. [Google Scholar] [CrossRef] [PubMed] [Green Version]
  19. Bioversity International. Mainstreaming Agrobiodiversity in Sustainable Food Systems: Scientific Foundations for an Agrobiodiversity Index; Bioversity International: Rome, Italy, 2017. [Google Scholar]
  20. Bioversity International. The Agrobiodiversity Index: Methodology Report v.1.0. 2018. Available online: https://hdl.handle.net/10568/106478 (accessed on 19 October 2019).
  21. Bioversity International. Agrobiodiversity Index Report 2019: Risk and Resilience. 2019. Available online: https://hdl.handle.net/10568/100820 (accessed on 19 October 2019).
  22. Dubash, N.K.; Hagemann, M.; Höhne, N.; Upadhyaya, P. Developments in national climate change mitigation legislation and strategy. Clim. Policy 2013, 13, 649–664. [Google Scholar] [CrossRef] [Green Version]
  23. GINA. Global Database on the Implementation of Nutrition Action (GINA). 2018. Available online: https://www.who.int/nutrition/gina/en/ (accessed on 19 October 2019).
  24. FAOLEX. FAOLEX Database. 2018. Available online: https://www.fao.org/faolex/en/ (accessed on 19 October 2019).
  25. Glyph & Cog, L.L.C. 2019. Available online: https://www.xpdfreader.com/pdftotext-man.html (accessed on 19 October 2019).
  26. Dean, M. 2014. Available online: https://github.com/deanmalmgren/textract (accessed on 19 October 2019).
  27. Bird, S.; Klein, E.; Loper, E. Natural Language Processing with Python: Analyzing Text with the Natural Language Toolkit; O’Reilly Media, Inc.: Sebastopol, CA, USA, 2009. [Google Scholar]
  28. Lewis, J.R. Multipoint scales: Mean and median differences and observed significance levels. Int. J. Hum. Comput. Interact. 1993, 5, 383–392. [Google Scholar] [CrossRef]
  29. R Core Team. R: A Language and Environment for Statistical Computing; R Foundation for Statistical Computing: Vienna, Austria, 2018; Available online: https://www.R-project.org/ (accessed on 19 October 2019).
  30. Christensen, R.H.B. Ordinal—Regression Models for Ordinal Data. R Package Version, 28,8-25. 2018. Available online: https://www.cran.r-project.org/package=ordinal/ (accessed on 19 October 2019).
  31. Lenth, R.V. Least-squares means: The R package lsmeans. J. Stat. Softw. 2016, 69, 1–33. [Google Scholar] [CrossRef] [Green Version]
  32. O’hara, R.B.; Kotze, D.J. Do not log-transform count data. Methods Ecol. Evol. 2010, 1, 118–122. [Google Scholar] [CrossRef] [Green Version]
  33. Barbier, E.B.; Burgess, J.C. Sustainable development goal indicators: Analyzing trade-offs and complementarities. World Dev. 2019, 122, 295–305. [Google Scholar] [CrossRef]
  34. Salton, G.; Yang, C.S. On the Specification of Term Values in Automatic Indexing. J. Doc. 1973, 29, 351–372. [Google Scholar] [CrossRef] [Green Version]
  35. Pennington, J.; Socher, R.; Manning, C. Glove: Global vectors for word representation. In Proceedings of the 2014 Conference on Empirical Methods in Natural Language Processing (EMNLP); Association for Computational Linguistics: Doha, Qatar, 2014; pp. 1532–1543. [Google Scholar]
  36. Höhne, N.E.; Braun, N.; Fekete, H.; Larkin, J.; Elzen, M.; Roelfsema, M.; van’t, H.A.; Böttcher, H. Greenhouse Gas Emission Reduction Proposals and National Climate Policies of Major Economies: Policy Brief; Netherlands Environmental Assessment Agency, Bilthoven and ECOFYS: Utrecht, The Netherlands, 2012. [Google Scholar]
  37. Globe International. Climate Legislation Study: A Review of Climate Change Legislation in 33 Countries, 3rd ed.; Townshend, T., Fankhauser, S., Aybar, R., Collins, M., Landesman, T., Nachmany, M., Pavese, C., Eds.; Globe International: Melbourne, Australia, 2013; Available online: https://www.businessgreen.com/digital_assets/6235/3rd_GLOBE_Report_--_with_covers.pdf (accessed on 19 October 2019).
  38. Bayrak, T. A content analysis of top-ranked universities’ mission statements from five global regions. Int. J. Educ. Dev. 2020, 72, 102–130. [Google Scholar] [CrossRef]
  39. Barchard, K.A.; Pace, L.A. Preventing human error: The impact of data entry methods on data accuracy and statistical results. Comput. Hum. Behav. 2011, 27, 1834–1839. [Google Scholar] [CrossRef]
  40. Neri, F.; Raffaelli, R. Text Mining Applied to Multilingual Corpora. In Knowledge Mining; Springer: Berlin/Heidelberg, Germany, 2005; pp. 123–131. Available online: https://link.springer.com/chapter/10.1007/3-540-32394-5_9#citeas (accessed on 19 October 2019).
  41. Deng, K.; Bol, P.; Li, K.J.; Lui, J. On the unsupervised analysis of domain-specific Chinese texts. Proc. Natl. Sci. Acad. USA 2016, 113, 6154–6159. [Google Scholar] [CrossRef] [PubMed] [Green Version]
  42. Muff, K.; Kapalka, A.; Dyllick, T. The Gap Frame—Translating the SDGs into relevant national grand challenges for strategic business opportunities. Int. J. Manag. Educ. 2017, 15, 363–383. [Google Scholar] [CrossRef]
Figure 1. The cumulative number of occurrences of specific search term groups per indicator across the nine countries based on the 1194 official documents collected from the FAOLEX and GINA in November 2018. Colour represents occurrence count in the respective country. Supplementary Material 1 provides the complete list of search terms and search term groups in each subindicator.
Sustainability 12 00715 g001
Figure 2. Country rank based on the score calculations in this paper using the maximum score achieved across all search terms in each specific subindicator per each country and official national documents. The text mining found zero match for search terms associated with the subindicators varietal diversity (indicator 1, 2, and 3) functional diversity (indicator 3) and seed diversity (indicator 3). The light green, orange, and dark green scores indicate the subindicators per indicators used for the ranking. Maximum scores reported for general subindicators and excluded from the ranking are displayed in the three right-side columns.
Sustainability 12 00715 g002
Figure 3. Flow diagram illustrating database repositories and the corresponding number of documents (Ndoc) that contain general (grey box) and specific (light grey box) search term groups with their respective number of search term groups (Nswg) and number of ministries issuing the respective official documents (Nmin). Dashed and solid box lines represent the methodologies used in the Agrobiodiversity Index report [21] and in this study.
Sustainability 12 00715 g003
Figure 4. Overall and subindicator scores for the Indian case study. (a) Commitment scores across the three indicators and the overall score calculated based on official documents retrieved from international public policy repositories (i.e., FAOLEX and GINA) (grey), national public policy repositories (black), or both sources combined (white). (b) The maximum score achieved across all search terms relating to each subindicator using international and national public repositories.
Sustainability 12 00715 g004
Table 1. Commitment indicators (3), subindicators (21) and number of search term groups and search terms associated with each subindicator used in the text mining. The full list is provided in Supplementary Material 1.
Indicators and Subindicators (Subindicator Code)Search Term GroupsSearch Terms
Pillar 1-Indicator 1: Level of commitment to enhancing Agrobiodiversity in consumption and markets for healthy diets5271
General subindicator
Healthy and sustainable diets (C04)
3538
Specific subindicators
Diversified diets (C01)
311
Diversified markets (C02)1018
Functional diversity (C03)22
Species diversity (C05)11
Varietal diversity (C06)11
Pillar 2-Indicator 2: Level of commitment to enhancing production and maintenance of Agrobiodiversity for sustainable agriculture78105
General subindicator
Sustainable agricultural production (C12)
5870
Specific subindicators
Crop diversity (C07)
512
Functional diversity (C08)22
Livestock diversity (C09)14
Mixed farming systems (C10)1015
Species diversity (C11)11
Varietal diversity (C13)11
Pillar 3-Indicator 3: Level of commitment to enhancing Agrobiodiversity genetic resource management for conservation and use options93126
General subindicator
Genetic resource conservation for current and future use options (C17)
5975
Specific subindicators
Ex-situ conservation (C14)
34
Functional diversity (C15)11
Genetic diversity (C16)1927
In-situ conservation (C18)12
Seed diversity (C19)815
Species diversity (C20)11
Varietal diversity (C21)11
Total215302
Source: Adapted from the Agrobiodiversity Index [20] (reproduced with permission).
Table 2. Scoring guidelines used in the Agrobiodiversity Index to assess the level of commitment to agrobiodiversity use and conservation when an agrobiodiversity-related search term is identified in a policy document [20].
ClassificationDefinitionExamples of Where This OccursScore
Not applicableThe search term occurs while referring to an external body or document.References, external company profiles, staff profiles.0
MentionThe search term is included as part of a description of country or company commitments, but there is no information about strategies or targets related to the search term.Background information, facts, introduction text, recommendations, support information, studies, procedures, responsibilities of stakeholders, table of contents, headings.1
StrategyThe search term is included as part of a description of country or company commitments, and there is a specific strategy related to the search term.Strategic goals, objectives, strategy statements. When the structure of the sentence includes the following, to promote, to support, to improve, to accelerate, e.g., “Improve household dietary diversity knowledge and practice of farmers”.2
TargetThe search term is included as part of a description of country or company commitments, and there is a specific target related to the search term, usually with a time-bound threshold that needs to be met.Percentages (%), specific indicator and/or output to be attained.
E.g., “10% more households have increased household dietary diversity by 2030”.
3
Source: From the Agrobiodiversity Index [20] (reproduced with permission).
Table 3. Differences between the Agrobiodiversity Index [20,21] and the commitment scores presented in this research for all nine and the case study.
CountriesCriteriaAgrobiodiversity Index [20,21]This paper
All nineScored subindicatorsGeneral and SpecificSpecific
All nineUnit of analysis302 Search terms302 Search terms and 215 search term groups
All ninePolicies includedNational and Subnational
Official and non-official
National
Official
All nineOverall scores, country rankAverageAverage, Model 1 and Model 2
IndiaPolicy typePolicy, LegislationPolicy, Legislation, Regulation
IndiaPolicy search themesAgricultural and rural development
Cultivated plants
Environment
Food and nutrition
Agricultural and rural development
Cultivated plants
Environment
Food and nutrition
Fisheries and aquaculture
Forestry
Land and soil
Livestock
Mineral resources and energy
Sea
Water
Wild species and ecosystems
IndiaPublic policy repositoriesInternationalInternational vs. national
Table 4. Countries’ scores, ranking and ranking differences on the national commitments towards agrobiodiversity conservation and use. The Overall commitment score calculated in this paper differs from the Agrobiodiversity Index [21] since it only considers specific subindicators from official national documents (see Table 3). Model 1 estimates countries’ ranking based on the 18 subindicator scores, whereas Model 2 estimates countries’ ranking by only using the number of search terms in each subindicator—occurrence count (Model 2a), or the number of unique data sources per subindicator—source count (Model 2b). The colour gradient in the ‘Rank’ columns illustrates the country ranking from green (highest) to yellow (lowest). The same letters in the ‘Group’ columns show no significant difference in overall commitment scores between countries using Tukey honestly significant difference (HSD), p < 0.05 at 0.95 confidence level. p-values were derived from Type II Wald chi-square tests (see Supplementary Material 5 for more details).
Agrobiodiversity Index [21]Scores and Ranking Estimated in This Paper
CountyModel 1Model 2aModel 2b
Overall ScoresRankOverall ScoresRankRankGroupRankGroupRankGroup
India1.6711.4411a2ab4ab
Kenya1.6221.3922a1a1a
South Africa1.4331.1733ab5abc3ab
Nigeria1.3841.1145ab4abc6ab
Ethiopia1.3351.0656ab7abc7ab
Peru1.3361.0664ab6abc2ab
Italy1.0070.5688ab3ab5ab
USA0.9580.7277ab8bc8ab
Australia0.4890.2299c9c9b

