Article

Multidimensional Poverty among Female Householders in Korea: Application of a Latent Class Model

Department of Home Economics Education, College of Education; Jeonju University, Jeonju 560-759, Korea
Sustainability 2020, 12(2), 701; https://doi.org/10.3390/su12020701
Submission received: 21 November 2019 / Revised: 8 January 2020 / Accepted: 16 January 2020 / Published: 18 January 2020
(This article belongs to the Section Economic and Business Aspects of Sustainability)

Abstract

:
In this work, we examine poverty among vulnerable Korean female householders using a multidimensional concept with six dimensions: money, health, housing, employment, human relations, and social security. Taking data from the “Korea Welfare Panel Study 2015” by the Korea Institute for Health and Social Affairs and the Welfare Research Institute of Seoul National University, we apply latent class analysis to assess poverty among female householders using the Mplus8 software. The poverty indicator correlations are examined with Cramer’s V, and the differences in individual characteristics are analyzed through X2 and analysis of variance. The results show that the poor are composed of several groups with different characteristics. We divide the female householders into three main types, all likely to experience poverty in terms of money and employment. However, Type 1 shows a high probability of experiencing poverty in terms of money, employment, human relations, and health; when compared with Types 2 and 3, Type 1 poverty probability turns out to be higher for several indicators. Type 2 shows susceptibility to basic poverty, with a high probability of experiencing poverty in terms of money and employment. Lastly, Type 3 has a higher probability of health poverty than Types 1 and 2.

1. Introduction

Poverty is a worldwide phenomenon that threatens basic human life. Despite the numerous improvements in society today, poverty has remained an issue that cannot be easily resolved. In fact, social development has actually aggravated poverty in some ways while also changing its characteristics. The elderly, individuals with less education, individuals with low income, and women are particularly vulnerable to poverty [1,2].
Another worldwide phenomenon is the rapid increase in the number of female householders [3]. However, this rise has been accompanied by the increasingly visible problem of women in poverty [4,5]. Since Pearce [6] introduced the concept of the feminization of poverty, gender has become an important variable in poverty studies [6]. In many countries, women are excluded from the labor market; when there is no male responsible for supporting the family, these women may face challenges in terms of social insurance benefits. Factors such as weak human relations [7], changes in family structure caused by divorce or death of a spouse [1], sexual division in labor ideology, and labor market segmentation [8] are often considered as factors contributing to poverty among female householders.
The many recent studies that have actively investigated the problem of poverty have commonly viewed it as a result of economic deprivation [9,10]. When poverty is defined as a shortage of economic resources, the primary problem that poor women experience relates to material shortages of clothing, food, shelter, and more. However, poverty among women is also accompanied by social problems that go beyond economic resources and include, for example, social alienation. Hence, if the problem of women’s poverty is approached taking only economic resource shortages into account, it will be difficult to effectively design policies that address the various problems that poor women face. Accordingly, there is a need to consider women’s poverty from a multidimensional perspective that considers various issues in their lives, departing from the existing purely economic approach. Assuming that poverty has dimensions other than income, the multidimensional approach measures the level of welfare and welfare deficiency in various forms. As a result, policies that deal with poverty from a multidimensional perspective should be able to encompass sociocultural areas as well as simple income protection.
Some studies that have adopted a multidimensional approach have introduced the count approach [11,12,13,14] to estimate a new poverty rate, taking into consideration various dimensions other than income-based poverty, or to infer the severity of poverty, enabling an integrated prediction of the degree of poverty. However, despite its advantages, this multidimensional approach fails to determine which dimensions have a greater relative impact on poverty; furthermore, as detailed dimensions are replaced by single indicator values, the knowledge of poverty that can be derived is limited. For example, some indicators in multidimensional poverty studies, such as the headcount ratio (H) and adjusted headcount ratio (M), are transformed from various dimensions into one dimension, which results in a loss of information regarding which dimensions are more serious in relative terms. Hence, to provide effective measures against poverty, more detailed information is needed about which is the most vulnerable group as well as which poverty dimensions have the greatest impact. If types of poverty can be classified based on various dimensions, the effectiveness of such measures can be substantially improved.
Accordingly, in this study, we attempted to classify women’s poverty into types using latent class analysis (LCA) and the multidimensional poverty concept to determine effective policy alternatives. LCA is a subset of structural equation modeling and is used to find groups or subtypes of data within multivariate categorical and/or continuously observed data [15,16]. Our study contributes to the literature by identifying basic data that can be used to design more effective measures and policies to fight women’s poverty. The rest of the article is organized as follows: Section 2 covers the theoretical background for this study while Section 3 reviews the data and our methodology, and Section 4 presents the finding of this study. Finally, Section 5 and Section 6 provide discussion and conclusion.

2. Theoretical Background

2.1. Multidimensional Poverty

Poverty is regarded as a lack of welfare or basic capabilities, which translates into an individual’s inability or failure to realize practical opportunities [11,12,13,14]. The multidimensional approach to poverty regards a person’s standard of living or well-being as his/her capability to achieve the basic functions necessary for “state of life and behavior.”
This multidimensional approach has developed rapidly in recent times [17,18,19]. Related studies focus mainly on the realization of the capability to achieve a certain standard of living and on the accumulation of new measurement and analysis methods, adding analytical techniques for income poverty measurement [20]. The assumption in such studies is that an individual’s welfare level consists of a list or vector of attributes that represent various dimensions. Thus, in multidimensional poverty measurement, each individual is assessed against whether he/she has secured the “lowest acceptable level” of each associated attribute. The lowest acceptable level of each attribute is the lowest-level condition that supports basic living—a boundary line that determines the state of deficiency, such as the income poverty line. If an individual is assessed as being below the boundary line for a particular dimension, that dimension is defined as a deficiency for that person. For individuals, poverty is an increasing function of deficiencies across multiple dimensions. The deficiencies for all dimensions are combined to constitute an overall index, which becomes the individual’s multidimensional poverty index.
One of the most commonly accepted theories under the multidimensional approach is the “capability approach” proposed by Sen [21] and developed by Alkire [22]. Here, poverty is defined as a lack of capabilities or skills that enable individuals to realize practical opportunities. This capability approach is currently seen as a new paradigm in poverty research, has gained considerable academic interest, and has significantly influenced research by international organizations in developing and advanced countries [14]. After a comprehensive examination of 39 multidimensional poverty measurement models, Alkire [13] recommended selecting the dimension that directly supports and influences policies at large as the primary determining dimension of poverty, emphasizing practicality as the criterion for selection. Choi et al. [23] examined six poverty dimensions—income, net assets, health, ability to work, family and social relations, and social security—and applied the multidimensional poverty index developed by Alkire and Foster [24]. Their results showed that Korea’s multidimensional poverty rate was as high as 20%. They interpreted this as indicating that poverty in Korea could be attributed to a wide range of deficiencies in various dimensions, including assets, income, social security, and health.

2.2. Latent Class Analysis

Among extant multidimensional poverty studies, Dewilde [25] found that the process of assigning weights to the various poverty dimensions varied. Moreover, although weighting is typically done by experts, the various methods still had conceptual and other problems. Therefore, Dewilde [25] proposed Latent Class Analysis (LCA) as an alternative. LCA [26] is a mixture model that posits that there is an underlying unobserved categorical variable that divides a population into mutually exclusive and exhaustive latent classes. The class membership of individuals is unknown but can be inferred from a set of measured items.
As it assumes the multiple distribution of types of variables, this method makes it possible to analyze the variables regardless of the type of input [15,16]. Specifically, in LCA, the response items in the questionnaire measuring the variables are coded as a series of integers beginning with 1. The advantage of the latent class model is that when using categorical data, no other assumption is needed except for the assumption of the local independence of the observed indicators.

3. Method

3.1. Data

In this study, we analyzed data from the Korea Welfare Panel Study (KOWEPS) 2015 conducted by the Korea Institute for Health and Social Affairs and the Welfare Research Institute of Seoul National University. The KOWEPS has been used to identify meaningful results in multidimensional poverty analyses [23,27].
The KOWEPS includes appropriate comparable data for low-income and general-income households as it encompasses a survey of 90% of the population covered in the census data. It adopts intentional oversampling among low-income households (50%) considering statistical significance. The sampling method follows two phases. First, 517 districts are taken from 90% of the census data. Second, 3500 general and low-income households (which earn less than 60% of the median income) are extracted by applying a stratified double sampling model.
For this study, we derived 2192 responses from female householders and ultimately used 2148 responses in our analysis, excluding from the LCA anyone who was not regarded as deficient or in poverty for any of the six chosen indicators (44 responses). The general characteristics of the respondents are given in Table 1.

3.2. Selection of Poverty Indicators

Poverty variables were selected for both monetary and non-monetary categories, as shown in Table 2. Instead of taking only monetary categories—the traditional measures of poverty—non-monetary categories were used as part of the multidimensional approach based on Sen’s capability approach [21]. As in previous studies that adopted Sen’s approach, three domains were selected to represent the non-monetary category capabilities: individual, social, and structural [22]. Taking into account the monetary category and the three non-monetary domains, six poverty dimensions were constructed, and specific indicators for each dimension were selected in accordance with the Basic Needs Index [28] and other earlier studies [24,29,30]. The six poverty dimensions that emerged were money, health, housing, employment, social protection, and human relations.
First, under the monetary category, household income and household net assets were selected as money-related indicators. Household income is a traditional index of poverty as individuals with higher incomes have access to a more diversified and better range of opportunities, which enhances their standard of living [31]. Household net assets were selected as another money-related indicator since net assets can function as a buffer against income deprivation and an available resource for generating future income [23]. Second, for the health dimension, subjective health condition and medical expenses were selected as indicators. Health is expected to have a close association with well-being and capability because physical vulnerability may restrict an individual’s opportunities or freedom to achieve his/her desired level of functioning [29,30,32].
Third, another dimension of the individual domain, housing, included three indicators—location, type of housing, and housing expenses—in accordance with previous research [33,34]. The general status of housing can be measured by location and house type, which indicate whether one’s living conditions satisfy the minimum standard, and housing affordability can be measured by the rent-to-income ratio [32,33]. Fourth, employment in the structural domain was measured by the extent of a subject’s economic activities. Householders’ ability to work and their job security can be associated with their structural capabilities in society [23].
Fifth, social protection—another dimension within the structural domain—was measured by the status of health insurance. In South Korea, although public health insurance covers all citizens, self-employed workers and temporary or part-time employees still have limited coverage. Thus, health insurance status was measured as a representative indicator of social protection. Finally, in the social domain, the social relations factor focused on the relationship between individuals and their family and/or local community [23]. In this study, the social relations factor was measured by the respondent’s degree of satisfaction with family and other social relationships.
Our deprivation cut-offs were defined based on previous research [23,34]. For each indicator, households below the poverty line were assigned a value of 1 (have fallen into poverty), and those not below this line a value of 0 (have not fallen into poverty). For each dimension, if more than one index indicated having fallen into poverty, the dimension was considered as deficient. The poverty line of each indicator for all six dimensions is given in Table 2.

3.3. Analysis

In this study, the LCA was carried out using the Mplus8 software (Muthen & Muthen, Los Angeles, CA, USA). The correlation between each poverty indicator using SPSS24.0 (IBM, Seoul, Korea) was examined with Cramer’s V, and the differences in individual characteristics based on the LCA were analyzed using X2 and analysis of variance (ANOVA).

4. Results

4.1. Correlation between Dimensions

The results of the correlation between each dimension using Cramer’s V are shown in Table 3. The correlation between each indicator is found to be somewhat low at 0.042–0.211; therefore, the indicators selected in this study are independent, and the relationship between money and the other indicators is weak.

4.2. The Number of Poverty Groups

The number of latent classes was determined using various statistical indicators related to the fitness of each model. Indicators widely used to measure model fit include likelihood ratio Chi-squared (LL χ2), entropy, Akaike information criteria (AIC), and Bayesian information criteria (BIC) [35]. Researchers currently use a combination of criteria—such as a combination of statistical information criteria including AIC [36] and BIC [37] as well as agreement with substantive theory—to guide their decisions on the number of classes in LCA. Several textbooks and articles recommend using the BIC for class enumeration [16,38]. Simulation studies using LCA models also suggest that the adjusted BIC [39] is superior to other IC statistics [40].
Table 4 shows the fitness of each model. LL χ2 reveals that the model assuming two latent classes is statistically significant, while those assuming three or four latent classes are not. However, in the case of χ2, which is sensitive to the number of cases, its probability of being insignificant is high if the number of cases is large [15]. Therefore, it is difficult to judge the fitness of the model with only χ2. The smaller the values of AIC and BIC, the better the model’s fit with the observed data. As shown in Table 4, AIC and BIC are found to be the smallest when the number of latent classes is three. Entropy has a value between 0 and 1; if it is more than 0.8, we can conclude that the observed object is properly classified into a specific class [15]. Moreover, to select the final model, we need to determine whether the model can be interpreted and whether each class can be distinguished from others to be recognized as significant. Consequently, here, we chose a model with three latent classes to take all situations into account.

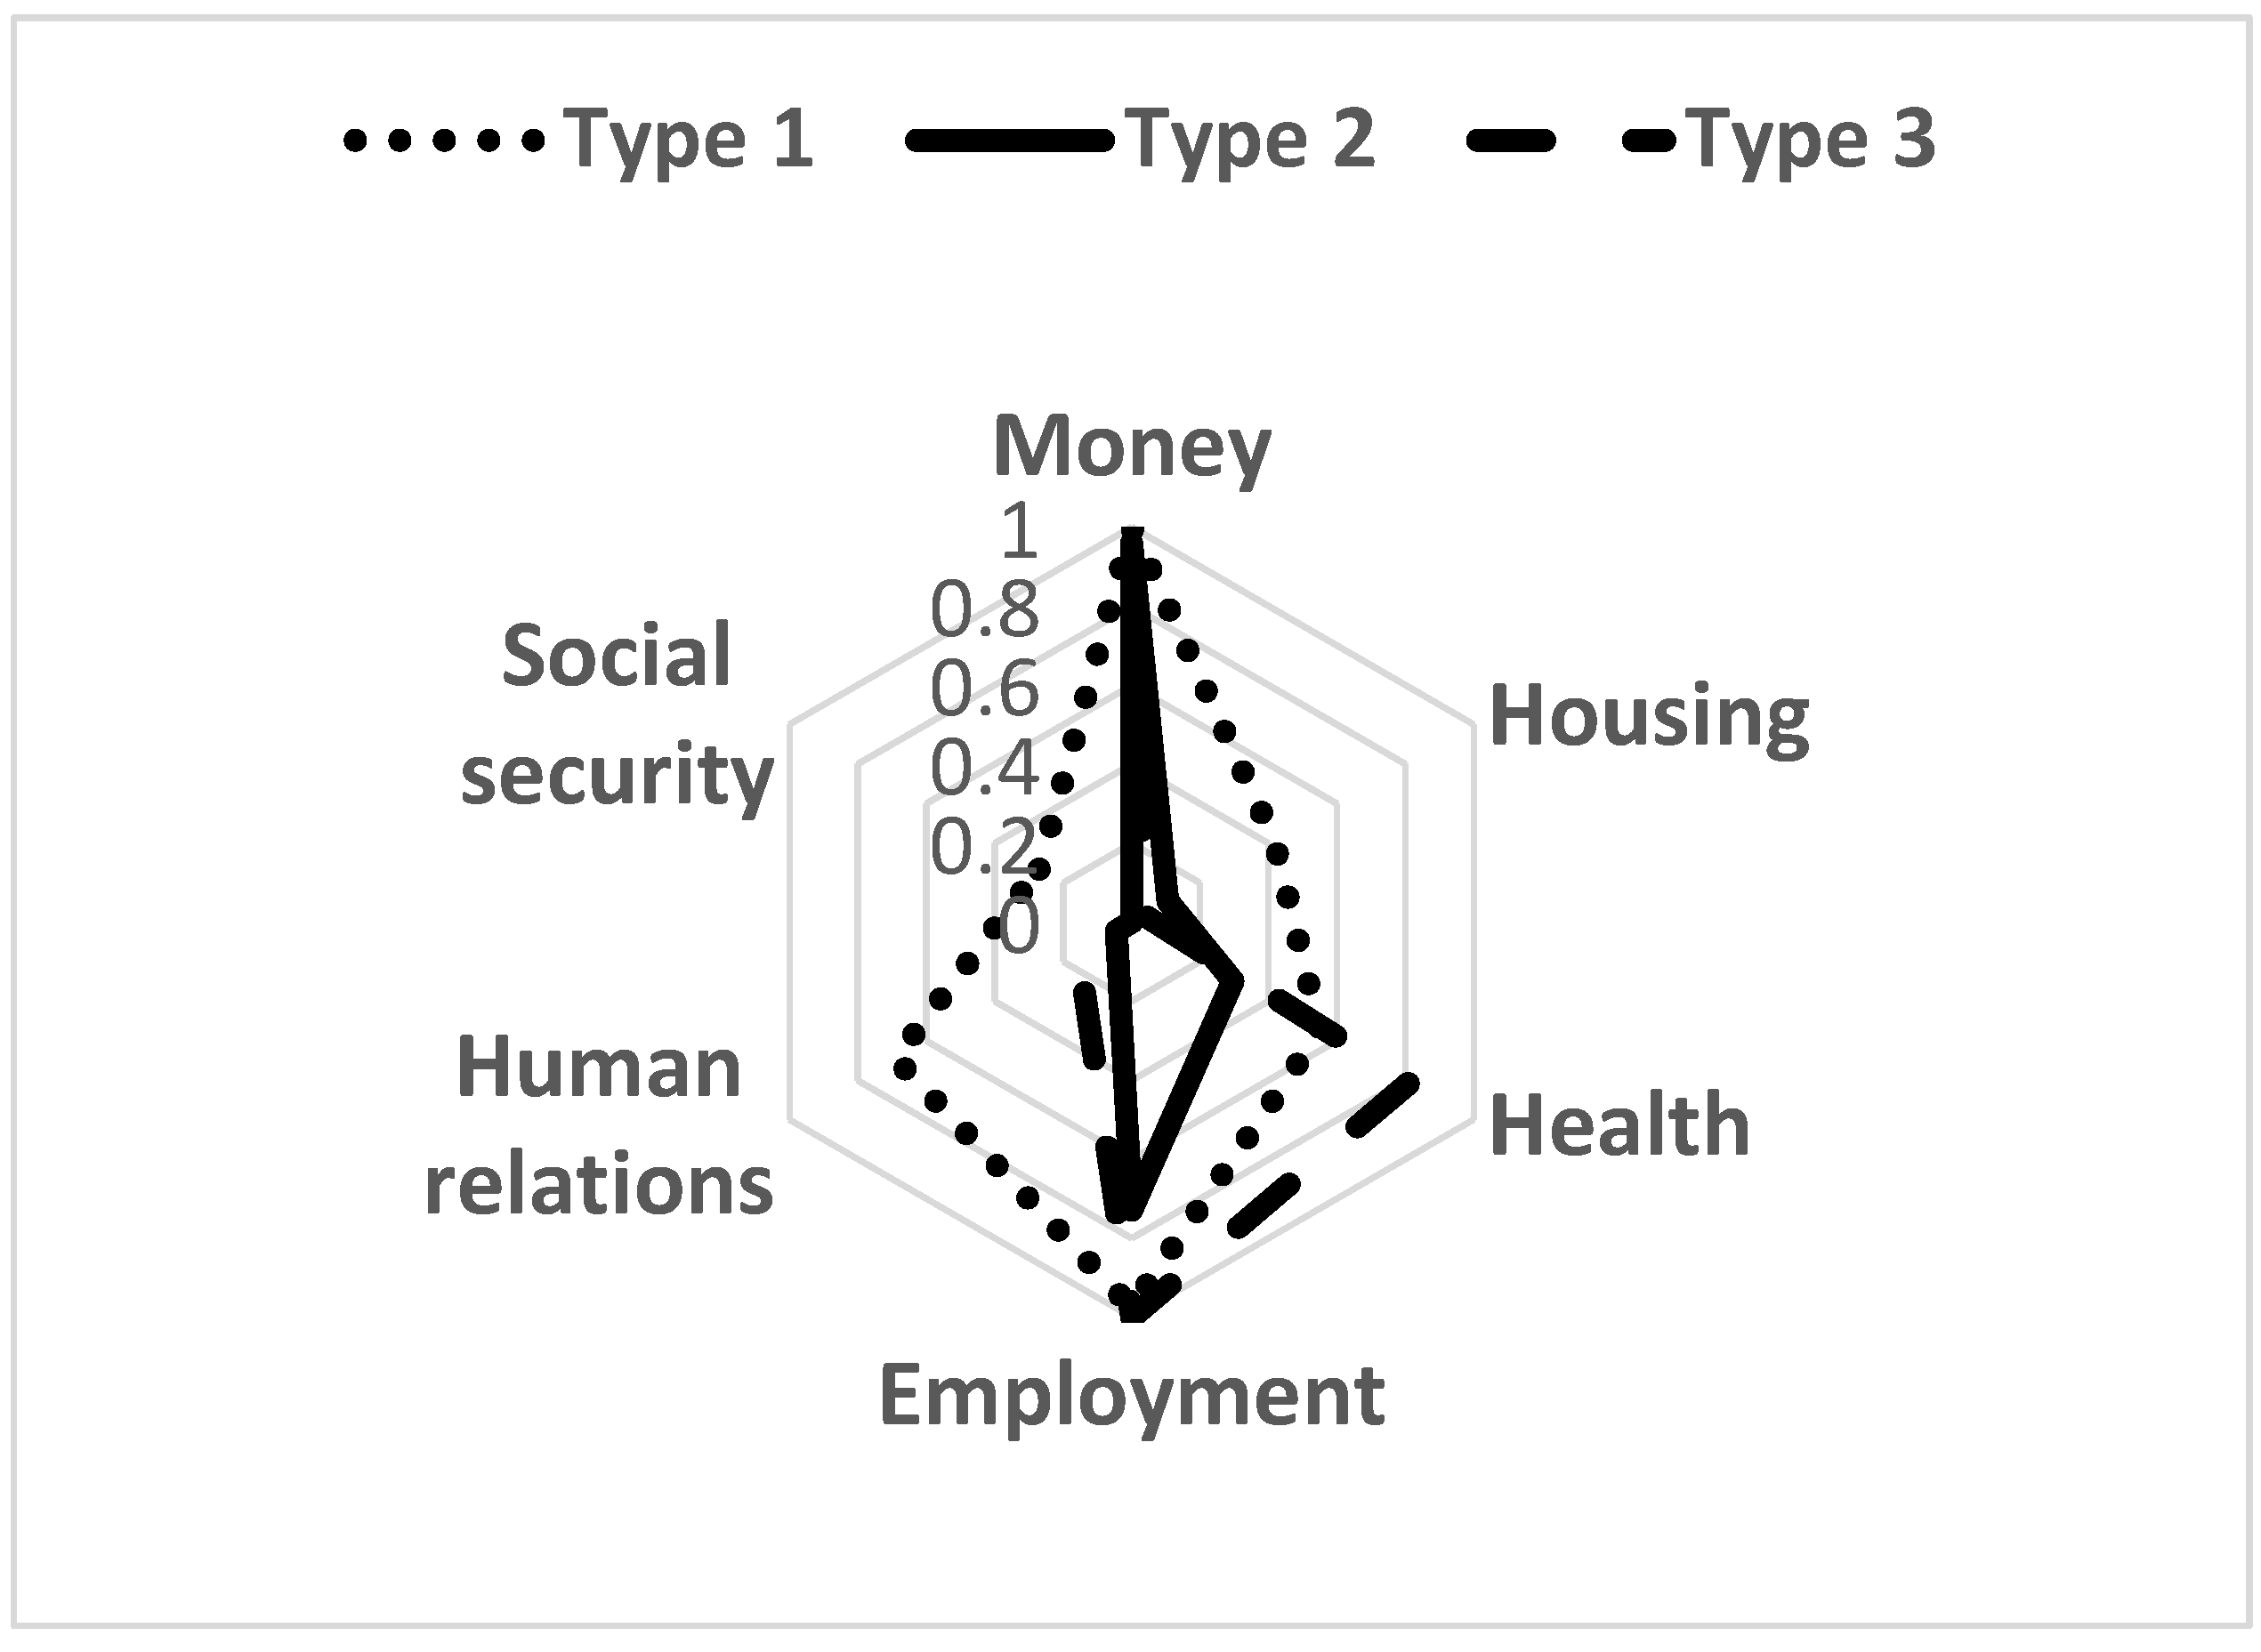
4.3. Types of Latent Classes

The interpretation of the latent classes of female householders in poverty is based on the conditional probability of each item. The results for each conditional probability are shown in Table 5 and Figure 1. Types 1, 2, and 3 have a significantly higher probability of experiencing poverty in terms of money and employment. The probability of experiencing poverty in terms of money is 100% for Type 1, 95.9% for Type 2, and 98.9% for Type 3. In the case of employment, the probability of experiencing poverty for Type 3 and Type 1 is significantly high at 100% and 97.5%, respectively, while that of Type 3 is 72.9%, which is still higher than that of the other poverty indicators but slightly lower than Types 1 and 2.
Type 1 shows a high probability of experiencing poverty in terms of money (100%), employment (97.5%), human relations (69.9%), and health (55.1%); in fact, compared with Types 2 and 3, Type 1 probabilities are higher for several poverty indicators. Type 2 shows the traditional probability of experiencing poverty in terms of money at 95.9%, and a 72.9% probability of experiencing poverty in terms of employment. Finally, Type 3 has a 98.9% probability of experiencing poverty in terms of money, a 100% probability for employment, and an 81.2% probability for health, indicating a higher probability of experiencing health poverty than Types 1 and 2.

4.4. Demographic Characteristics Based on Latent Class Type

Table 6 shows the demographic characteristics of Types 1, 2, and 3 compared with the non-poverty group that does not have a deficiency in any of the six indicators (n = 44). Regarding marital status, the percentage of married people in all groups is less than 10%. In the case of female householders, the percentage of unmarried people is more likely to be high since women assume the role of household head. As regards education level, the difference among the groups is statistically significant. In the case of the non-poverty group, the percentage of people with no education is 0%. Among Types 1, 2 and 3, the percentages of elementary school graduates (20.5%) and middle school graduates (9.1%) are relatively low, while those for high school graduates (31.8%) and college graduates (38.6%) are high. In the same vein, the percentage of people with no education (44.6%) among Type 3 is high in comparison with those of Types 1 and 2, and the percentages of high school graduates (5.3%) and college graduates (2.2%) are low. As for age, the difference among the groups is statistically significant. At 49.73 years, the average age of the non-poverty group is conspicuously low in comparison with Types 1, 2, and 3, and the average age of Type 3 is the highest at 75.89 years.
Overall, in the non-poverty group, the average age is lower and education level higher than in the poverty groups. In addition, among the poverty groups, average age is the highest in Type 3, which also has the highest poverty probability ratios in terms of money, employment, and health. No differences were found across metropolitan cities, large cities, small and medium-sized cities, counties, and urban–rural complex counties.

5. Discussion

In this study, we examined poverty among vulnerable female householders in Korea using the concept of multidimensional poverty and investigated six dimensions: money, health, housing, employment, human relations, and social security. Poverty probabilities among female householders are classified through LCA and the relationships among the indicators. Our results can be summarized as follows.
First, when correlations among the six poverty dimensions were examined, the correlation between the monetary dimension and non-monetary dimensions was found to be insignificant. This implies that examining poverty solely from a monetary perspective will not fully cover life deficiencies, and thus, the estimated degree of actual poverty could be distorted. This study confirmed that adopting the multidimensional poverty measurement method can help provide more appropriate services to the poor than employing the existing money-oriented poverty measurement method and can thus contribute more to enhancing the overall quality of life.
Second, the LCA allowed us to divide female householders in Korea into three main poverty types. All of them are highly likely to experience poverty in terms of money and employment. Specifically, Type 2 is likely to experience basic poverty with a high probability of experiencing poverty only in terms of money and employment; this type accounts for about 51.02% of the respondents. Type 1 represents a complex poverty group with a high probability of experiencing poverty in terms of health and human relationships in addition to money and employment; this group accounts for 20.99% of all respondents. Type 3 is a health-vulnerable class with a high probability of experiencing health poverty in addition to money and employment; this group accounts for 27.98% of all respondents.
Third, when demographic characteristics based on the latent class type were examined, the average age of those in the poverty groups was found to be higher than that of the non-poverty group. In particular, it was the highest for Type 3, with a higher probability of health poverty. In terms of education level, the non-poverty group shows relatively high proportions of high school graduates and college graduates compared with the latent class types; there were no significant educational differences across the latent class types.
Therefore, a money deficit arising from labor and labor deficiencies is the major factor causing female householders’ poverty. In fact, most Korean female householders are engaged in temporary employment and part-time work (62.5%) and about 40% of female householders have experienced unemployment over the past year, demonstrating typical characteristics of the working poor who are incompletely involved in the labor market [41]. Divorce and bereavement are the cause of an increase in the number of female householders [3], and as women enter old age, the likelihood of a household becoming led by a woman rather than a man has increased, which has accelerated poverty in female householders [4,5]. In this study, the average age of those in the poverty group (type 1 = 68.84, type 2 = 65.43, type 3 = 75.89) was significantly higher than that the non-poverty group (49.73). Thus, female householders are much more likely to live in poverty than other vulnerable groups because of the combined factors of being female and old age in the labor market.
Therefore, above all, the imperfections in the labor market need to be tackled. To secure stable employment, social jobs for elderly female householders should be expanded. In addition, because the pink-collar jobs (e.g., housework and care) in which women have traditionally been engaged are socially undervalued, new standards are needed to revalue them. To guarantee the economic independence of elderly female householders, social insurance should be changed to include unemployed female householders. In addition, for elderly female householders to participate in the labor market, the expansion of self-sufficiency projects should be considered.
We also recommend policy alternatives for each type. First, in the case of Type 2, employment expansion is necessary more than any other factor; if employment can be expanded, the probability of experiencing poverty in terms of money can be reduced to some extent. In the case of Type 3, employment expansion is not an appropriate policy, as this group is older and has a higher probability of health poverty. Thus, the focus should be on reducing their medical expenditure burden or offering them diverse medical benefits.
Distinguishing poverty groups using only a monetary standard could actually exclude from the defined policy target many who experience poverty [42]. As can be seen from the results, distinguishing poverty groups through multidimensional poverty indicators allows us to infer that the poor are composed of several groups with different characteristics. Therefore, when establishing poverty policies, the fact that poverty groups are not a simple structural classification that can be distinguished by a single standard should be taken into consideration. In addition to ensuring income, policies should focus on other elements of poverty. Moreover, the target groups of these policies should be defined more broadly, applying multi-faceted standards in order not to exclude the poor that fall outside traditional categories.
Despite these significant findings, this study has some limitations that can be addressed in future research. First, the data used in this study include an oversampling of low-income households by 50%. Second, since the average age of those in the poverty group in this study was significantly higher than that in the non-poverty group, analyses should be conducted by age in future studies. Third, non-monetary dimensions were measured by respondents’ self-reported and therefore subjective evaluations. Previous studies have pointed out that measuring poverty subjectively does not necessarily provide objective evaluations of the poor; rather, it gives leeway to evaluate based on one’s feelings and can reflect multidimensional and non-objective situations [43]. Thus, quantifying respondents’ perceptions on poverty dimensions might limit objective assessment. Future studies should develop indicators to measure non-monetary dimensions of poverty using objective norms.

6. Conclusions

In this study, we assessed female householders’ poverty in Korea using LCA and applied a multidimensional poverty approach to explore effective policy alternatives. All the three class types were found to be likely to experience poverty in terms of money and employment. Type 1 showed a high probability of poverty in terms of money, employment, human relations, and health; compared with Types 2 and 3, Type 1 had higher probabilities for several poverty indicators. Type 2 indicated basic poverty, with a high probability of experiencing poverty in terms of money and employment. Lastly, Type 3 had a higher probability of experiencing health poverty than Types 1 and 2. In the case of the non-poverty group, age was lower than in the poverty groups, while education level was higher. In addition, among the poverty groups, the average age was the highest for Type 3, which has the highest probability of experiencing poverty in terms of money, employment, and health.

Funding

This research received no external funding.

Ethical Approval

For this type of study, formal consent was not required since it is a retrospective study.

Conflicts of Interest

The author declares no conflicts of interest.

References

  1. Kim, Y. New social risks, women’s poverty, and poverty. Korean J. Sociol. 2006, 40, 189–226. [Google Scholar]
  2. Soek, J. Women and poverty in Korea: The feminization of poverty? Korean J. Soc. Welf. 2004, 56, 67–194. [Google Scholar]
  3. Gucciard, E.; Celasun, N.; Stewart, D.E. Single-mother families in Canada. Can. J. Public Health 2004, 95, 70–73. [Google Scholar] [CrossRef]
  4. Huisman, H. Contextualising chronic exclusion: Female-headed households in semi-arid Zimbabwe. Tijdschr. Econ. Soc. Geogr 2005, 96, 253–263. [Google Scholar] [CrossRef]
  5. Miller, J. Gender, poverty and social exclusion. Soc. Pol Soc. 2003, 2, 181–188. [Google Scholar] [CrossRef] [Green Version]
  6. Pearce, D. The feminization of poverty: Women, work and welfare. Urban. Soc. Chang. Rev. 1976, 11, 26–36. [Google Scholar]
  7. Kim, S.J. Causes of poverty in female-headed households and gender gap of poverty risks. Issues Fem. 2007, 7, 93–133. [Google Scholar]
  8. Lee, Y.J. Male breadwinner model and poverty of female. J. Gend. Equal. Stud. 2005, 10, 83–115. [Google Scholar]
  9. Yeo, Y.J. Old-age poverty by household type and policy efforts to reduce it. J. Crit. Soc. Welf. 2003, 40, 185–219. [Google Scholar]
  10. Min, Y.K.; Lee, M.S. A study on the determinants of the elderly poverty rate of welfare state: Focused on 23 OECD countries. J. Gov. Stud. 2014, 9, 91–115. [Google Scholar]
  11. Alkire, S. Valuing Freedom: Sen’s Capability and Poverty; Oxford University Press: Oxford, UK, 2002. [Google Scholar]
  12. Kuklys, W.; Robeyns, I. Sen’s capability approach to welfare economics. In Amartya Sen’s Capability Approach; Kuklys, W., Ed.; Springer: Heidelberg, Germany, 2004; pp. 9–30. [Google Scholar]
  13. Robeyns, I. The capability approach: A theoretical survey. J. Hum. Dev. 2005, 6, 93–117. [Google Scholar] [CrossRef]
  14. Clark, D.A. The Capability Approach: Its Development, Critiques and Recent Advances. GPRG-WPS-32. 2005, pp. 1–18. Available online: http://www.gprg.org/pubs/workingpapers/pdfs/gprg-wps-032.pdf (accessed on 16 January 2020).
  15. McCutcheon, L.A. Latent Class Analysis; Sage: Thousand Oaks, CA, USA, 1987. [Google Scholar]
  16. Hagenaars, J.; McCutcheon, A. Applied Latent Class Analysis Models; Cambridge University Press: New York, NY, USA, 2002. [Google Scholar]
  17. Ge, T.; Wang, L. Multidimensional child poverty, social relationships and academic achievement of children in poor rural areas of China. Child. Youth Serv. Rev. 2019, 103, 209–217. [Google Scholar] [CrossRef]
  18. Espinoza-Delgado, J.; Klasen, S. Gender and multidimensional poverty in Nicaragua: An individual based approach. World Dev. 2018, 110, 466–491. [Google Scholar] [CrossRef] [Green Version]
  19. Alkire, S.; Roche, J.M.; Vaz, A. Changed over time in multidimensional poverty: Methodology and results for 34 countries. World Dev. 2017, 39, 232–249. [Google Scholar] [CrossRef]
  20. Suh, B.S.; Kwon, J.H. Longitudinal analysis of multidimensional poverty in Korea: Counting approach. Korean Soc. Secur. Stud. 2013, 29, 192–224. [Google Scholar]
  21. Sen, A. Personal utilities and public judgements: Or what’s wrong with welfare economics. Econ. J. 1979, 89, 537–558. [Google Scholar] [CrossRef]
  22. Jackson, W.A. Capabilities, culture and social structure. Rev. Soc. Econ. 2005, 33, 101–124. [Google Scholar] [CrossRef]
  23. Choi, G.; Suh, B.S.; Kwon, J.H. Measurement of multidimensional poverty by counting approach. Korean J. Soc. Welf. 2011, 63, 85–111. [Google Scholar] [CrossRef]
  24. Alkire, S.; Foster, J.E. Counting and multidimensional poverty measurement. J. Public Econom. 2011, 95, 476–487. [Google Scholar] [CrossRef]
  25. Dewilde, C. The multidimensional measurement of poverty in Belgium and Britain: A categorical approach. Soc. Indic. Res. 2004, 68, 331–369. [Google Scholar] [CrossRef]
  26. Collins, L.M.; Lanza, S.T. Latent Class and Latent Transutuin Analysis: With Application in the Social, Behavioral and Health Science; Wiley: New York, NY, USA, 2010. [Google Scholar]
  27. Kim, K.H. A new perspective on poverty: From income to multidimensional poverty. Seoul Policy Rep. 2011, 100, 1–21. [Google Scholar]
  28. Doyal, L.; Gough, I. A Theory of Human Need; Guilford: New York, NY, USA, 1991. [Google Scholar]
  29. Callander, E.J.; Schofield, D.J.; Shrestha, R.N. Chronic health conditions and poverty: A cross-sectional study using a multidimensional poverty measure. BMJ Open 2013, 3, e003397. [Google Scholar] [CrossRef] [PubMed] [Green Version]
  30. Nozaki, K.; Oshio, T. Multidimensional poverty and perceived happiness: Evidence from China, Japan and Korea. Asian Econ. J. 2016, 30, 275–293. [Google Scholar] [CrossRef]
  31. Frey, B.S.; Stutzer, A. Happiness and Economics: How the Economy and Institutions Affect. Human Well-being; Princeton University Press: Princeton, NJ, USA, 2002. [Google Scholar]
  32. Kim, T.; Lee, J.; Jung, J. A study of elderly poverty and depression: Focusing on the multidimensional concept of poverty. Health Soc. Welf. Rev. 2015, 35, 71–102. [Google Scholar]
  33. Jin, M. The recent conditions of housing poverty, what solutions are needed? Health Welf. Policy Forum 2013, 197, 42–55. [Google Scholar]
  34. Kim, E. Measuring multidimensional child poverty in Korea: New approach to measure material deprivation of children. Korean Soc. Policy Rev. 2015, 22, 105–137. [Google Scholar]
  35. Kim, B.; Cho, A. The types and characteristics of school dropouts: A latent class analysis approach. Stud. Korean Youth 2013, 24, 5–31. [Google Scholar]
  36. Akaike, H. Factor analysis and AIC. Psychometrika 1987, 52, 317–332. [Google Scholar] [CrossRef]
  37. Schwartz, G. Estimating the dimension of a model. Annu. Stat. 1978, 6, 461–464. [Google Scholar] [CrossRef]
  38. Collins, L.M.; Filder, P.L.; Waglter, S.E.; Long, J.D. Goodness-of-fit testing for latent class model. Multivar. Behav. Res. 1993, 28, 375–389. [Google Scholar] [CrossRef]
  39. Sclove, L. Application of model-selection criteria to some problems in multivariate analysis. Psychmetrika 1978, 52, 333–343. [Google Scholar] [CrossRef]
  40. Yang, C. Evaluating latent class analyses in qualitative phenotype identification. Comput. Stat. Data 2006, 50, 1090–1104. [Google Scholar] [CrossRef]
  41. Shin, H.-J. A study on social exclusion factors influencing on poverty of female-headed households. Soc. Sci. Res. Rev. 2010, 26, 315–342. [Google Scholar]
  42. Nam, S.; Hwang, H. The multidimensional poverty in female-headed: Focused on comparison of male-headed households. Korean J. Consum. Stud. 2017, 28, 59–76. [Google Scholar]
  43. Zeumo, V.K.; Tsoukiàs, A.; Somé, B. A new methodology for multidimensional poverty measurement based on the capability approach. Soc. Econ. Plann Sci 2014, 48, 273–289. [Google Scholar] [CrossRef] [Green Version]
Figure 1. Probability scale according to latent classes. Source: Author.
Sustainability 12 00701 g001
Table 1. Respondents’ demographics (n = 2192).
n (%)
Age
≤2950 (2.2)
30–3966 (3.0)
40–49133 (6.1)
50–59273 (12.5)
60–69361 (16.5)
70–79795 (36.3)
≥80514 (23.4)
Marital status
Married146 (6.7)
Unmarried2046 (93.3)
Education
No education633 (28.9)
Elementary school810 (37.0)
Middle school269 (12.3)
High school302 (13.8)
College or above178 (8.1)
Area
Metropolitan city304 (13.9)
Large city581 (26.5)
Small and medium-sized city749 (34.2)
County496 (22.6)
Urban–rural complex county62 (2.8)
Source: Author.
Table 2. Dimensions and indicators of multidimensional poverty.
DomainIndicatorsCutoffs: Deprived If
MoneyHousehold income with equivalence scaleLess than 50% of median income
Household net assetsLess than basic property based on Statistics Korea data
HealthSubjective health condition“Inclined not to be healthy,” “health condition is very bad”
Financial approach to medical serviceRatio of medical expenditure to disposable income, ratio exceeds 20%
HousingLocation of houseBasement floor, semi-basement floor, rooftop
Type of houseTemporary building, rental apartment, vinyl greenhouse, mud hut, shack, temporary makeshift, permanent rental apartment, national rental apartment, housing in non-residential building (arcade, factory, etc.)
House costRatio of housing cost to disposable income, ratio (rent + maintenance cost) exceeds 30%
EmploymentWork abilityNo economic activity due to lack of working ability
Participation in economic activityTemporary job, day worker, self-supported worker, public worker, senior citizen worker, unpaid family worker, jobless, economically inactive
Social securityHealth insuranceUninsured, insurance defaulter
Human relationsFamily relationship satisfactionVery unsatisfactory, inclined to be unsatisfactory
Social relationshipVery unsatisfactory, inclined to be unsatisfactory
Source: Author.
Table 3. Correlations of the rate of poverty using Cramer’s V.
123456
1. Money1
2. Housing0.042 *1
3. Health0.119 ***0.22 ***1
4. Employment0.211 ***0.068 ***0.170 ***1
5. Human relations0.051 **0.118***0.110 ***0.105 ***1
6. Social security0.096 ***0.302***0.090 ***0.176 ***0.207 ***1
Notes: The value of Cramer’s V is between 0 and 1; the higher the value, the stronger the relationship between the two indicators. A value below 0.3 could indicate that the selected indicators are independent. * p < 0.05, ** p < 0.01, *** p < 0.001. Source: Author.
Table 4. Model fit. LL χ2: likelihood ratio Chi-squared; AIC: Akaike information criteria; BIC: Bayesian information criteria.
Number of Groups (K)
234
LL χ2102.62853.64445.790
df504336
p-value0.0000.12810.127
AIC10,483.58910,448.86610,455.012
BIC10,557.58910,542.31210,608.164
Adjusted BIC10,516.28710,498.76910,522.381
Entropy0.7510.8470.875
Source: Author.
Table 5. Results in probability scale.
Status of PovertyLatent Classes
Type 1 (n = 451)Type 2 (n = 1096)Type 3 (n = 601)
MoneyNo0.0000.0410.011
Yes1.0000.9590.989
HousingNo0.5840.8940.964
Yes0.4160.1060.036
HealthNo0.4490.7040.188
Yes0.5510.2960.812
EmploymentNo0.0250.2710.000
Yes0.9750.7291.000
Human relationsNo0.3100.9560.846
Yes0.6900.0440.154
Social securityNo0.7301.0001.000
Yes0.2700.0000.000
Source: Author.
Table 6. Characteristics according to latent classes.
Non-Poverty (n = 44)Latent Classes
Type 1 (n = 451)Type 2 (n = 1096)Type 3 (n = 601)
n (%)n (%)n (%)n (%) x 2
Marital status 8.921 *
Married3 (6.8)16 (3.5)83 (7.6)44 (7.3)
Unmarried41 (93.2)435 (96.5)1013 (92.4)557 (92.7)
Education 256.252 ***
No education0132 (29.3)233 (21.3)268 (44.6)
Elementary school9 (20.5)158 (35.0)409 (37.3)234 (38.9)
Middle school4 (9.1)71 (15.7)140 (12.8)54 (9.0)
High school14 (31.8)72 (16.0)184 (16.8)32 (5.3)
Higher than college17 (38.6)18 (4.0)130 (11.9)13 (2.2)
Area 89.577 ***
Metropolitan10 (22.7)85 (18.8)149 (13.6)60 (10.0)
Large city7 (15.9)168 (37.3)264 (24.1)142 (23.6)
Small and medium-sized city18 (40.9)139 (30.8)392 (35.8)200 (33.3)
Country9 (20.5)54 (12.0)255 (23.3)178 (29.6)
Urban–rural complex county05 (1.1)36 (3.3)21 (3.5)
M (S.D.)M (S.D.)M (S.D.)M (S.D.)F
Agea49.73 (12.51) a68.84 (13.14) b65.43 (15.81) b75.89 (9.27) c104.300 ***
Notes: * p < 0.05, *** p < 0.001, a, b and c: Tukey test, a < b < c. Source: Author.

