Investigation of Nighttime Light Pollution in Nanjing, China by Mapping Illuminance from Field Observations and Luojia 1-01 Imagery


Abstract
1. Introduction
2. Materials and Methods
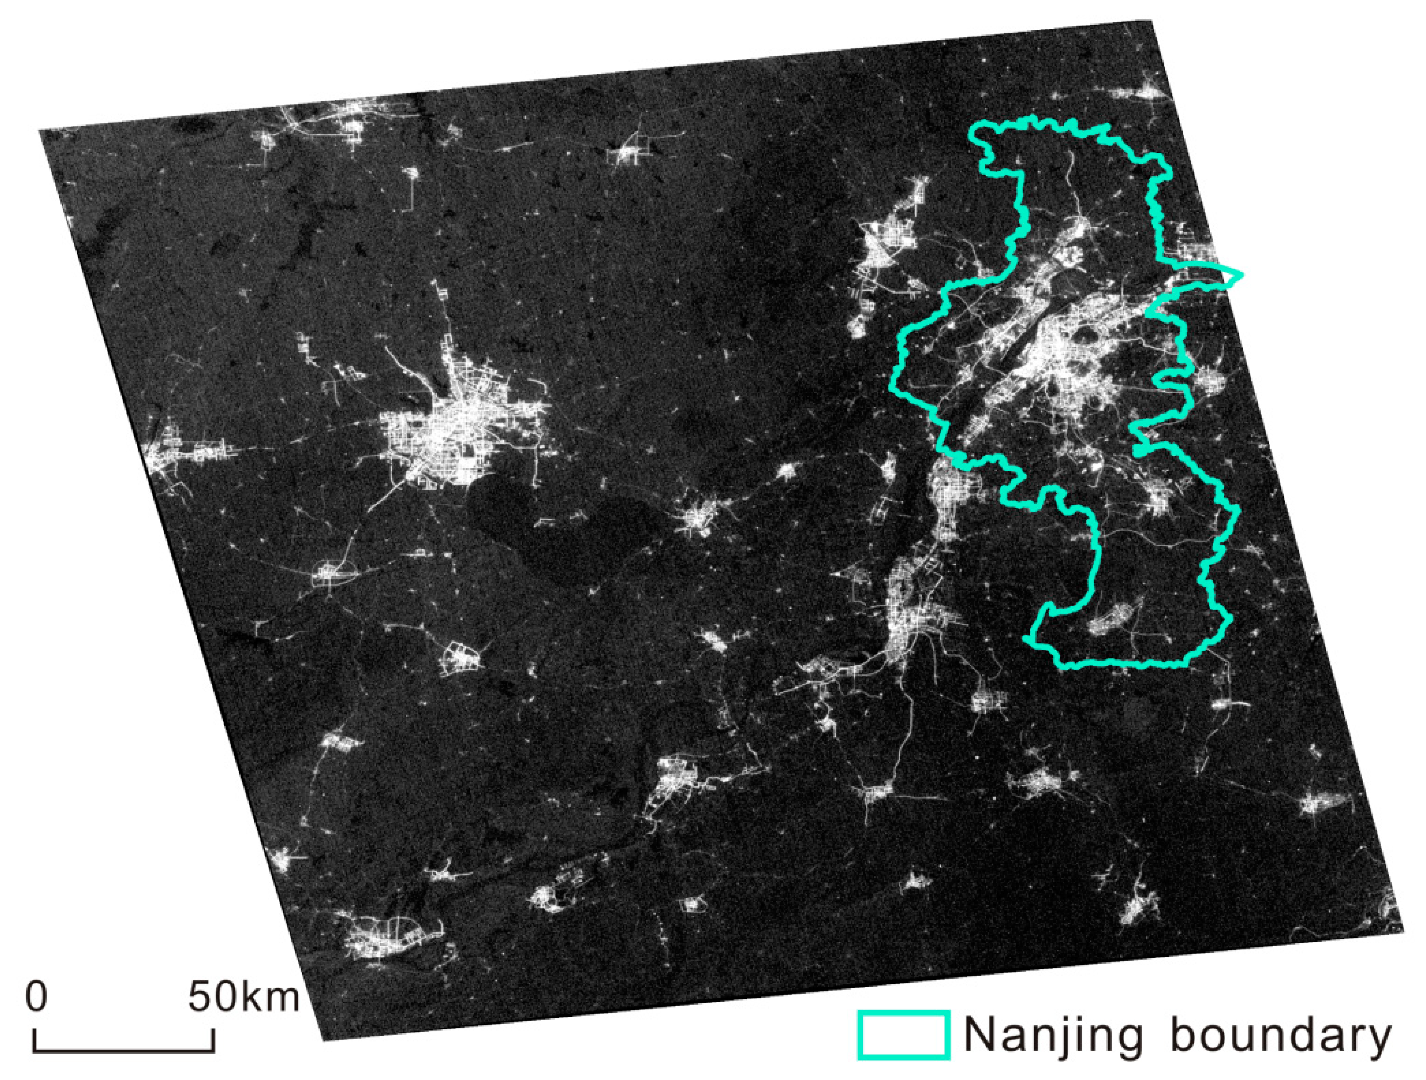
2.1. Study Area
2.2. data
2.2.1. Remote Sensing Data
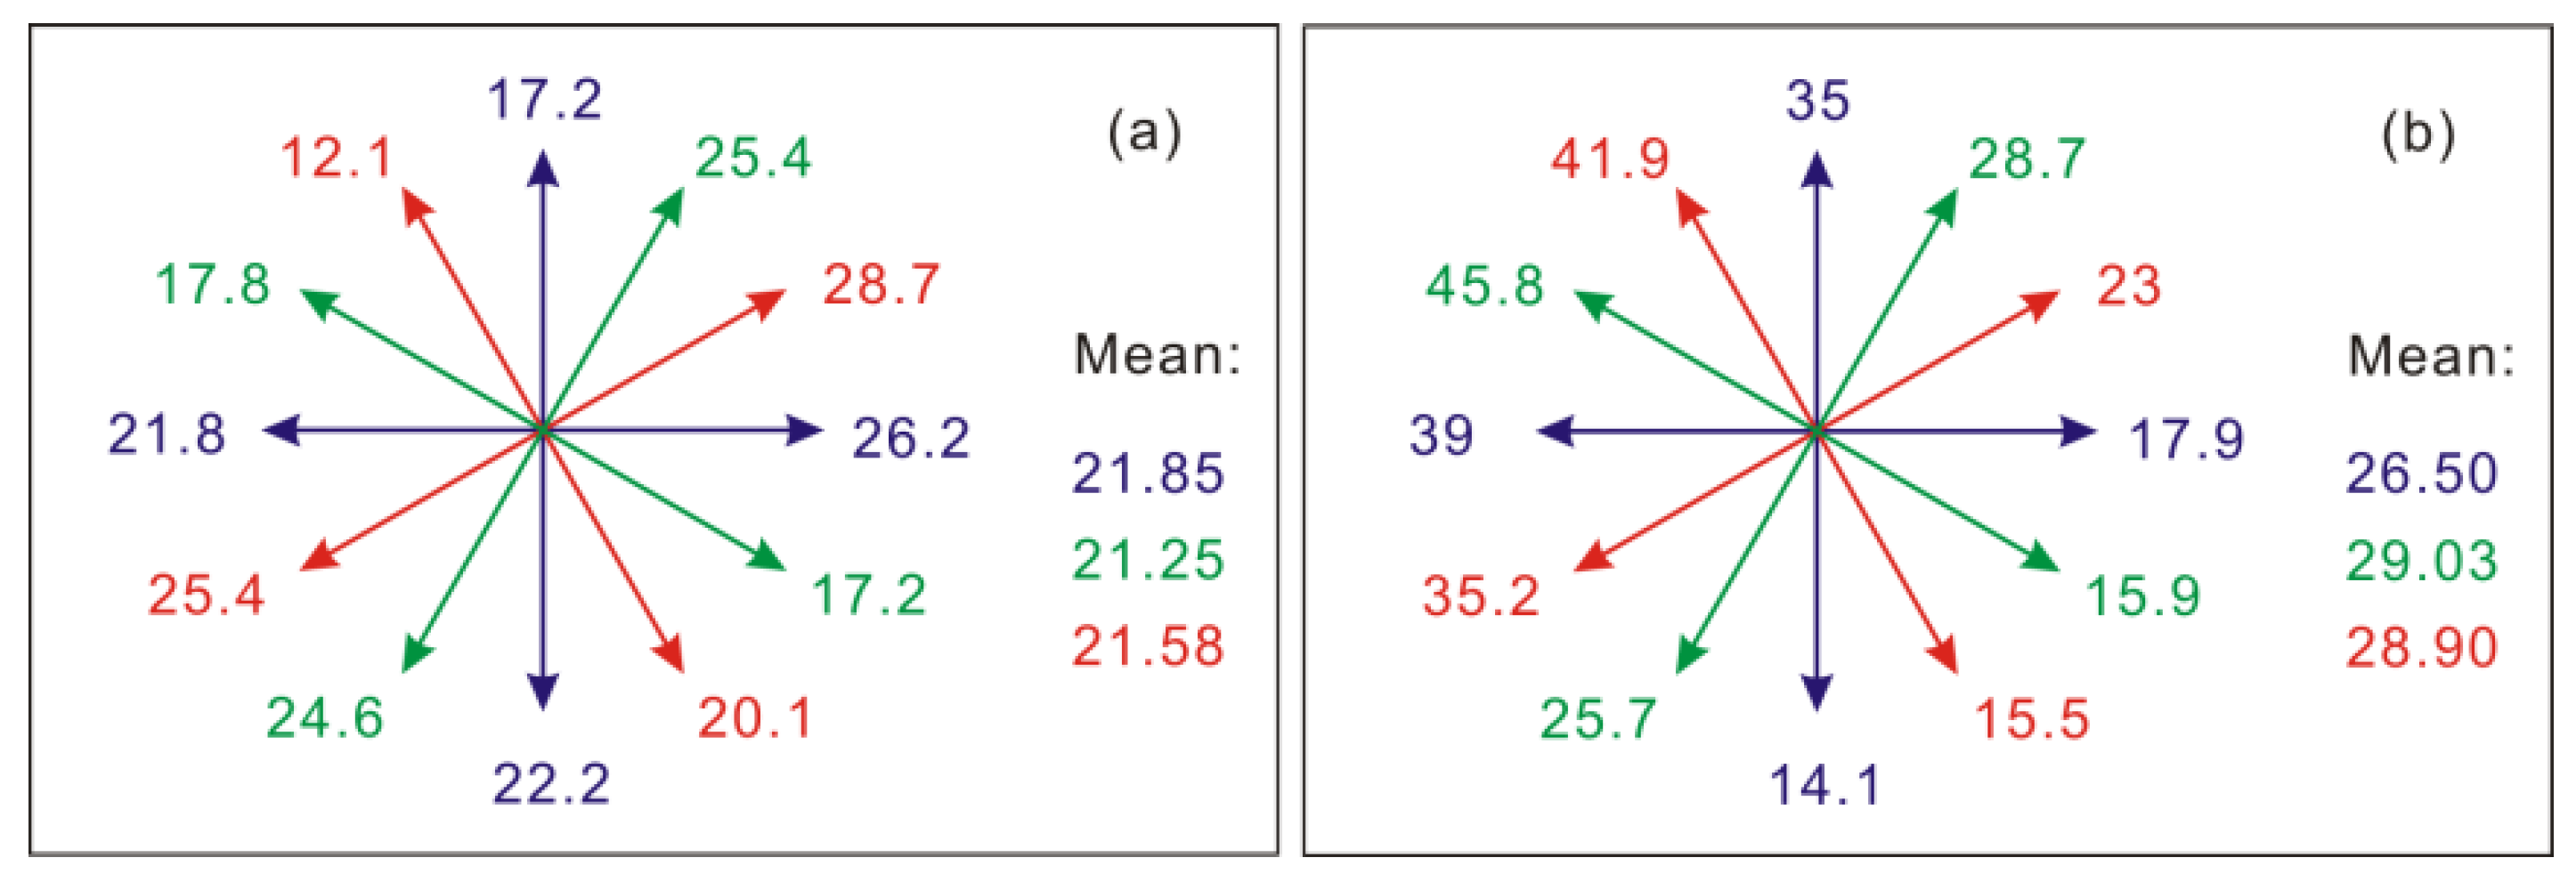
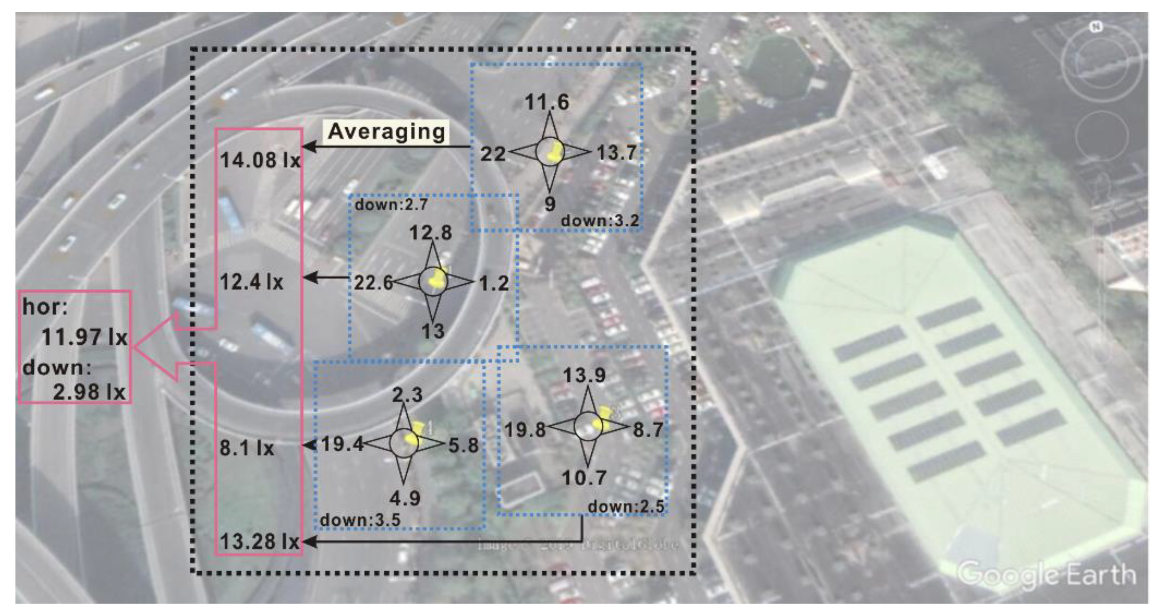
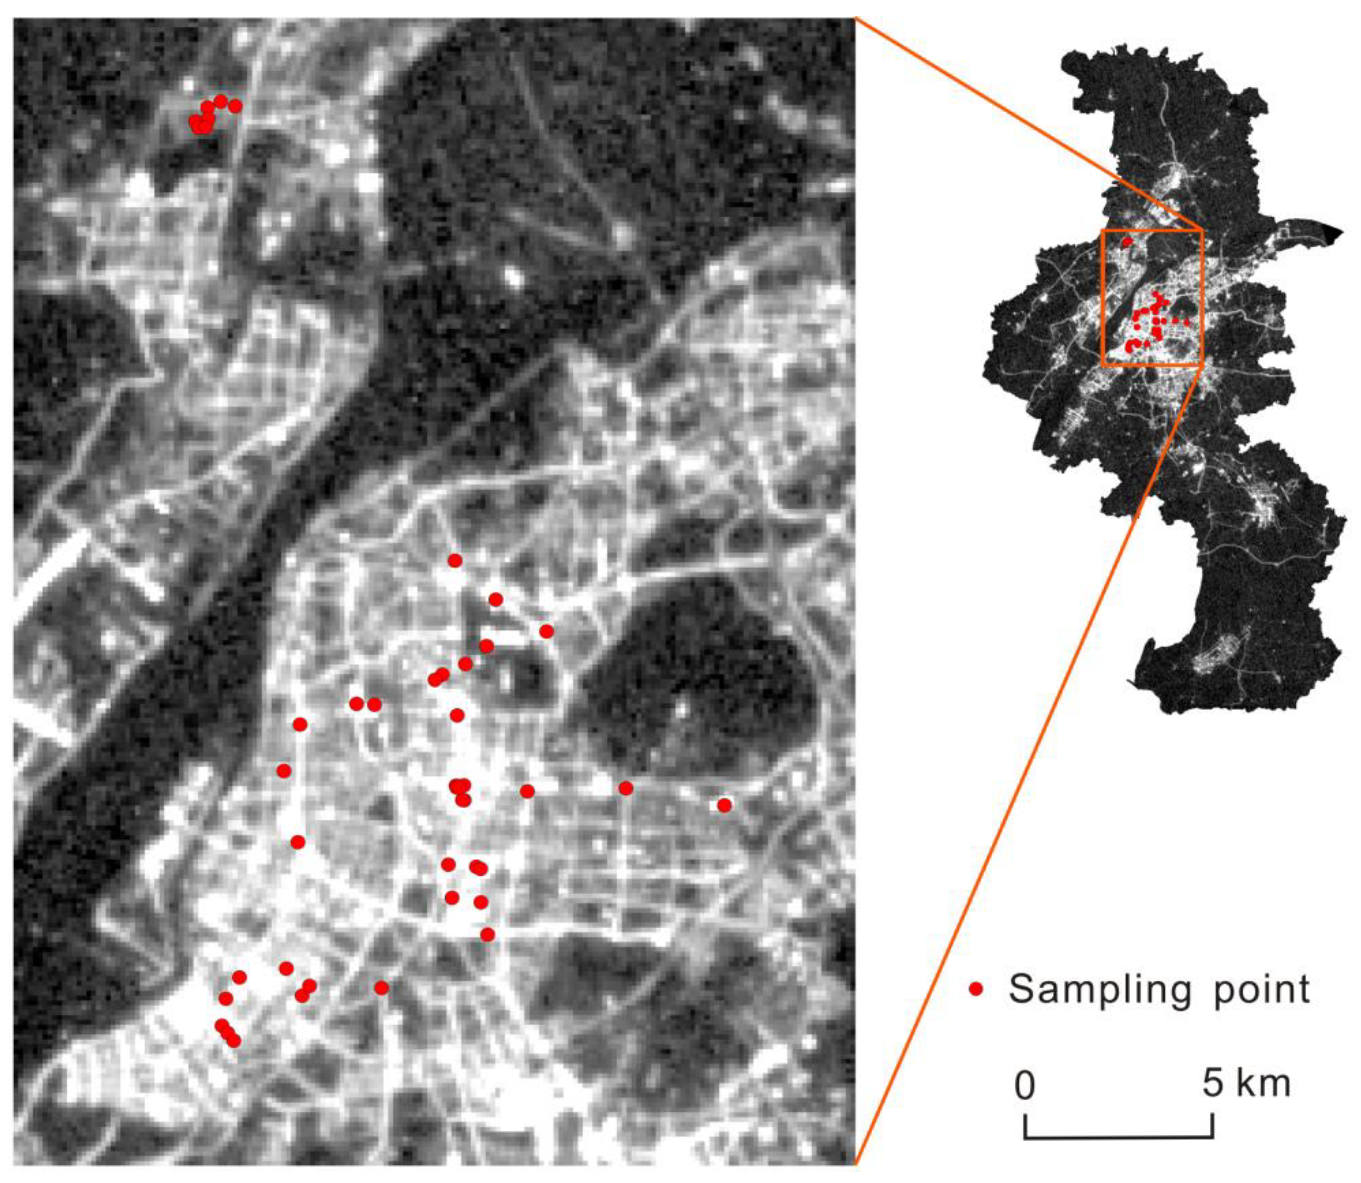
2.2.2. Field Observations
2.3. Method
3. Result and Discussion
3.1. Mapping Illumination in Nanjing
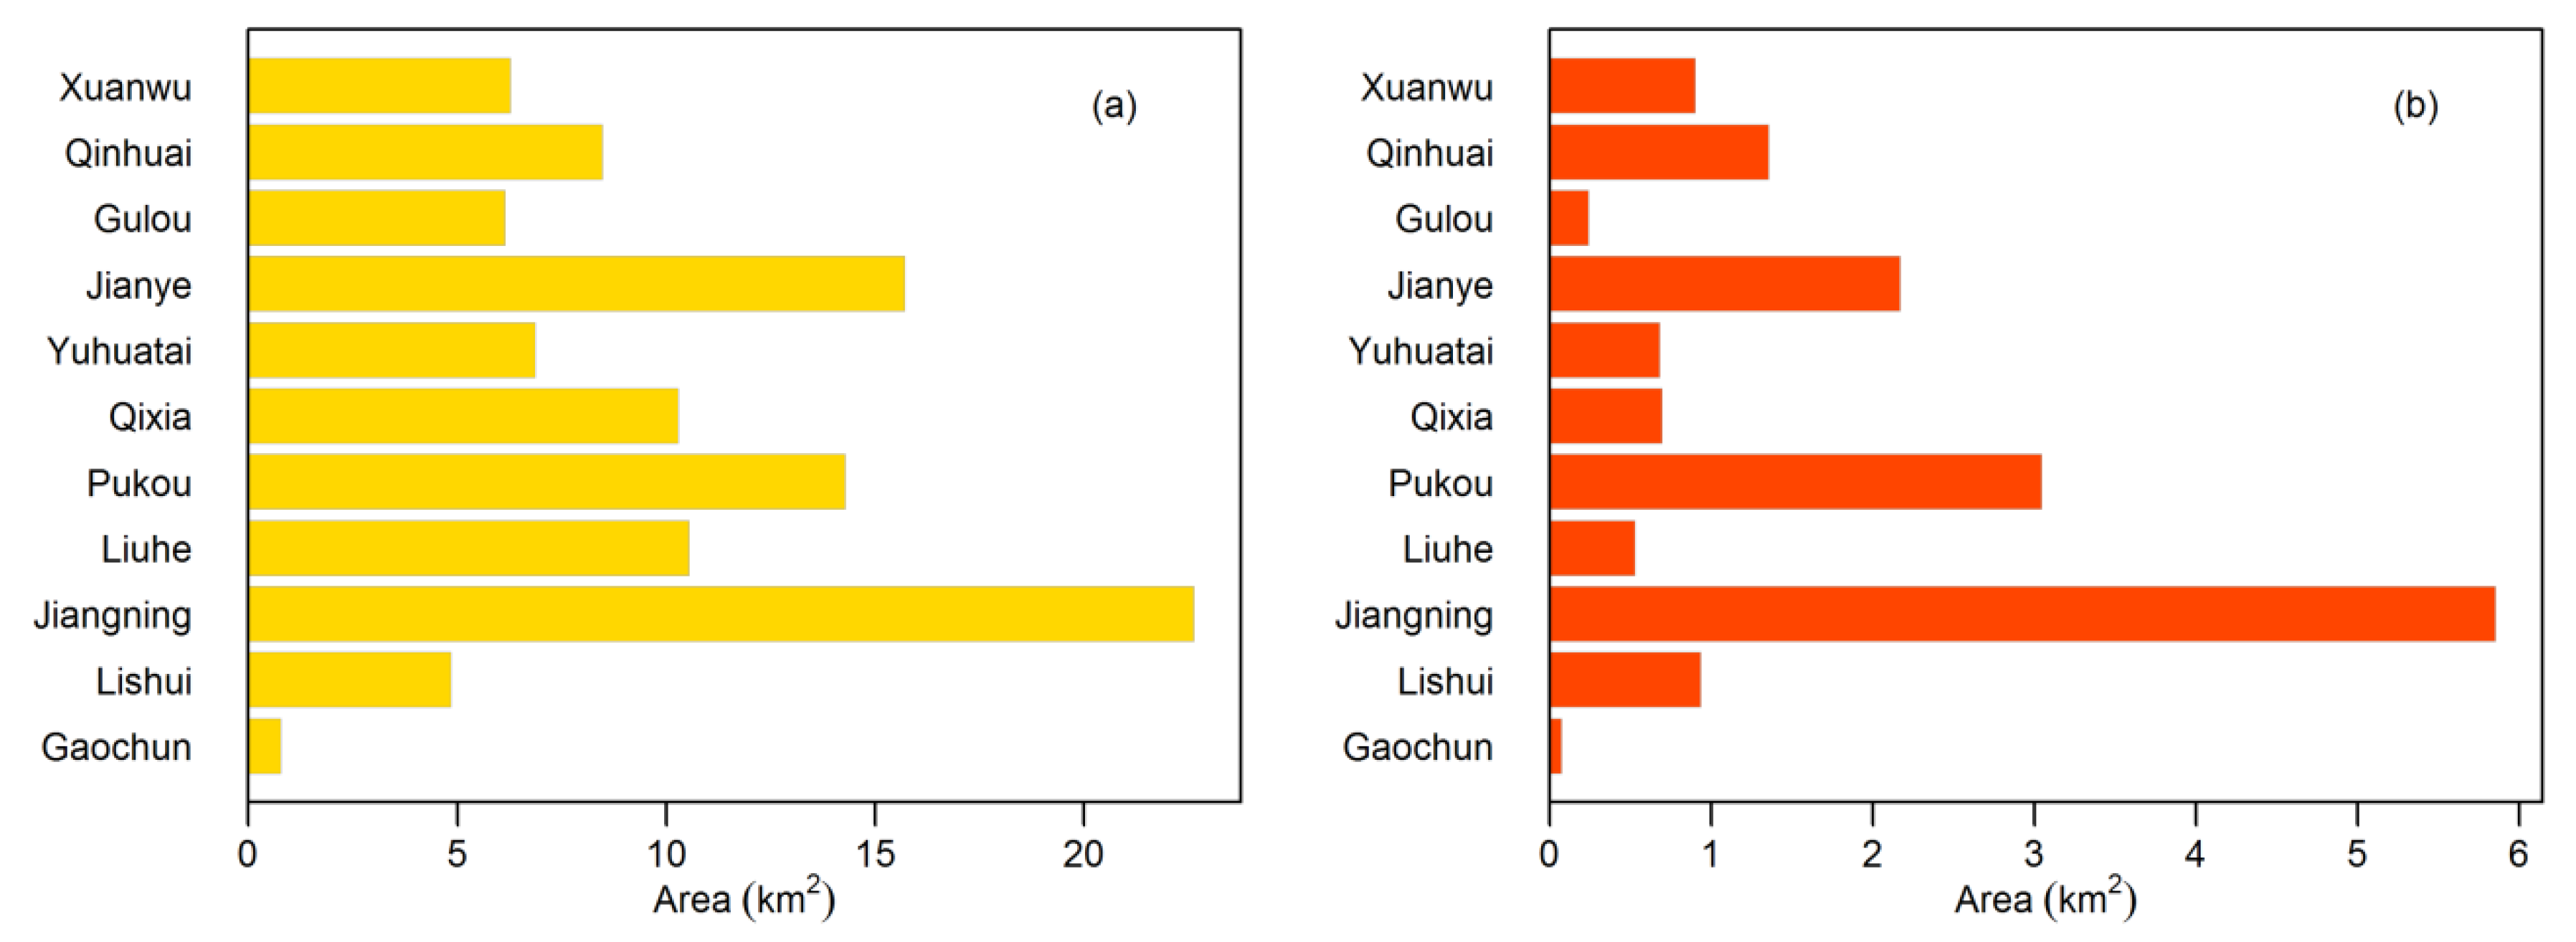
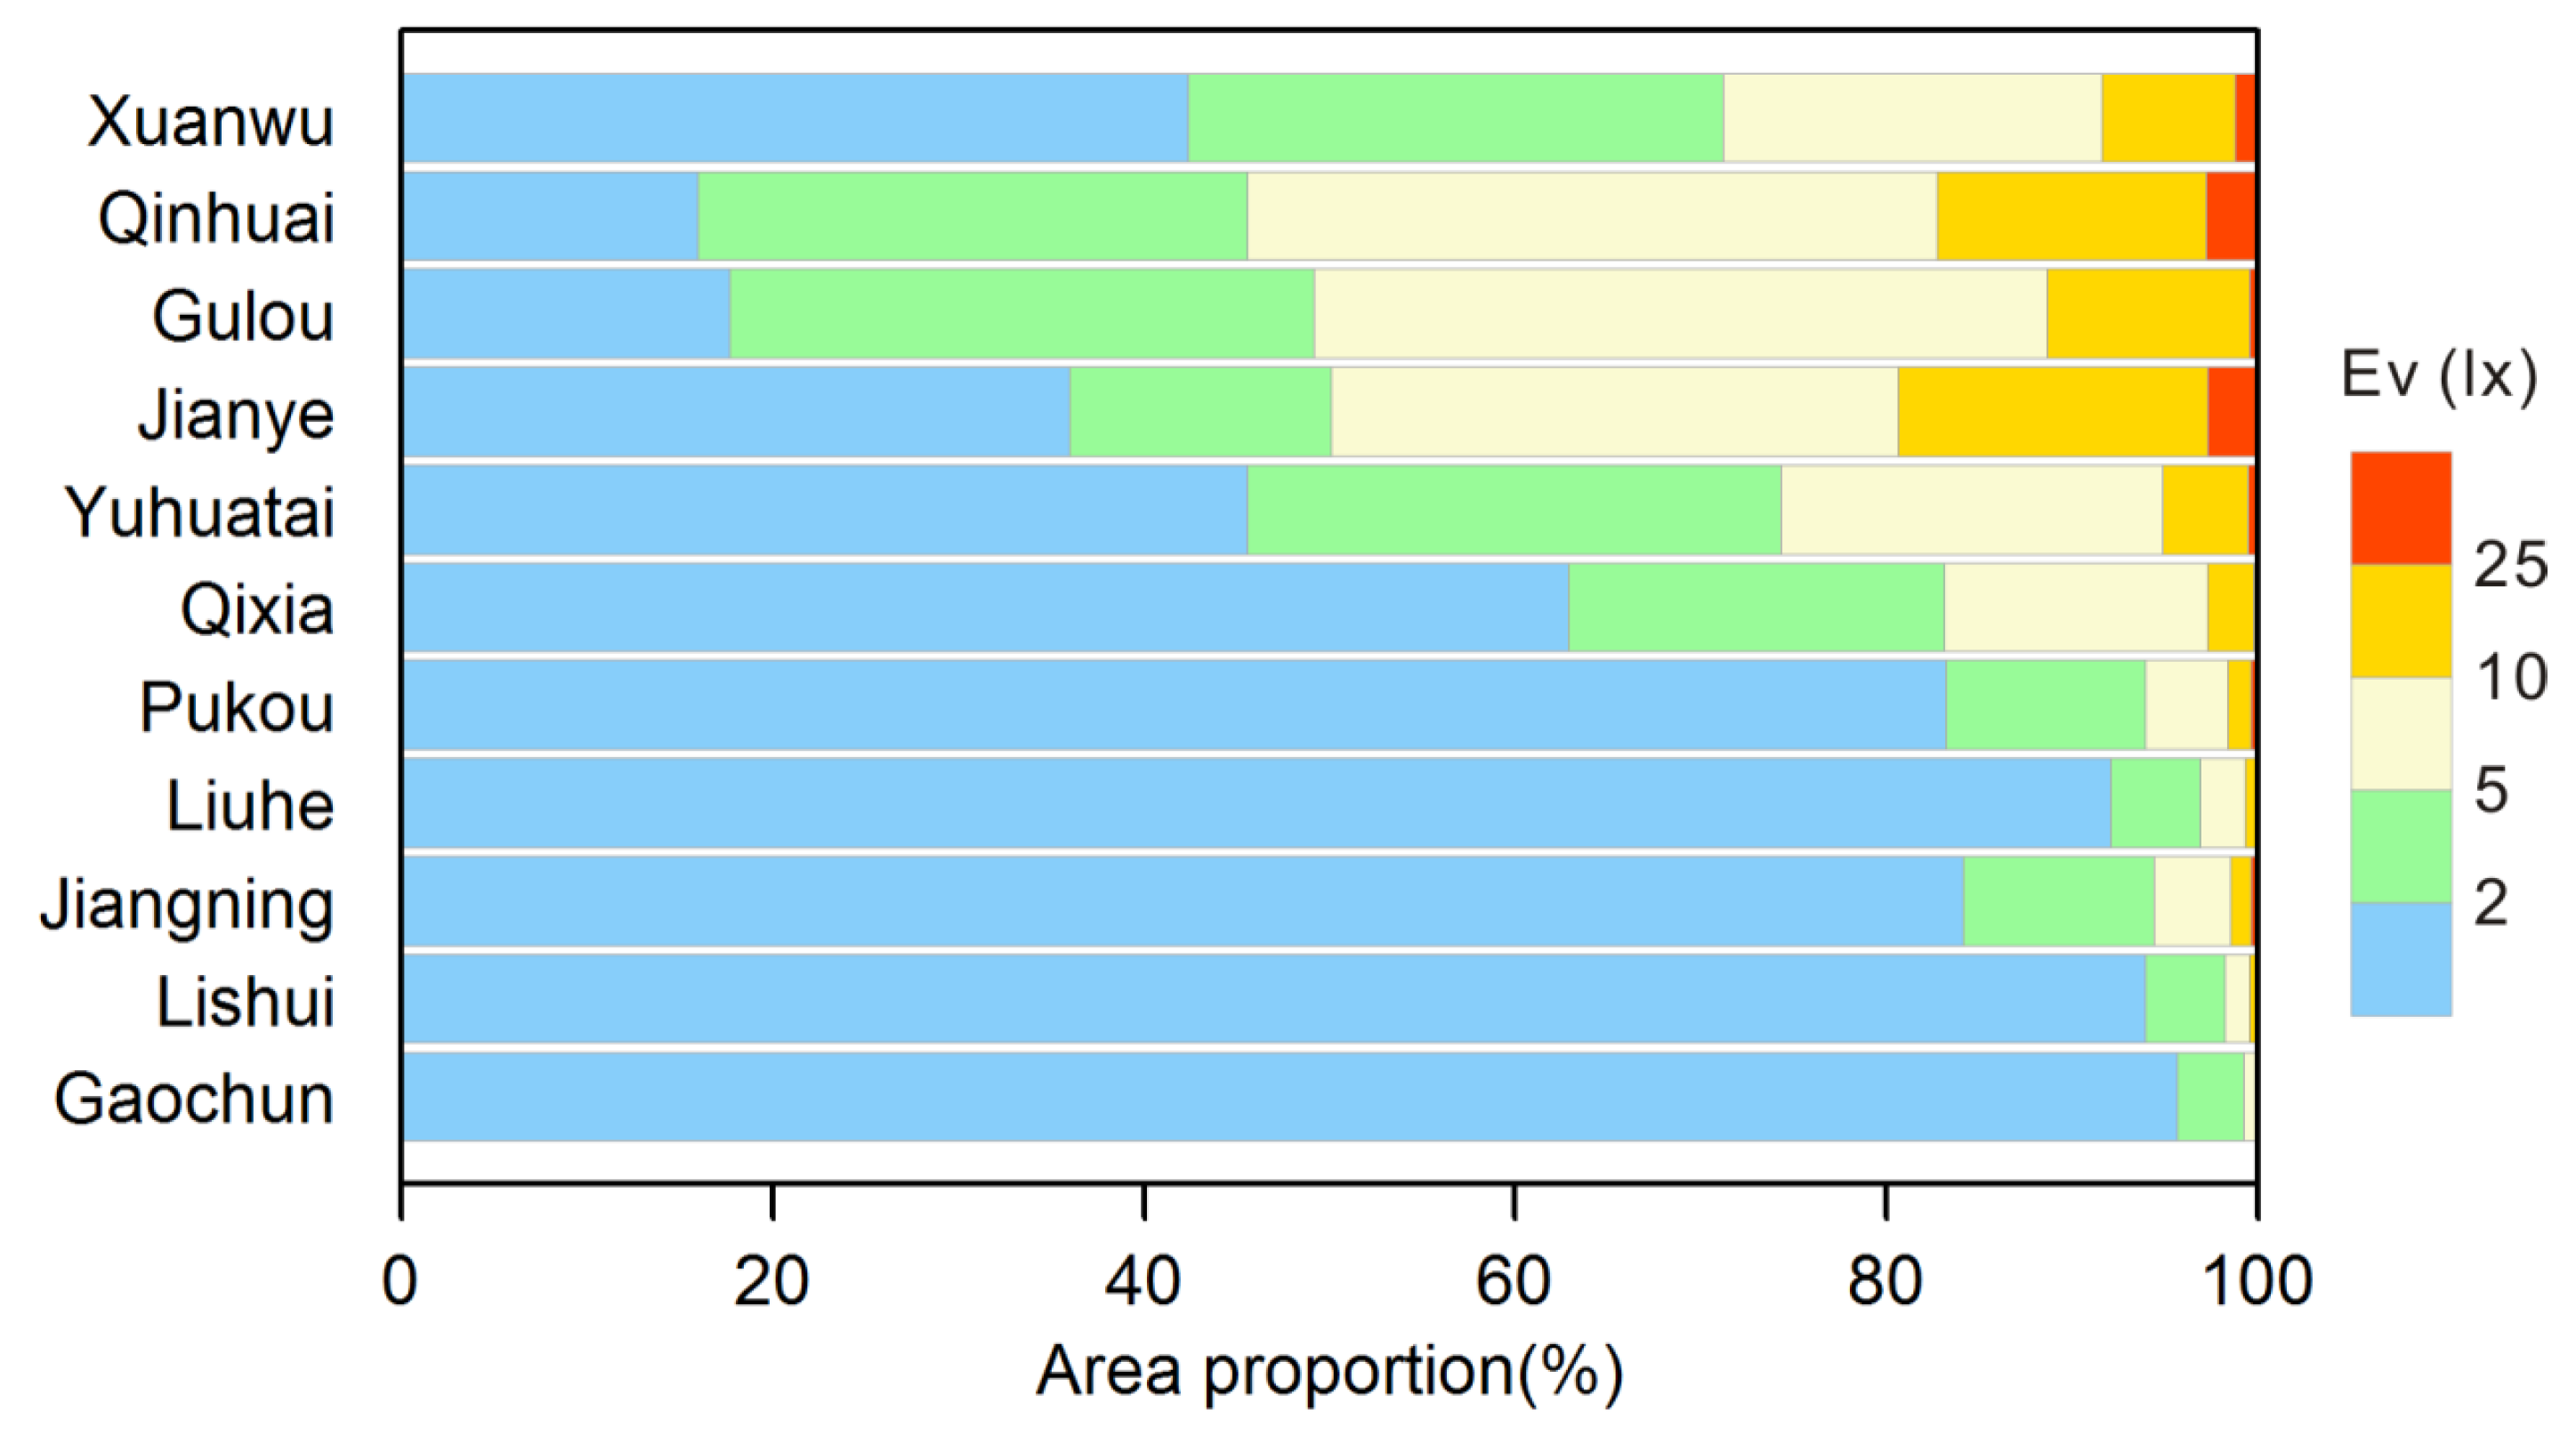
3.2. Spatial Pattern of Light Pollution over Nanjing
3.3. Discussion
4. Conclusions
Author Contributions
Funding
Acknowledgments
Conflicts of Interest
References
- Longcore, T.; Rich, C. Ecological light pollution. Front. Ecol. Environ. 2004, 2, 191–198. [Google Scholar] [CrossRef]
- Bennie, J.; Davies, T.W.; Duffy, J.P.; Inger, R.; Gaston, K.J. Contrasting trends in light pollution across Europe based on satellite observed night time lights. Sci. Rep. 2014, 4, 3789. [Google Scholar] [CrossRef]
- Xiang, W.; Tan, M. Changes in Light Pollution and the Causing Factors in China’s Protected Areas, 1992–2012. Remote Sens. 2017, 9, 1026. [Google Scholar] [CrossRef]
- Kyba, C.C.; Kuester, T.; De Miguel, A.S.; Baugh, K.; Jechow, A.; Hölker, F.; Bennie, J.; Elvidge, C.D.; Gaston, K.J.; Guanter, L. Artificially lit surface of Earth at night increasing in radiance and extent. Sci. Adv. 2017, 3, e1701528. [Google Scholar] [CrossRef]
- Gallaway, T.; Olsen, R.N.; Mitchell, D.M. The Economics of Global Light Pollution. Ecol. Econ. 2010, 69, 658–665. [Google Scholar] [CrossRef]
- Bephage, G. Promoting quality sleep in older people: The nursing care role. Br. J. Nurs. 2005, 14, 205–210. [Google Scholar] [CrossRef]
- Hölker, F.; Wolter, C.; Perkin, E.K.; Tockner, K. Light pollution as a biodiversity threat. Trends Ecol. Evol. 2010, 25, 681–682. [Google Scholar] [CrossRef]
- Lin, R.S.; Sung, F.C.; Huang, S.L.; Gou, Y.L.; Ko, Y.C.; Gou, H.W.; Shaw, C.K. Role of urbanization and air pollution in adolescent asthma: A mass screening in Taiwan. J. Formos. Med. Assoc. 2001, 100, 649–655. [Google Scholar] [CrossRef] [PubMed]
- Pauley, S.M. Lighting for the human circadian clock: Recent research indicates that lighting has become a public health issue. Med. Hypotheses 2004, 63, 588–596. [Google Scholar] [CrossRef] [PubMed]
- Kohyama, J. A newly proposed disease condition produced by light exposure during night: Asynchronization. Brain Dev. 2009, 31, 255–273. [Google Scholar] [CrossRef] [PubMed]
- Stevens, R.G. Light-at-night, circadian disruption and breast cancer: Assessment of existing evidence. Int. J. Epidemiol. 2009, 38, 963–970. [Google Scholar] [CrossRef] [PubMed]
- Bedrosian, T.A.; Nelson, R.J. Influence of the modern light environment on mood. Mol. Psychiatry 2013, 18, 751–757. [Google Scholar] [CrossRef] [PubMed]
- Bennie, J.; Davies, T.W.; Cruse, D.; Gaston, K.J. Ecological effects of artificial light at night on wild plants. J. Ecol. 2016, 104, 611–620. [Google Scholar] [CrossRef]
- Kempenaers, B.; Borgström, P.; Loës, P.; Schlicht, E.; Valcu, M. Artificial night lighting affects dawn song, extra-pair siring success, and lay date in songbirds. Curr. Biol. 2010, 20, 1735–1739. [Google Scholar] [CrossRef] [PubMed]
- Van Doren, B.M.; Horton, K.G.; Dokter, A.M.; Klinck, H.; Elbin, S.B.; Farnsworth, A. High-intensity urban light installation dramatically alters nocturnal bird migration. Proc. Natl. Acad. Sci. USA 2017, 114, 11175–11180. [Google Scholar] [CrossRef] [PubMed]
- Kamrowski, R.L.; Limpus, C.; Moloney, J.; Hamann, M. Coastal light pollution and marine turtles: Assessing the magnitude of the problem. Endanger. Species Res. 2012, 19, 85–98. [Google Scholar] [CrossRef]
- Hänel, A.; Posch, T.; Ribas, S.J.; Aubé, M.; Duriscoe, D.; Jechow, A.; Kollath, Z.; Lolkerna, D.E.; Moore, C.; Schmidt, N.; et al. Measuring night sky brightness, methods and challenges. J. Quant. Spectrosc. Radiat. Transf. 2018, 205, 278–290. [Google Scholar] [CrossRef]
- Kyba, C.C.M.; Ruhtz, T.; Fischer, J.; Hölker, F. Cloud Coverage Acts as an Amplifier for Ecological Light Pollution in Urban Ecosystems. PLoS ONE 2011, 6, e17307. [Google Scholar] [CrossRef]
- Pun, C.S.J.; So, C.W.; Leung, W.Y.; Wong, C.F. Contributions of artificial lighting sources on light pollution in Hong Kong measured through a night sky brightness monitoring network. J. Quant. Spectrosc. Radiat. Transf. 2014, 139, 90–108. [Google Scholar] [CrossRef]
- Posch, T.; Blinder, F.; Puschnig, J. Systematic measurements of the night sky brightness at 26 locations in Eastern Austria. J. Quant. Spectrosc. Radiat. Transf. 2018, 211, 144–165. [Google Scholar] [CrossRef]
- Dobler, G.; Ghandehari, M.; Koonin, S.E.; Nazari, R.; Patrinos, A.; Sharma, M.S.; Tafvizi, A.; Vo, H.T.; Wurtele, J.S. Dynamics of the urban lightscape. Inform. Syst. 2015, 54, 115–126. [Google Scholar] [CrossRef]
- Jin, X.; Li, Y.; Zhang, J.; Zheng, J.; Liu, H. An Approach to Evaluating Light Pollution in Residential Zones: A Case Study of Beijing. Sustainability 2017, 9, 652. [Google Scholar] [CrossRef]
- Lim, H.S.; Ngarambe, J.N.; Kim, J.T.; Kim, G. The Reality of Light Pollution: A Field Survey for the Determination of Lighting Environmental Management Zones in South Korea. Sustainability 2018, 10, 374. [Google Scholar] [CrossRef]
- Jechow, A.; Kolláth, Z.; Ribas, S.J.; Spoelstra, H.; Hölker, F.; Kyba, C.C. Imaging and mapping the impact of clouds on skyglow with all-sky photometry. Sci. Rep. 2017, 7, 6741. [Google Scholar] [CrossRef] [PubMed]
- Jechow, A.; Hölker, F. Snowglow—The Amplification of skyglow by snow and clouds can exceed full moon illuminance in suburban areas. J. Imaging 2019, 5, 69. [Google Scholar] [CrossRef]
- Jechow, A.; Hölker, F.; Kyba, C.C. Using all-sky differential photometry to investigate how nocturnal clouds darken the night sky in rural areas. Sci. Rep. 2019, 9, 1391. [Google Scholar] [CrossRef]
- Katz, Y.; Levin, N. Quantifying urban light pollution—A comparison between field measurements and EROS-B imagery. Remote Sens. Environ 2016, 177, 65–77. [Google Scholar] [CrossRef]
- Zamorano, J.; de Miguel, A.S.; Ocaña, F.; Pila-Diez, B.; Castaño, J.G.; Pascual, S.; Tapia, C.; Gallego, J.; Fernandez, A.; Nievas, M. Testing sky brightness models against radial dependency: A dense two dimensional survey around the city of Madrid, Spain. J. Quant. Spectrosc. Radiat. Transf. 2016, 181, 52–66. [Google Scholar] [CrossRef]
- Biggs, J.D.; Fouché, T.; Bilki, F.; Zadnik, M.G. Measuring and mapping the night sky brightness of Perth, Western Australia. Mon. Not. R. Astron. Soc. 2012, 421, 1450–1464. [Google Scholar] [CrossRef]
- Cinzano, P.; Falchi, F.; Elvidge, C.D. The first world atlas of the artificial night sky brightness. Mon. Not. R. Astron. Soc. 2001, 328, 689–707. [Google Scholar] [CrossRef]
- Chalkias, C.; Petrakis, M.; Psiloglou, B.; Lianou, M. Modelling of light pollution in suburban areas using remotely sensed imagery and GIS. J. Environ. Manag. 2006, 79, 57–63. [Google Scholar] [CrossRef] [PubMed]
- Cinzano, P.; Falchi, F.; Elvidge, C.D.; Baugh, K.E. Mapping the artificial sky brightness in Europe from DMSP satellite measurements: The situation of the night sky in Italy in the last quarter of century. arXiv 1999, arXiv:astro-ph/9905340. [Google Scholar]
- Elvidge, C.D.; Baugh, K.E.; Zhizhin, M.; Hsu, F.C. Why VIIRS data are superior to DMSP for mapping nighttime lights. Proc. Asia-Pac. Adv. Netw. 2013, 35, 62. [Google Scholar] [CrossRef]
- Rybnikova, N.A.; Portnov, B.A. Outdoor light and breast cancer incidence: A comparative analysis of DMSP and VIIRS-DNB satellite data. Int. J. Remote Sens. 2017, 38, 5925–5961. [Google Scholar] [CrossRef]
- Falchi, F.; Cinzano, P.; Duriscoe, D.; Kyba, C.C.; Elvidge, C.D.; Baugh, K.; Portnov, B.A.; Rybnikova, N.A.; Furgoni, R. The new world atlas of artificial night sky brightness. Sci. Adv. 2016, 2, e1600377. [Google Scholar] [CrossRef]
- Kuechly, H.U.; Kyba, C.C.; Ruhtz, T.; Lindemann, C.; Wolter, C.; Fischer, J.; Hölker, F. Aerial survey and spatial analysis of sources of light pollution in Berlin, Germany. Remote Sens. Environ. 2010, 126, 39–50. [Google Scholar] [CrossRef]
- Hale, J.D.; Davies, G.; Fairbrass, A.J.; Matthews, T.J.; Rogers, C.D.F.; Sadler, J.P. Mapping lightscapes: Spatial patterning of artificial lighting in an urban landscape. PLoS ONE 2013, 8, e61460. [Google Scholar] [CrossRef]
- Xu, Y.; Knudby, A.; Côté-Lussier, C. Mapping ambient light at night using field observations and high-resolution remote sensing imagery for studies of urban environments. Build. Environ. 2018, 145, 104–114. [Google Scholar] [CrossRef]
- Commission Internationale de L’éclairage (CIE). Guide on the Limitation of the Effects of Obtrusive Light from Outdoor Lighting Installations, 2nd ed.; Technical Report: CIE 150; CIE Publication: Vienna, Austria, 2003. [Google Scholar] [CrossRef]
- Ministry of Housing and Urban-Rural Development of People’s Republic of China. Code for Lighting Design of Urban Nightscape; China JGJ/T 163-2008; Ministry of Housing and Urban-Rural Development of People’s Republic of China: Beijing, China, 2008.


| Sample No. | Latitude | Longitude | Ambient Ev (lx) | Vertical-Observed Ev (lx) | Location |
|---|---|---|---|---|---|
| 1 | 32.0974 | 118.7794 | 14.19 | 2.25 | Downtown |
| 2 | 32.08786 | 118.7908 | 9.73 | 2.93 | Downtown |
| 3 | 32.07998 | 118.805 | 11.96 | 2.98 | Downtown |
| 4 | 32.03966 | 118.7809 | 50.33 | 10.85 | Downtown |
| 5 | 32.06333 | 118.7509 | 19.76 | 5.80 | Downtown |
| 6 | 32.063 | 118.756 | 7.57 | 0.98 | Downtown |
| 7 | 32.06014 | 118.7793 | 22.88 | 8.63 | Downtown |
| 8 | 32.04326 | 118.7786 | 42.14 | 6.45 | Downtown |
| 9 | 32.04156 | 118.7988 | 11.18 | 2.30 | Downtown |
| 10 | 32.03736 | 118.8544 | 15.76 | 2.95 | Downtown |
| 11 | 32.04191 | 118.8267 | 13.51 | 9.95 | Downtown |
| 12 | 32.02359 | 118.784 | 63.51 | 14.13 | Downtown |
| 13 | 32.02309 | 118.7852 | 59.53 | 12.67 | Downtown |
| 14 | 32.0433 | 118.7809 | 15.96 | 3.93 | Downtown |
| 15 | 32.00723 | 118.7869 | 10.62 | 2.00 | Downtown |
| 16 | 32.01504 | 118.7851 | 10.82 | 2.43 | Downtown |
| 17 | 32.04278 | 118.7788 | 31.10 | 4.67 | Downtown |
| 18 | 32.07247 | 118.7819 | 8.26 | 2.38 | Downtown |
| 19 | 32.07673 | 118.788 | 0.31 | 0.25 | Downtown |
| 20 | 32.06998 | 118.7753 | 15.28 | 2.98 | Downtown |
| 21 | 32.06879 | 118.7732 | 23.95 | 5.43 | Downtown |
| 22 | 32.03974 | 118.7804 | 66.00 | 17.03 | Downtown |
| 23 | 32.04281 | 118.7795 | 36.30 | 14.50 | Downtown |
| 24 | 32.05854 | 118.7348 | 6.49 | 1.00 | Downtown |
| 25 | 32.04743 | 118.73 | 1.83 | 0 | Downtown |
| 26 | 32.03021 | 118.7337 | 18.99 | 1.28 | Downtown |
| 27 | 32.0242 | 118.7761 | 25.23 | 5.78 | Downtown |
| 28 | 32.01619 | 118.777 | 20.32 | 5.23 | Downtown |
| 29 | 31.99473 | 118.7566 | 10.88 | 3.90 | Downtown |
| 30 | 31.99322 | 118.7342 | 8.96 | 3.73 | Downtown |
| 31 | 31.99556 | 118.7363 | 14.70 | 6.30 | Downtown |
| 32 | 31.99979 | 118.7298 | 9.89 | 3.33 | Downtown |
| 33 | 31.99787 | 118.7166 | 15.52 | 5.73 | Downtown |
| 34 | 31.99283 | 118.7126 | 10.88 | 3.98 | Downtown |
| 35 | 31.98627 | 118.7114 | 17.95 | 9.05 | Downtown |
| 36 | 31.9845 | 118.713 | 11.48 | 2.68 | Downtown |
| 37 | 31.98266 | 118.7146 | 10.19 | 3.23 | Downtown |
| 38 | 32.20424 | 118.708 | 6.44 | 2.67 | NUIST Campus |
| 39 | 32.20275 | 118.7088 | 1.46 | 0.48 | NUIST Campus |
| 40 | 32.20774 | 118.7193 | 0.18 | 0 | NUIST Campus |
| 41 | 32.20889 | 118.7152 | 8.08 | 3.10 | NUIST Campus |
| 42 | 32.20755 | 118.7114 | 2.34 | 0.97 | NUIST Campus |
| 43 | 32.20482 | 118.7116 | 0.42 | 0 | NUIST Campus |
| 44 | 32.20289 | 118.7108 | 0.18 | 0 | NUIST Campus |
| Region | Remotely-Sensed Ev Map | Google Earth Image |
|---|---|---|
| Lukou International Airport |  |  |
| Xinjiekou |  |  |
| Xianlin Lake |  |  |
| Pukou Avenue |  |  |
| Yangzi Petrochemical |  |  |
© 2020 by the authors. Licensee MDPI, Basel, Switzerland. This article is an open access article distributed under the terms and conditions of the Creative Commons Attribution (CC BY) license (http://creativecommons.org/licenses/by/4.0/).
Share and Cite
Li, J.; Xu, Y.; Cui, W.; Ji, M.; Su, B.; Wu, Y.; Wang, J. Investigation of Nighttime Light Pollution in Nanjing, China by Mapping Illuminance from Field Observations and Luojia 1-01 Imagery. Sustainability 2020, 12, 681. https://doi.org/10.3390/su12020681
Li J, Xu Y, Cui W, Ji M, Su B, Wu Y, Wang J. Investigation of Nighttime Light Pollution in Nanjing, China by Mapping Illuminance from Field Observations and Luojia 1-01 Imagery. Sustainability. 2020; 12(2):681. https://doi.org/10.3390/su12020681
Chicago/Turabian StyleLi, Jiayi, Yongming Xu, Weiping Cui, Meng Ji, Boyang Su, Yuyang Wu, and Jing Wang. 2020. "Investigation of Nighttime Light Pollution in Nanjing, China by Mapping Illuminance from Field Observations and Luojia 1-01 Imagery" Sustainability 12, no. 2: 681. https://doi.org/10.3390/su12020681
APA StyleLi, J., Xu, Y., Cui, W., Ji, M., Su, B., Wu, Y., & Wang, J. (2020). Investigation of Nighttime Light Pollution in Nanjing, China by Mapping Illuminance from Field Observations and Luojia 1-01 Imagery. Sustainability, 12(2), 681. https://doi.org/10.3390/su12020681