Article

Foraging Wild Food in Urban Spaces: The Contribution of Wild Foods to Urban Dietary Diversity in South Africa

by
Hesekia Garekae
* and
Charlie M. Shackleton
Department of Environmental Science, Rhodes University, Grahamstown 6140, South Africa
*
Author to whom correspondence should be addressed.
Sustainability 2020, 12(2), 678; https://doi.org/10.3390/su12020678
Submission received: 19 November 2019 / Revised: 31 December 2019 / Accepted: 4 January 2020 / Published: 16 January 2020

Abstract

:
Globally, approximately one billion people benefit from contributions of wild foods to their food security and dietary diversity. Wild foods are known to be important in rural communities in terms of food and micronutrient provision, diversifying diets, reducing vulnerability to non-communicable diseases and overall health. However, the potential contribution of wild foods towards food security and dietary diversity in urban food systems has been largely overlooked. This study examined the contribution of wild foods to household dietary diversity in two towns in South Africa, based on a survey of 137 households. Household diets were quite diverse, with half (51%) having consumed ≥ 8 food groups, 39% consumed 6 or 7 food groups, and only 10% recorded ≤ 5 food groups in the previous 48 h. Wild foods were prevalent across the sample, with 62% of the households consuming them to some degree. Wild vegetables and fruits were the most common wild foods, consumed by 96 and 79% of the households, respectively. Although wild foods had limited significance on overall dietary diversity, they exhibited substantial contributions within particular food groups. For example, the consumption of vegetables and oil and fats was most prevalent among households consuming wild foods than those who did not. The findings show that wild foods could contribute towards diversifying urban diets at a micro-level, within particular food groups consumed, such as vegetables and fruits. Hence, wild foods are important in ameliorating the monotonous diets of some households and in turn promoting dietary diversity.

1. Introduction

Food security remains a topical developmental problem worldwide, despite the global efforts of halving the proportion of people undernourished [1,2,3]. More than 820 million people worldwide are undernourished, with the greatest proportions situated in developing countries [4]. The prevalence rate of undernourishment is most alarming in Africa and Asia, being 20 and 13%, respectively [4]. In Africa, the prevalence rate is highest in the eastern region (30.8%) while lowest in the southern region (8.0%) [4]. Despite the lower prevalence rate of undernourishment in southern Africa, some countries are still battling with high income inequality and poverty, which frequently translates into inadequate access to food despite its availability. This is the case for South Africa, which is considered food secure at national level but not at household level [5].
In South Africa, nearly half (46%) of the people were food secure, while 28% were at the risk of hunger and 26% regularly experienced it [6]. Although the prevalence of food insecurity was higher in the rural formal (29%) (Rural formal refers to areas under tribal land such as villages, which are still governed by traditional authorities) than urban formal localities (19%) (Urban formal refers to structured and organized areas under the jurisdiction of local government such as townships and suburbs), the risk of experiencing hunger was slightly high in the urban formal (26%) than rural formal (20%) areas [6]. Similarly, the risk of hunger was slightly high in urban informal (36%) than rural informal (33%) areas. In 2017, almost two-thirds (63%) of the households who experienced hunger were living in urban areas [5]. Since poverty is generally associated with greater experiences of hunger [7], urban dwellers are more vulnerable to food insecurity and undernourishment, given the shift in the locus of poverty from rural to urban areas [8,9]. Moreover, the market-based economy and undiversified urban livelihoods exacerbate the prevalence of urban food insecurity [10]. For example, studies have noted that many poor urban households spend at least half of their monthly expenditure to food purchases [2,10,11]. Therefore, those with limited income to transact in the urban market might find it hard to ensure adequate food supply despite the availability of food in stores.
However, some urban people diversify livelihood and food acquisition activities in a bid to ameliorate their vulnerability to food insecurity and undernourishment. Some of these activities include urban agriculture, foraging of wild foods and collection of non-timber forest products (NTFPs). The potential contribution of urban agriculture to food security and dietary diversity has received enormous attention [12,13,14,15]. Approximately 1.3 billion people worldwide participate in urban agriculture. In Africa, about 40% of urban people engage in urban agriculture [13,16]. Similarly, some urban people forage wild foods. About one billion people worldwide collect wild foods for food security and dietary diversity [17,18]. Wild foods are important in terms of food and micronutrient provision, enriching diets and as a source of income generation [17,19]. Hence, wild foods are an integral part of livelihood sustenance for many [20]. In regard to nutrition, some wild foods are rich in micronutrients compared to many conventional foods [21,22,23]. Wild foods are advocated as a vital food sources for attaining the World Health Organization (WHO) recommended minimum daily intake of 400 g of vegetables and fruits per person per day [24]. Overall, wild foods are critical in curbing malnutrition, reducing vulnerability to non-communicable diseases and overall good health.
In developing countries, many of poor peoples’ diets are monotonous, typically composed of staple cereals and very limited intake of vegetables and fruits [25]. Hence, wild foods, particularly wild vegetables and fruits, could diversify diets and, in turn, reduce the vulnerability to micronutrient deficiencies. For example, wild foods purchased from urban informal markets made a substantial contribution to diets and dietary diversity in the cities of Buea, Limbe and Yaoundé in Cameroon [11]. This underscores the importance of understanding the contribution of wild foods sourced within the urban environment, as proximity to the plant resources might sustain foraging. In South Africa, wild foods emerged as the third most common food source after large-scale commercial and small-scale food production, respectively, especially in rural and peri-urban areas [26]. Moreover, wild foods act as important safety nets during times of livelihood shocks and risks [27]. Some wild plant species are resilient to adverse climatic conditions; hence, they can be a critical source of food during times of food scarcity and deficit such as drought [28].
There are increasing studies on urban foraging of wild foods worldwide [29]. They provide insights on forageable species, forager profiles, perceptions and motivations to foraging, knowledge production and sharing, and toxicology of wild species [30,31,32,33]. Nevertheless, the potential contribution of wild foods towards food security and dietary diversity in urban food systems has rarely been examined [34]. Wild foods are often overlooked in national and regional food composition data [20]. Consequently, this results in limited appreciation and acknowledgement of the contribution of wild foods to urban diets [35]. This may result in designing food insecurity and undernourishment interventions which fail to acknowledge other food sources contributing to household food baskets, such as wild foods. Therefore, understanding the role of wild foods in urban food systems is pivotal in formulation of holistic food security policies and interventions, informed urban planning and demarcation of compatible urban land-use types. This calls for more research to elucidate the contribution of wild foods to urban diets. Hence, the aim of this study was to examine the contribution of wild foods to household dietary diversity in two towns in South Africa. Specifically, the following research questions were addressed: (1) What is the composition and diversity of household diets? (2) How does dietary diversity differ across a range of household attributes? (3) What is the pattern of wild foods consumption? (4) What is the contribution of wild foods to household dietary diversity?

2. Methods

2.1. Study Area

The study was undertaken in two medium-sized towns in South Africa, Potchefstroom and Thabazimbi (Figure 1). Potchefstroom (26°42′35″ S; 27°5′49″ E) is located in North West province while Thabazimbi (24°35′30″ S; 27°24′42″ E) in Limpopo. Approximately 250,000 people resides in Potchefstroom and 28,847 in Thabazimbi [36,37]. About three-quarters of the residents live in formal dwellings, albeit with varying household income levels [36]. Thabazimbi is situated in the province with the highest proportion of households (94%) having adequate access to food [5]. In contrast, North West province has the highest proportion of households (25%) reporting inadequate access to food, which is higher than the national rate of 16% [5]. The unemployment rate at the local municipal level is 21.6% for Potchefstroom and 20.6% for Thabazimbi. Nearly half of the people in the local municipality hosting Potchefstroom had some secondary (46.5%) and primary (42.9%) education whiles a few attained tertiary (4.9%). In regard to the local municipality for Thabazimbi, two-thirds (63.9%) had some secondary education while a few attained primary (19.4%) and tertiary (7.6%) [38]. The provinces hosting the two towns are hard hit by abject poverty, with the prevalence rate standing at 70% for Limpopo (Thabazimbi) and 64.3% for North West (Potchefstroom) [39]. Mining, manufacturing, agriculture and tourism are the dominant economic activities in the study towns [37,40]. Potchefstroom lies in the grassland biome and Thabazimbi is in the savanna [41].

2.2. Data Collection

Multi-stage sampling was employed in selecting study participants. The study towns were stratified into four socio-economic zones: informal, RDP (Reconstruction and Development Program), township and affluent. Following Kaoma and Shackleton [42], informal settlements are residential areas established by the newly migrants in towns or cities, without being sanctioned by the municipal officials. The RDP houses are a high density residential area, comprising of a national housing program by the post-apartheid government for the indigent. While the township and affluent suburbs are medium and low density residential areas, which were formerly occupied by the black South Africans and the whites, respectively. Then, 50 households per zone were randomly sampled using ArcMap 10. However, the actual sample sized attained was 374 households, with 62% acknowledging foraging wild foods. Based on foraging frequency, 31% of the foragers were considered for this study, i.e., 72 participants, along with sample of non-foragers. The households were visited and asked whether or not they consume wild foods, with those affirming being omitted from the sampling frame and the next household visited. A total of 65 non-foragers were sampled. The sample size accounted to 137 households. The survey was conducted between January and March 2019.
A survey questionnaire comprising of three sections was administered to the participants. Firstly, dietary intake was elicited based on a recall of all food prepared and consumed within the household during the past 48 h [43]. In regard to meals composed of mixed dishes, the respondents were asked to detail all the ingredients used and their equivalent sources. The dietary recall questions were specifically asked to the person who prepared the household meals. Secondly, the questionnaire narrowed down to wild foods. This section enquired on the types of wild foods consumed, frequency of consumption, months of consumption and perceptions towards wild foods. Lastly, respondents’ demographic and socio-economic backgrounds were captured. Perceptions towards wild foods were assessed through 15 evaluative statements rated according to five-point Likert scale options, ranging from two extremes: very negative to very positive. The order of favorable and unfavorable statements was randomized to curb bias. For computing a household wealth index, the respondents were asked to identify the total number of each of various assets owned (such as car, tractor, motorbike, bicycle, cattle, goats, fridge, television, radio and cell-phone), which were then normalized per asset and totaled. All ethical protocols were observed (No. ES18/04)

2.3. Dietary Diversity Score

Information on all the foods consumed, including their ingredients, was coded into the following 12 food groups following FAO [43]: (1) Cereals, (2) white roots and tubers, (3) vegetables, (4) fruits, (5) meat, (6) eggs, (7) fish and seafood, (8) legumes, nuts and seeds, (9) Milk and milk products, (10) Oil and fats, (11) Sweets and (12) Spices, beverages and condiments. Consumption of a particular food group was assigned a score of one, or zero for none. A composite score was then computed by summing across the 12 food groups. This score is termed ‘household dietary diversity score’ (HDDS), and ranges between zero and twelve. Following FAO [44], HDDS was categorized into three groups: Poor diversity (≤5), average diversity (6–7), and good diversity (≥8).

2.4. Data Analysis

Statistical Package for Social Sciences (SPSS) version 21 was used for managing data. Measures of central tendency and dispersion, frequencies and proportions were used for summarizing descriptive data. Chi-square tests were used to establish associations between diet composition and perceptions towards wild foods against location of residence and between foragers and non-foragers. One-way analysis of variance (ANOVA) and t-tests were used to assess significant differences in HDDS between and within towns and foraging status. A Generalized Linear Model (GLM) was conducted to determine the predictive ability of households’ demographic and socio-economic attributes towards HDDS. The data was subjected to normality test using Shapiro-Wilk test and no violations were observed. Since perceptions were assessed by a set of 15 evaluative statements, they were subjected to an internal consistency reliability test using Cronbach coefficient alpha, which returned a value of 0.84, suggesting a very good internal consistency of the scale items.

3. Results

3.1. Respondent Profile

The sample consisted of 137 respondents with an average age of 45.5 ± 13.8 years, ranging from 22 to 81 years (Table 1). Females constituted the majority (70.1%). About 57.9% of the respondents had some secondary education while a few attained primary (24.1%) and tertiary (6.8%) levels. However, 11.3% of the respondents had not received any formal education. Nearly half (46%) of the respondents were unemployed, 22.6% and 13.9% were employed on full and part-time basis, respectively, while 10.2% were retired. Household income was variable, with almost half (49.3%) of the respondents self-reporting low income while a few (14.2%) regarded themselves as better off. The proportion of monthly expenditure on food was highly variable with about 34.1% allocating 51–80% of their monthly income on food purchases, and 33.3% spending 21–50%. A few (13.3%) respondents spent over 80% of their household monthly income on food (Table 1). The mean wealth index was 1.5 ± 0.86, ranging from 0.2 to 5.3 across the sample. The average household size comprised of 4.4 ± 2.4 persons, ranging from one to thirteen people. Most of the respondents (71.5%) grew up in rural settings. An overwhelming majority (92%) grew up in a household that used to forage wild foods while only 8% did not.

3.2. Food Consumption Composition

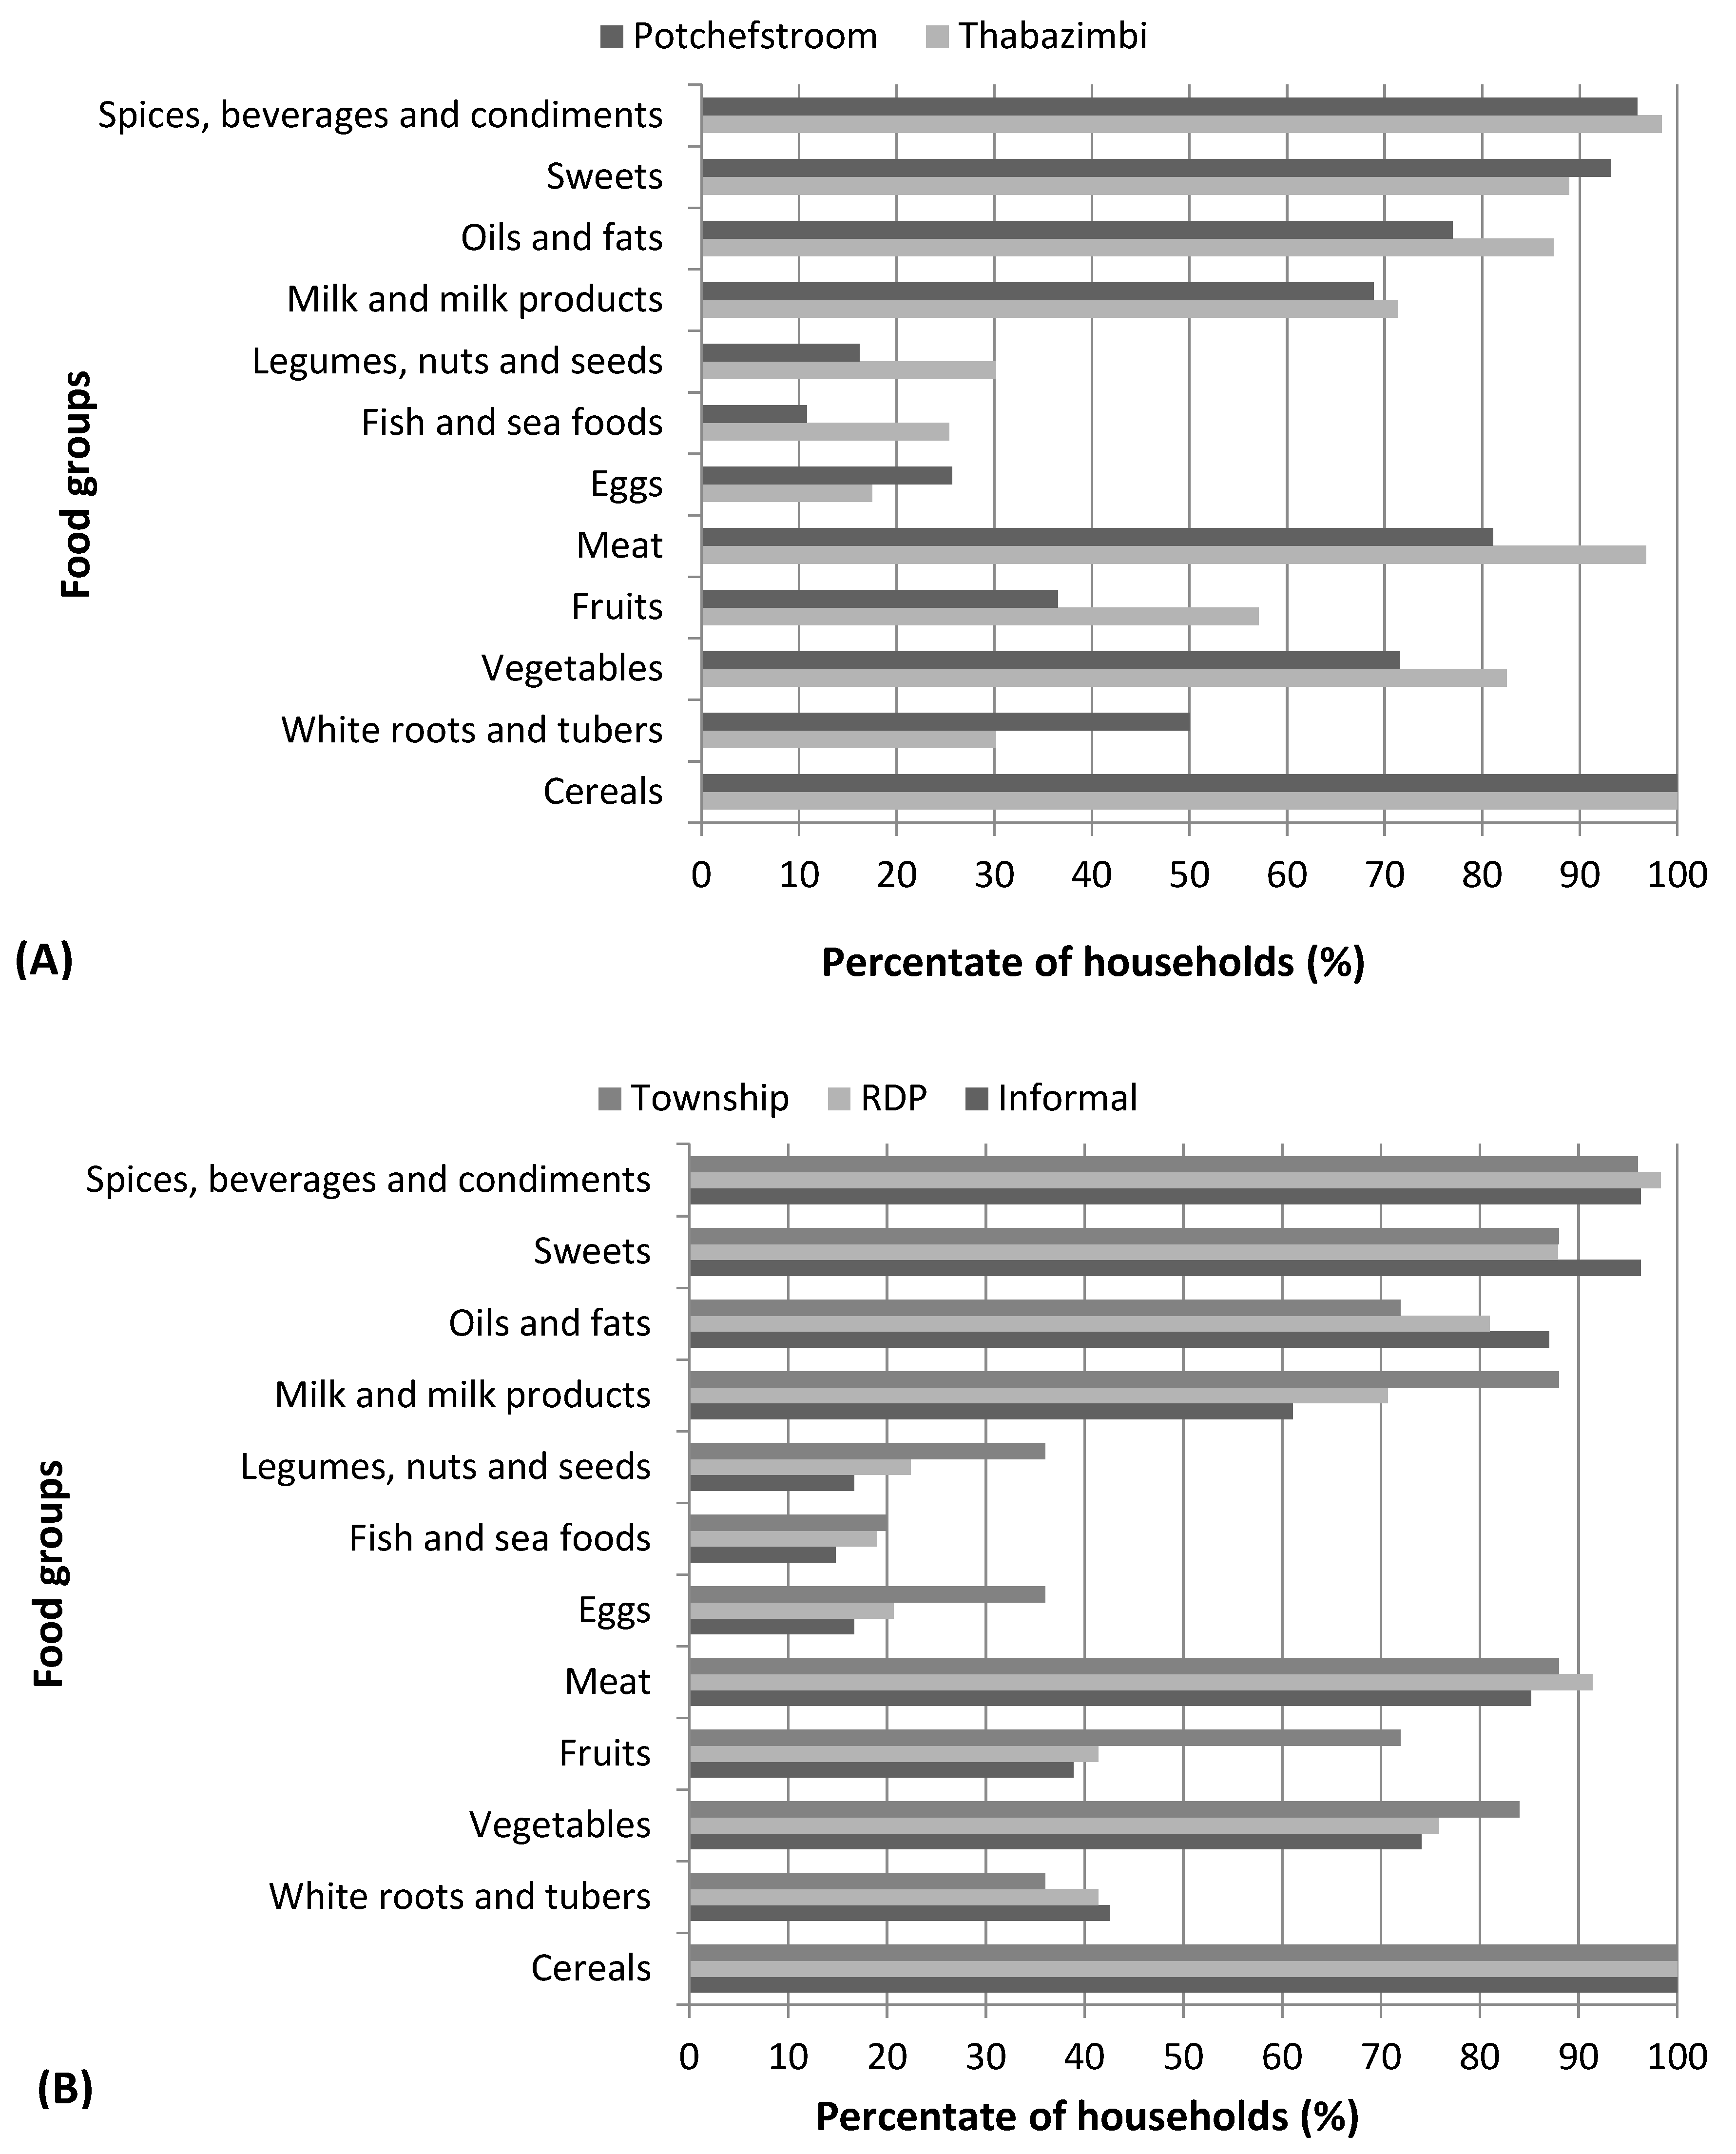
Households’ diets varied across the 12 food groups. All households consumed food items from the cereal group during the 48 h recall period (Figure 2A). Of this food group, maize-meal and bread were the two most consumed food items. Spices (97.1%), sweets (91.2%), meat (88.3%), oil and fats (81.8%), vegetables (76.6%) and milk (70.1%) were also prevalent food groups (Figure 2A). Under spices, salt and tea were the most common food items while sugar for sweets. Chicken was the most frequent type of meat, followed by beef. Onions and tomatoes were the most consumed vegetables. On average, the aforementioned food groups accounted to more than half of the different food groups contributing to the HDDS. Fruits (46%) and white roots and tubers (40.9%) were consumed by nearly half of the households. Apples and bananas were the most frequently consumed fruits. Potatoes were the only food item consumed under white roots and tubers. On the other hand, the least consumed food groups were legumes, nuts and seeds (22.6%), fish and seafoods (21.9%) and eggs (21.9%).
The diet was fairly uniform within the towns, although the incidence of consuming food items from white roots and tubers, fruits, meat and fish and seafoods significantly differed between the towns (Figure 2A). Fruits, meat, fish and seafoods were more common in Thabazimbi than in Potchefstroom (χ21, 137 = 5.04, p = 0.02; χ21, 137 = 6.72, p = 0.01; χ21, 137 = 4.05, p = 0.04, respectively). White roots and tubers were more prevalent in Potchefstroom than Thabazimbi (χ21, 137 = 4.75, p = 0.02). There was no significant difference in sweets, eggs, vegetables, milk, oil and fats, spices and legumes, nuts and seeds.
Within the towns, a significant difference was evident only for the proportion of fruits consumed across location of residence (Figure 2B). Township residents were more likely to consume fruits compared to RDP and informal residents (χ22, 137 = 8.40, p = 0.02). Similarly, vegetables, milk, eggs and legumes, nuts and seeds were consumed slightly more by township residents, although not significantly different to one another.
Across the sample, all households purchased most of the food consumed in the previous 48 h. Very few had complemented with foraging wild food (19.7%) and self-production (2.9%). Generally, there was minimum variation in food acquisition between and within the towns, except for foraging. Households in Thabazimbi (22.2%) were more likely to complement their main food source with foraging wild foods than those in Potchefstroom (17.6%). The same applies to informal (22.2%) and RDP (20.7%) households across the sample.
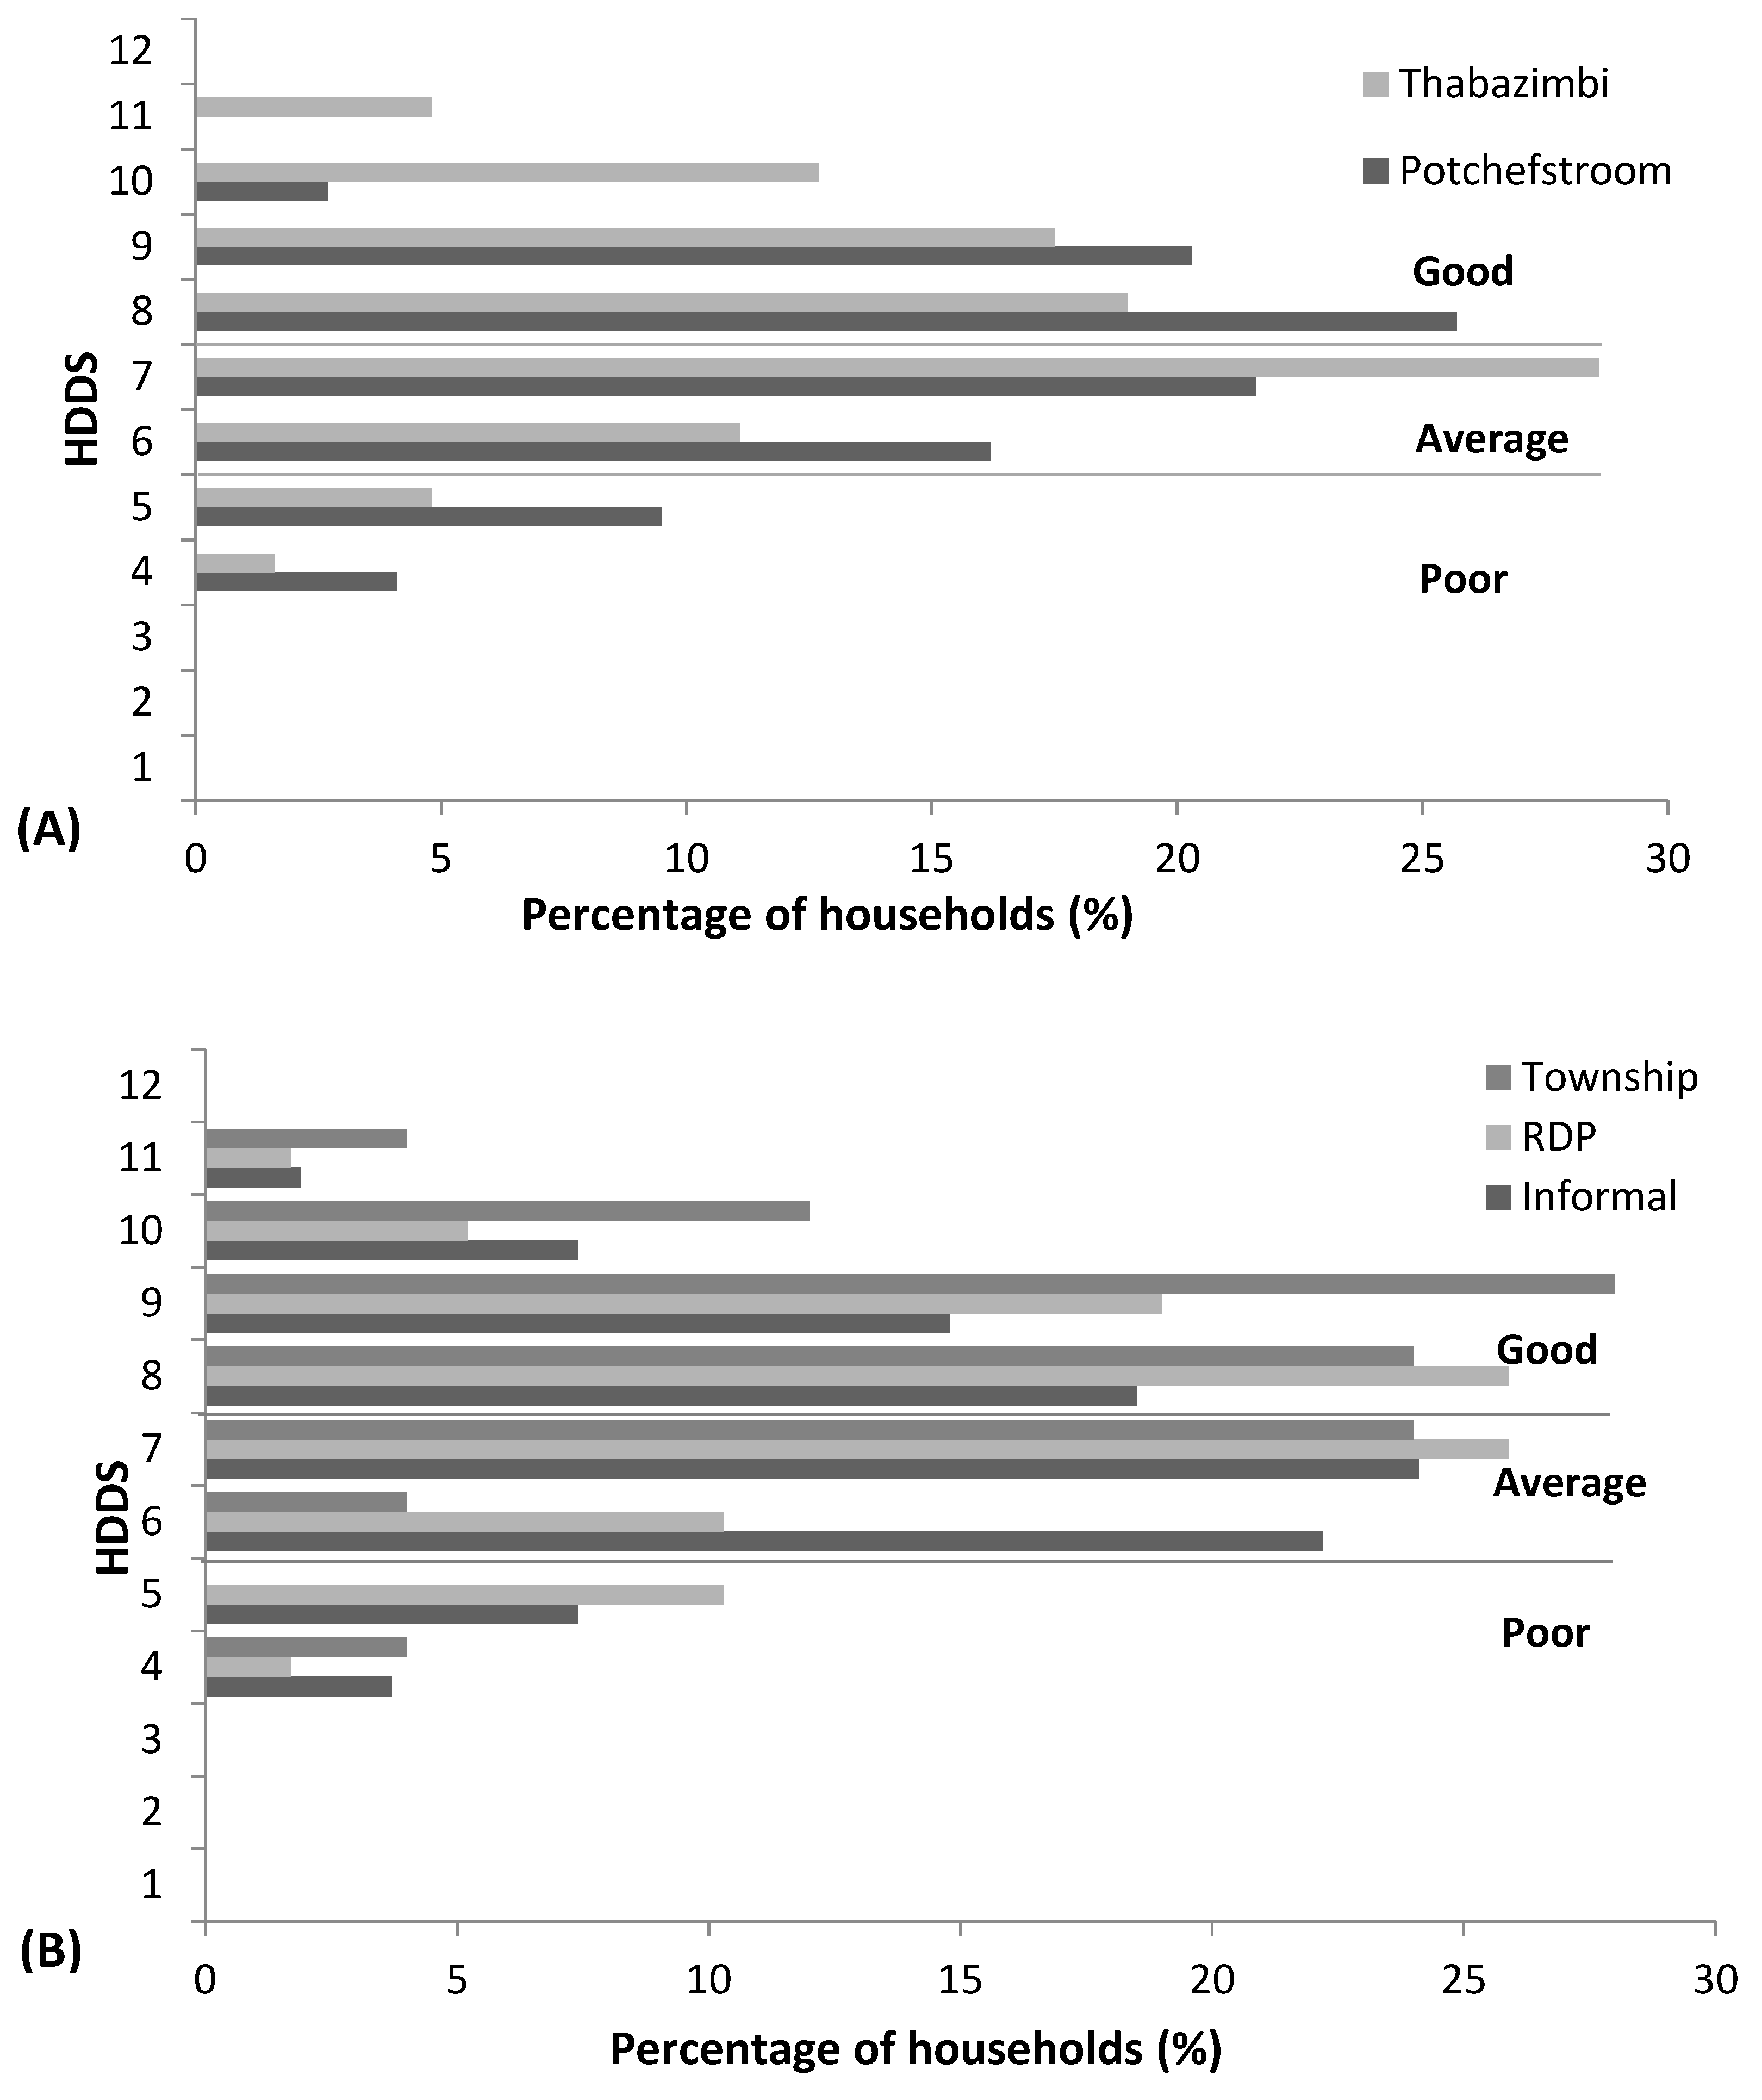
The HDDS was moderate across the sample, averaging 7.5 ± 1.55 food groups, ranging from 4 to 11. Household dietary diversity score significantly differed between towns (t137 = 2.24, p = 0.03), being slightly higher in Thabazimbi (7.9 ± 1.59) than Potchefstroom (7.3 ± 1.47) (Figure 3A). The HDDS did not differ with location of residence (F2, 137 = 2.75, p = 0.07). Nonetheless, the mean HDDS for township residents was higher (8.2 ± 1.49) than for RDP households (7.5 ± 1.49) and informal (7.3 ± 1.60) ones. Figure 3B demonstrates that RDP and township household diets were generally quite diverse, with about half (51.7%) and two-thirds (68%) of them, respectively, consuming eight or more food groups. Informal residents recorded moderate dietary diversity, with nearly half (46.3%) consuming 6–7 food groups.

Socio-Economic and Demographic Factors Influencing HDDS

The odds of displaying higher HDDS increased with wealth index and education level (Table 2). Household dietary diversity scores did not differ against gender, age, employment status, proportion of income on food, social grants, household size and household income.

3.3. Wild Foods

Over half (62.1%) of the foragers contacted during the main survey reported gathering wild foods at various frequencies. Vegetables and fruits were the most common wild foods, consumed by 95.8% and 79.2% of the respondents, respectively. Fruits were consumed the most by RDP households (43.9%), while vegetables were most prevalent among informal households (43.5%). Besides, 40.4% of the informal households consumed fruits while 39.2% of the RDP consumed vegetables. In regard to the township, 17.4% and 15.8% consumed vegetables and fruits, respectively. However, the incidence of wild food consumption did not differ between (χ22, 137 = 0.04, p = 0.73) and within towns (χ22, 137 = 0.42, p = 0.81) and relative to household income (χ22, 137 = 5.38, p = 0.07).

3.3.1. Patterns of Wild Food Consumption

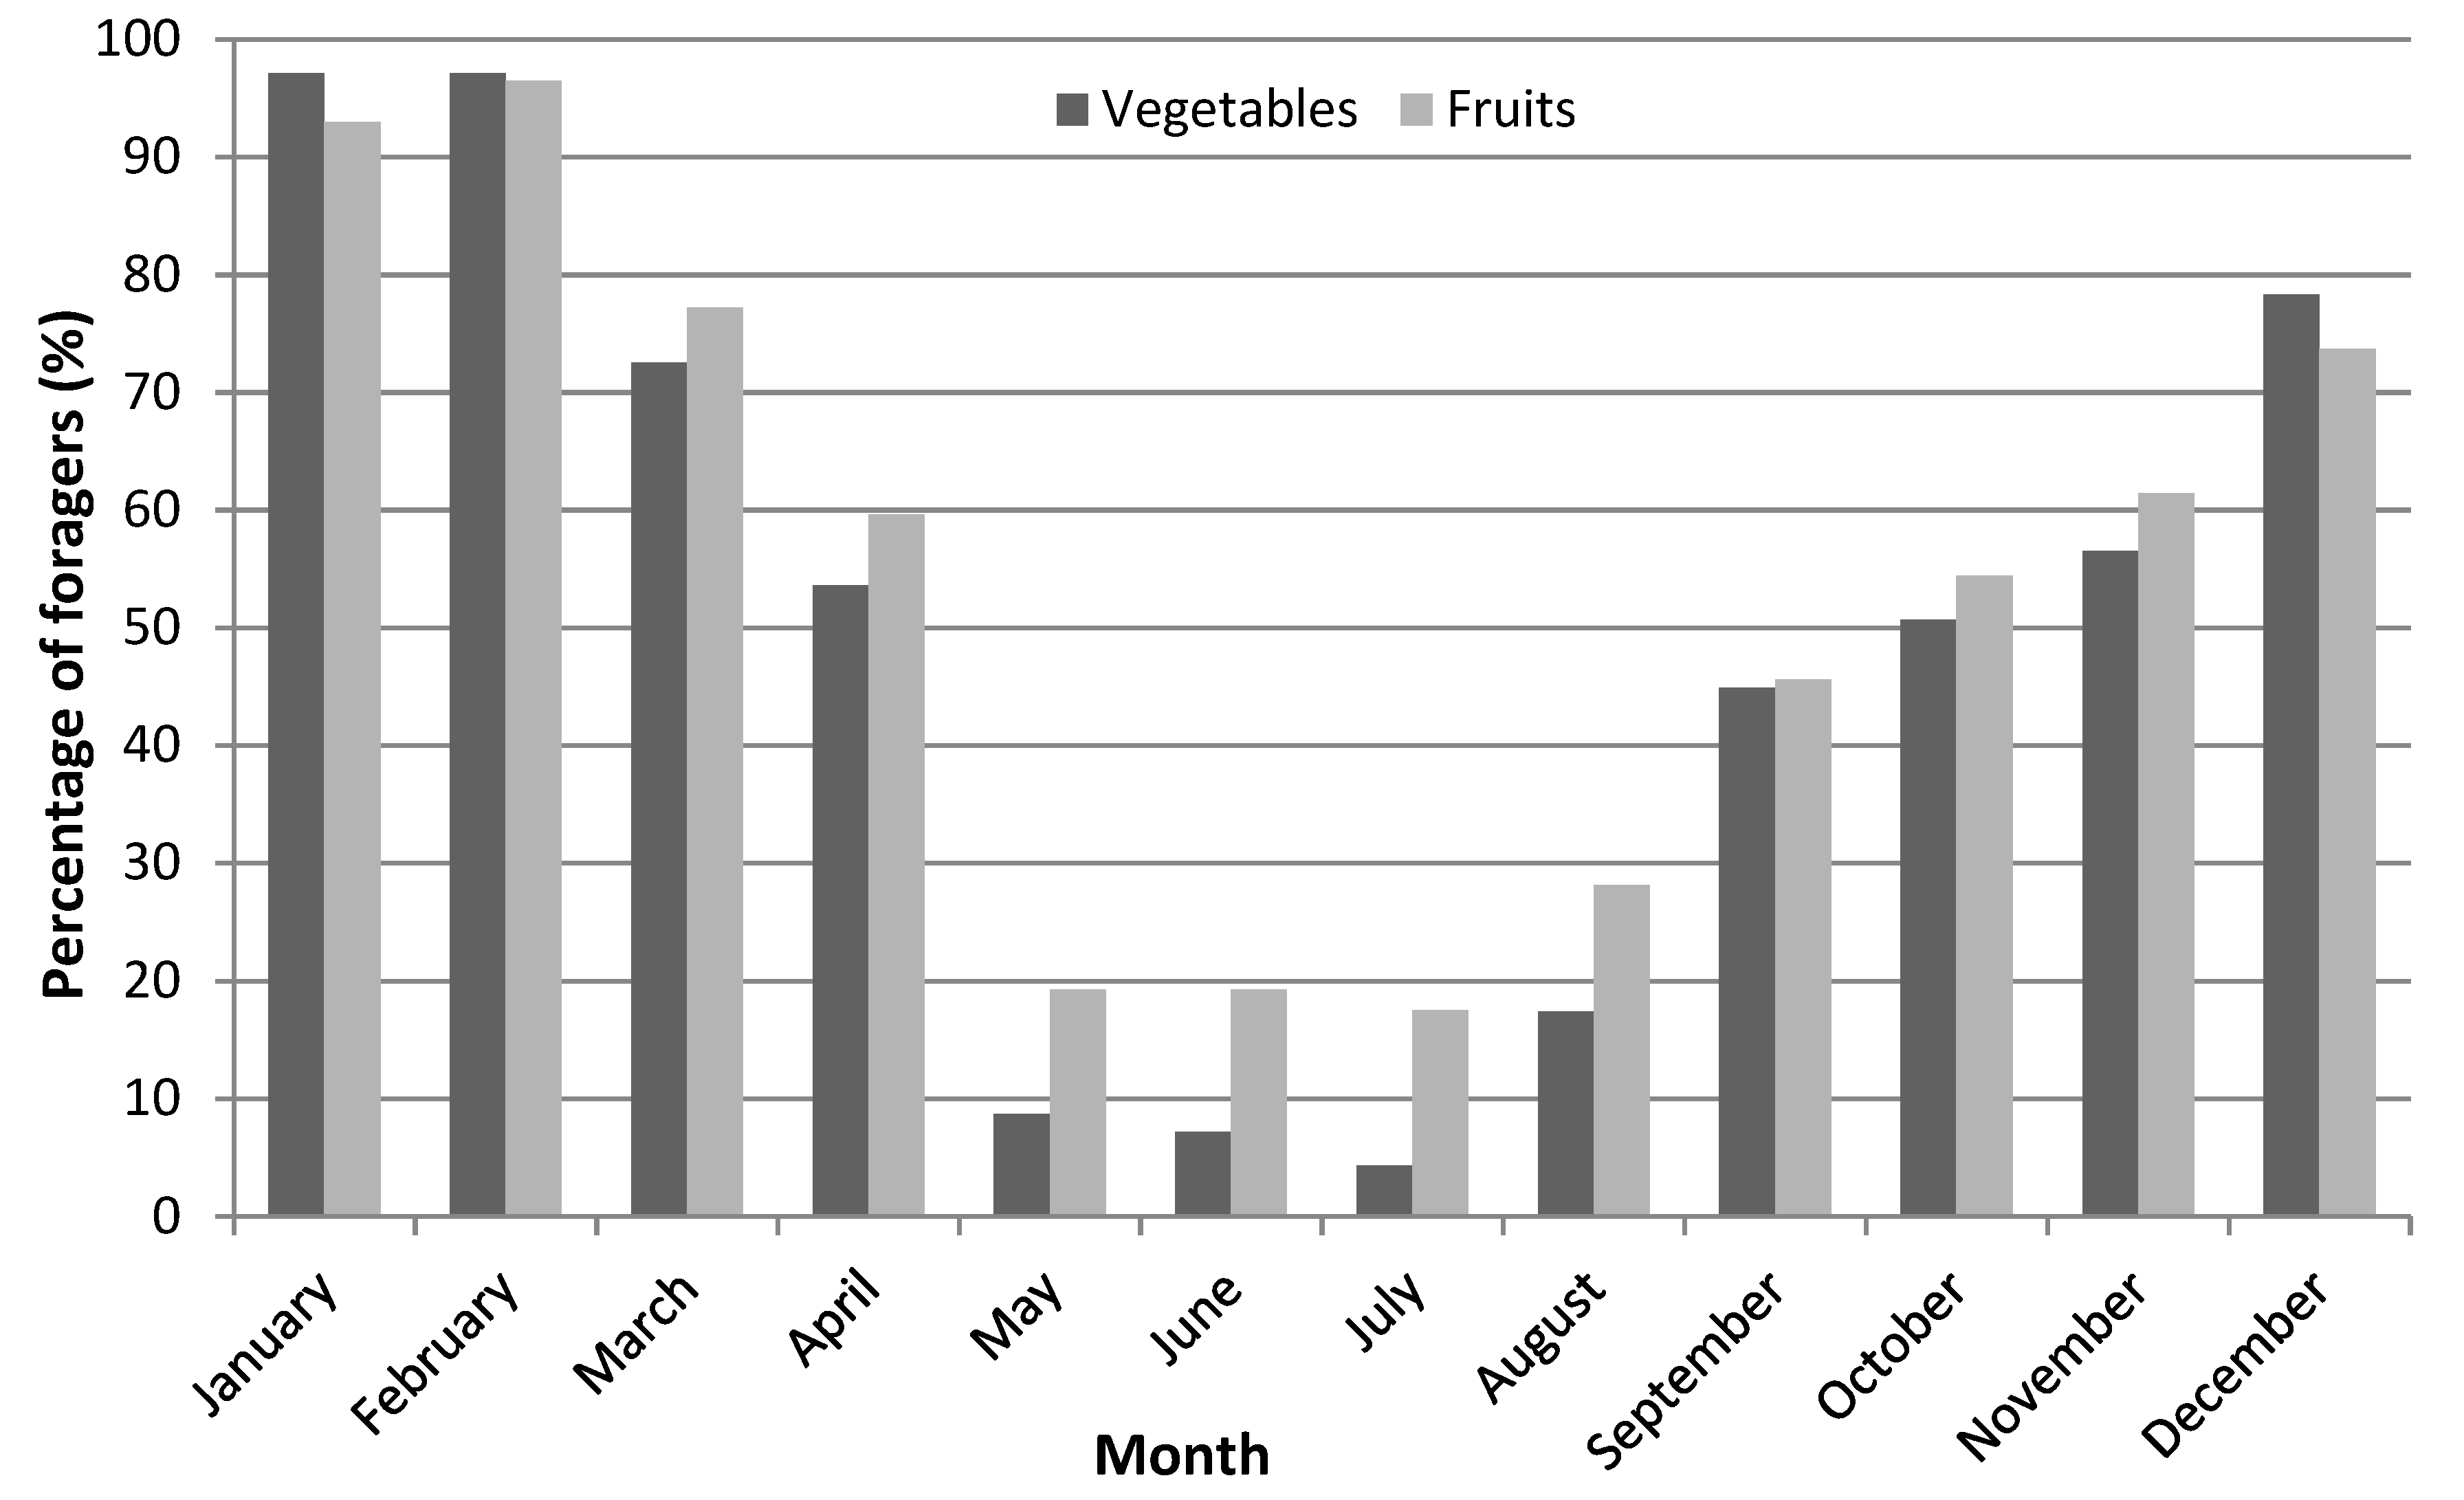
Wild foods were consumed on a regular basis, but with differences between species. Some wild fruit species were rarely consumed, but most were consumed a few times per year (Figure 4). Overall, the modal frequency for wild vegetable consumption was at least one to three times per week. No wild foods were consumed on a daily basis. Wild vegetables were normally served with lunch and on average, accounted for almost half of the particular meal served, in quantity. Wild fruits were eaten as a snack at any time of the day. Although wild foods were generally consumed throughout the year, the intensity of consumption of each type varied seasonally (Figure 5). Both vegetables and fruits were mostly consumed during the rainy season as compared to the dry season (Figure 5).
Fruits were sourced through self-collection, and vegetables were mostly self-collected (94.2%), purchased from street vendors (4.3%), or solicited from friends (1.4%). Wild foods were sourced from a variety of spaces: domestic gardens, riparian zones and vacant spaces. Vacant spaces and domestic gardens were mostly visited for foraging both wild food types while riparian zones were solely for vegetables. Peri-urban farms were also visited for collecting vegetables.

3.3.2. The Contribution of Wild Foods to Household Dietary Diversity

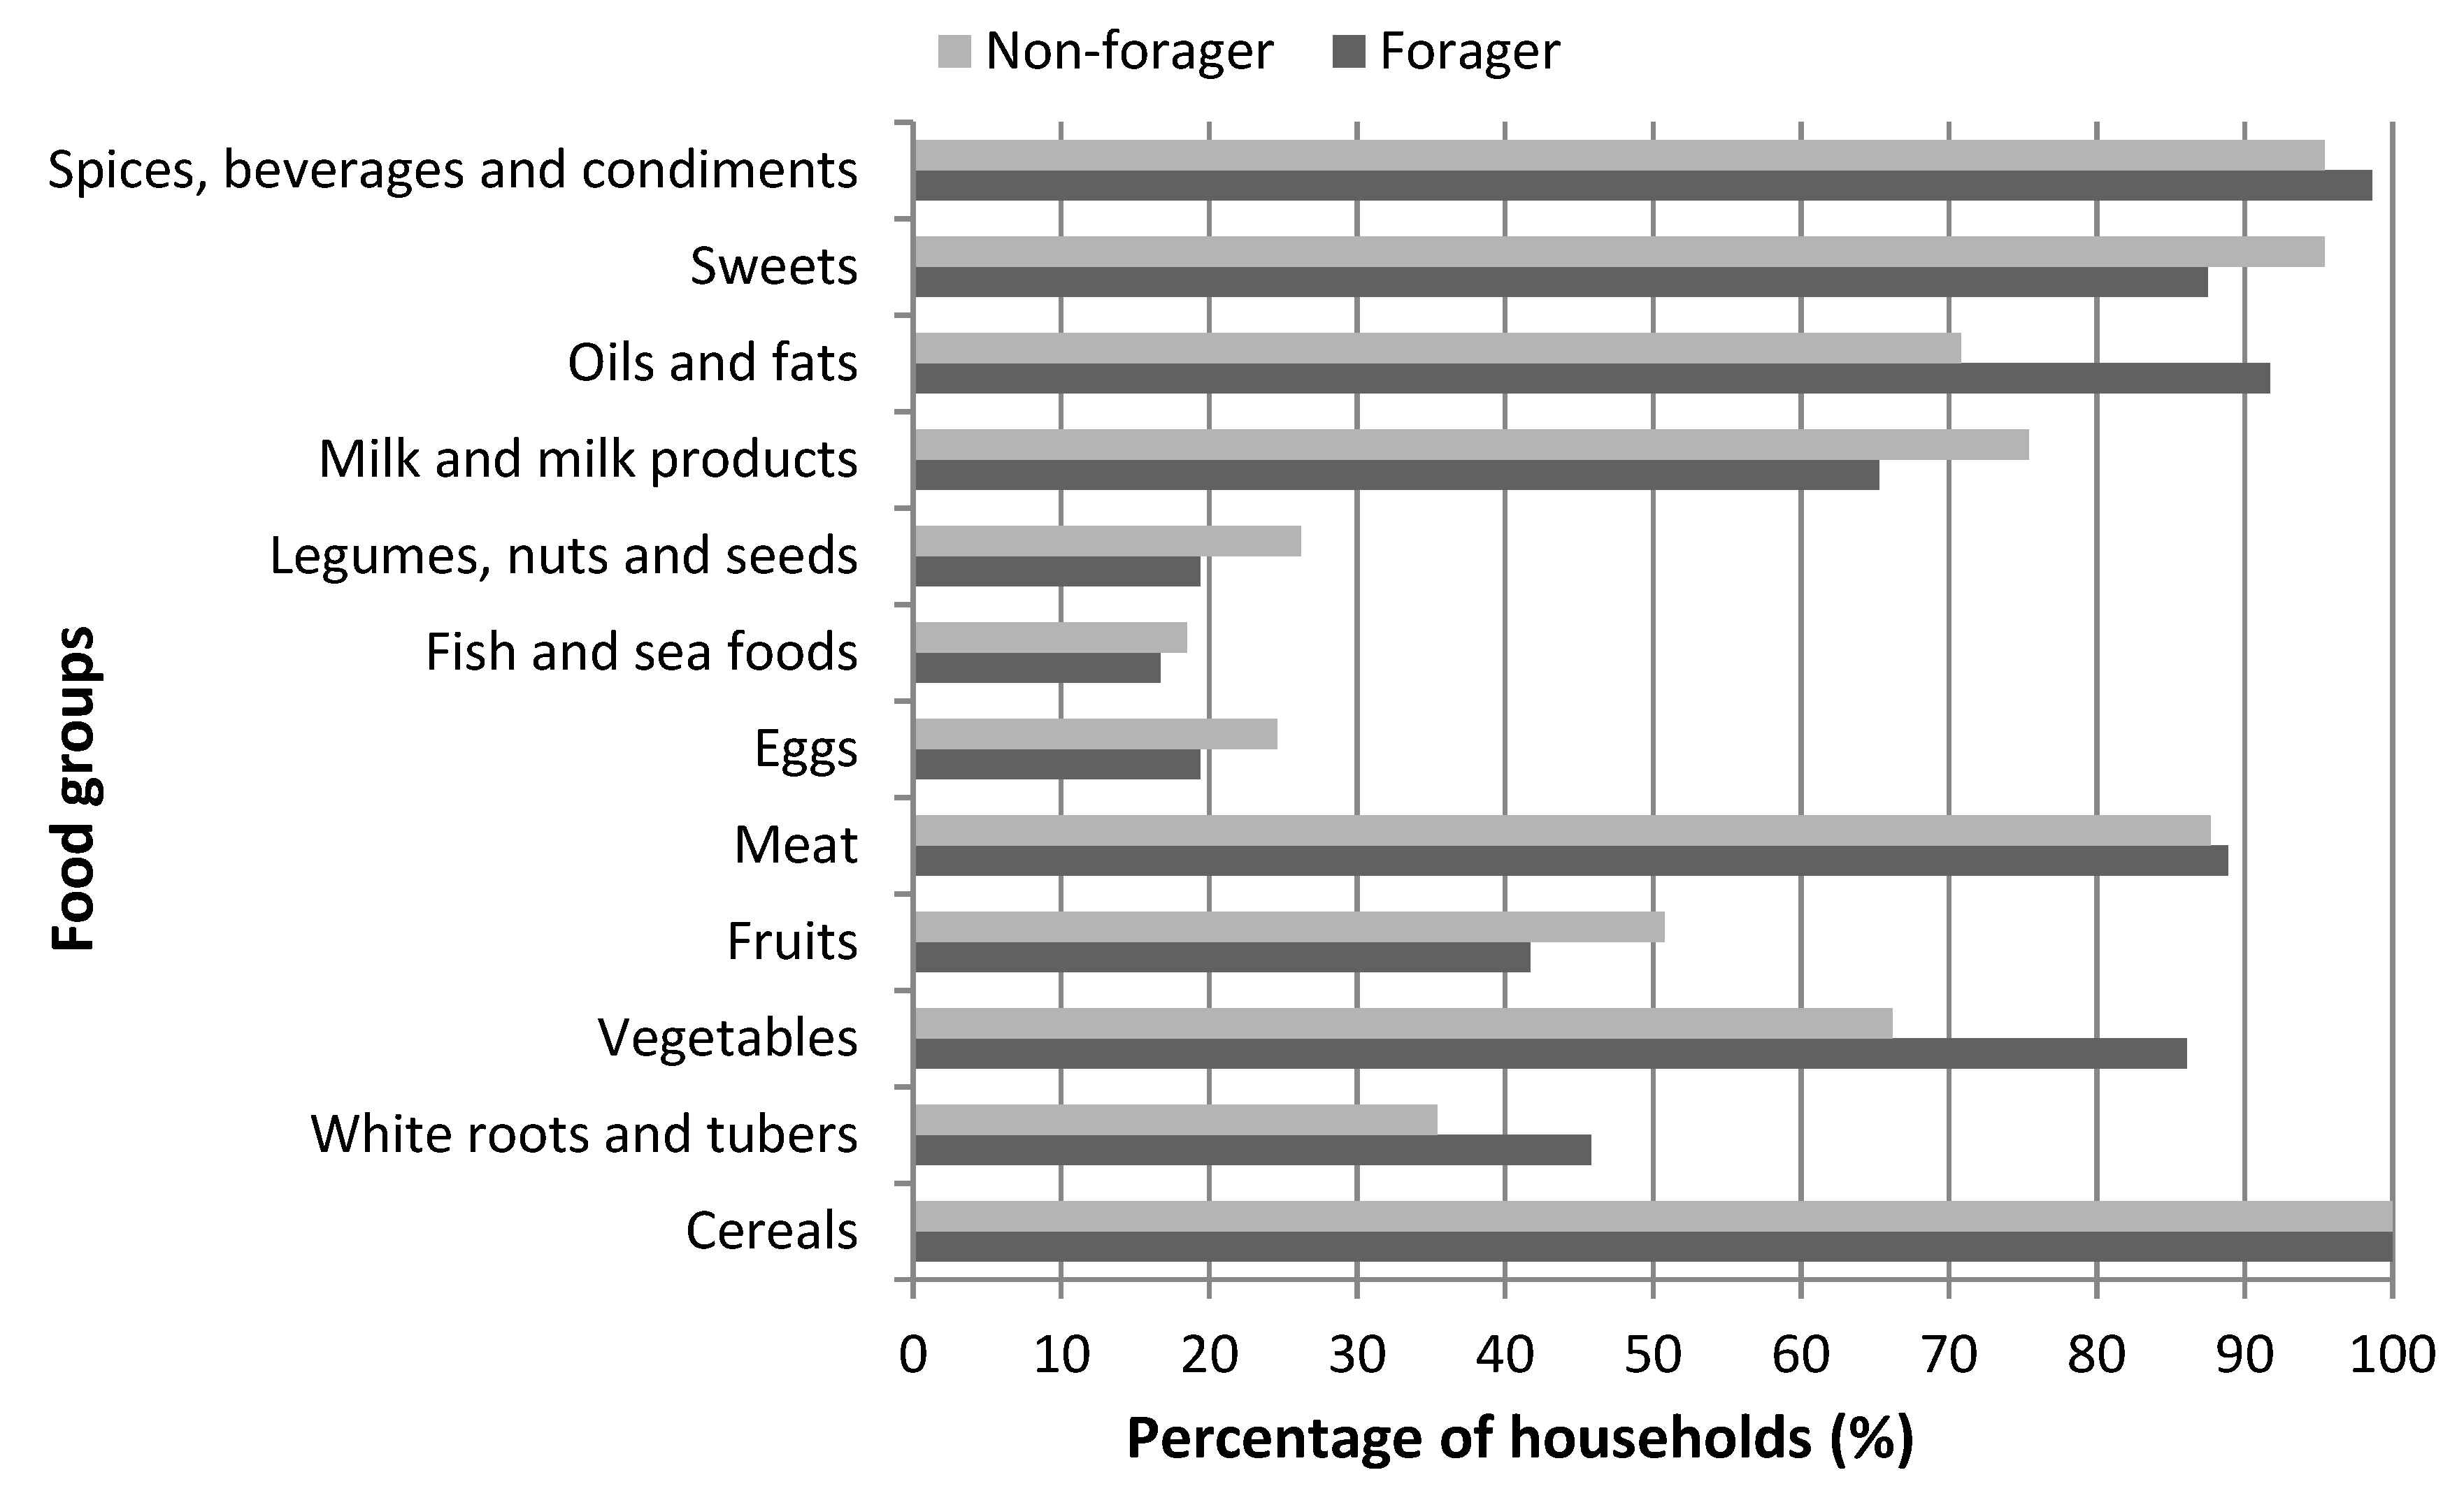
There was no significant difference in HDDS between foragers and non-foragers across the towns (t135 = 0.56, p = 0.58). However, significant differences were observed within the proportions of different food groups (Figure 6). The incidence of vegetable consumption significantly differed with foraging status (χ21, 137 = 6.53, p = 0.01), being more prevalent among foragers (86.1%) than non-foragers (13.9%). Similarly, the frequency for oil and fats was higher amongst foragers (91.7%) than non-foragers (70.8%) (χ21, 137 = 8.65, p = 0.002).

3.4. Perceptions Towards Wild Foods

Most of the respondents (74.5%) harbored positive perceptions towards wild foods, 19% were neutral and 7% were negative (Table 3). With regard to the itemized statements, the majority (80.3%) vehemently disagreed with the statement portraying wild foods as food for the poor, with only 11% affirming. Similarly, an overwhelming majority (92.7%) strongly disagreed with the statement depicting consumption of wild foods as a shameful or embarrassing activity, while six people agreed. Many respondents (78.1%) concurred that wild foods were consumed by everyone and they were delicious (84.7%).
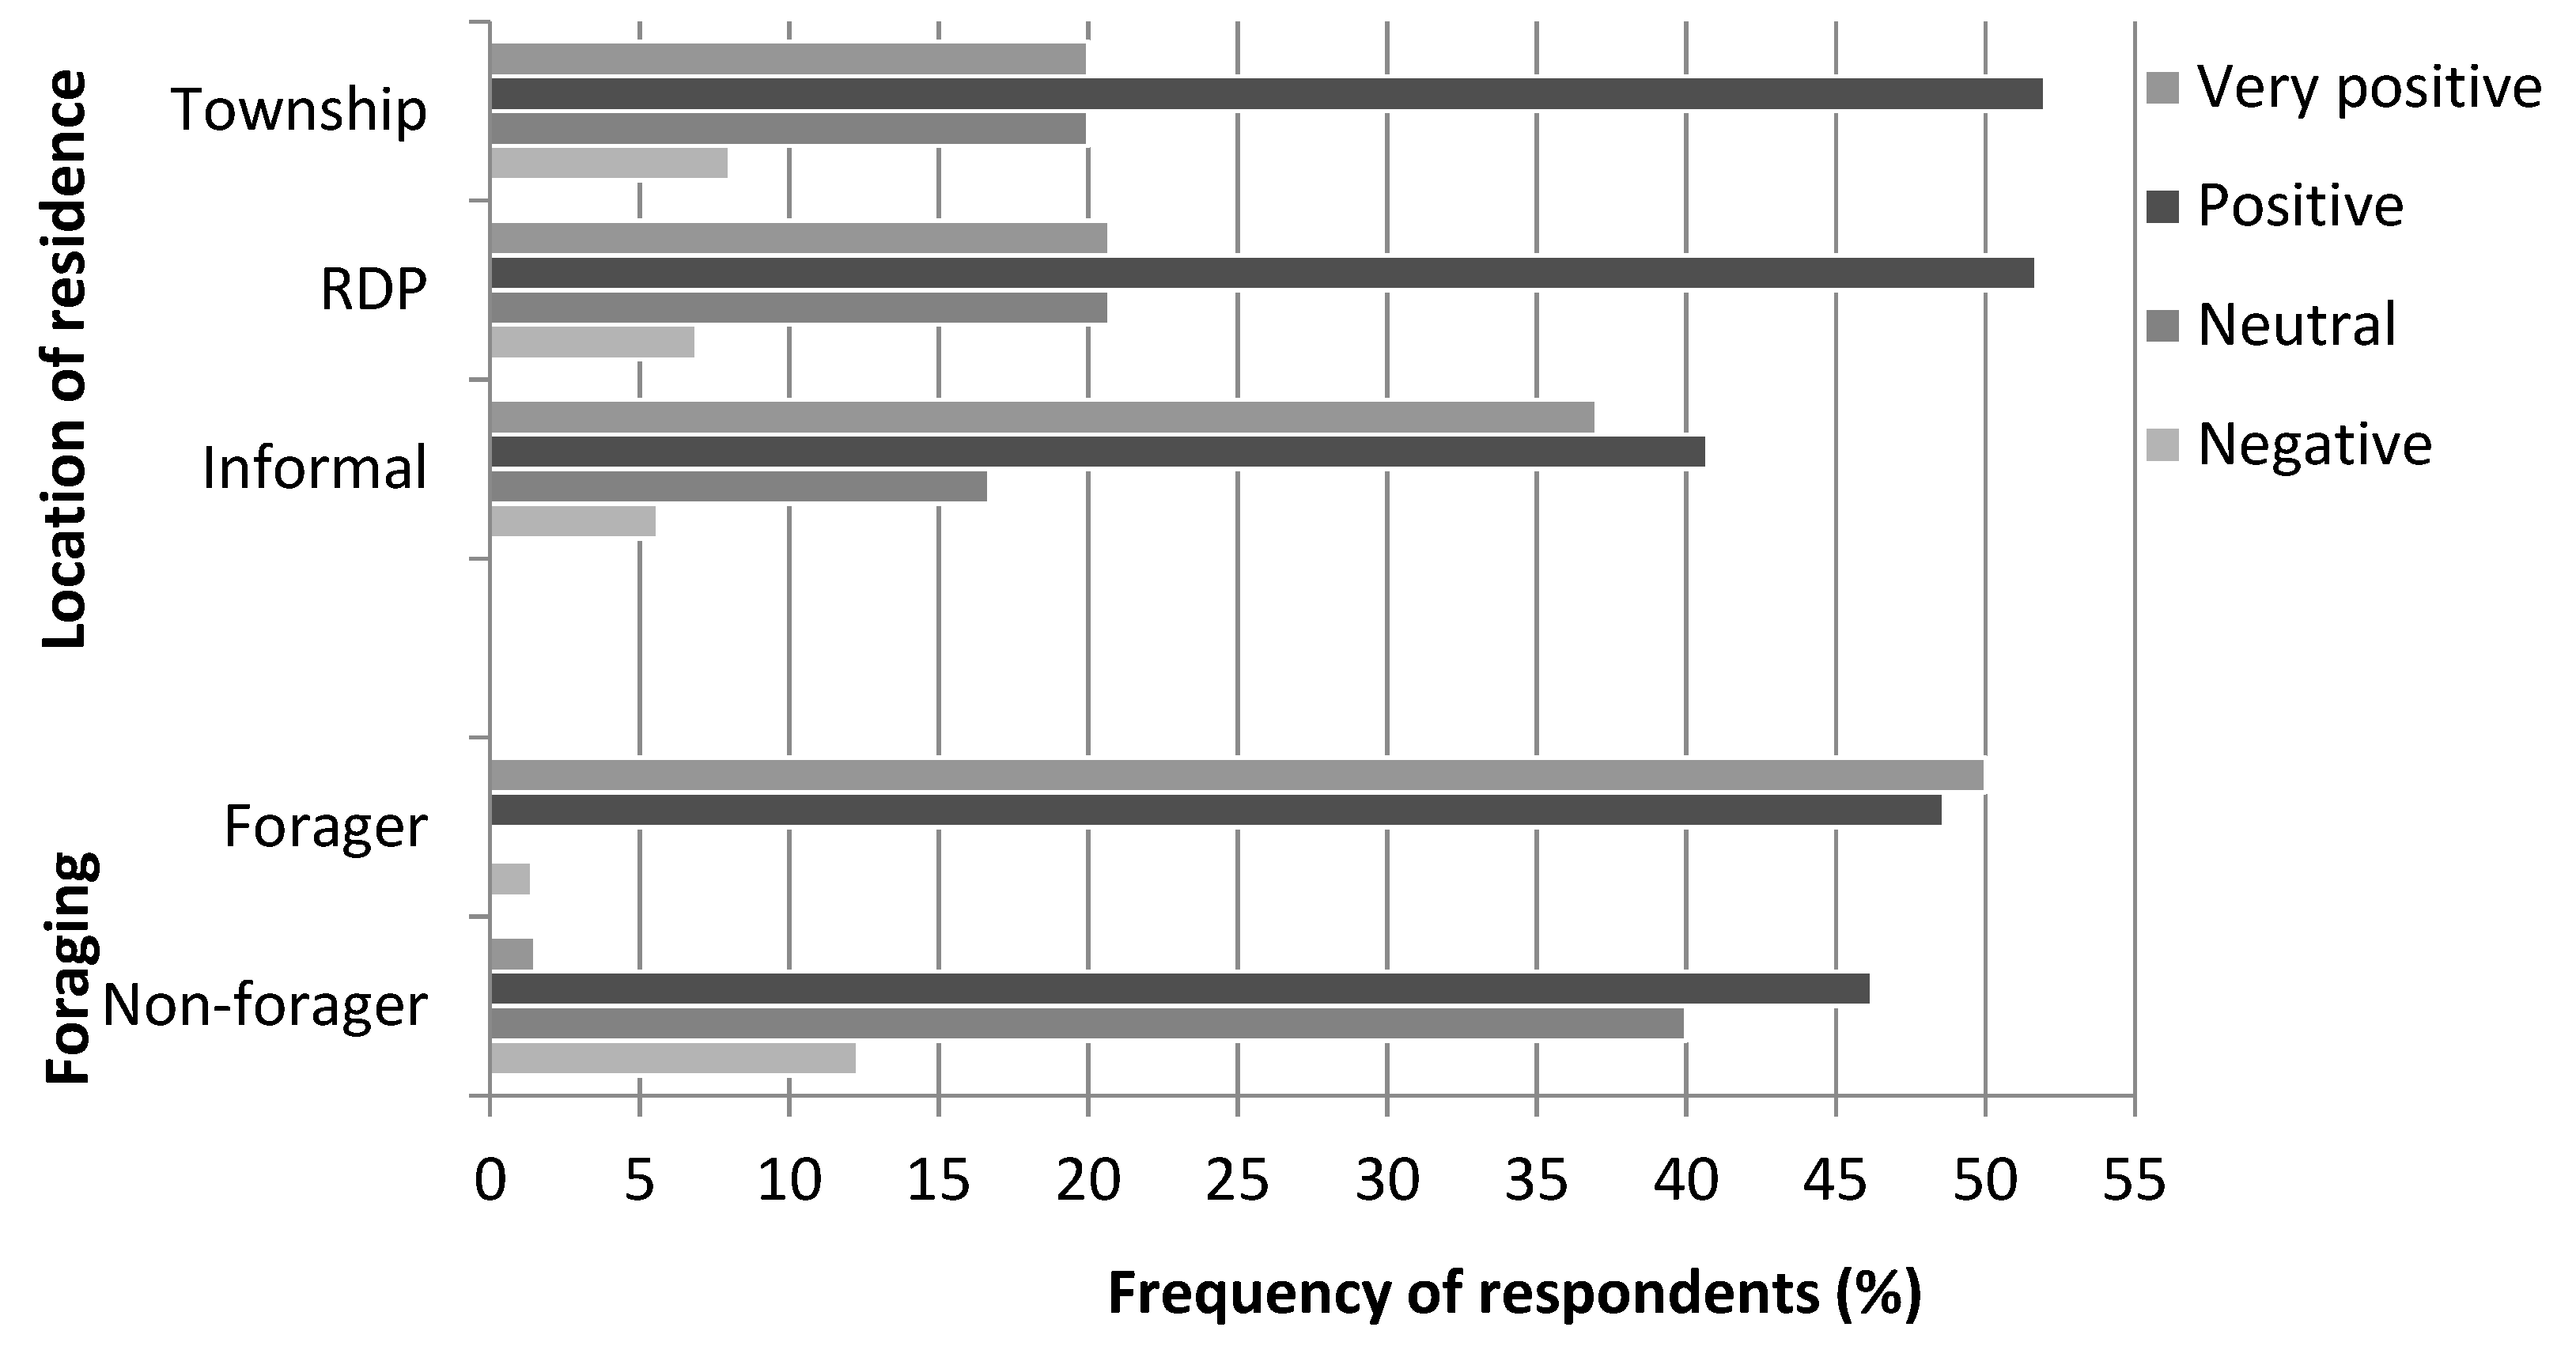
Perceptions towards wild food consumption significantly differed with foraging status (χ23, 137 = 64.75, p = 0.001). Among the non-foragers: 48% expressed favorable perceptions, 40% were neutral while 12% were negative (Figure 7). Almost all (98.6%) foragers exhibited favorable perceptions towards wild foods. Perceptions towards wild foods significantly differed between towns (χ23, 137 = 15.96, p = 0.001), with over three-quarters (88.9%) of the respondents in Thabazimbi being strongly positive towards wild foods, compared to nearly two-thirds (62.2%) in Potchefstroom. Perceptions did not vary with location of residence within the town (χ26, 137 = 4.60, p = 0.60).

4. Discussion

4.1. Household Dietary Composition

Households consumed a variety of items from the 12 different food groups. Cereals were the predominant food group, consumed by all households in the previous 48 h. Cereals mostly comprised maize (‘pap’) and wheat (bread) based foods. The dominance of cereals, particularly maize, in diets has been widely acknowledged in South Africa [45,46,47,48]. In these studies, almost all the sampled households reported consuming maize-based foods. Cereals are widely consumed because they are generally cheap to buy and easy to access. The prevalence of cereals in diets was also observed in a comparative rural-urban study in Botswana [49], Finote Selam town in Ethiopia [50] and Ouagadougou rural-urban continuum in Burkina Faso [51]. Over 95% of the households from these studies consumed cereal food groups. Spices, sweets, meat, oil and fats, vegetables and milk were also prevalent food groups. Spices were mainly salt and tea, chicken for meat, and onions and tomatoes for vegetables. The dominance of tomatoes and onions as vegetables is of concern, as they are deficient in essential micronutrients compared to leafy vegetables. The prevalence of the aforementioned food groups is consistent with those reported by Crush and Caesar [46], Mekuria et al. [50] and Chakona and Shackleton [52]. On average, the aforementioned food groups accounted to more than half of the different food groups contributing to the HDDS. Although the diets were fairly uniform across the sample, the consumption of some food groups differed significantly within and between towns. Fruits, meat, fish and seafoods were consumed more in Thabazimbi than Potchefstroom, and white roots and tubers the opposite.
Despite most food items being sourced through purchasing, the variation in consumption of the aforementioned food groups could be possibly attributed to the prevalence of foraging between the towns. Since the prevalence of foraging was higher in Thabazimbi, they are more likely to consume fruits and vegetables compared to Potchefstroom. Thabazimbi had a diversity of forest resources, hence they could forage to complement their diets. Therefore, varying ecological settings might influence consumption of particular food groups, especially those which can also be sourced from the wild or domesticated. This observation is consistent with Chakona and Shackleton [52], who observed that the incidence of wild fruit consumption varied along an ecological gradient in South Africa. In their study, fruits were consumed more in areas which had favorable agro-ecological conditions, supporting the findings of Ncube et al. [26]. Within towns, only the incidence of fruit consumption varied with location of residence, being higher in the township than the RDP and informal areas.
The main source of food was through purchasing. This is common to most urban areas worldwide [2,9,11]. Moreover, some urban households spend a significant proportion of their monthly expenditure on food purchases. Nearly half (42%) of the household monthly expenditure in Manzini (Swaziland) was devoted to purchasing food [2]. While in the cities of Buea, Limbe and Yaoundé in Cameroon, the majority of households spent between half to three-quarters of their monthly expenditure on food [11]. Distinct from their rural counterparts, urban people are generally net food buyers. This could be largely attributed to undiversified livelihoods in urban areas and limited access to land, as most of their household income is derived from salaried jobs, wage labor and business [9,10]. Therefore, those with limited income have increased vulnerability to food insecurity and malnutrition, as they might not have enough money to access food from the market [53]. Besides purchasing food, less than one-quarter of the households complemented their food with foraging wild foods. This could be a result of modernization and transitioning to urban lifestyles. Among others, modernization changes traditional lifestyles practices such as people’s eating habits, including consumption of wild foods [54]. Moreover, Cohen and Garret [53] contend that people living in urban areas do not have secured land tenure rights and possession of necessary inputs for self-food production. The finding is consistent with Tevera and Simelane [2], who noted that food production was not widely practiced in Manzini, Swaziland. Only 10% of the sampled household complemented their main food source with own-production. In contrast, Chakona and Shackleton [48] found that own-production was the second major food source after purchasing in Richards Bay and Dundee, South Africa, with over half of households producing some food. Favorable climatic conditions in these towns enabled urban agriculture to thrive, hence reducing household dependence on food purchasing.

Household Dietary Diversity

Household diets were moderately diverse, with half (51%) having consumed ≥ 8 food groups, 39% consumed 6 or 7 food groups, and only 10% recorded ≤ 5 food groups in the previous 48 h. This is within the range reported in the towns of Finote Selam [50] and Jimma [55] in Ethiopia, where households exhibited moderate dietary diversity. The HDDS significantly differed between towns, being higher in Thabazimbi than Potchefstroom. This difference could be possibly linked to the level of wealth, as Thabazimbi recorded a slightly higher mean wealth index than Potchefstroom. Hence, Thabazimbi households are likely to possess higher purchasing power which might accord them better access to variety of food from the market. Additionally, foraging wild foods could possibly have contributed to more diverse diets in Thabazimbi. Nearly one-quarter (22.2%) of the households in Thabazimbi complemented their food sources with foraging wild foods compared to 17.6% in Potchefstroom. Although infrequent, foraging wild foods could potentially add 1–3 food groups to urban diets, for example: vegetables, fruits, meat and fish and seafoods. This is buttressed by Chakona and Shackleton [48] who advanced that wild food bears the prospects of diversifying diets and cushioning households from risks and shocks, particularly the urban poor. Although not significantly different from one another, township residents’ diets were more diverse than RDP and informal residents. There was no significant difference in HDDS between neighborhoods within the two towns. The finding contradicts with Drimie et al. [56] and Chakona and Shackleton [52], who observed that household diets significantly differed with location of residence in selected towns and cities of South Africa. In these studies, residents in the inner part of towns displayed quite diverse diets compared to those in the outskirts of town.
Wealthier households displayed higher dietary diversity compared to poorer ones. Since the main food source was purchasing, wealthier households are better placed to access a variety of food from the market as well as sustained food supply. This finding is consistent with Gebre [57] in Ethiopia, Muzah [58] in Zimbabwe, Powell et al. [59] in Tanzania and Khed [60] in India. Not only does wealth enable access to food in the market, it also empowers self-production—as the wealthier can have access to land as well as afford necessary inputs. Of the few households who acknowledged self-production in our study, their wealth indices were higher than that of the overall sample, with all but one belonging to the highest wealth index quartile.
Besides wealth, dietary diversity significantly varied with education level. On average, tertiary education holders consumed 9.0 ± 1.12 food groups while secondary and primary education holders consumed 7.8 ± 1.53 and 7.3 ± 1.23 food groups, respectively. Those without formal education consumed approximately 6.3 ± 1.5 food groups. Generally, attainment of higher education is correlated to higher income, which enables access to a variety of food representing different food groups. Furthermore, those with higher education might be better acquainted on nutritional issues and healthy lifestyles [61]. In addition, they might have greater access to relevant information, education and communication materials (IEC) and activities on health and nutrition. The findings support those of Ecker and Breisinger [61], Gebre [57], Muzah [58] and Khed [60] that education in general plays a significant role towards attaining better food and nutrition security.

4.2. Wild Foods Consumption

Wild foods use was prevalent, with over half (62%) of the households consuming them to some degree. The overall prevalence of wild foods consumption is higher than reported in comparative studies. Chakona and Shackleton [34] found that slightly above one-third of the households consumed wild foods in three medium-sized towns in South Africa. While in Kampala (Uganda), nearly half (47%) of the surveyed households affirmed consuming wild foods [31]. On the contrary, the prevalence of wild foods consumption was markedly lower than reported in rural areas. Paumgarten et al. [62] found that almost all households (97%) consumed wild foods in two villages in Limpopo Province, South Africa. Vegetables and fruits were the most common wild foods, typically consumed a few times per week and per year, respectively. This is in accordance with Gido et al.’s [63] observation, where on average, wild foods were consumed ones or twice per week along the rural-urban continuum of Nairobi, Kenya. The prevalence of wild foods consumption did not differ between and within the study towns, suggesting that wild foods could be an important complementary food sources for all. The prevalence of wild foods consumption varied with seasons, being higher during the rainy season as compared to the dry season, likely correlating with the higher availability at that time.

4.2.1. The Contribution of Wild Foods to Household Dietary Diversity

The findings revealed no significant differences in HDDS between foragers and non-foragers, echoing with Chakona and Shackleton [34]. The extent of wild foods contribution to dietary diversity is multifaceted. Among others, it is a function of species availability and seasonality, consumption patterns, species knowledge, food preferences and cultural norms [45,64]. Availability and consumption of wild foods is defined by seasons. Most of the wild foods were abundant during the rainy season and so were higher prevalence rates of consumption, particularly from October to April. Hence, seasonality might impinge on the actual contribution of wild foods to diets. There is a limited reliance on wild foods as a source of food in our study and others from elsewhere [31,32]. Wild foods didn’t constitute the main source of food, but rather served as complementary food sources. Most of the households relied on bought foods, with a limited reliance on wild foods. This calls for a promotion of wild foods in urban diets, in order to increase the frequency of their consumption. Over and above, knowledge is the focal point of wild food consumption and subsequent contribution to diets. The findings contrast with the established contribution of wild foods in rural contexts, where wild foods are positively associated with diversifying diets. Fungo et al. [65], drawing upon evidence from 11 villages across the eastern-southern Cameroon, found that households who consumed forest foods displayed higher dietary diversity as compared to those who did not, as did Maseko et al. [66] amongst children in Malawi. Similarly, Luna-González and Sørensen [67] observed a direct positive relationship between dietary diversity and wild food from six villages in Baja Verapaz, Guatemala.
Despite the low contribution of wild foods to HDDS, there were significant differences observed within the proportions of particular food groups consumed. The proportion of households consuming items from vegetables groups significantly differed between foragers and non-foragers, being higher among households consuming wild foods than those who did not. Over three-quarters (86%) of the foragers consumed vegetables during the 48 h recall period compared to 66% of the non-foragers. In regard to wild foods, approximately one-third (35%) of the foragers had eaten wild foods during the 48 h recall period, and all but two had consumed wild vegetables. This is an important insight since the vegetables group was mostly dominated by onions and tomatoes. Similarly, the incidence of oil and fats consumption was higher among foragers than non-foragers. The findings show that wild foods could contribute towards diversifying urban diets at a micro-level, within particular food groups consumed, such as vegetables, fruits, meat and fish and seafoods. Hence, wild foods are likely to be important in ameliorating the monotonous diets of some households and in turn promoting dietary diversity.

4.2.2. Perceptions Towards Wild Foods

The majority of households harbored favorable perceptions about wild foods. About three-quarters were positive, one-fifth expressed ambivalent views while only nine people were negative. The positive perceptions could be induced by prior exposure and experience with wild foods at childhood, because an overwhelming majority (92%) acknowledged consuming wild foods during childhood. As noted earlier, wild foods are an important source of livelihoods and diets. This is consistent with Chen and Qiu [68] who found similar favorable perceptions in Noto Peninsula, Japan. In their study, wild foods were considered a delicious, healthy and safe food, forming part of traditional cuisines. Perceptions towards wild foods varied with household foraging status. Foragers were more likely to harbor favorable perceptions of wild foods compared to non-foragers. Almost all foragers expressed positive perceptions as compared to only half of the non-foragers. Forager’s positive perceptions could be associated with the contribution of wild foods to food basket and diets, and the social dimensions of foraging. Perceptions towards wild foods also varied between towns, with Thabazimbi residents’ being more positive about wild foods compared to Potchefstroom. This variation could be explained by the prevalence rate of foraging, which was slightly higher in Thabazimbi (55%) than Potchefstroom (45%). In contrast, perceptions did not vary within towns.

5. Conclusions

Wild foods are known to be important in rural communities in terms of food and micronutrient provision, diversifying diets, reducing vulnerability to non-communicable diseases and overall health. This study demonstrates that wild food uses is also prevalent in urban areas albeit being consumed less frequently. The majority of respondents perceived wild foods positively. This favorable perception accords an opportunity for promoting wild foods in urban food systems. This could be achieved by incorporating wild foods in local restaurant menus, events celebrating traditional food cuisines in urban areas and school curricula. Moreover, there is need for intensive awareness on the importance of wild foods in diets and nutritional intake among the urban communities. Although wild foods had limited significance on overall dietary diversity, they were important within particular food groups. For example, the consumption of vegetables and oil and fats was more prevalent among households consuming wild foods than those who did not. Wild foods could potentially diversity urban diets at a micro-level, by adding one or a few more food groups to dietary composition. Hence, wild foods are useful in mitigating monotonous diets and in turn promoting dietary diversity. Against this backdrop, future studies should examine the role of wild foods towards overall household food security status in the context of accessibility, utilization and stability of food.

Author Contributions

Conceptualization, H.G. and C.M.S.; Writing—Original Draft, H.G.; Methodology, Data Curation and Analysis, H.G.; Supervision and Funding, C.M.S. All authors have read and agreed to the published version of the manuscript.

Funding

This work was funded by the German Federal Ministry of Education and Research (BMBF) (Project ID: 01DG16015). The mobility grant from German Academic Exchange Service (DAAD) is hereby acknowledged (Project ID: 57353580).

Acknowledgments

We are grateful to the generous participation of the communities of Potchefstroom and Thabazimbi in this study. Thanks to Mallika Sardeshpande, Gamuchirai Chakona, Gladman Thondhlana and Amos Chinomona for providing insights on statistical analysis.

Conflicts of Interest

The authors declare no conflicting interests.

References

  1. Walsh, C.M.; van Rooyen, F.C. Household food security and hunger in rural and urban communities in the Free State Province, South Africa. Ecol. Food Nutr. 2015, 54, 118–137. [Google Scholar] [CrossRef] [Green Version]
  2. Tevera, D.; Simelane, N. Urban food insecurity and social protection. In Rapid Urbanisation, Urban Food Deserts and Food Security in Africa; Crush, J., Battersby, J., Eds.; Springer International Publishing: Cham, Switzerland, 2016; pp. 157–168. [Google Scholar]
  3. Shaheen, S.; Ahmad, M.; Haroon, N. Edible Wild Plants: An Alternative Approach to Food Security; Springer International Publishing: Cham, Switzerland, 2017. [Google Scholar]
  4. FAO; IFAD; UNICEF; WFP; WHO. The state of food security and nutrition in the world 2019. In Safeguarding Against Economic Slowdowns and Downturns; Food and Agriculture Organization: Rome, Italy, 2019. [Google Scholar]
  5. STATS SA. Towards Measuring the Extent of Food Security in South Africa: An Examination of Hunger and Food Adequacy; Statistics South Africa: Pretoria, South Africa, 2019.
  6. Shisana, O.; Labadarios, D.; Rehle, T.; Simbayi, L.; Zuma, K.; Dhansay, A. SANHANES-1 Team. In South African National Health and Nutrition Examination Survey (SANHANES-1); HSRC Press: Cape Town, South Africa, 2013. [Google Scholar]
  7. FAO. The Future of Food and Agriculture—Trends and Challenges; Food and Agriculture Organization: Rome, Italy, 2017. [Google Scholar]
  8. Crush, J.; Frayne, G.B. Urban food insecurity and the new international food security agenda. Dev. South. Afr. 2011, 28, 527–544. [Google Scholar] [CrossRef]
  9. Kimani-Murage, E.W.; Schofield, L.; Wekesah, F.; Mohamed, S.; Mberu, B.; Ettarh, R.; Ezeh, A. Vulnerability to food insecurity in urban slums: Experiences from Nairobi, Kenya. J. Urban Health Bull. N. Y. Acad. Med. 2014, 91, 1098–1113. [Google Scholar] [CrossRef] [PubMed] [Green Version]
  10. Boonyabancha, S.; Kerr, T.; Joshi, L.; Tacoli, C. How the urban poor define and measure food security in Cambodia and Nepal. Environ. Urban. 2019, 31, 517–532. [Google Scholar] [CrossRef] [Green Version]
  11. Sneyd, L. Wild food consumption and urban food security. In Rapid Urbanisation, Urban Food Deserts and Food Security in Africa; Crush, J., Battersby, J., Eds.; Springer International Publishing: Cham, Switzerland, 2016; pp. 143–155. [Google Scholar]
  12. Crush, J.; Hovorka, A.; Terera, D. Urban Food Production and Household Food Security in Southern African Cities (No. 4); Queen’s University and AFSUN: Kingsto, Australia; Cape Town, South Africa, 2010. [Google Scholar]
  13. Zezza, A.; Tasciotti, L. Urban agriculture, poverty, and food security: Empirical evidence from a sample of developing countries. Food Secur. Policy 2010, 35, 265–273. [Google Scholar] [CrossRef]
  14. Korir, S.C.R.; Rotich, J.K.; Mining, P. Urban agriculture and food security in developing countries: A case study of Eldoret municipality, Kenya. Eur. J. Basic Appl. Sci. 2015, 2, 27–35. [Google Scholar]
  15. Siegner, A.; Sowerwine, J.; Acey, C. Does urban agriculture improve food security? Examining the nexus of food access and distribution of urban produced foods in the United States: A systematic review. Sustainability 2018, 10, 2988. [Google Scholar] [CrossRef] [Green Version]
  16. Tawodzera, G. Vulnerability in crisis: Urban household food insecurity in Epworth, Harare, Zimbabwe. Food Secur. 2011, 3, 503–520. [Google Scholar] [CrossRef]
  17. Burlingame, B. Wild nutrition. J. Food Compos. Anal. 2000, 13, 99–100. [Google Scholar] [CrossRef]
  18. Aberoumand, A. Nutritional evaluation of edible Portulaca oleracia as plant food. Food Anal. Methods 2009, 2, 204–207. [Google Scholar] [CrossRef] [Green Version]
  19. Chagomoka, T.; Drescher, A.; Glaser, R.; Marschner, B.; Nyandoro, G. Vegetable production, consumption and its contribution to diets along the urban-rural continuum in northern Ghana. Afr. J. Food Agric. Nutr. Dev. 2015, 15, 10352–10366. [Google Scholar]
  20. Bharucha, Z.; Pretty, J. The roles and values of wild foods in agricultural systems. Philos. Trans. R. Soc. B Biol. Sci. 2010, 365, 2913–2926. [Google Scholar] [CrossRef] [PubMed] [Green Version]
  21. Yang, R.Y.; Keding, G.B. Nutritional contributions of important African indigenous vegetables. In African Indigenous Vegetables in Urban Agriculture; Shackleton, C.M., Pasquini, M.W., Drescher, A.W., Eds.; Earthscan: London, UK, 2009; pp. 105–143. [Google Scholar]
  22. Legwaila, G.M.; Mojeremane, W.; Madisa, M.E.; Mmolotsi, R.M.; Rampart, M. Potential of traditional food plants in rural household food security in Botswana. J. Hortic. For. 2011, 3, 171–177. [Google Scholar]
  23. Stadlmayr, B.; Charrondière, U.R.; Eisenwagen, S.; Jamnadass, R.; Kehlenbeck, K. Nutrient composition of selected indigenous fruits from sub-Saharan Africa. J. Sci. Food Agric. 2013, 93, 2627–2636. [Google Scholar] [CrossRef]
  24. Smith, F.I.; Eyzaguirre, P. African leafy vegetables: Their role in the World Health Organization’s global fruit and vegetables initiative. Afr. J. Food Agric. Nutr. Dev. 2007, 7. Available online: https://www.ajfand.net/Volume7/No3/Smith-IPGRI1-1.pdf (accessed on 1 October 2019).
  25. Faber, M.; Witten, C.; Drimie, S. Community-based agricultural interventions in the context of food and nutrition security in South Africa. S. Afr. J. Clin. Nutr. 2011, 24, 21–30. [Google Scholar] [CrossRef]
  26. Ncube, K.; Shackleton, C.M.; Swallow, B.M.; Dassanayake, W. Impacts of HIV/AIDS on food consumption and wild food use in rural South Africa. Food Secur. 2016, 8, 1135–1151. [Google Scholar] [CrossRef]
  27. Shackleton, C.M.; Shackleton, S.E.; Buiten, E.; Bird, N. The importance of dry woodlands and forests in rural livelihoods and poverty alleviation in South Africa. For. Policy Econ. 2007, 9, 558–577. [Google Scholar] [CrossRef]
  28. Ohiokpehai, O. Promoting the nutritional goodness of traditional food products. Pak. J. Nutr. 2003, 2, 267–270. [Google Scholar]
  29. Shackleton, M.C.; Hurley, T.P.; Dahlberg, C.A.; Emery, R.M.; Nagendra, H. Urban foraging: A ubiquitous human practice overlooked by urban planners, policy, and research. Sustainability 2017, 9, 1884. [Google Scholar] [CrossRef] [Green Version]
  30. Poe, M.R.; McLain, R.J.; Emery, M.; Hurley, P.T. Urban forest justice and the rights to wild foods, medicines, and materials in the city. Hum. Ecol. 2013, 41, 409–422. [Google Scholar] [CrossRef] [Green Version]
  31. Mollee, E.; Pouliot, M.; McDonald, M.A. Into the urban wild: Collection of wild urban plants for food and medicine in Kampala, Uganda. Land Use Policy 2017, 63, 67–77. [Google Scholar] [CrossRef] [Green Version]
  32. Synk, C.M.; Kim, B.F.; Davis, C.A.; Harding, J.; Rogers, V.; Hurley, P.T.; Nachman, K.E. Gathering Baltimore’s bounty: Characterizing behaviors, motivations, and barriers of foragers in an urban ecosystem. Urban For. Urban Green 2017, 28, 97–102. [Google Scholar] [CrossRef]
  33. Stark, P.B.; Miller, D.; Carlson, T.J.; de Vasquez, K.R. Open-source food: Nutrition, toxicology, and availability of wild edible greens in the East Bay. PLoS ONE 2019, 14. [Google Scholar] [CrossRef] [PubMed] [Green Version]
  34. Chakona, G.; Shackleton, C.M. Food insecurity in South Africa: To what extent can social grants and consumption of wild foods eradicate hunger? World Dev. Perspect. 2019, 13, 87–94. [Google Scholar] [CrossRef]
  35. Slater, R.; Twyman, C. Hidden livelihoods? In Natural Resource-Dependent Livelihoods and Urban Development Policy; Overseas Development Institute: London, UK, 2003. [Google Scholar]
  36. STATS SA. Statistics by place-Thabazimbi; Statistics South Africa: Pretoria, South Africa, 2011. Available online: http://www.statssa.gov.za/?page_id=4286&id=13271 (accessed on 12 January 2018).
  37. Tlokwe City Council. Integrated Development Plan of the Tlokwe City Council Third Generation IDP; Tlokwe City Council: Potchefstroom, South Africa, 2012. [Google Scholar]
  38. STATS SA. Census 2011 Provincial Profile: Limpopo; Statistics South Africa: Pretoria, South Africa, 2014. Available online: http://www.statssa.gov.za/publications/Report-03-01-78/Report-03-01-782011.pdf (accessed on 12 January 2018).
  39. STATS SA. Poverty Trends in South Africa: An Examination of Absolute Poverty between 2006 and 2015; Statistics South Africa: Pretoria, South Africa, 2017.
  40. Thabazimbi Local Municipality. Integrated Development Plan; Thabazimbi Local Municipality: Thabazimbi, South Africa, 2016. [Google Scholar]
  41. Mucina, L.; Rutherford, M.C. The Vegetation of South Africa, Lesotho and Swaziland; South African National Biodiversity Institute: Pretoria, South Africa, 2006. [Google Scholar]
  42. Kaoma, H.; Shackleton, C.M. The direct-use value of urban tree non-timber forest products to household income in poorer suburbs in South African towns. For. Policy Econ. 2015, 61, 104–112. [Google Scholar] [CrossRef]
  43. FAO. Guidelines for Measuring Household and Individual Dietary Diversity; Food and Agriculture Organization: Rome, Italy, 2010. [Google Scholar]
  44. FAO. Report on Use of the Household Food Insecurity Access Scale and Household Dietary Diversity Score in Two Survey Rounds in Manica and Sofala Provinces, Mozambique, 2006–2007; Food and Agriculture Organization: Rome, Italy, 2008. [Google Scholar]
  45. Faber, M.; Oelofse, A.; Van Jaarsveld, P.J.; Wenhold, F.A.M.; Jansen van Rensburg, W.S. African leafy vegetables consumed by households in the Limpopo and KwaZulu-Natal. S. Afr. J. Clin. Nutr. 2010, 23, 30–38. [Google Scholar] [CrossRef] [Green Version]
  46. Crush, J.; Caesar, M. City without choice: Urban food insecurity in Msunduzi, South Africa. Urban Forum. 2014, 2, 165–175. [Google Scholar] [CrossRef]
  47. Ronquest-Ross, L.C.; Vink, N.; Sigge, G. Food consumption changes in South Africa since 1994. S. Afr. J. Sci. 2015, 111. [Google Scholar] [CrossRef]
  48. Chakona, G.; Shackleton, C.M. Minimum dietary diversity scores for women indicate micronutrient adequacy and food insecurity status in South African towns. Nutrients 2017, 9, 812. [Google Scholar] [CrossRef] [Green Version]
  49. Kasimba, S.N.; Motswagole, B.S.; Covic, N.M.; Claasen, N. Household access to traditional and indigenous foods positively associated with food security and dietary diversity in Botswana. Public Health Nutr. 2018, 21, 1200–1208. [Google Scholar] [CrossRef] [PubMed] [Green Version]
  50. Mekuria, G.; Wubneh, Y.; Tewabe, T. Household dietary diversity and associated factors among residents of finote selam town, north west Ethiopia: A cross sectional study. BMC Nutr. 2017, 3. [Google Scholar] [CrossRef] [Green Version]
  51. Chagomoka, T.; Unger, S.; Drescher, A.; Glaser, R.; Marschner, B.; Schlesinger, J. Food coping strategies in northern Ghana. A socio-spatial analysis along the urban-rural continuum. Agric. Food Secur. 2016, 5. [Google Scholar] [CrossRef]
  52. Chakona, G.; Shackleton, C.M. Household food insecurity along an agro-ecological gradient influences children’s nutritional status in South Africa. Front. Nutr. 2018, 4. [Google Scholar] [CrossRef] [PubMed] [Green Version]
  53. Cohen, M.J.; Garrett, J.L. The food price crisis and urban food (in)security. Environ. Urban. 2010, 22, 467–482. [Google Scholar] [CrossRef]
  54. Poulain, J.P.; Smith, W.; Laporte, C.; Tibère, L.; Ismail, M.N.; Mognard, E.; Baharuddin, A.S. Studying the Consequences of Modernization on Ethnic Food Patterns: Development of the Malaysian Food Barometer (MFB). Anthropology of Food. 2015. Available online: http://aof.revues.org/7735 (accessed on 1 October 2019).
  55. Tefera, B.; Tilahun, Y. Dietary diversity among people 40 years and above in Jimma Town, Southwest Ethiopia. Ethiop. J. Health Sci. 2007, 17, 115–120. [Google Scholar]
  56. Drimie, S.; Faber, M.; Vearey, J.; Nunez, L. Dietary diversity of formal and informal residents in Johannesburg, South Africa. BMC Public Health 2013, 13. [Google Scholar] [CrossRef]
  57. Gebre, G.G. Determinants of food insecurity among households in Addis Ababa city, Ethiopia. Interdiscip. Descr. Complex Syst. 2012, 10, 159–173. [Google Scholar] [CrossRef]
  58. Muzah, O. An Assessment of Household food Security in urban and Peri-Urban Areas; a Case Study of Bindura municipal Area, Mashonaland central, Zimbabwe. Master’s Thesis, University of KwaZulu-Natal, Pietermaritzburg, South Africa, 2015. [Google Scholar]
  59. Powell, B.; Bezner-Kerr, R.; Young, S.L.; Johns, T. The determinants of dietary diversity and nutrition: Ethnonutrition knowledge of local people in the East Usambara Mountains, Tanzania. J. Ethnobiol. Ethnomedicine 2017, 13. [Google Scholar] [CrossRef] [Green Version]
  60. Khed, V. Nutritional Status and Dietary Diversity of Households in Vijayapura District of Karnataka. In Proceedings of the 30th International Conference of Agricultural Economists, Vancouver, BC, Canada, 28 July–2 August 2018; pp. 1–23. Available online: http://ageconsearch.umn.edu/record/275911/files/2500.pdf (accessed on 1 October 2019).
  61. Ecker, O.; Breisinger, C. The Food Security System: A new Conceptual Framework; IFPRI Discussion Paper 1166; International Food Policy Research Institute (IFPRI): Washington, DC, USA, 2012. [Google Scholar]
  62. Paumgarten, F.; Locatelli, B.; Witkowski, E.T.F. Wild foods: Safety net or poverty trap? A South African case study. Hum. Ecol. 2018, 46, 183–195. [Google Scholar] [CrossRef]
  63. Gido, E.O.; Ayuya, O.I.; Owuor, G.; Bokelmann, W. Consumption intensity of leafy African indigenous vegetables: Towards enhancing nutritional security in rural and urban dwellers in Kenya. Agric. Food Econ. 2017, 5. [Google Scholar] [CrossRef]
  64. Powell, B.; Thilsted, S.H.; Ickowitz, A.; Termote, C.; Sunderland, T.; Herforth, A. Improving diets with wild and cultivated biodiversity from across the landscape. Food Secur. 2015, 7, 535–554. [Google Scholar] [CrossRef] [Green Version]
  65. Fungo, R.; Muyonga, J.; Kabahenda, M.; Kaaya, A.; Okia, C.A.; Donn, P.; Snook, L. Contribution of forest foods to dietary intake and their association with household food insecurity: A cross-sectional study in women from rural Cameroon. Public Health Nutr. 2016, 19, 3185–3196. [Google Scholar] [CrossRef] [PubMed] [Green Version]
  66. Maseko, H.; Shackleton, C.M.; Nagoli, J.; Pullanikkatil, D. Children and wild foods in the context of deforestation in rural Malawi. Hum. Ecol. 2017, 45, 795–807. [Google Scholar] [CrossRef] [Green Version]
  67. Luna-González, D.V.; Sørensen, M. Higher agrobiodiversity is associated with improved dietary diversity, but not child anthropometric status, of Mayan Achí people of Guatemala. Public Health Nutr. 2018, 21, 2128–2141. [Google Scholar] [CrossRef] [Green Version]
  68. Chen, B.; Qiu, Z. Consumers’ attitudes towards edible wild plants: A case study of Noto Peninsula, Ishikawa Prefecture, Japan. Int. J. For. Res. 2012. [Google Scholar] [CrossRef] [Green Version]
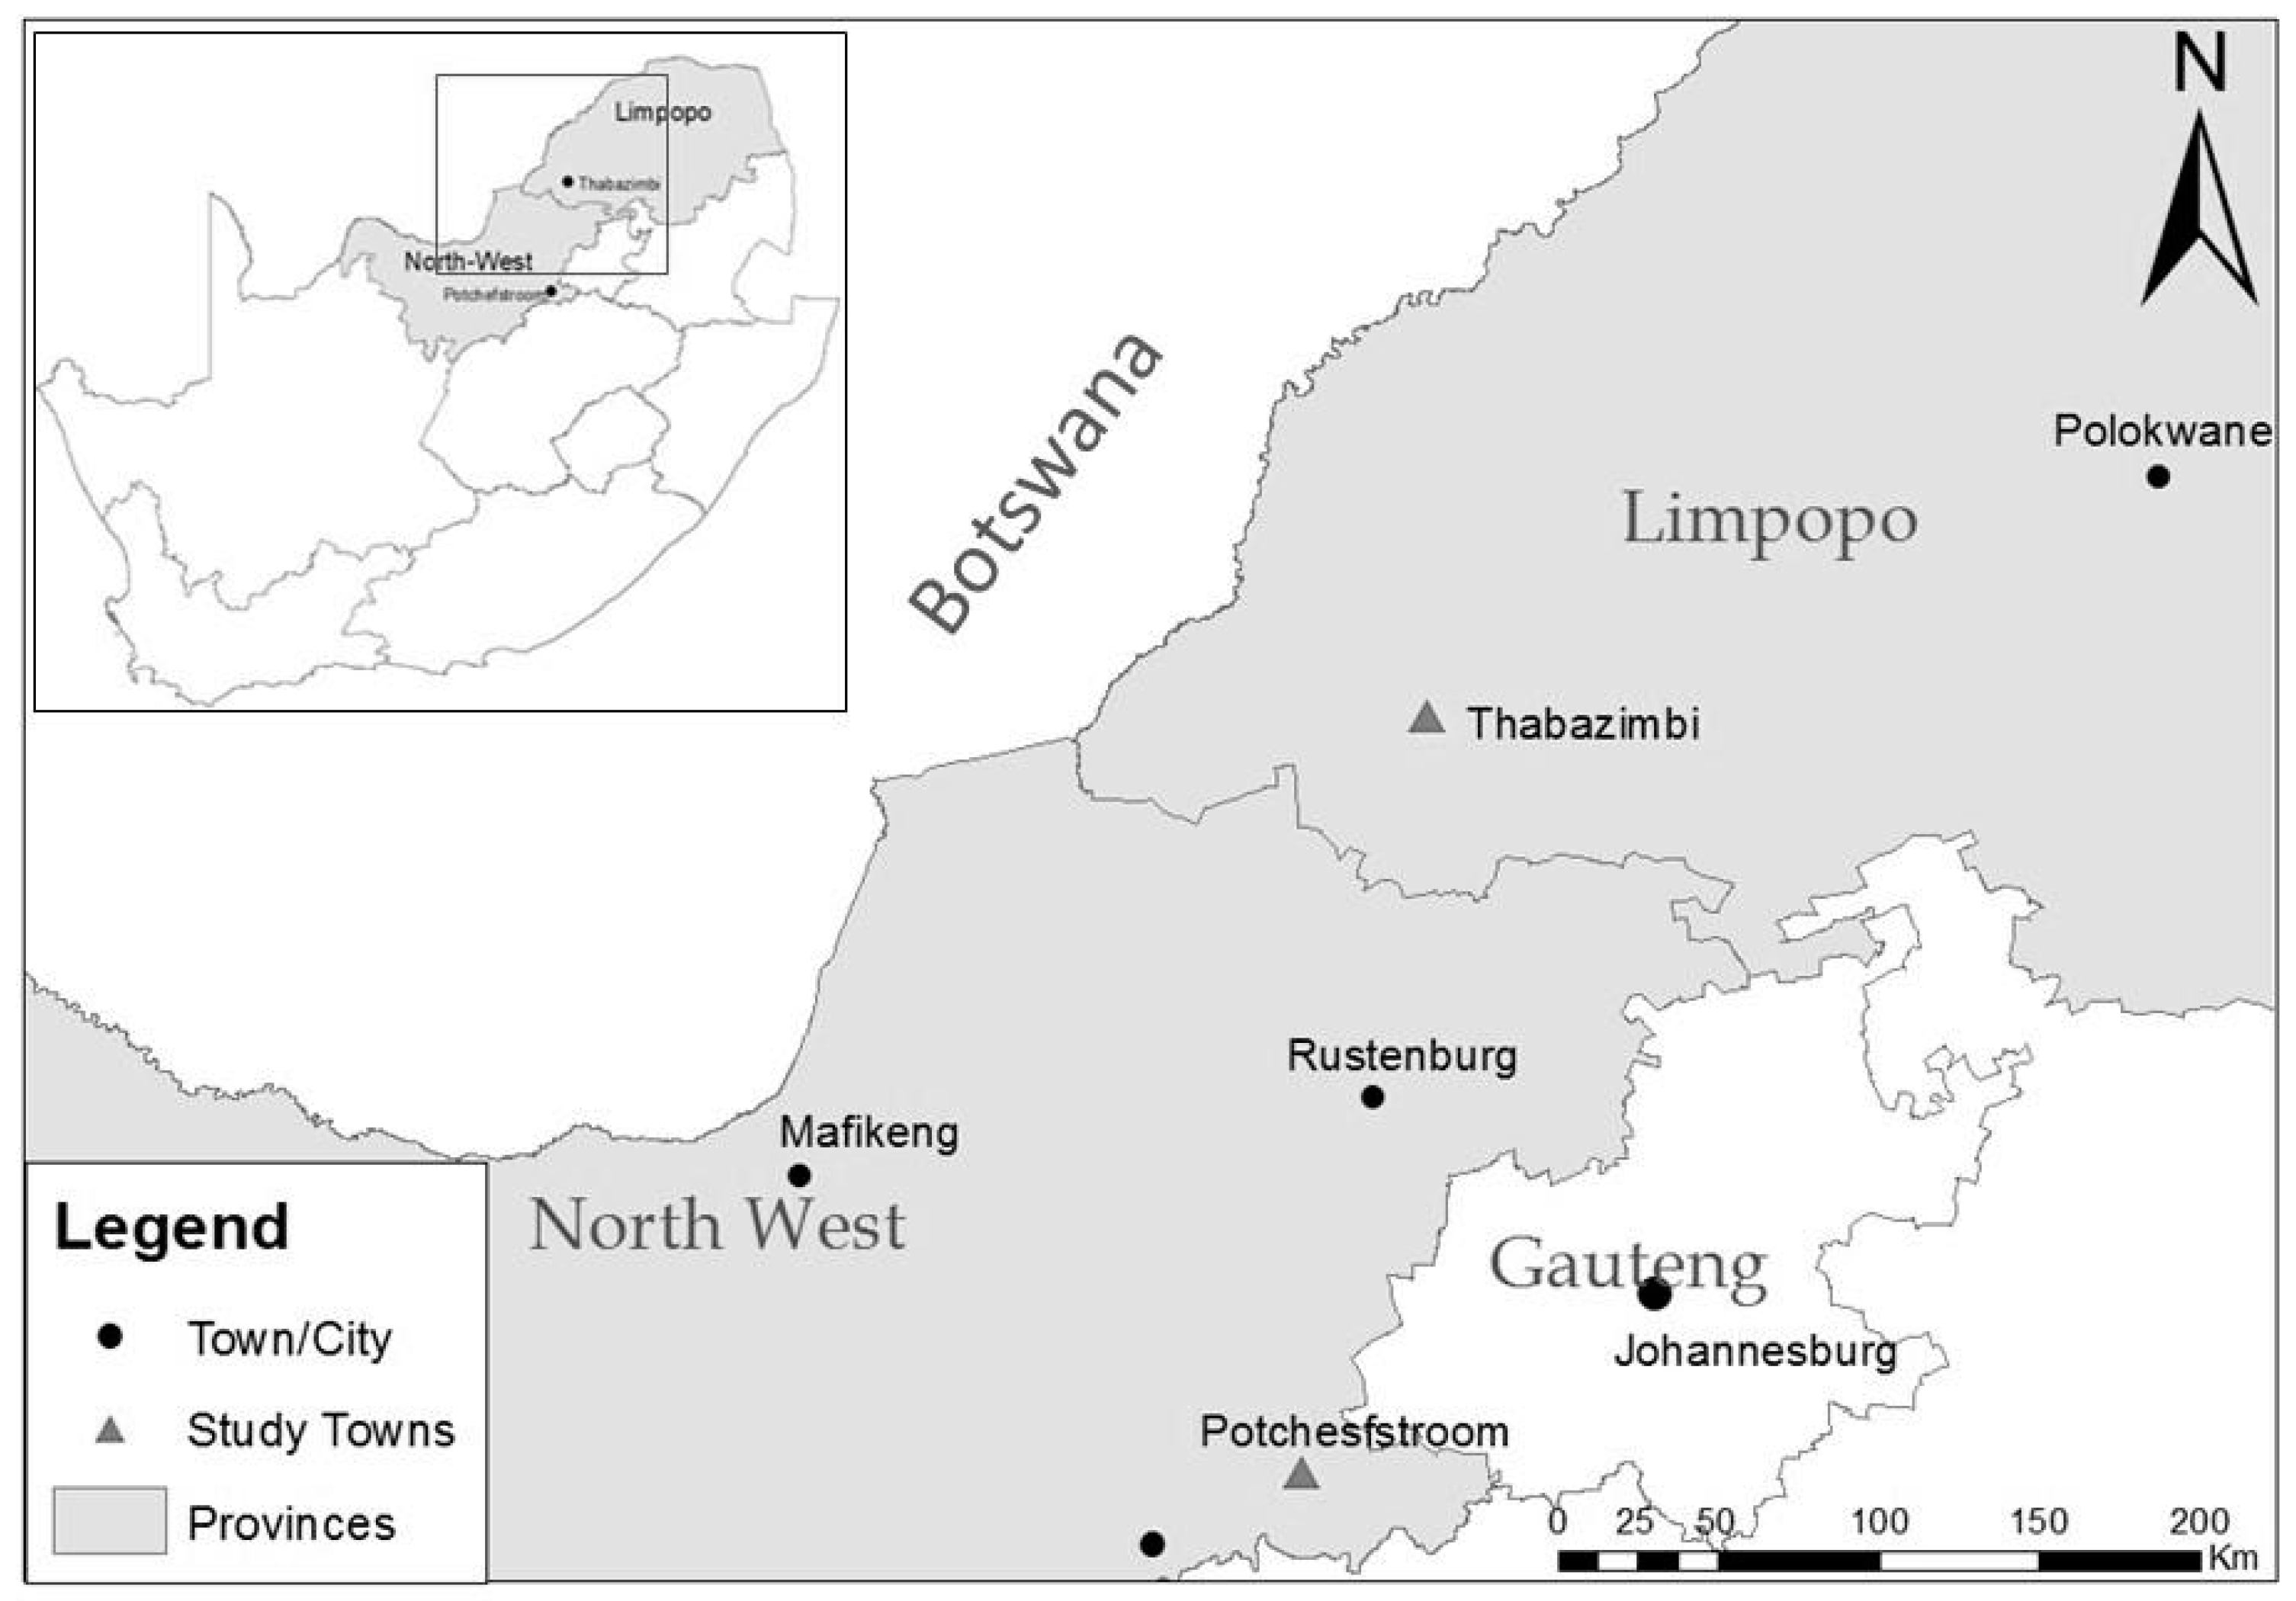
Figure 1. Location of the study towns.
Sustainability 12 00678 g001
Figure 2. The percentage of households consuming different food groups in the previous 48 h in two towns (A) and across location of residence (B).
Sustainability 12 00678 g002
Figure 3. Distribution of household dietary diversity scores (HDDS) in two towns (A) and across location of residence (B), based on 48 h dietary recall.
Sustainability 12 00678 g003
Figure 4. Frequency of wild fruits and vegetables consumption.
Sustainability 12 00678 g004
Figure 5. Seasonal variation in wild fruits and vegetables consumption across the study sites.
Sustainability 12 00678 g005
Figure 6. The percentage of households consuming different food groups against foraging status.
Sustainability 12 00678 g006
Figure 7. Distribution (%) of respondents’ perception towards wild foods across location in town and between foraging status.
Sustainability 12 00678 g007
Table 1. Summary of respondents socio-economic and demographic attributes (N = 137).
VariableCategoryValue (%)
SexMale41 (29.9)
Female96 (70.1)
Age (Years)Mean ± SD45.5 ± 13.8
EducationNone15 (11.3)
Primary32 (24.1)
Secondary77 (57.9)
Tertiary9 (6.8)
EmploymentFull-time31 (22.6)
Part-time19 (13.9)
Self7 (5.1)
Unemployed63 (46.0)
Retired14 (10.2)
Other3 (2.2)
Household sizeMean ± SD4.4 ± 2.4
ResidenceInformal54 (39.4)
RDP58 (42.3)
Township25 (18.2)
Length of residence (years)Mean ± SD25.8±14.5
ChildhoodFarm36 (26.3)
Rural village62 (45.3)
Township37 (27.0)
Inner town2 (1.5)
Childhood foraging backgroundYes126 (92.0)
No11 (8.0)
Household incomeLow66 (49.3)
Average49 (36.6)
High19 (14.2)
Proportion of income on food<20%26 (19.3)
21–50%45 (33.3)
51–80%46 (34.1)
81–100%18 (13.3)
Wealth indexMean ± SD1.46 ± 0.86
Table 2. GLM regression results of determinants of household dietary diversity scores (bold values indicate significant difference at p < 0.05).
VariablesCoefficientp
Sex0.030.80
Age−0.0040.53
Household size−0.050.11
Social grants0.130.40
Household Income (Low)0.170.10
Household income (Better)0.310.24
Food income (11–20%)0.530.29
Food income (21–50%)0.490.32
Food income (51–80%)0.590.23
Food income (81–90%)0.680.19
Food income (91–100%)0.630.29
Wealth index0.200.02
Education0.270.01
Employment (Retired)0.300.55
Employment (Unemployed)0.270.09
Employment (Other)0.250.30
Employment (Self-employed)0.440.14
Employment (Part-time)0.340.08
Table 3. Respondents level of agreement with statements regarding perceptions towards wild foods (%).
DomainItemSDDNASADK
Affective (Feelings, emotive)Wild foods are delicious2.25.14.419.765.03.6
Wild foods are tasteless71.510.26.65.82.92.9
I feel ashamed to eat wild foods78.114.62.92.22.2
Wild foods are contaminated28.513.910.924.112.410.2
Wild foods are collected freely3.67.35.820.454.08.8
Cognitive (Beliefs)Wild foods are nutritious2.92.98.817.565.02.9
Wild foods are important to health2.21.58.016.867.24.4
Wild foods are consumed by everyone2.913.92.916.162.02.2
Wild foods acts as safety net during times of emergency and shocks1.54.411.716.862.03.6
Wild foods are important in diversifying diets2.20.711.740.938.75.8
Wild foods are part of cultural identity2.94.47.321.263.50.7
Behavioural (Actions)Wild foods are easy to find30.716.12.930.716.13.6
Use of wild foods is declining25.511.74.438.716.13.6
Wild foods are foods for children64.220.42.212.4 0.7
Wild foods are foods for the poor67.912.48.88.0 2.9
Note: SD, D, N, A, SA, and DK are Likert type scale options: Strongly disagree, Disagree, Neutral, Agree, Strongly agree and Don’t know, respectively.