Article

The Optimal Pricing Analysis for Remanufactured Notebooks in a Duopoly Environment

Department of Management Sciences, Tamkang University, No.151, Yingzhuan Rd., Tamsui Dist., New Taipei City 25137, Taiwan
Sustainability 2020, 12(2), 636; https://doi.org/10.3390/su12020636
Submission received: 28 November 2019 / Revised: 12 January 2020 / Accepted: 13 January 2020 / Published: 15 January 2020

Abstract

:
The information technology industry plays an important role in Taiwan’s manufacturing sector, and its total notebook production ranks top in the world. The rapid development of IT products has caused many of these products to be discarded, although most of them can be recycled, remanufactured, and reused. In order to reduce the manufacture of new products and the associated carbon emissions, this study aims to discover the optimal subsidy policy for remanufactured notebooks in the green market, focusing on the pricing of remanufactured notebooks and maximizing manufacturers’ profits while retaining optimal social welfare for consumers. We use a two-stage game theory model to identify the optimal government subsidy policies for a duopoly environment. The results are based on the subsidy ratio between consumer and manufacturers, as this factor is important to the entire green supply chain; manufacturers can still reap optimal profits by only producing new or remanufactured products, and the government should be aware of the likelihood of manufacturers colluding and of the need to intervene when necessary to avoid sacrificing social welfare.

1. Introduction

As the issue of environmental pollution and global warming becomes more serious, communities all over the world are proposing solutions to ensure environmentally friendly and sustainable development. In late 2008, the United Nations Environmental Programme launched the Green Economy Initiative, based on the working definition of a green economy as one that results in improved human wellbeing and social equity, while significantly reducing environmental risks and ecological scarcities [1]. In Taiwan, the Industrial Development Bureau of the Ministry of Economic Affairs has promoted sustainable industry development plans and provided guidance to ensure that companies accord with international environmental protection standards. Since 2010, the Taiwan External Trade Development Council has organized the Taiwan International Green Industry Show every October in the hope of attracting both domestic and international companies to invest in green-related industries. Green industry-related activities and forums held during the show are always well attended. Since the turn of the 21st century, developed countries in Europe have been actively promoting environmentally friendly concepts. Many new laws, such as the Waste from Electrical and Electronic Equipment (WEEE) Directive and the Restriction of Hazardous Substances in Electrical and Electronic Equipment (RoHS) Directive, have been enacted since 2003, with the aim of utilizing the EU’s huge market to push forth a friendlier environmental agenda within the global manufacturing industries. Many multinational companies, such as Sony, IBM, DELL, and HP, have complied with these directives by mandating their suppliers to adopt the requirements stated. This helped to promote the trend of green supply chains.
Remanufacturing preserves the value of a product by giving it a second life, and typically reduces the manufacturing energy [2]. If the concept of sustainability can be inculcated in the minds of the people, it will be a great boost to the implementation and management of sustainable products. To encourage consumers to purchase remanufactured goods and manufacturers to recycle the abandoned products, governments all over the world are offering subsidies to both parties. Alizadeh-Basban and Taleizadeh [3] proposed that the government should subsidize both manufacturers and consumers, so that manufacturers are more willing to produce remanufactured products and consumers have the incentive to purchase such goods. In Taiwan, Acer and Asus are two of the biggest brands in the computing industry. Both of them are in competition for a better reputation in their customer service and brand word-of-mouth. Not only is there competition between the new products regarding quality, cost, material recycling indicators, ease of repair, lifespan, and use of recycled plastic materials to support resource reuse; but also regarding the refurbishment and remanufacture of the collected electronic products and donations to disadvantaged minorities after confirming that they can be used normally. In order to promote the remanufactured product to the secondary market, it is necessary to discuss how to price the remanufactured products. We would therefore like to find out how governments can encourage the production and consumption of green products through various subsidy policies and investigate the effects of government subsidies on remanufactured notebooks in a duopoly environment where manufacturers are able to achieve maximum profit and the corresponding social welfare. The information technology industry plays an important role in Taiwan’s manufacturing sector, and the scale of its production and manufacture of notebooks ranks as one of the top in the world. The rapid development of computer performance has caused many notebooks to be discarded when a new-generation CPU is proposed in the market, although most of the older ones can be recycled, remanufactured, and reused. In addition, there exists a coopetition relationship between the top two domestic computer manufacturers in Taiwan. Therefore, in order to understand the coopetition relationship of oligopolistic firms in the production and pricing of green products, the objectives of this study are as follows:
  • To propose a duopoly market model for this remanufactured market;
  • To use the Cournot model to find the effects on the entire green supply chain of different manufacturers’ market evaluations;
  • To establish how manufacturers will be affected under different government subsidy policies and different market competition conditions;
  • To determine how the difference in subsidy amount will affect the social welfare of the entire green supply chain under various market conditions.

2. Literature Review

Compared with conventional forward logistics, reverse logistics refers to logistic activities carried out in the source reduction, recycling, substitution, reuse, disposal, and management of hazardous materials [4,5,6,7,8]. Zhao et al. [9] found that the higher the standards that are set for proper waste recycling, the smaller the environmental impact this process will have, thus they have to keep on accepting new product orders from their customers, while at the same time recycling products that are returned. Under such circumstances, the role of a third-party reverse logistics provider is established through contracts and cooperation [10]. Savaskan and Van Wassenhove [11] found that when a direct collection system is used to collect used products directly from the consumers, then the channel profits are driven by the impact of the scale of returns on collection efforts. Jacobs and Subramanian [12] examined the notion of shared responsibility and its impact on the collection/recycling efforts in a decentralized, two-level supply chain and devised a measure of overall social welfare and demonstrated that social welfare can be improved by the sharing of responsibility between the supply chain tiers. The WEEE Directive issued in February 2003 by the European Union (EU) held producers responsible for waste electrical and electronic equipment at end of life. Under the extended producer responsibility (EPR), end-of-life costs are internalized into the manufacturer’s bottom line and are a significant consideration [13].
Atasu, Savary, and van Wassenhove [14] provided an alternative and complementary approach that considered demand-related issues, such as the existence of green segments, original equipment manufacturer (OEM) competition, and product life cycle effects, which showed that (a) the higher the competition level, the higher the benefits of remanufacturing; (b) remanufacturing is more beneficial under competition than under monopoly, even in the absence of a green segment; (c) higher diffusion rates accentuate the benefits/drawbacks of remanufacturing. Amin and Zhang [15] constructed a two-phase closed loop supply chain (CLSC) model; in the first phase, a framework for supplier selection criteria in reverse logistics is proposed, with the weight of each supplier being determined using a fuzzy method based on qualitative criteria; in the second phase, the authors proposed a multi-objective, mixed-integer linear programming model to determine which suppliers and refurbishing sites should be selected, and find the optimal number of parts and products in the CLSC network. Dey and Cheffi [16] developed an analytical framework for measuring the environmental performance of manufacturing supply chains with six key constructs, namely environmental planning, environmental auditing, management commitment, environmental performance, economic performance, and operational performance. Zhang, Wang and Ren [17] found that different production costs will impact the choice of production modes of manufacturers when consumers have different valuations of the products. Giri and Sharma [18] observed that a mixed strategy (simultaneous manufacturing and remanufacturing) provides the maximum system profit. Sheu, Chou and Hu [19] used a linear multi-objective programming model to integrate logistics problems of green supply chain management by formulating factors such as the used-product return ratio and corresponding subsidies from governmental organizations for reverse logistics. Results from their proposed integrated logistics operational model showed that the chain-based aggregate net profits of a selected notebook computer manufacturer can be improved by 21.1% relative to the existing operational performance of the supply chain. Matsukawa [20] examined the welfare impact of emission taxes and subsidies in a green market and found that an emission tax is always welfare-dominant over a subsidy on clean consumer products.
Alizadeh-Basban and Taleizadeh [3] discovered that governments can improve the enthusiasm of and opportunities for enterprises and consumers participating in green supply chains by setting appropriate subsidies for the enterprises and consumers, and by imposing penalties on enterprises that do not employ green supply chain management. Mitra and Webster [21] found that the introduction of government subsidies increases remanufacturing activity, and governments should consider subsidy schemes with some positive fraction of the subsidy paid to the manufacturer. Furthermore, subsidy sharing creates incentives for the manufacturer to design a product that is more suitable for remanufacturing, and to be more open to efforts to increase the return rate of end-of-life products. Using game theory to limit the environmental burden within a supply chain, Zhao, Neighbour, Han, et al. [22] identified governmental punitive and incentive policies as being one of the major factors influencing strategies of manufacturers in reducing the life cycle environmental risk of materials and carbon emissions. Furthermore, environmental policies addressing industries could potentially become more effective if policy instruments affecting the demand side (consumers) of the market are given more prominence in the policy instrument package [23]. With the help of the Cournot output competition model of classical competition and cooperation theory, as well as the Stackelberg output competition model, Xue, Teunter, Zhu, et al. [24] study a duopoly channel consisting of a high-end firm and a low-end firm, in which they derive a condition for the low-end firm to engage in remanufacturing high-end cores, and show how the high-end firm reacts to limit the loss of market share. In a Stackelberg model, there is a unique equilibrium in which both the leading firm and its follower invest in R&D processes; only the follower delegates quantity decisions and the follower can overcome the first mover advantage of the quantity leader and obtain a higher profit than the leader [25]. At early stages of the product life cycle, when uncertainty is the dominating factor, the Stackelberg leader faces the possibility of either overshooting or losing its market leadership position to the second mover, as the impact of uncertainty may be either positive or negative [26]. Toyasaki, Boyaci and Verter [27] studied two prevailing types of take-back schemes for electrical and electronic equipment waste recycling by modeling competitive decision-making as a two-stage sequential game between competing manufacturers and recyclers. They found that both recycler and manufacturer enjoyed lower product prices and higher profits. When the substitutability level between the manufacturer’s original products is high, or economies of scales in recycling are very strong, recyclers are noted to show a preference for the monopolistic scheme. Further, higher collection rates also render recycler consolidation desirable for all stakeholders. Sheu [28] showed in his study that financial intervention by the government generates a significant effect on the relative bargaining power of green supply chain members and a bargaining framework underlying the duopoly-oligopoly context may contribute to the negotiation outcome most profitable for green supply chain members. Sheu and Chen [29] found that the government should adopt green taxation and subsidization to ensure that green profit attributed to green-product production is non-negative. Their three-stage game-theoretic model revealed that under equilibrium conditions, social welfare and chain-based profits improve by 27.8% and 306.6%, respectively, compared with the case without financial intervention. When they used a two-stage Stackelberg game model to investigate the dynamics between the supply chain players, given three supply chain network structures, Liu, Anderson and Cruz [30] took into consideration both the production competition between partially substitutable products made by different manufacturers and the competition between retail stores. They found that as consumers’ environmental awareness increases, retailers and manufacturers with superior eco-friendly operations will benefit. In addition, higher levels of retail competition may make manufacturers with inferior eco-friendly operations more likely to benefit from the increase in consumers’ environmental awareness. This study aims to investigate two types of competition within a duopoly market, with a Cournot model of equal competition and a Stackelberg model of leader-follower competition and explore the impact of government policy on green supply chains with the help of Cournot and Stackelberg models of duopoly. The proposed research framework and model is built on the works of Atasu, Savary and van Wassenhove [14], Giri and Sharma [18], Zhao, Neighbour, Han, et al. [22], Daugbjerg and Sonderskov [23], and Liu, Anderson and Cruz [30].

3. Model Formula and Solution

There are two segments to the manufacturer’s green supply chain system, namely: (a) forward logistics, in which the manufacturer purchases new raw material to produce new goods for sale to consumers; (b) reverse logistics in which the manufacturer recollects used products, screens for reusable parts, and uses these parts in remanufacturing processes, thus returning to forward logistics. In this study, manufacturers aim to maximize their profit while formulating their pricing strategies, while government strives to maximize social welfare, based on the assumption that the market is a duopoly, with the two manufacturers producing both new and remanufactured products. Consumers have different opinions of these manufacturers and their products. These two manufacturers produce equal amounts of the same new and remanufactured products for the market and are engaged in a competitive relationship. We take the approach of Cournot price competition, in which both manufacturers strive to maximize their profit as they act simultaneously to decide their pricing. In addition, we assume that the raw material required for remanufacturing is adequate, the output capacity is not limited, the overall market size is 1, and the sale markets are divided into the general market and green market. General market refers to the market in which new products are regarded more favorably than remanufactured products, while green market refers to the market in which consumers will buy remanufactured products [14]. The demand model used in this study assumes that the general consumers’ perception of value of products labeled as “remanufactured” is lower than those labeled as “new” [31,32,33,34]. In a given period, each consumer will buy, at most, one product; and then only if his/her valuation is greater than or equal to the price. The perceived value of the new and remanufactured products is uniformly distributed between 0 and 1 within the consumer population. Manufacturer substitution, government subsidy amount, subsidy ratio, pricing, and cost are all between 0 and 1. This study assumes that both manufacturers in a duopoly market adopt a mixed production system. Generally, the prices of remanufactured products are lower than those of new products, and consumers may choose to purchase one rather than the other under different circumstances. Through market demand, manufacturers will decide the optimal production amount for these two types of products using a mixed strategy for maximum profit [18]. The first stage involves deciding the government subsidy amount by maximizing social welfare. In the second stage, this study will use a Cournot duopoly model to decide the pricing of these two companies with the aim of profit maximization.

3.1. Notation

3.1.1. Basic Symbols

Let evaluation index be V, where 0 < V < 1:
V1: market evaluation of Manufacturer A (the leader).
V2: market evaluation of Manufacturer B (the follower).
NCSi: the consumer surplus of new product ni, i = 1, 2.
NPSi: the producer surplus of new product ni, i = 1, 2.
RCSi: the consumer surplus of remanufactured product ri, i = 1, 2.
RPSi: the producer surplus of remanufactured product ri, i = 1, 2.
NSW: the social welfare of new product.
RSW: the social welfare of remanufactured product.

3.1.2. Input Parameters

θ: the substitution ratio between remanufactured and new products, 0 < θ < 1. The closer θ is to 1, the closer the remanufactured product is able to substitute the new product. Under the proposed situation, this study takes 0 < θ < 0.5.
α: the ratio of market evaluation for Manufacturer B (the follower) to the market evaluation of Manufacturer A (the leader), as held by general consumers, and 0 < α< 1. The closer α is to 1, the closer the market evaluations of these two manufacturers.
β: the proportion of green consumers in the market population, which is the number of green consumers divided by total number of consumers. Under the proposed situation, this study sets it as 0 < β < 0.5.
qn1: the production demand for new product by Manufacturer A (the leader).
qn2: the production demand for new product by Manufacturer B (the follower).
qr1: the production demand for remanufactured product by Manufacturer A (the leader).
qr2: the production demand for remanufactured product by Manufacturer B (the follower).
Cn1: the production cost of new product of Manufacturer A (the leader).
Cn2: the production cost of remanufactured product of Manufacturer B (the follower).
Cr: per unit production cost of remanufactured product.
x: the ratio of government subsidy to consumers.
1 − x: the ratio of government subsidy to manufacturers.

3.1.3. Decision Variables

Pn1: the production price of new product by Manufacturer A (the leader).
Pn2: the production price of new product by Manufacturer B (the follower).
Pr1: the production price of remanufactured product by Manufacturer A (the leader).
Pr2: the production price of remanufactured product by Manufacturer B (the follower).
G: the government subsidy amount for demand of remanufactured product.

3.1.4. Objective Functions

π: the profit available to the entire group of green supply chain members.
π1: the profit available to Manufacturer A (the leader) in the green supply chain.
π2: the profit available to Manufacturer B (the follower) in the green supply chain.
SW: social welfare function.

3.2. Demand Functions in the Duopoly Model

This study assumes that the overall market evaluation is V. The market evaluation of Manufacturer A (the leader) is V1, and V2 is the market evaluation for Manufacturer B (the follower), thus the market evaluation of a duopoly market is V1 + V2 = V. The relationship between the market evaluation of these two manufacturers is signified by α, thus αV1 = V2. Based on these two assumptions, the market evaluation of Manufacturer A (the leader) is obtained as (1 + α)V1 = V, and the market evaluation of Manufacturer B is obtained as (1 + α)V2 = αV. Let the respective average pricing of new and remanufactured products for both Manufacturer A (the leader) and Manufacturer B (the follower) be 2PN = Pn1 + Pn2 and 2PR = Pr1 + Pr2. When the market evaluation of new product V is greater than PR, the general consumer will purchase the product. When the market evaluation of remanufactured product θ V is greater than PR, the general consumer will purchase the remanufactured product. When both market evaluations are the same, the general consumer will purchase both products. Utilizing this relationship, when the critical point for market evaluation is known, we can deduce value V as follows
V P N = θ V P R V ( P n 1 + P n 2 2 ) = θ V ( P r 1 + P r 2 2 ) V = ( P n 1 + P n 2 ) ( P r 1 + P r 2 ) 2 ( 1 θ )
When the market evaluation of new product V1 is greater than Pn1, the general consumer will choose to purchase the new product from Manufacturer A. When the market evaluation of new product V2 is greater than Pn2, the general consumer will purchase the new product from Manufacturer B. When both market evaluations are the same, the general consumer will purchase products from both manufacturers. Utilizing this relationship, when the critical point for market evaluation is known, we can obtain
V = ( 1 + α ) ( P n 1 P n 2 ) 1 α
When the market evaluation of remanufactured product θ V is greater than Pr1, the general consumer will choose to purchase the remanufactured product from Manufacturer A. When the market evaluation of new product θ V is greater than Pr2, general consumer will purchase the remanufactured product from Manufacturer B. When both market evaluations are the same, the general consumer will purchase remanufactured products from both manufacturers. Utilizing this relationship, when the critical point for market evaluation is known, we can make the following deductions
θ V 1 P r 1 = θ V 2 P r 2 V = ( 1 + α ) ( P r 1 P r 2 ) θ ( 1 α ) , and   θ V 2 P r 2 0 V P r 2 ( 1 + α ) α θ
Synthesizing the above, demand functions can be derived, as shown in Equations (4) to (7):
New product produced by Manufacturer A:
1 ( 1 + α ) ( P n 1 P n 2 ) 1 α
New product produced by Manufacturer B:
( 1 + α ) ( P n 1 P n 2 ) 1 α ( P n 1 + P n 2 ) ( P r 1 + P r 2 ) 2 ( 1 θ )
Remanufactured product produced by Manufacturer A:
( P n 1 + P n 2 ) ( P r 1 + P r 2 ) 2 ( 1 θ ) ( 1 + α ) ( P r 1 P r 2 ) θ ( 1 α )
Remanufactured product produced by Manufacturer B:
( 1 + α ) ( P r 1 P r 2 ) θ ( 1 α ) P r 2 ( 1 + α ) α θ
As green consumers are more environmentally friendly and more receptive to the concept of recycling, they will purchase remanufactured products instead of new products. This study therefore only considers remanufactured products, and not the substitution ratio θ between new and remanufactured products. When the market evaluation of remanufactured product V1 is greater than Pr1, the green consumer will choose to purchase the remanufactured product from Manufacturer A. When the market evaluation of new product V2 is greater than Pr2, the green consumer will purchase the remanufactured product from Manufacturer B. When both market evaluations are the same, the green consumer will purchase remanufactured products from both manufacturers. Utilizing this relationship, when the critical point for market evaluation is known, we can make the following deductions
V 1 P r 1 = V 2 P r 2 V = ( 1 + α ) ( P r 1 P r 2 ) ( 1 α ) , V 2 P r 2 0 V P r 2 ( 1 + α ) α
Therefore, demand functions can be derived, as shown in Equations (9) to (11)
Demand for new product: 0
Demand for remanufactured product produced by Manufacturer A:
1 ( 1 + α ) ( P r 1 P r 2 ) ( 1 α )
Demand for remanufactured product produced by Manufacturer B:
( 1 + α ) ( P r 1 P r 2 ) ( 1 α ) P r 2 ( 1 + α ) α
Based on the market assumptions shown above, the demand of green consumer is multiplied by the market share of green consumer β, the demand of general consumer is multiplied by the market share of general consumer (1 − β) and both are then added together to get the total market demand. Thus, the demand for each type of product is given by Equations (12) to (15), as follows
q n 1 = ( 1 β ) [ 1 ( 1 + α ) ( P n 1 P n 2 ) 1 α ]
q n 2 = ( 1 β ) [ ( 1 + α ) ( P n 1 P n 2 ) 1 α ( P n 1 + P n 2 ) ( P r 1 + P r 2 ) 2 ( 1 θ ) ]
q r 1 = ( 1 β ) [ ( P n 1 + P n 2 ) ( P r 1 + P r 2 ) 2 ( 1 θ ) ( P r 1 P r 2 ) ( 1 + α ) ( 1 α ) θ ] + β [ 1 ( P r 1 P r 2 ) ( 1 + α ) 1 α ]
q r 2 = ( 1 β ) [ ( P r 1 P r 2 ) ( 1 + α ) ( 1 α ) θ P r 2 ( 1 + α ) α θ ] + β [ ( P r 1 P r 2 ) ( 1 + α ) 1 α ( 1 + α ) P r 2 α ]
Let the profit function be defined as π = (PC) q; we can then consider the factor of government subsidy, and with the different allocation ratio, the demand and profit functions will change accordingly. If the government is to encourage manufacturers to produce remanufactured products, (1 − x) G will be subtracted from the cost of remanufactured products Cr in the total profit Equations (16) and (17) for Manufacturer A and Manufacturer B, respectively.
π 1 = ( P n 1 C n 1 ) × q n 1 + [ P r 1 C r + ( 1 x ) G ] × q r 1
π 2 = ( P n 2 C n 2 ) × q n 2 + [ P r 2 C r + ( 1 x ) G ] × q r 2
When a subsidy is implemented for consumers, it will affect consumer demand as it will lead consumers to believe that there is a cost reduction for remanufactured products. By removing the cost of remanufactured products from the demand function, Equations (18) to (21) are derived.
q n 1 = ( 1 β ) [ 1 ( 1 + α ) ( P n 1 P n 2 ) 1 α ]
q n 2 = ( 1 β ) [ ( 1 + α ) ( P n 1 P n 2 ) 1 α ( P n 1 + P n 2 ) ( P r 1 + P r 2 2 x G ) 2 ( 1 θ ) ]
q r 1 = ( 1 β ) [ ( P n 1 + P n 2 ) ( P r 1 + P r 2 2 x G ) 2 ( 1 θ ) ( P r 1 P r 2 ) ( 1 + α ) ( 1 α ) θ ] + β [ 1 ( P r 1 P r 2 ) ( 1 + α ) 1 α ]
q r 2 = ( 1 β ) [ ( P r 1 P r 2 ) ( 1 + α ) ( 1 α ) θ ( P r 2 x G ) ( 1 + α ) α θ ] + β [ ( P r 1 P r 2 ) ( 1 + α ) 1 α ( 1 + α ) ( P r 2 x G ) α ]
By rearranging the total profit Equations (16) and (17), we obtain the following
π 1 = ( P n 1 C n 1 ) × q n 1 + [ P r 1 C r + ( 1 x ) G ] × q r 1 = ( P n 1 C n 1 ) × ( 1 β ) [ 1 ( 1 + α ) ( P n 1 P n 2 ) 1 α ] + [ P r 1 C r + ( 1 x ) G ] × { ( 1 β ) [ ( P n 1 + P n 2 ) ( P r 1 + P r 2 2 x G ) 2 ( 1 θ ) ( P r 1 P r 2 ) ( 1 + α ) ( 1 α ) θ ] + β [ 1 ( P r 1 P r 2 ) ( 1 + α ) 1 α ] }
π 2 = ( P n 2 C n 2 + 0.2 ) × q n 2 + [ P r 2 C r + ( 1 x ) G ] × q r 2 = ( P n 2 C n 2 ) × ( 1 β ) [ ( 1 + α ) ( P n 1 P n 2 ) 1 α ( P n 1 + P n 2 ) ( P r 1 + P r 2 2 x G ) 2 ( 1 θ ) ] + [ P r 2 C r + ( 1 x ) G ] { ( 1 β ) [ ( P r 1 P r 2 ) ( 1 + α ) ( 1 α ) θ ( P r 2 x G ) ( 1 + α ) α θ ] + β [ ( P r 1 P r 2 ) ( 1 + α ) 1 α ( 1 + α ) ( P r 2 x G ) α ] }
We define social welfare as the summation of producer surplus and consumer surplus; both can be derived as illustrated from Equations (24) to (31).
The consumer surplus and producer surplus for the production of new products by Manufacturer A are defined as Equations (24) and (25), respectively.
( 1 β ) P n 1 P n 2 + 1 α 1 + α 1 ( 1 + α ) ( y P n 2 ) 1 α d y
( 1 β ) ( P n 1 C n 1 ) [ 1 ( 1 + α ) ( P n 1 P n 2 ) 1 α ]
The consumer surplus and producer surplus for production of remanufactured products by Manufacturer A are defined as Equations (26) and (27), respectively.
( 1 β ) P r 1 θ ( 1 α ) ( P n 1 + P n 2 P r 2 + 2 x G ) + 2 ( 1 θ ) ( 1 + α ) P r 2 2 ( 1 θ ) + ( 1 α ) θ ( P n 1 + P n 2 ) ( y + P r 2 2 x G ) 2 ( 1 θ ) ( y P r 2 ) ( 1 + α ) ( 1 α ) θ d y + β P r 1 P r 2 + 1 α 1 + α 1 ( y P r 2 ) ( 1 + α ) 1 α d y
( 1 β ) [ P r 1 C r + ( 1 x ) G ] [ ( P n 1 + P n 2 ) ( P r 1 + P r 2 2 x G ) 2 ( 1 θ ) ( P r 1 P r 2 ) ( 1 + α ) ( 1 α ) θ ] + β [ P r 1 C r + ( 1 x ) G ] [ 1 ( P r 1 P r 2 ) ( 1 + α ) 1 α ]
The consumer surplus and producer surplus for production of new products by Manufacturer B are defined as Equations (28) and (29), respectively.
( 1 β ) P n 2 2 ( 1 + α ) ( 1 θ ) P n 1 ( 1 α ) ( P n 1 P r 1 P r 2 + 2 x G ) 2 ( 1 + α ) ( 1 θ ) + ( 1 α ) ( 1 + α ) ( P n 1 y ) 1 α ( P n 1 + y ) ( P r 1 + P r 2 2 x G ) 2 ( 1 θ ) d y
( 1 β ) ( P n 2 C n 2 ) [ ( 1 + α ) ( P n 1 P n 2 ) 1 α ( P n 1 + P n 2 ) ( P r 1 + P r 2 2 x G ) 2 ( 1 θ ) ]
The consumer surplus and producer surplus for production of remanufactured products by Manufacturer A are defined as Equations (30) and (31), respectively.
( 1 β ) P r 2 α P r 1 + ( 1 α ) x G ( P r 1 y ) ( 1 + α ) ( 1 α ) θ ( y x G ) ( 1 + α ) α θ d y + β P r 2 α P r 1 + ( 1 α ) x G ( P r 1 y ) ( 1 + α ) 1 α ( 1 + α ) ( y x G ) α d y
( 1 β ) [ P r 2 C r + ( 1 x ) G ] [ ( P r 1 P r 2 ) ( 1 + α ) ( 1 α ) θ ( P r 2 x G ) ( 1 + α ) α θ ] + β [ P r 2 C r + ( 1 x ) G ] [ ( P r 1 P r 2 ) ( 1 + α ) 1 α ( 1 + α ) ( P r 2 x G ) α ]
In this study, the social welfare of new products is defined as the sum of consumer and producer surplus of new products, as shown in Equation (32), while the social welfare of remanufactured products is the sum of consumer and producer surplus of remanufactured products, shown as Equation (33). The summation of these two social welfares will be the total social welfare (SW) that this study strives to discover.
NSW = NCS1 + NCS2 + NPS1 + NPS2
RSW = RCS1 + RCS2 + RPS1 + RPS2

3.3. Cournot Model Solution

As shown earlier, Equations (22) and (23) provide the profit functions. In order to simplify the profit functions to facilitate derivation and calculation, we define Equations (34) to (39) for transformation.
A = ( 1 + α ) ( 1 β ) 1 α
B = 1 β 2 ( 1 θ )
C = C r ( 1 x ) G
D = ( 1 + α ) β 1 α
E = ( 1 + α ) ( 1 β ) α
F = ( 1 + α ) β α
Using this variable transformation, new profit equations can be found, as shown in Equations (40) and (41).
π 1 = ( P n 1 C n 1 ) [ ( 1 β ) A ( P n 1 P n 2 ) ] + ( P r 1 C ) { B [ ( P n 1 + P n 2 ) ( P r 1 + P r 2 2 x G ) ] A θ ( P r 1 P r 2 ) + β D ( P r 1 P r 2 ) }
π 2 = ( P n 2 C n 2 ) { A ( P n 1 P n 2 ) B [ ( P n 1 + P n 2 ) ( P r 1 + P r 2 2 x G ) ] } + ( P r 2 C ) [ A θ ( P r 1 P r 2 ) E ( P r 2 x G ) θ + D ( P r 1 P r 2 ) F ( P r 2 x G ) ]
The Cournot competition model assumes that both manufacturers make their pricing decisions with the aim of maximizing profits, and then adjust these prices according to the market competition. The pricing functions of these two manufacturers will meet, and this will be the equilibrium sought. To find the optimal solution for each of the manufacturers, the profit formulas Equations (40) and (41) are maximized by first-order differential with respect to the variables Pn1, Pr1 and Pn2, Pr2 respectively. The price response functions for both manufacturers A and B can be obtained through Equations (42) to (45). We can then use Mathematica 8 software to solve Equations (42) to (45) to obtain the Cournot equilibrium as follows:
P n 1 * = [ 2 A ( B + D + A θ ) + B 2 4 A ( B + A θ + D ) B 2 ] P n 2 + [ B ( D B + A θ ) 4 A ( B + A θ + D ) B 2 ] P r 2 + 2 ( D + A θ + B ) ( 1 β B C + A C n 1 ) + B ( β + B C + C D + 2 B x G + A C θ ) 4 A ( B + A θ + D ) B 2
P r 1 * = [ 3 A B 4 A ( B + A θ + D ) B 2 ] P n 2 + [ 2 A ( D + A θ B ) 4 A ( B + A θ + D ) B 2 ] P r 2 + B ( 1 β + A C n 1 B C ) + 2 A ( B C + β + C D + 2 B x G + A C θ ) 4 A ( B + A θ + D ) B
P n 2 * = [ 2 ( A B ) ( D + F + A θ + E θ ) 4 ( A + B ) ( D + F + A θ + E θ ) B 2 ] P n 1 + [ 2 B ( D + F + A θ + E θ ) + B ( D + A θ ) 4 ( A + B ) ( D + F + A θ + E θ ) B 2 ] P r 1 + 2 ( D + F + A θ + E θ ) ( A C n 2 + B C n 2 2 B x G ) + B ( C D B C n 2 + A C θ + C E θ + F x G + E x G θ ) 4 ( A + B ) ( D + F + A θ + E θ ) B 2
P r 2 * = [ 4 ( A + B ) ( D + F + A θ + E θ ) ( A B ) B [ 4 ( A + B ) ( A θ + E θ + D + F ) B 2 ] A B B ] P n 1 + [ 2 ( A + B ) ( D + A θ ) + 4 B ( A + B ) ( D + F + A θ + E θ ) 4 ( A + B ) ( A θ + E θ + D + F ) B 2 1 ] P r 1 + 4 ( A + B ) ( D + F + A θ + E θ ) ( A C n 2 + B C n 2 2 B x G ) + 2 B ( A + B ) ( C D B C n 2 + A C θ + C E θ + F x G + E x G θ ) B [ 4 ( A + B ) ( A θ + E θ + D + F ) B 2 ]

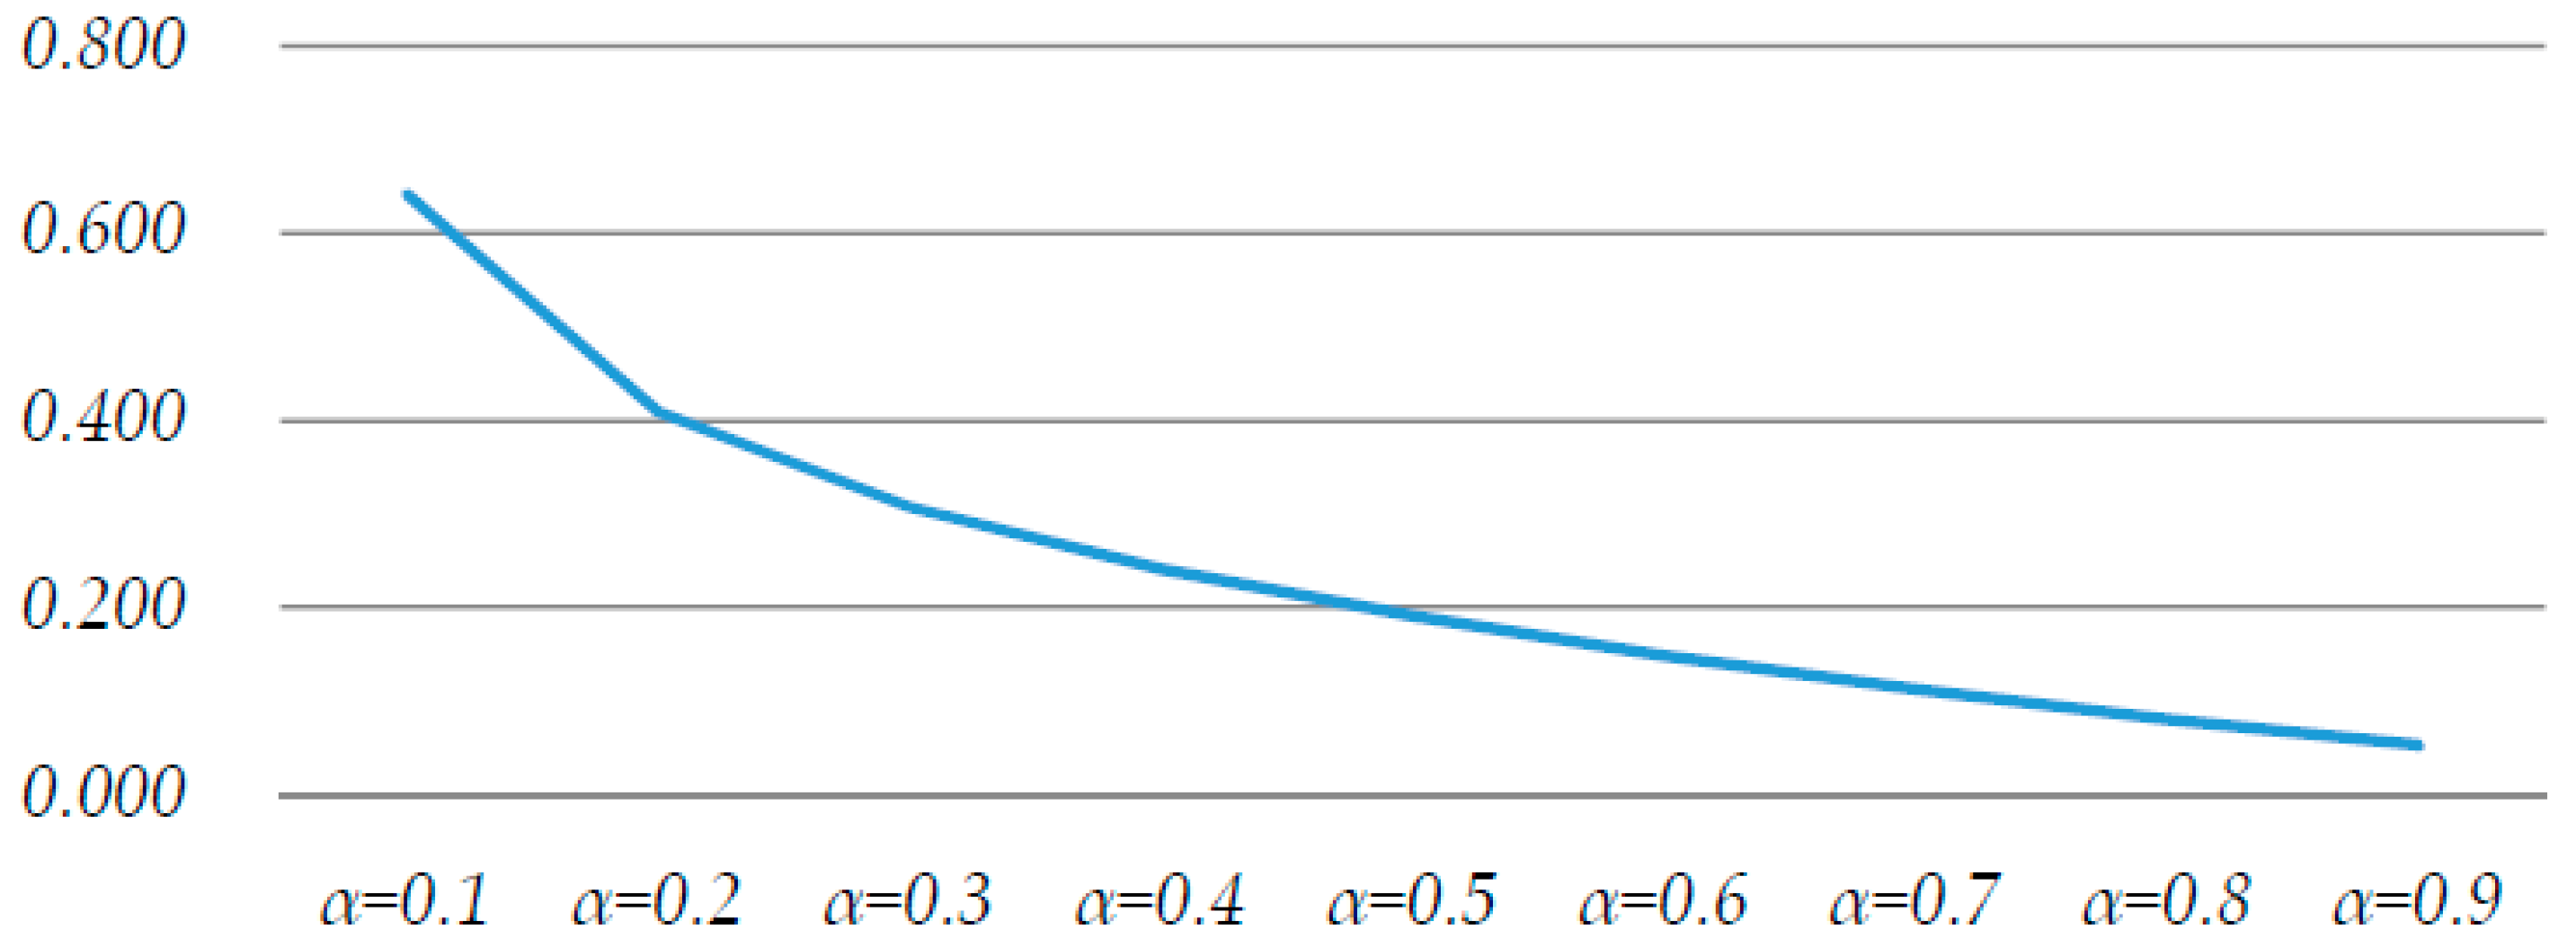
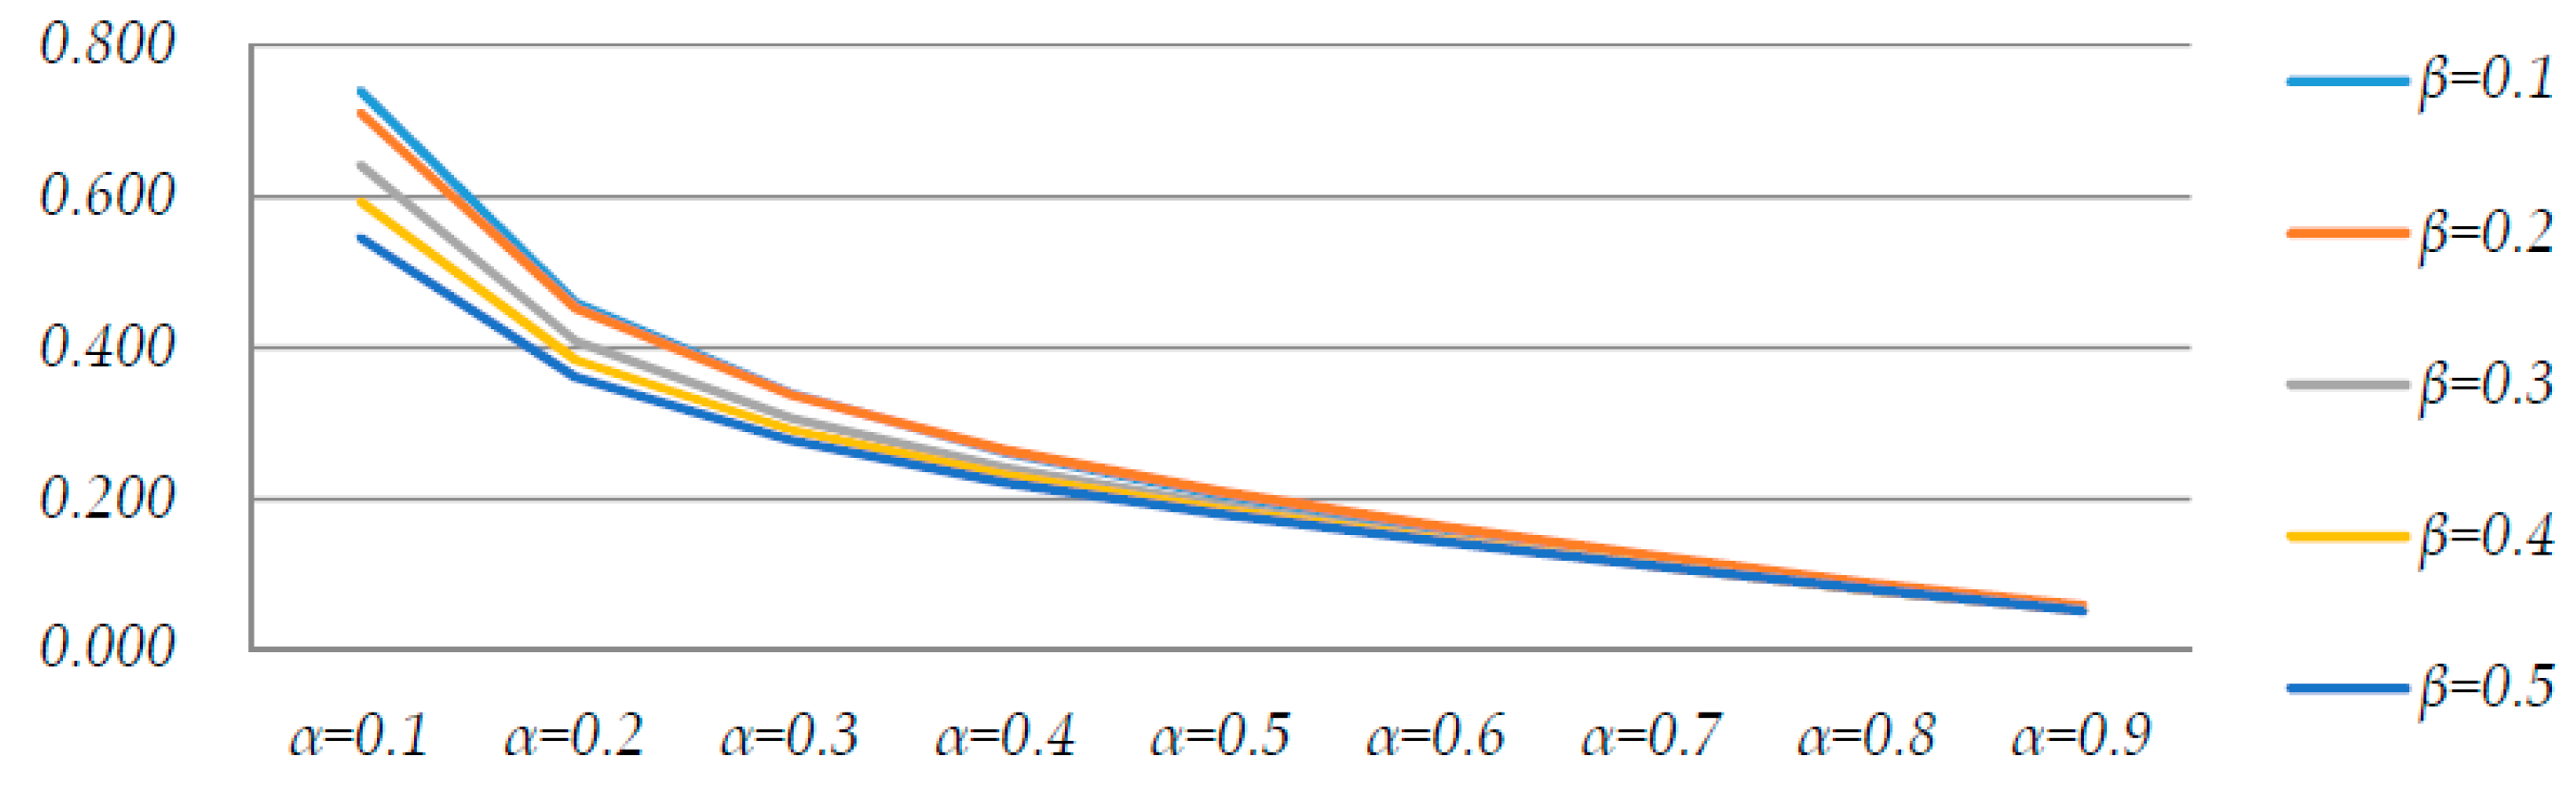
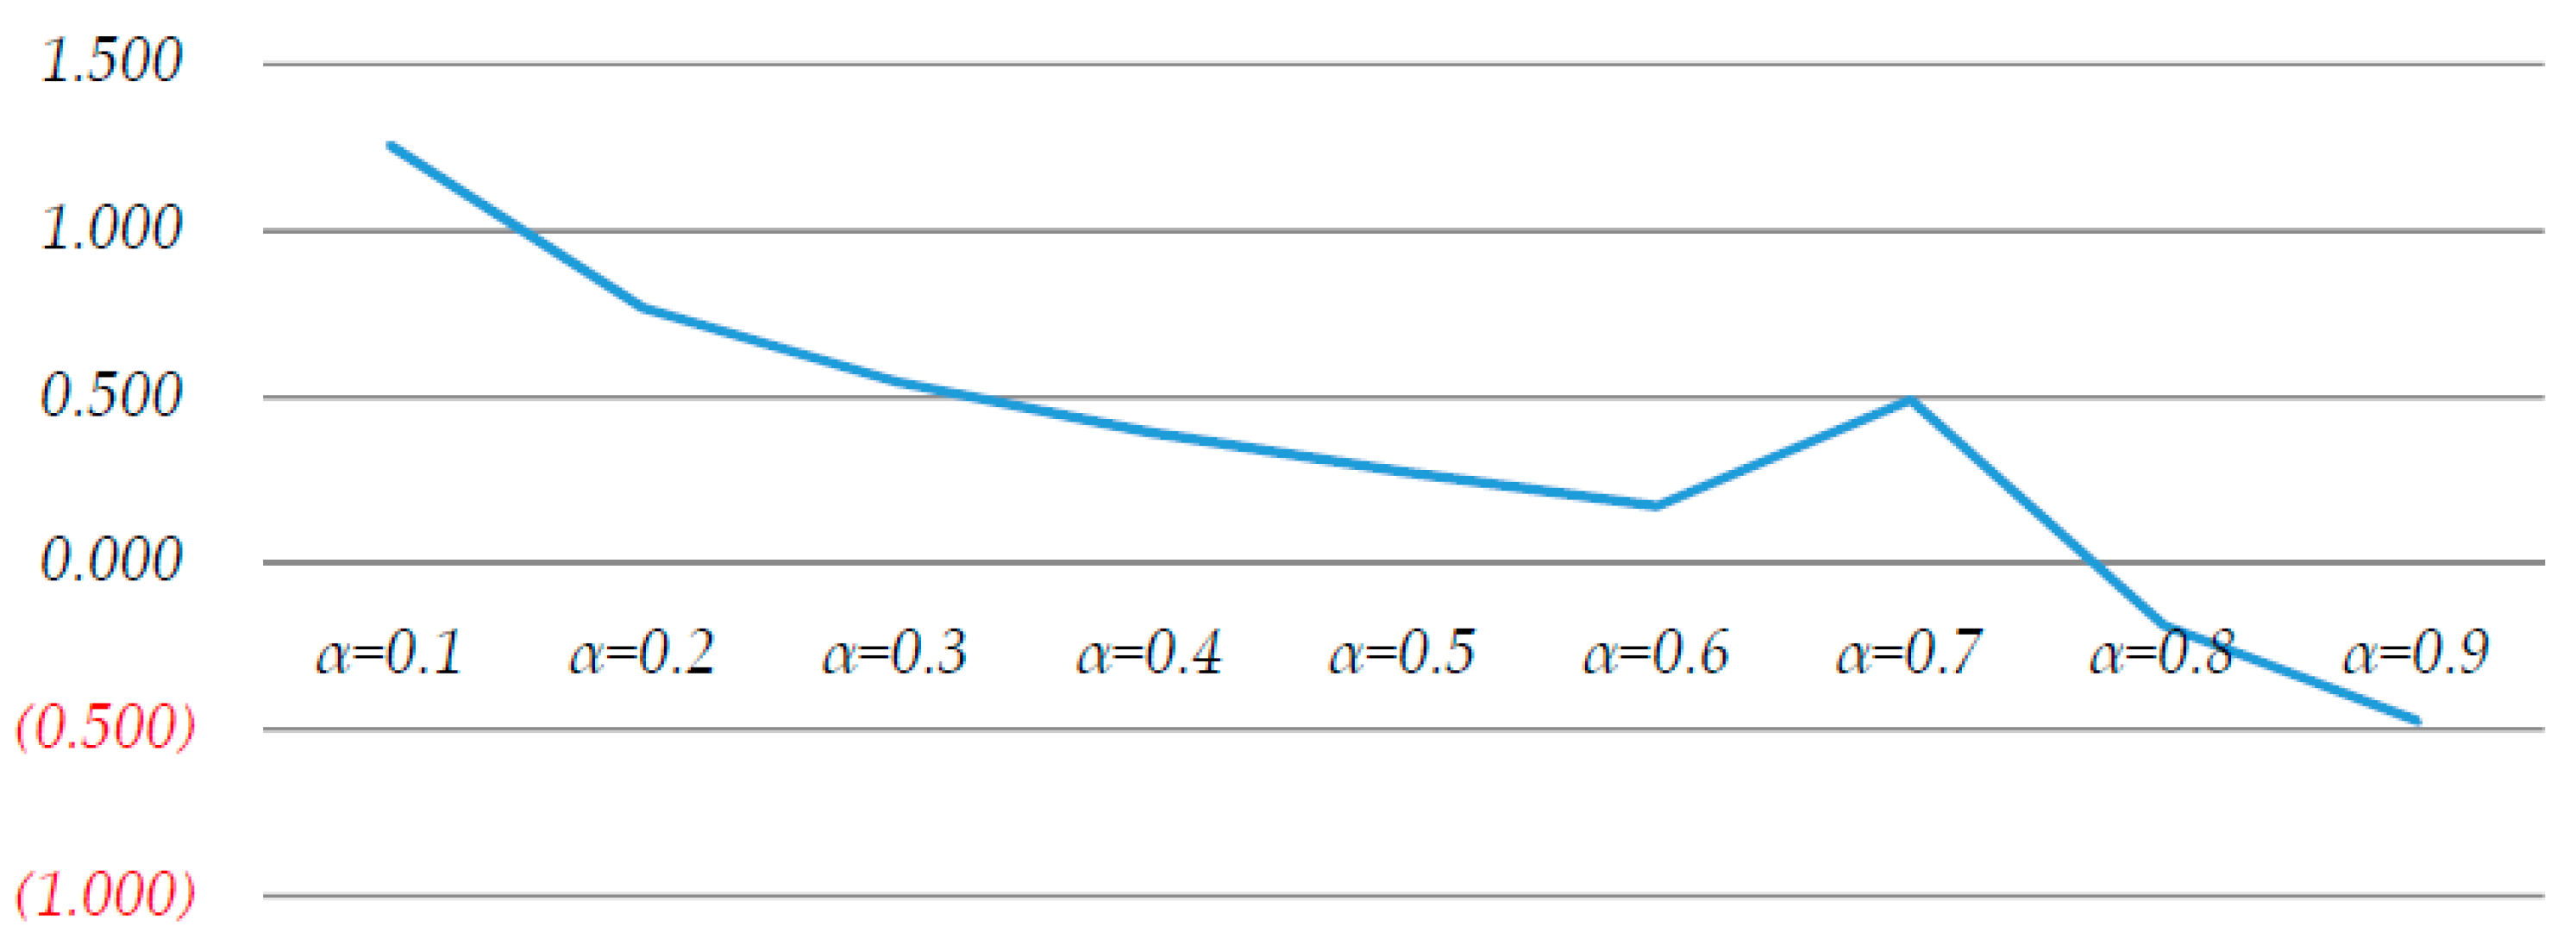
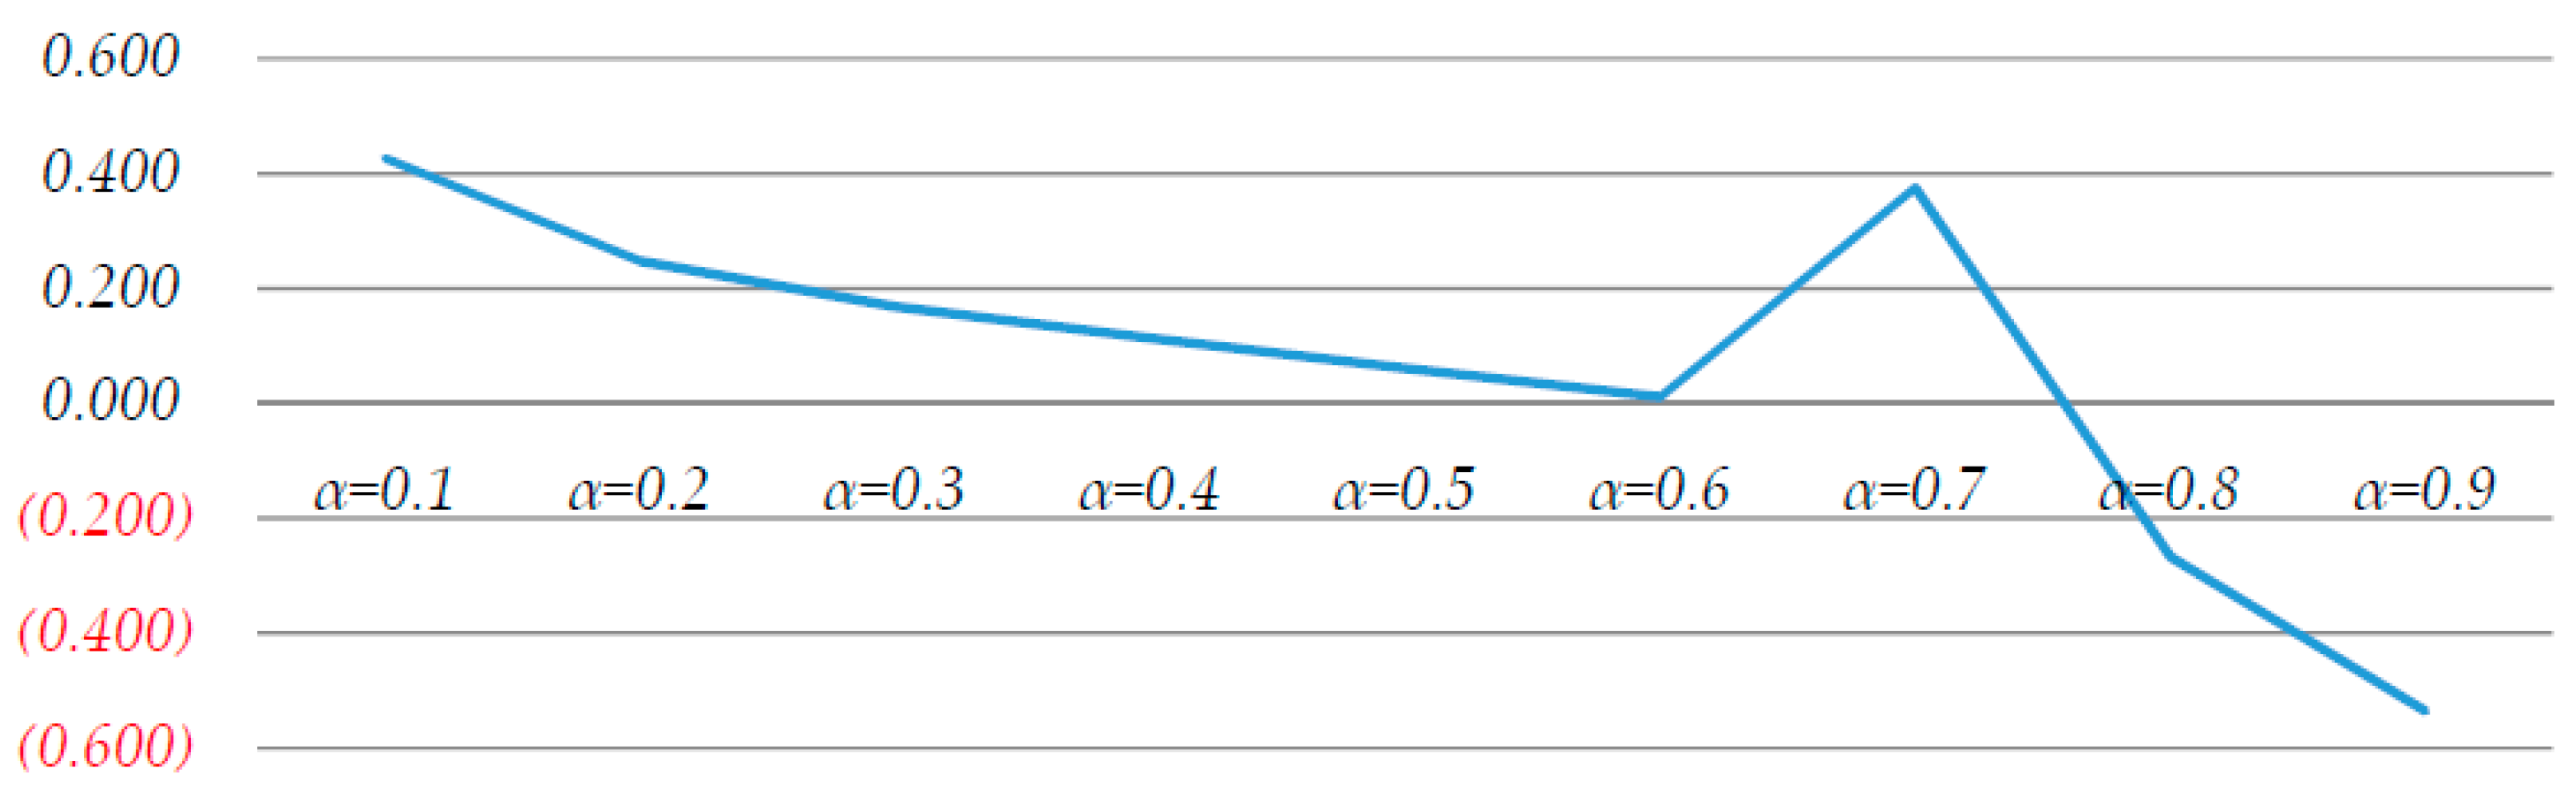
4. Sensitivity Analysis

Due to the additional investment costs Manufacturer A has to make in order to gain market advantage, its production cost will definitely be higher than that of Manufacturer B. Further, as the remanufactured product market is considered as an emerging market, this study will set the production of remanufactured products for both manufacturers to be the same. Thus the production costs will be Cn1 = 0.4, Cn2 = 0.3, and Cr = 0.3, respectively. The other parameters in this study will be set as follows: the substitution ratio between remanufactured products and new products, θ = 0.2; the ratio of market evaluation for Manufacturer B to the market evaluation of Manufacturer A, α = 0.7; the proportion of green consumers in the market population, β = 0.2; the ratio of government subsidy to consumers, x = 0.6; the government subsidy amount for demand of remanufactured products, G = 0.6. With the set of base values above, minor adjustments will be made to relevant parameters in different scenarios. Using unit ratios, the effects on the objective functions caused by changing the parameters can be observed.
Under different competition situations, this study aims to explore the relationships of product substitutability between two manufacturers, consumer market and product evaluation, subsidy allocation, and overall profit of the green supply chain, and the incentives for consumers to purchase remanufactured products. The product substitutability between two manufacturers, methods of subsidy allocations, and the amount of government subsidy will be used as parameters in order to investigate the influences they have on the models discussed earlier. In this study, the market is assumed to be a duopoly, and consumers have different and unequal opinions of the two manufacturers. None of the manufacturers has a monopoly on the market and the value of α is assumed to be between 0 and 1. Two important objectives should be noted in this section, namely (i) to explore the changes in a green supply chain under different market evaluations; and (ii) to explore the effects on social welfare. This study also tries to explain how optimal pricing decisions should be made under different situations from the perspectives of manufacturers and government.

4.1. Changes in Green Supply Chain as a Whole

We assume the proportion of green market (β) to be 0.3, and explore the differences between these two models with the overall profit of the green supply chain in mind, as shown in Figure 1. Using β and the market evaluation ratios of these two manufacturers (α) as varying parameters, Figure 1 and Figure 2 show the different profits for the green supply chain.
As shown in Figure 1 and Figure 2, the more heated the competition, the smaller the profit of the green supply chain; the more similar the market strength of the two manufacturers, the more intense the competition becomes. This will lead to price wars that will inevitably reduce the profit of the green supply chain.

4.2. Effects on Social Welfare

We assume the proportion of the green market (β) to be 0.2, and set the market evaluation ratios (α) as nine different possibilities, from 0.1 to 0.9, and find the effects of government subsidy policy on social welfare under different duopoly competition models.
From Figure 3 and Figure 4, the following can be deduced.
Figure 3 is similar to Figure 4: both figures show similar movements within these two models, which signify the effects that a consumer surplus of remanufactured products have on the trend of social welfare. Other factors presented consistent decreasing or increasing effects.
Below α = 0.6, the value of social welfare is declining; below α = 0.6, both manufacturers choose to produce new products in order to maximize their profits, which will affect the social welfare created by remanufactured products. Under the situation where both manufacturers aim to distribute profits, consumer surplus is depleted.
When α = 0.7, a special value appears; as explained, when α = 0.7, both manufacturers start to produce both new and remanufactured products, and the production of remanufactured products is viewed similarly to that of new products. As a result, consumer surplus increases. When the difference in the market strength of both manufacturers grows smaller, when α is greater than 0.7, the effects of government subsidy policy on manufacturers producing remanufactured products also become smaller. At this point, manufacturers will introduce new product lines and hold promotional activities with the hope of attracting consumers to purchase. All these efforts will prompt consumers to purchase new products instead of remanufactured products, and indirectly bring the consumer surplus of remanufactured products and social welfare into negative territory.

5. Conclusions and Discussion

With the daunting threat of global warming and the rising prices of raw materials, nations worldwide are realizing the importance of green environment management and other related green issues such as remanufacturing, reusing, and recycling. Therefore, manufacturers too have inevitably taken notice of the potentiality and profitability of the green market. However, manufacturers and retailers alike face the challenge of pricing these green products adequately. Green products are generally perceived as slightly inferior to new products, whether in terms of functionality or performance. Wanting to do their part for the environment is the main reason for consumers purchasing green products, and these consumers are only a minority in the marketplace. Due to the lack of economies of scale, the cost of producing these green products may not be lower than that of new products. Thus, government subsidy plays an important part in the production and pricing of green products. This study explores the role of government subsidy policy in promoting sustainable environmental concepts among consumers in a duopoly market. The two manufacturers, with different production costs and market shares, will react differently to different government subsidy policies. Thus, under these circumstances, in addition to maximizing social welfare, government should also consider factors that will influence consumers’ willingness to purchase and promote manufacturers’ involvement in green supply chains.
Based on market evaluations of manufacturers in a duopoly environment, this study explored how different parameter settings would affect the overall supply chain pricing in the Cournot model. When the ratio of market evaluation for both manufacturers α is 0.5, overall product demand approaches a fixed value; when α is greater than 0.8, overall product demand looks to rise slightly. This is due to the increasing demand for new products, as the market evaluation for both manufacturers converges when α is greater than 0.7. When α is greater than 0.8, the demand for new products will increase tremendously, which would consequently affect the overall product demand. By maintaining α = 0.7, both manufacturers will produce new and remanufactured products. At this point, social welfare will reach a certain level. Division of production in the Cournot model occurs as a result of market competition, and does not have any significant influence on the overall product demand. Under the research framework of this study, consumer surplus of remanufactured products is found to have a greater influence on social welfare. When division of production happens in the Cournot model, consumer surplus of remanufactured products will reach a higher value, thus lifting social welfare. In view of the above findings, this study has summarized the following factors that governments may take into consideration while promoting environmentally friendly concepts. Before implementing any subsidy policy to encourage the production and consumption of remanufactured products, it is imperative that governments consider the types of competition between manufacturers and consumers’ willingness to purchase. To promote green supply chains, this study advises governments to first implement the necessary market control to avoid giving too much market power to the manufacturers or encouraging collusion between manufacturers that would inevitably affect overall social welfare.
This study only considered two manufacturers as both producers and recyclers within the green supply chain. In future, a third-party recycler can be incorporated in the model to investigate the relationships between these stakeholders. Other than subsidy policies, governments can also promote the concept and implementation of green supply chains through the enactment of regulation and legislation. This study assumed government subsidy as the only economic incentive and did not factor taxation into the models. For future research, both subsidy and taxation should be included. The government is assumed to dispense subsidies to both manufacturers and consumers. Subsidies to manufacturers are meant to encourage the production of remanufactured products and the recollection of used products. This recollection rate was deemed as one of the factors influencing government subsidy. With regard to the recollection cost of used products, this study did not consider the possibility that different industries may have different cost factors. Future researchers may explore whether different cost considerations in other industries will affect the market competition of its respective green supply chains. The values of demand functions used in this study were set based only on market evaluations, and did not consider external influences that may have affected the manufacturers. In future, researchers may include other factors that may influence consumers’ willingness to buy remanufactured products.

Author Contributions

Conceptualization, R.-C.T.; investigation, R.-C.T.; methodology, R.-C.T. All authors have read and agreed to the published version of the manuscript.

Funding

The authors gratefully acknowledge financial support from the Ministry of Science and Technology with project number MOST 103-2221-E-032-018-.

Acknowledgments

The authors gratefully acknowledge the reviewers’ valuable suggestions.

Conflicts of Interest

The authors declare no conflicts of interest.

References

  1. United Nations. What is GEI? United Nations Environment Programme (UNEP). Available online: https://www.greeneconomycoalition.org/members/un-environment-programme-gei (accessed on 14 January 2020).
  2. Bernard, S. Remanufacturing. J. Environ. Manag. 2011, 62, 337–351. [Google Scholar] [CrossRef] [Green Version]
  3. Alizadeh-Basban, N.; Taleizadeh, A.A. A hybrid circular economy—Game theoretical approach in a dual-channel green supply chain considering sale’s effort, delivery time, and hybrid remanufacturing. J. Clean. Prod. 2019. [Google Scholar] [CrossRef]
  4. Stock, J.R. Reverse Logistics in the Supply Chain. Available online: https://www.lomag-man.org/reverselogistique/ReverseLogisticsintheSupplyChain7_J-stock.pdf (accessed on 14 January 2020).
  5. Wang, J.N. Circular Economy is A Strategy Choice for Environmental Protection in the 21st Century. Res. Environ. Sci. 2002, 15, 34–37. [Google Scholar]
  6. Wisner, J.D.; Leong, G.K.; Tan, K.C. Principles of Supply Chain Management: A Balanced Approach; Thomson South-Western: Mason, OH, USA, 2005. [Google Scholar]
  7. Kainuma, Y.; Tawara, N. A Multiple Attribute Utility Theory Approach to Lean and Green Supply Chain Management. Int. J. Prod. Econ. 2006, 101, 99–108. [Google Scholar] [CrossRef]
  8. Hazen, B.T.; Hall, D.J.; Hanna, J.B. Reverse Logistics Disposition Decision-making: Developing a Decision Framework via Content Analysis. Int. J. Phys. Distr. Log. 2012, 42, 244–274. [Google Scholar] [CrossRef]
  9. Zhao, M.; Canova, M.; Tian, H.; Shu, G. Design space exploration for waste heat recovery system in automotive application under driving cycle. Energy 2019, 176, 980–990. [Google Scholar] [CrossRef]
  10. Govindan, K.; Palaniappan, M.; Zhu, Q.; Kannan, D. Analysis of Third Party Reverse Logistics Provider Using Interpretive Structural Modeling. Int. J. Prod. Econ. 2012, 140, 204–211. [Google Scholar] [CrossRef]
  11. Savaskan, R.C.; van Wassenhove, L.N. Reverse Channel Design: The Case of Competing Retailers. Manag. Sci. 2006, 52, 1–14. [Google Scholar] [CrossRef] [Green Version]
  12. Jacobs, B.W.; Subramanian, R. Sharing Responsibility for Product Recovery Across the Supply Chain. Prod. Oper. Manag. 2011, 21, 85–100. [Google Scholar] [CrossRef]
  13. Mayers, K.; Lifset, R.; Bodenhoefer, K.; Van Wassenhove, L.N. Implementing Individual Producer Responsibility for Waste Electrical and Electronic Equipment Through Improved Financing. J. Ind. Ecol. 2013, 17, 186–198. [Google Scholar] [CrossRef]
  14. Atasu, A.; Savary, M.; van Wassenhove, L.N. Remanufacturing as a Marketing Strategy. Manag. Sci. 2008, 54, 1731–1747. [Google Scholar] [CrossRef] [Green Version]
  15. Amin, S.H.; Zhang, G. An Integrated Model for Closed-loop Supply Chain Configuration and Supplier Selection: Multi-objective Approach. Expert. Syst. Appl. 2012, 39, 6782–6791. [Google Scholar] [CrossRef]
  16. Dey, P.K.; Cheffi, W. Green Supply Chain Performance Measurement using the Analytic Hierarchy Process: A Comparative Analysis of Manufacturing Organisations. Prod. Plan. Control. 2013, 24, 702–720. [Google Scholar] [CrossRef] [Green Version]
  17. Zhang, C.T.; Wang, H.X.; Ren, M.L. Research on pricing and coordination strategy of green supply chain under hybrid production mode. Comput. Ind. Eng. 2014, 72, 24–31. [Google Scholar] [CrossRef]
  18. Giri, B.C.; Sharma, S. Optimal Production Policy for a Closed-loop Hybrid System with Uncertain Demand and Return under Supply Disruption. J. Clean. Prod. 2016, 112, 2015–2028. [Google Scholar] [CrossRef]
  19. Sheu, J.B.; Chou, Y.H.; Hu, C.C. An Integrated Logistics Operational Model for Green-supply Chain Management. Transp. Res. Part E Logist. Transp. Rev. 2005, 41, 287–313. [Google Scholar] [CrossRef]
  20. Matsukawa, I. The Welfare Effects of Environmental Taxation on a Green Market Where Consumers Emit a Pollutant. Environ. Resour. Econ. 2012, 52, 87–107. [Google Scholar] [CrossRef]
  21. Mitra, S.; Webster, S. Competition in Remanufacturing and the Effects of Government Subsidies. Int. J. Prod. Econ. 2008, 111, 287–298. [Google Scholar] [CrossRef]
  22. Zhao, R.; Neighbour, G.; Han, J.J.; McGuire, M.; Deutz, P. Using Game Theory to Describe Strategy Selection for Environmental Risk and Carbon Emissions Reduction in the Green Supply Chain. J. Loss Prev. Process Ind. 2012, 25, 927–936. [Google Scholar] [CrossRef]
  23. Daugbjerg, C.; Sønderskov, K.M. Environmental Policy Performance Revisited: Designing Effective Policies for Green Markets. Polit. Stud. 2012, 60, 399–418. [Google Scholar] [CrossRef] [Green Version]
  24. Xue, D.; Teunter, R.H.; Zhu, S.X.; Zhou, W. Entering the High-End Market by Collecting and Remanufacturing a Competitor’s High-End Cores. Omega 2019. [Google Scholar] [CrossRef]
  25. Kopel, M.; Loffler, C. Commitment, First-Mover-, and Second-Mover Advantage. J. Econ. 2008, 94, 143–166. [Google Scholar] [CrossRef]
  26. Zhu, W.; Xu, X.E. Second-Mover Advantages with Asymmetric Costs and Information Updates: A Product Life Cycle Perspective. Manag. Decis. Econ. 2011, 32, 527–533. [Google Scholar] [CrossRef]
  27. Toyasaki, F.; Boyaci, T.; Verter, V. An Analysis of Monopolistic and Competitive Take-Back Schemes for WEEE Recycling. Prod. Oper. Manag. 2011, 20, 805–823. [Google Scholar] [CrossRef]
  28. Sheu, J.B. Bargaining Framework for Competitive Green Supply Chains under Governmental Financial Intervention. Transp. Res. Part E Logist. Transp. Rev. 2011, 47, 573–592. [Google Scholar] [CrossRef]
  29. Sheu, J.B.; Chen, Y.J. Impact of Government Financial Intervention on Competition Among Green Chains. Int. J. Prod. Econ. 2012, 138, 201–213. [Google Scholar] [CrossRef]
  30. Liu, Z.L.; Anderson, T.D.; Cruz, J.M. Consumer Environmental Awareness and Competition in Two-Stage Supply Chains. Eur. J. Oper. Res. 2012, 218, 602–613. [Google Scholar] [CrossRef]
  31. Chiang, W.K.; Chhajed, D.; Hess, J.D. Direct Marketing, Indirect Profits: A Strategic Analysis of Dual-Channel Supply-Chain Design. Manag. Sci. 2003, 49, 1–20. [Google Scholar] [CrossRef] [Green Version]
  32. Ferrer, G.; Swaminathan, J.M. Managing New and Remanufactured Products. Manag. Sci. 2006, 52, 15–26. [Google Scholar] [CrossRef] [Green Version]
  33. Heese, H.S.; Cattani, K.; Ferrer, G.; Gilland, W.; Roth, A.V. Competitive Advantage through Take-Back of Used Products. Eur. J. Oper. Res. 2005, 164, 143–157. [Google Scholar] [CrossRef]
  34. Liu, Z.; Diallo, C.; Chen, J.; Zhang, M. Optimal Pricing and Production Strategies for New and Remanufactured Products under a Non-Renewing Free Replacement Warranty. Int. J. Prod. Econ. 2019. [Google Scholar] [CrossRef]
Figure 1. The overall profit of the green supply chain.
Sustainability 12 00636 g001
Figure 2. Proportion of green market and market evaluation ratios of both manufacturers.
Sustainability 12 00636 g002
Figure 3. Cournot model and corresponding social welfare.
Sustainability 12 00636 g003
Figure 4. Cournot model with respect to consumer surplus of remanufactured products.
Sustainability 12 00636 g004

