Management Practices and Breeding History of Varieties Strongly Determine the Fine Genetic Structure of Crop Populations: A Case Study Based on European Wheat Populations


Abstract
1. Introduction
2. Materials and Methods
2.1. Context of the Study
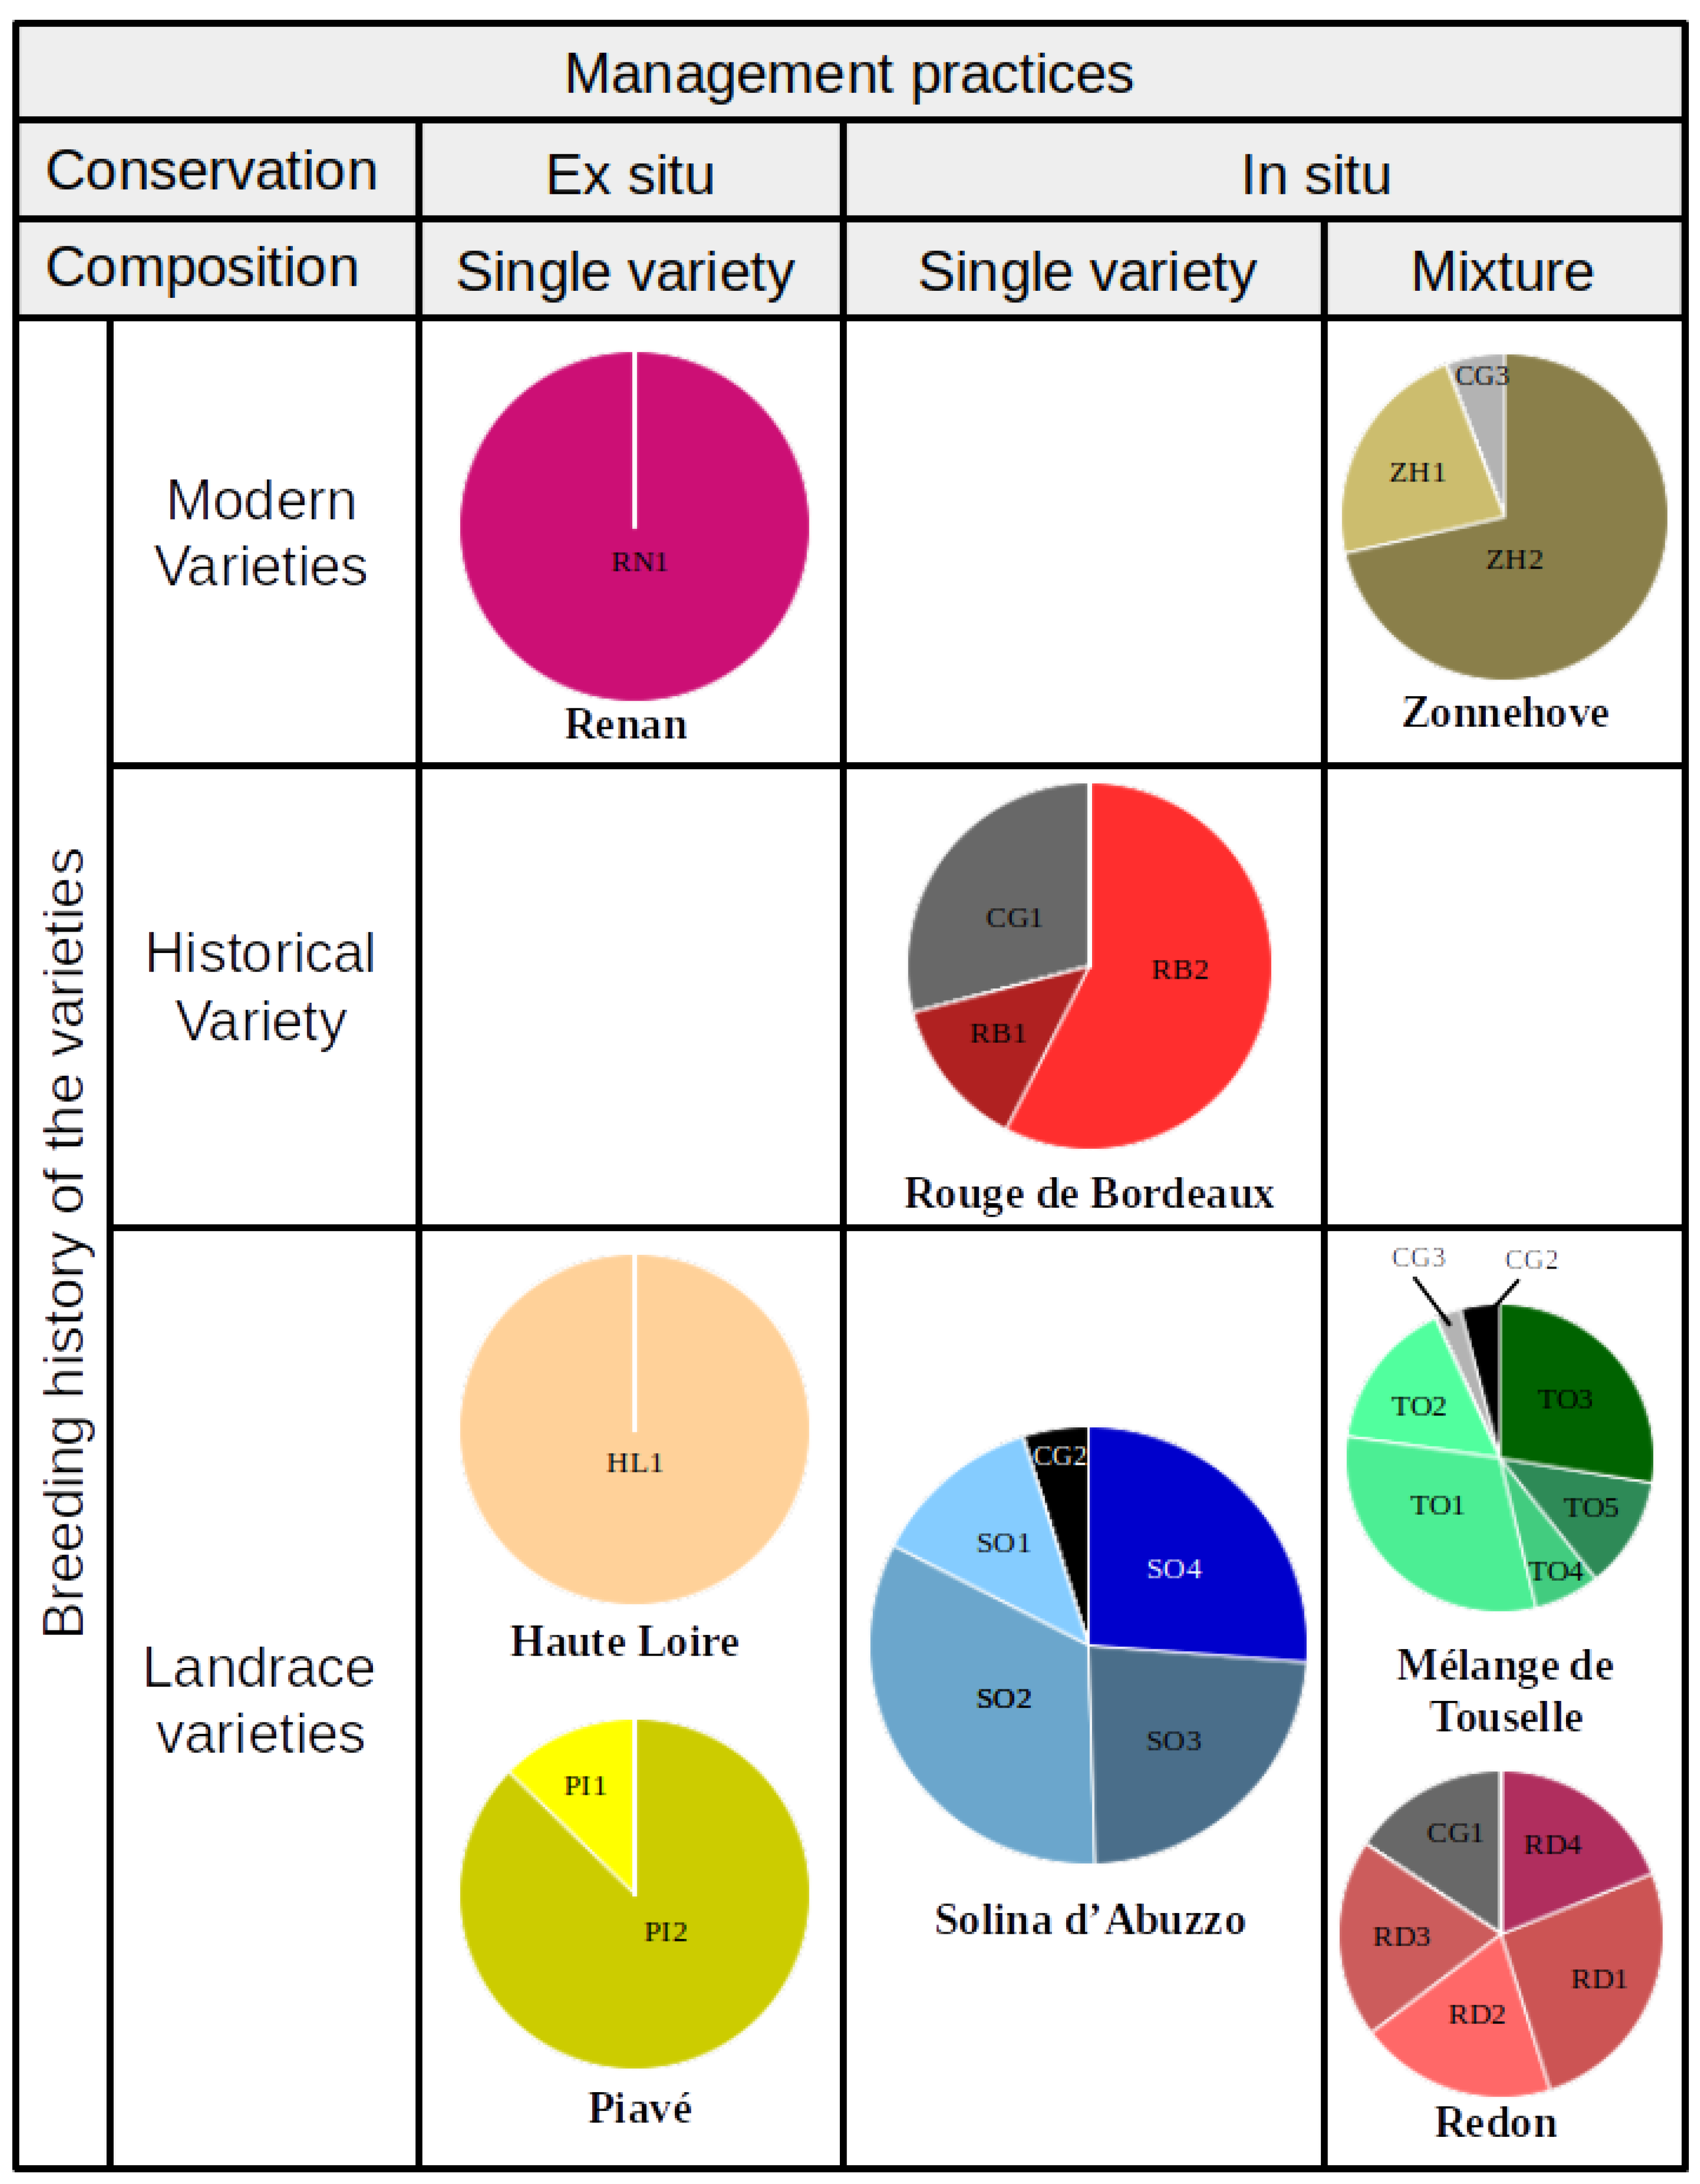
Sample Description: Management Practices and Breeding History of Varieties
2.2. Experimental Design
2.3. Molecular Analysis
2.4. Data Analysis
2.4.1. Within-Variety Allelic Diversity
2.4.2. Haplotype Inference
2.4.3. Structure Analysis
2.5. Off-Type Identification and Data Purification
3. Results
3.1. Multi-Level Genetic Diversity and Population Structure of Samples
3.1.1. Single Variety Conserved Ex Situ and Modern Variety
3.1.2. Single Variety Conserved In Situ (HV and LR)
3.1.3. Mixtures In Situ Conserved (MIXMV and MIXLR)
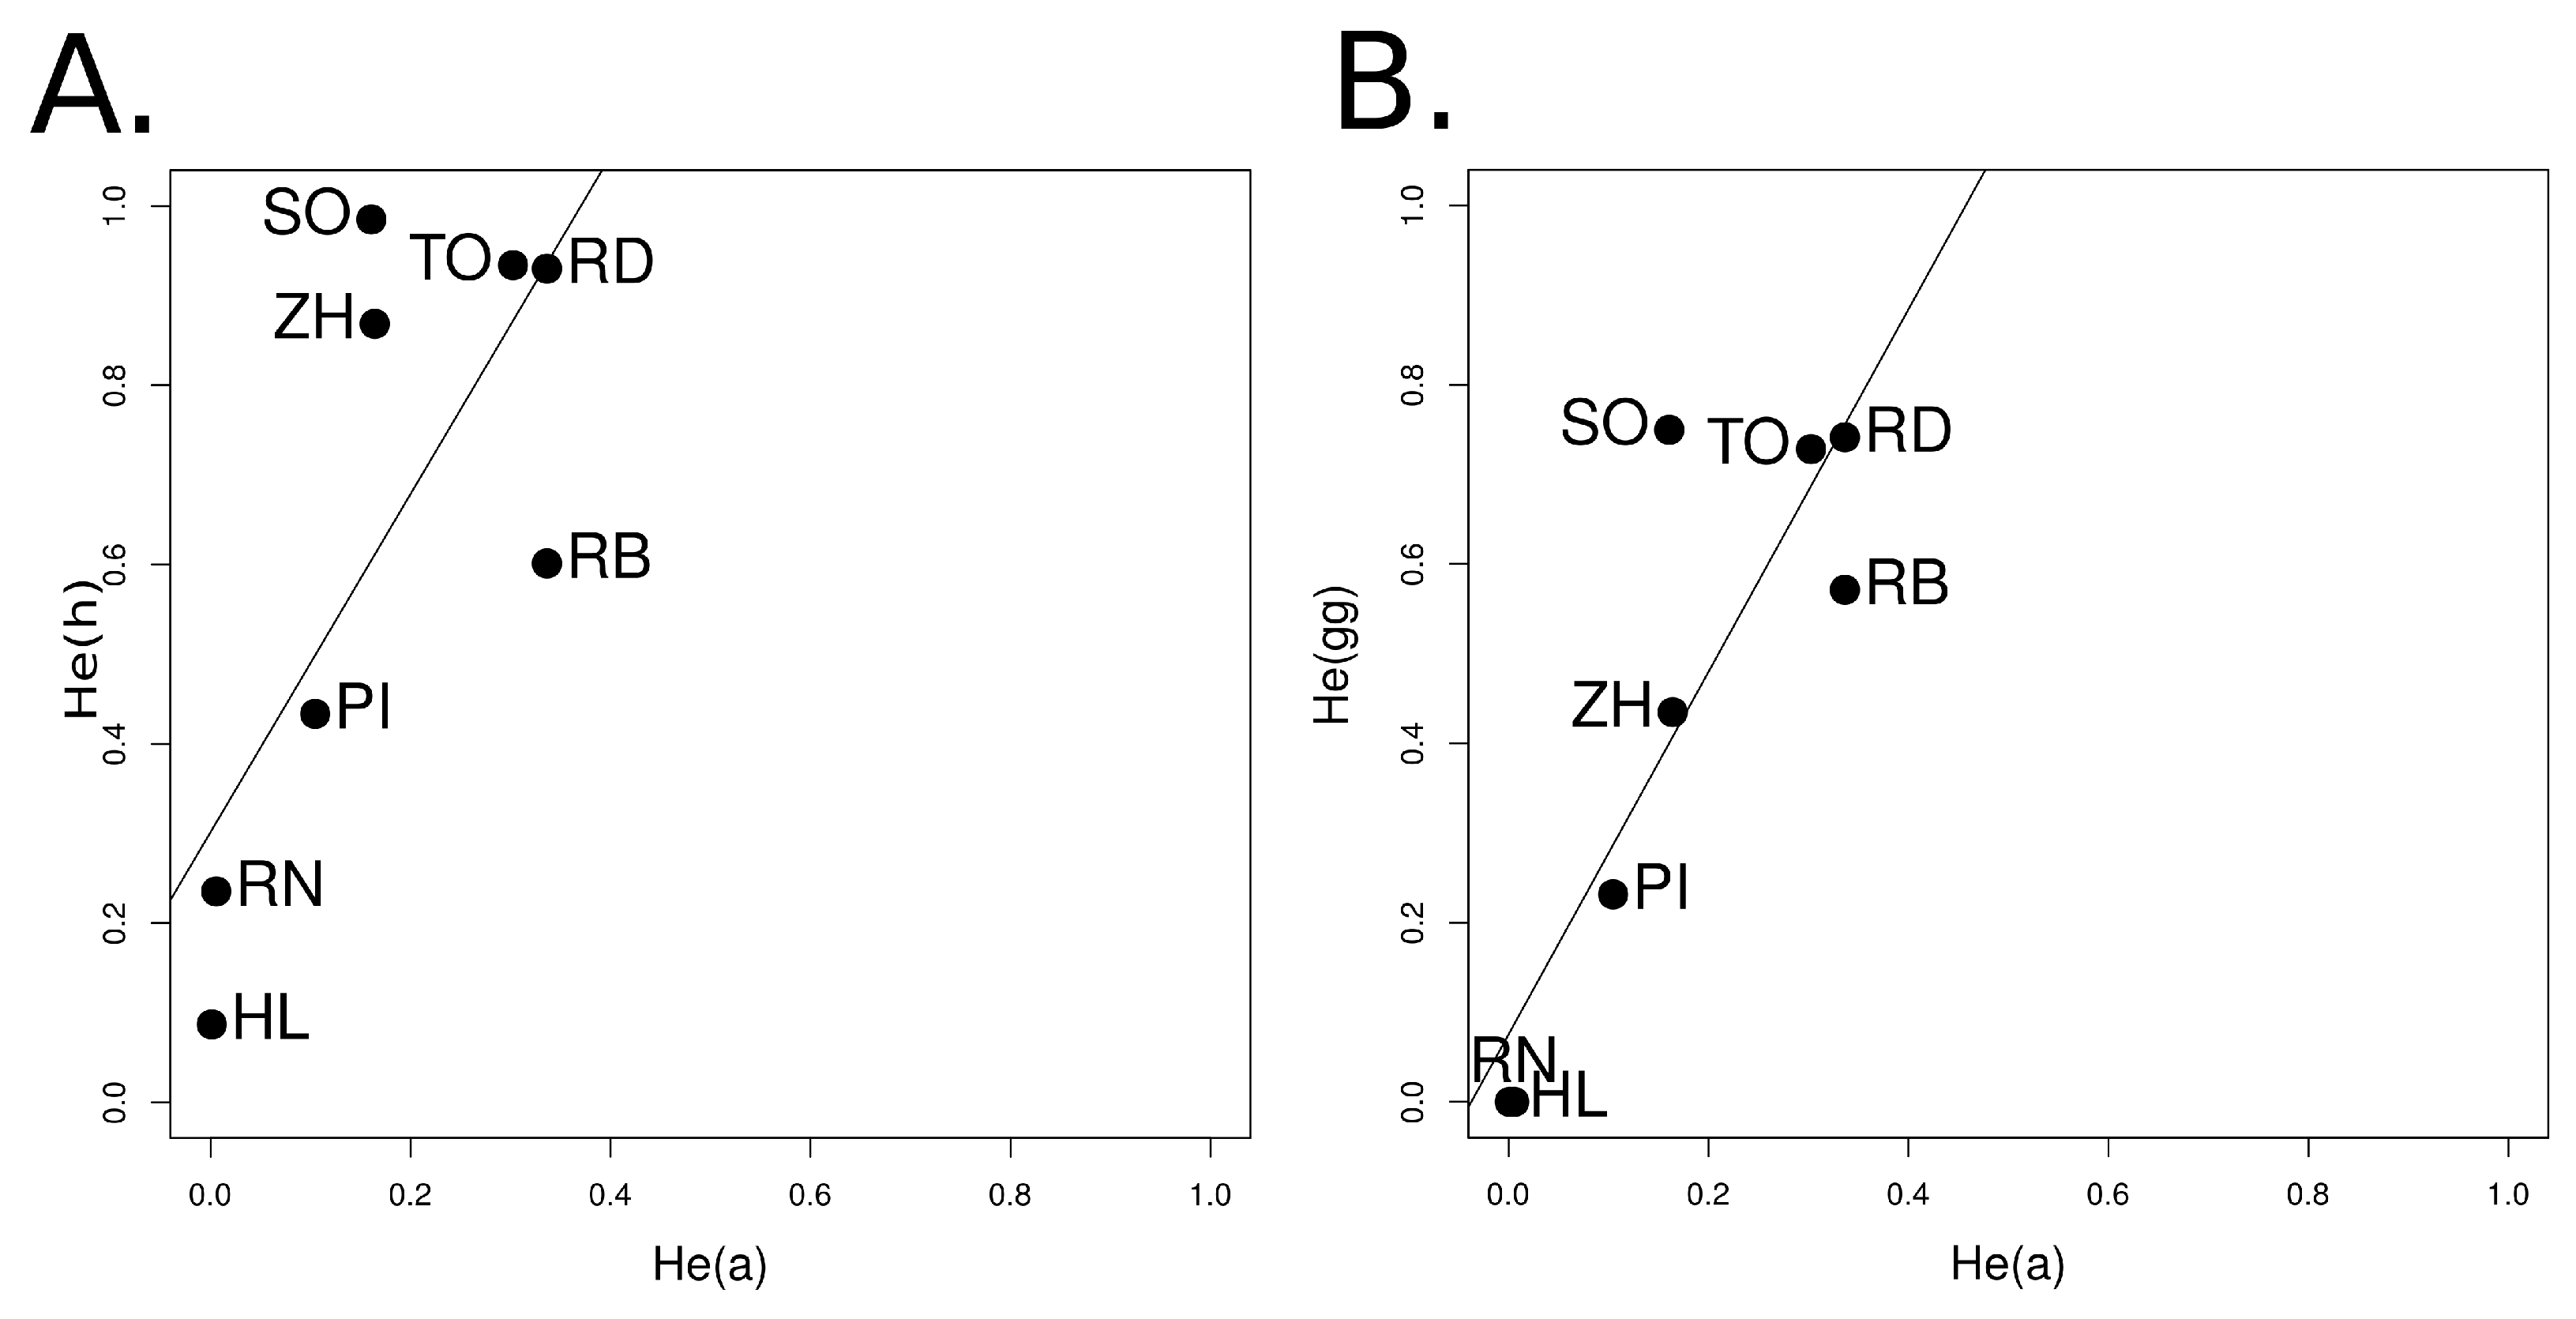
3.1.4. Relationship among Genetic Indices
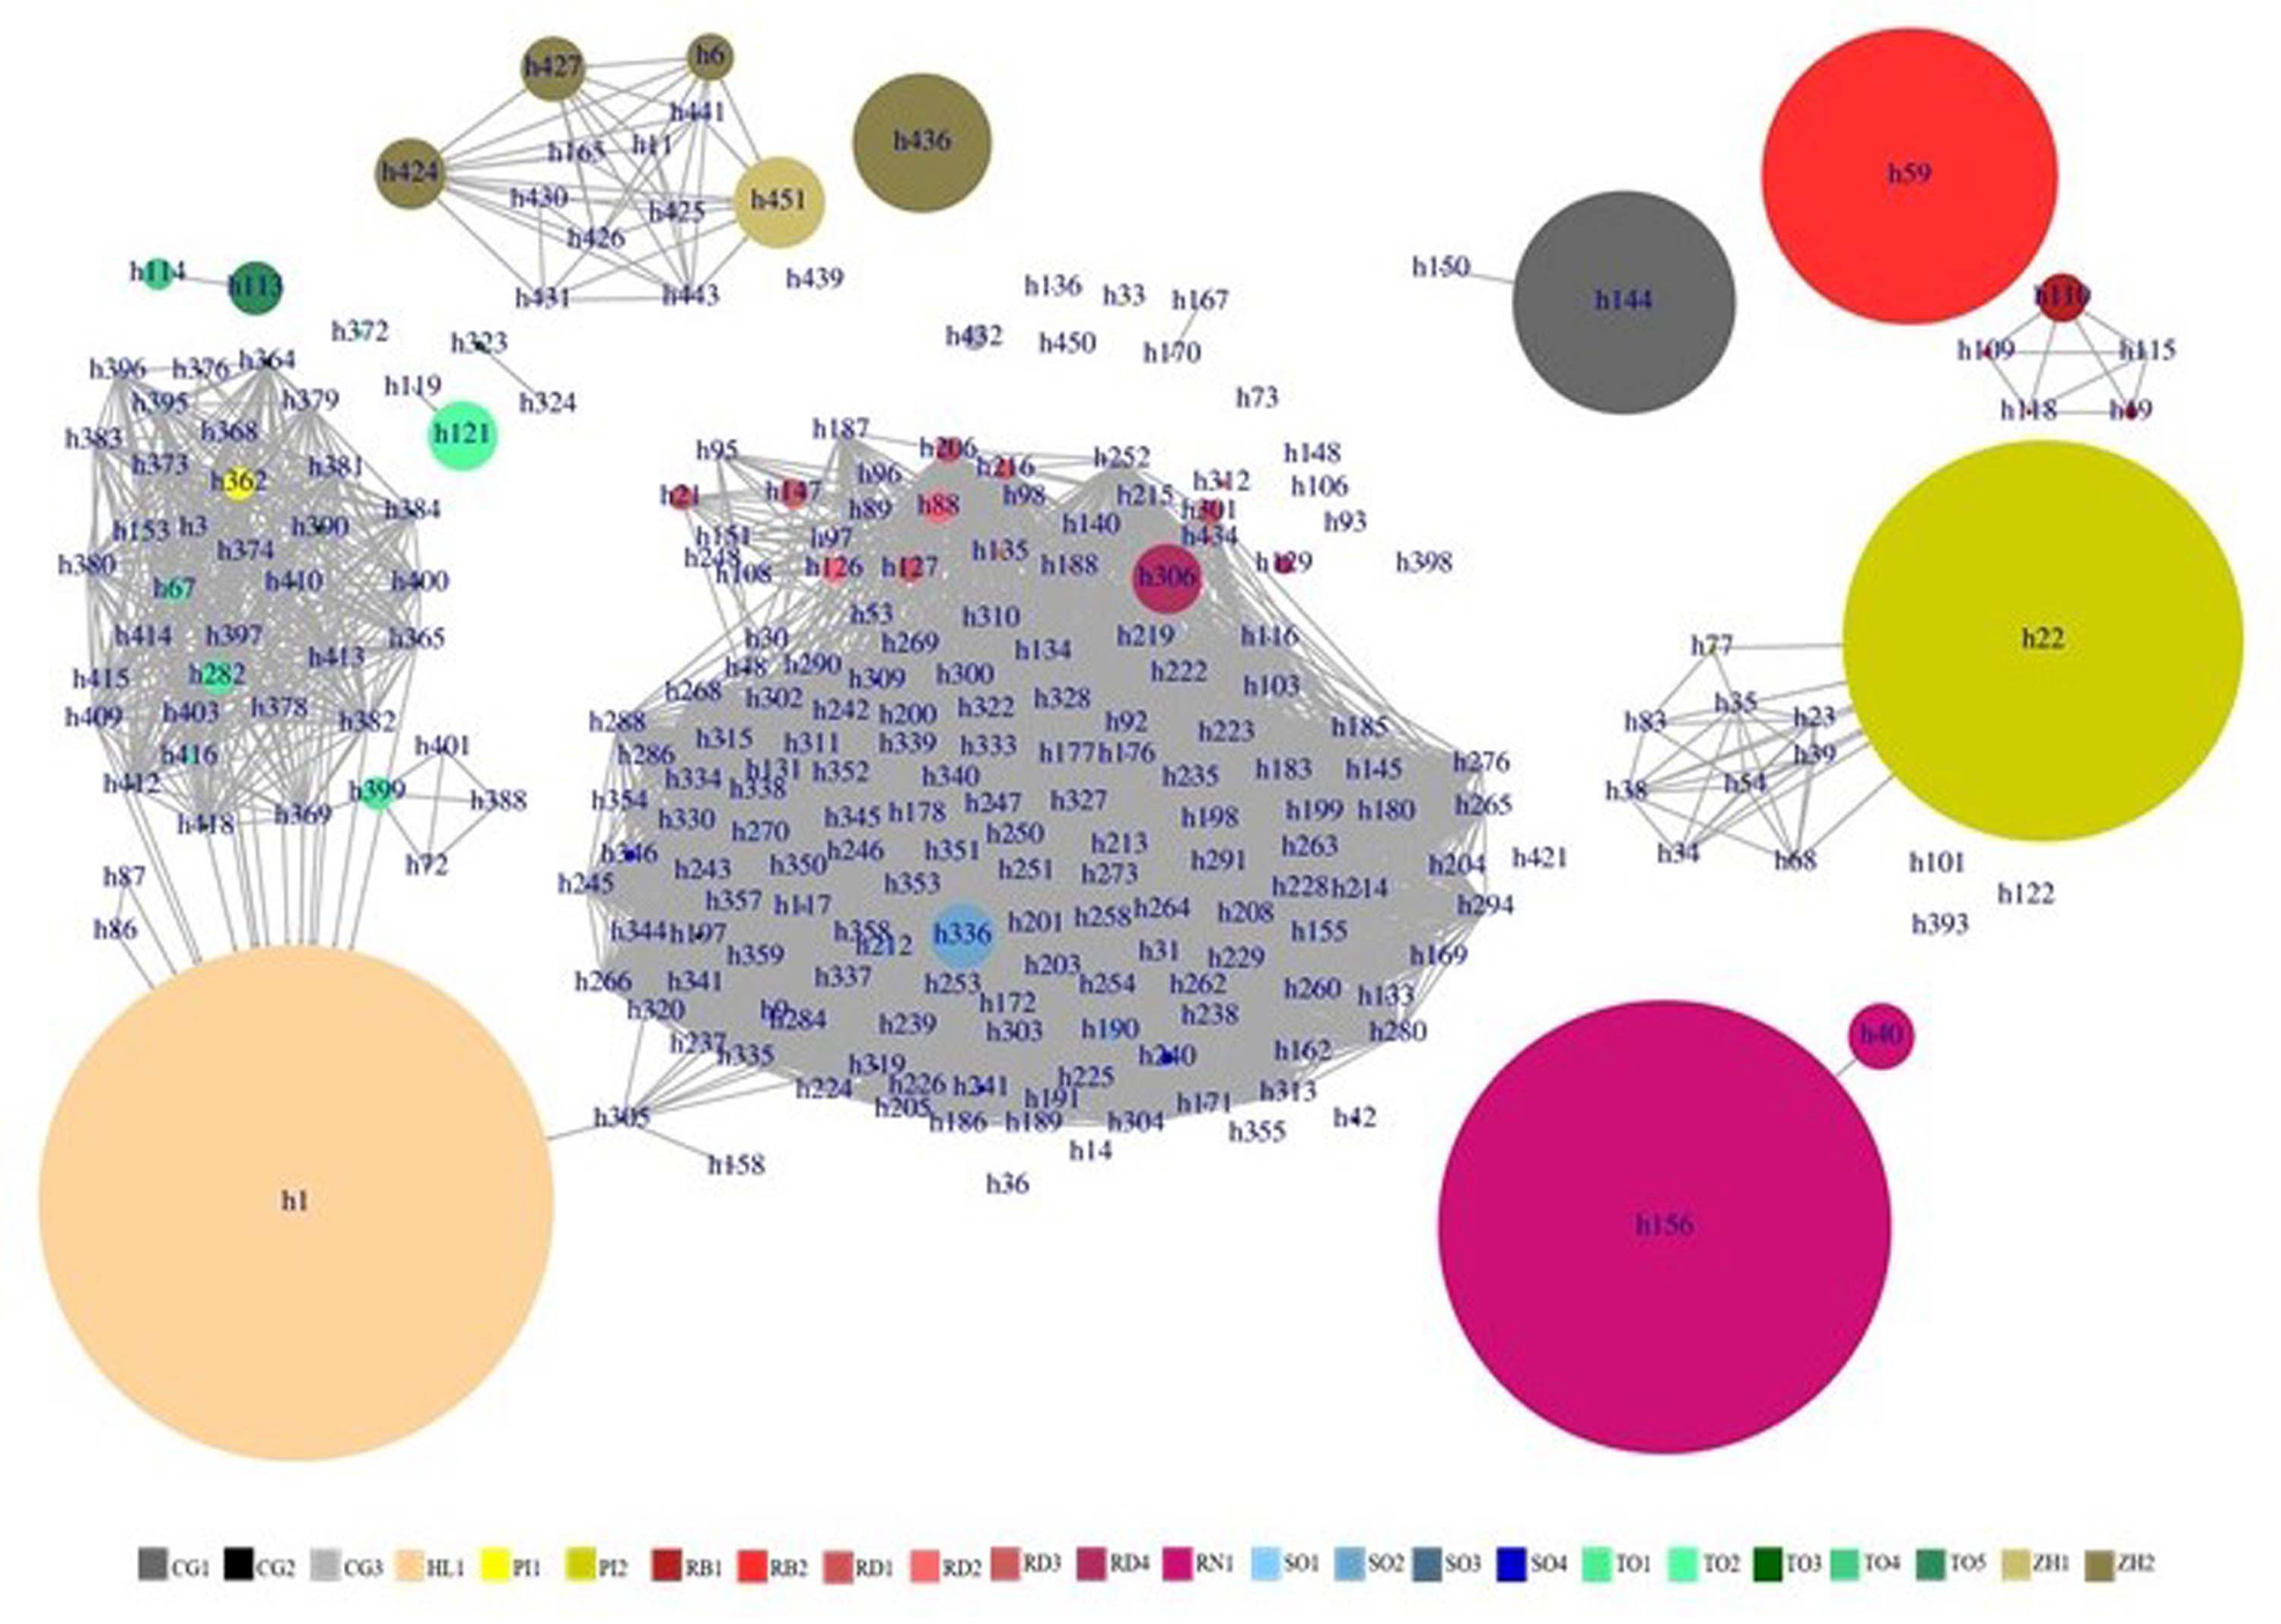
3.2. Deciphering the Varietal Relatedness
4. Discussion
4.1. Diversifying Practices Interacting with the History of Varieties
4.2. Genetic Relatedness between Different European Farmer’s Varieties
5. Conclusions
Supplementary Materials
Author Contributions
Funding
Acknowledgments
Conflicts of Interest
References
- Louette, D.; Charrier, A.; Berthaud, J. In situ conservation of maize in Mexico: Genetic diversity and maize seed management in a traditional community. Econ. Bot. 1997, 51, 20–38. [Google Scholar] [CrossRef]
- Elias, M.; Penet, L.; Vindry, P.; McKey, D.; Panaud, O.; Robert, T. Unmanaged sexual reproduction and the dynamics of genetic diversity of a vegetatively propagated crop plant, cassava (Manihot esculenta Crantz), in a traditional farming system. Mol. Ecol. 2001, 10, 1895–1907. [Google Scholar] [CrossRef] [PubMed]
- Jarvis, D.; Brown, A.H.D.; Cuong, P.H.; Collado-Panduro, L.; Latournerie-Moreno, L.; Gyawali, S.; Tanto, T.; Sawadogo, M.; Mar, I.; Sadiki, M.; et al. A global perspective of the richness and evenness of traditional crop-variety diversity maintained by farming communities. Proc. Natl. Acad. Sci. USA 2008, 105, 5326–5331. [Google Scholar] [CrossRef] [PubMed]
- Dawson, J.C.; Goldringer, I. Breeding for genetically diverse populations: Variety mixtures and evolutionary populations. In Organic Crop Breeding; van Bueren, E.T.L., Myers, J.R., Eds.; John Wiley & Sons: Chichester, UK, 2012; pp. 77–98. [Google Scholar]
- Bonneuil, C.; Thomas, F. Gènes, pouvoirs et profits : La Recherche Publique dans les Transformations des Régimes de Production des Savoirs en Génétique Végétale de Mendel aux OGM; QUAE/FPH: Paris, France, 2009. [Google Scholar]
- Bent, A.F. Crop diseases and strategies for their control. In Plants, Genes and Crop Biotechnology, Chrispeels, M.J., Sadava, D.E., Eds.; Jones and Bartlett Publishers: Sudbury, MA, USA, 2003; pp. 390–414. [Google Scholar]
- Harlan, J.R. Genetics of Disaster 1. J. Environ. Qual. 1972, 1, 212–215. [Google Scholar] [CrossRef]
- Trenbath, B.R. Interactions Among Diverse Hosts and Diverse Parasites. Ann. New York Acad. Sci. 1977, 287, 124–150. [Google Scholar] [CrossRef]
- Juska, A.; Busch, L.; Tanaka, K. The Blackleg Epidemic in Canadian Rapeseed as a “Normal Agricultural Accident”. Ecol. Appl. 1997, 7, 1350–1356. [Google Scholar] [CrossRef]
- Sánchez-Martín, J.; Rispail, N.; Flores, F.; Emeran, A.A.; Sillero, J.C.; Rubiales, D.; Prats, E. Higher rust resistance and similar yield of oat landraces versus cultivars under high temperature and drought. Agron. Sustain. Dev. 2016, 37, 3. [Google Scholar] [CrossRef]
- Zhu, Y.; Chen, H.; Fan, J.; Wang, Y.; Li, Y.; Chen, J.; Fan, J.; Yang, S.; Hu, L.; Leung, H.; et al. Genetic diversity and disease control in rice. Nature 2000, 406, 718–722. [Google Scholar] [CrossRef]
- de Vallavieille-Pope, C. Management of disease resistance diversity of cultivars of a species in single fields: Controlling epidemics. Comptes Rendus Biol. 2004, 327, 611–620. [Google Scholar] [CrossRef]
- Thomas, M.; Thépot, S.; Galic, N.; Jouanne-Pin, S.; Remoué, C.; Goldringer, I. Diversifying mechanisms in the on-farm evolution of crop mixtures. Mol. Ecol. 2015, 24, 2937–2954. [Google Scholar] [CrossRef]
- Olesen, J.E.; Trnka, M.; Kersebaum, K.C.; Skjelvåg, A.O.; Seguin, B.; Peltonen-Sainio, P.; Rossi, F.; Kozyra, J.; Micale, F. Impacts and adaptation of European crop production systems to climate change. Eur. J. Agron. 2011, 34, 96–112. [Google Scholar] [CrossRef]
- Frankel, O.; Bennett, E. Genetic Resources in Plants: Their Exploration and Conservation; Number 11 in International Biological Programme Handbook, Blackwell: Oxford, UK, 1970. [Google Scholar]
- Simmond, N.W. Variability in crop plants, its use and conservation. Biol. Rev. 1962, 37, 422–465. [Google Scholar] [CrossRef]
- Henry, J.P.; Pontis, C.; David, J.; Gouyon, P.H. An experiment on dynamic conservation of genetic resources with metapopulations. In Species Conservation: A Population-Biological Approach; Seitz, A., Loeschcke, V., Eds.; CAB International: Basel, Switzerland, 1991; pp. 185–198. [Google Scholar]
- Callow, J.A.; Ford Lloyd, B.V. Biotechnology and Plant Genetic Resources: Conservation And Use; Vol. Biotechnology in Agriculture Series: 19; CAB International: Wallingford, UK, 1997. [Google Scholar]
- Wolfe, M.; Baresel, J.; Desclaux, D.; Goldringer, I.; Hoad, S.; Kovacs, G.; Löschenberger, F.; Miedaner, T.; Østergård, H.; Lammerts van Bueren, E. Developments in breeding cereals for organic agriculture. Euphytica 2008, 163, 323–346. [Google Scholar] [CrossRef]
- Pistorius, R. Scientists, Plants and Politics: A History of the Plant Genetic Resources Movement; International Plant Genetic Resources Institute: Rome, Italy, 1997. [Google Scholar]
- Fowler, C.; Hawtin, G.C.; Hodgkin, T. Foreword. In Genes in the Field: On-farm Conservation of Crop Diversity; Brush, S., Ed.; International Plant Genetic Resources Institute; International Development Research Centre; Lewis Publishers: International Development Research Centre, Ottawa, Canada, 2000. [Google Scholar]
- Raggi, L.; Ciancaleoni, S.; Torricelli, R.; Terzi, V.; Ceccarelli, S.; Negri, V. Evolutionary breeding for sustainable agriculture: Selection and multi-environmental evaluation of barley populations and lines. Field Crop. Res. 2017, 204, 76–88. [Google Scholar] [CrossRef]
- Hodgkin, T.; Rana, J.; Tuxill, J.; Balma, D.; Mar, I.; Karamura, D.; Valdivia, R.; Collado, L.; Latournerie, L.; Sadiki, M.; et al. Seed systems and crop genetic diversity in agroecosystems. In Managing Biodiversity in Agricultural Ecosystems; Jarvis, D., Padoch, C., Cooper, H.D., Eds.; CABI Publishing: Rome, Italy, 2007; pp. 77–116. [Google Scholar]
- Mercer, K.L.; Perales, H.R. Evolutionary response of landraces to climate change in centers of crop diversity. Evol. Appl. 2010, 3, 480–493. [Google Scholar] [CrossRef] [PubMed]
- Barrett, R.D.; Schluter, D. Adaptation from standing genetic variation. Trends Ecol. Evol. 2008, 23, 38–44. [Google Scholar] [CrossRef] [PubMed]
- van de Wouw, M.; van Hintum, T.; Kik, C.; van Treuren, R.; Visser, B. Genetic diversity trends in twentieth century crop cultivars: A meta analysis. Theor. Appl. Genet. 2010, 120, 1241–1252. [Google Scholar] [CrossRef]
- Roussel, V.; Leisova, L.; Exbrayat, F.; Stehno, Z.; Balfourier, F. SSR allelic diversity changes in 480 European bread wheat varieties released from 1840 to 2000. Theor. Appl. Genet. 2005, 111, 162–170. [Google Scholar] [CrossRef]
- Jones, H.; Civáň, P.; Cockram, J.; Leigh, F.J.; Smith, L.M.; Jones, M.K.; Charles, M.P.; Molina-Cano, J.L.; Powell, W.; Jones, G.; et al. Evolutionary history of barley cultivation in Europe revealed by genetic analysis of extant landraces. BMC Evol. Biol. 2011, 11, 320. [Google Scholar] [CrossRef]
- Sun, J.C.; Cao, G.L.; Ma, J.; Chen, Y.F.; Han, L.Z. Comparative genetic structure within single-origin pairs of rice (Oryza sativa L.) landraces from in situ and ex situ conservation programs in Yunnan of China using microsatellite markers. Genet. Resour. Crop. Evol. 2012, 59, 1611–1623. [Google Scholar] [CrossRef]
- Cui, D.; Li, J.; Tang, C.; Xinxiang, A.; Yu, T.; Ma, X.; Zhang, E.; Cao, G.; Xu, F.; Qiao, Y.; et al. Diachronic analysis of genetic diversity in rice landraces under on-farm conservation in Yunnan, China. Theor. Appl. Genet. 2016, 129, 155–168. [Google Scholar] [CrossRef] [PubMed]
- Gómez, O.J.; Blair, M.W.; Frankow-Lindberg, B.E.; Gullberg, U. Comparative study of common Bean (Phaseolus vulgaris L.) landraces conserved ex situ in Genebanks and in situ by farmers. Genet. Resour. Crop. Evol. 2005, 52, 371–380. [Google Scholar] [CrossRef]
- Parzies, H.K.; Spoor, W.; Ennos, R.A. Genetic diversity of barley landrace accessions (Hordeum vulgare ssp. vulgare) conserved for different lengths of time in ex situ gene banks. Heredity 2000, 84, 476–486. [Google Scholar] [CrossRef] [PubMed]
- Li, Q.; Xu, Z.; He, T. Ex situ genetic conservation of endangered Vatica guangxiensis (Dipterocarpaceae) in China. Biol. Conserv. 2002, 106, 151–156. [Google Scholar] [CrossRef]
- Li, Q.; He, T.; Xu, Z. Genetic evaluation of the efficacy of in situ and ex situ conservation of Parashorea chinensis (Dipterocarpaceae) in Southwestern China. Biochem. Genet. 2005, 43, 387–406. [Google Scholar] [CrossRef] [PubMed]
- Negri, V.; Tiranti, B. Effectiveness of in situ and ex situ conservation of crop diversity. What a Phaseolus vulgaris L. landrace case study can tell us. Genetica 2010, 138, 985–998. [Google Scholar] [CrossRef] [PubMed]
- Wang, Y.; Wang, Y.; Sun, X.; Caiji, Z.; Yang, J.; Cui, D.; Cao, G.; Ma, X.; Han, B.; Xue, D.; et al. Influence of ethnic traditional cultures on genetic diversity of rice landraces under on-farm conservation in southwest China. J. Ethnobiol. Ethnomed. 2016, 12, 51. [Google Scholar] [CrossRef]
- Tin, H.; Berg, T.; Bjørnstad, A. Diversity and adaptation in rice varieties under static (ex situ) and dynamic (in situ) management. Euphytica 2001, 122, 491–502. [Google Scholar] [CrossRef]
- Deu, M.; Sagnard, F.; Chantereau, J.; Calatayud, C.; Vigouroux, Y.; Pham, J.L.; Mariac, C.; Kapran, I.; Mamadou, A.; Gérard, B.; et al. Spatio-temporal dynamics of genetic diversity in Sorghum bicolor in Niger. Theor. Appl. Genet. 2010, 120, 1301–1313. [Google Scholar] [CrossRef]
- Torricelli, R.; Tiranti, B.; Spataro, G.; Castellini, G.; Albertini, E.; Falcinelli, M.; Negri, V. Differentiation and structure of an Italian landrace of celery (Apium graveolens L.): Inferences for on farm conservation. Genet. Resour. Crop. Evol. 2013, 60, 995–1006. [Google Scholar] [CrossRef]
- Dawson, J.C.; Serpolay, E.; Giuliano, S.; Schermann, N.; Galic, N.; Berthellot, J.F.; Chesneau, V.; Ferté, H.; Mercier, F.; Osman, A.; et al. Phenotypic diversity and evolution of farmer varieties of bread wheat on organic farms in Europe. Genet. Resour. Crop. Evol. 2013, 60, 145–163. [Google Scholar] [CrossRef]
- Serpolay, E.; Dawson, J.C.; Chable, V.; Bueren, E.L.V.; Osman, A.; Pino, S.; Silveri, D.; Goldringer, I. Diversity of different farmer and modern wheat varieties cultivated in contrasting organic farming conditions in western Europe and implications for European seed and variety legislation. Org. Agric. 2011, 1, 127–145. [Google Scholar] [CrossRef]
- Akhunov, E.D.; Akhunova, A.R.; Anderson, O.D.; Anderson, J.A.; Blake, N.; Clegg, M.T.; Coleman-Derr, D.; Conley, E.J.; Crossman, C.C.; Deal, K.R.; et al. Nucleotide diversity maps reveal variation in diversity among wheat genomes and chromosomes. BMC Genom. 2010, 11, 702. [Google Scholar] [CrossRef] [PubMed]
- Chao, S.; Dubcovsky, J.; Dvorak, J.; Luo, M.C.; Baenziger, S.P.; Matnyazov, R.; Clark, D.R.; Talbert, L.E.; Anderson, J.A.; Dreisigacker, S.; et al. Population- and genome-specific patterns of linkage disequilibrium and SNP variation in spring and winter wheat (Triticum aestivum L.). BMC Genom. 2010, 11, 727. [Google Scholar] [CrossRef]
- Belkhir, K.; Borsa, P.; Chikhi, L.; Raufaste, N.; Bonhomme, F. GENETIX 4.05, logiciel sous Windows TM pour la génétique des populations; ScienceOpen, Inc.: Burlington, MA, USA, 2004. [Google Scholar]
- Excoffier, L.; Lischer, H.E.L. Arlequin suite ver 3.5: A new series of programs to perform population genetics analyses under Linux and Windows. Mol. Ecol. Resour. 2010, 10, 564–567. [Google Scholar] [CrossRef]
- Oksanen, J.; Blanchet, F.G.; Friendly, M.; Kindt, R.; Legendre, P.; McGlinn, D.; Minchin, P.R.; O’Hara, R.B.; Simpson, G.L.; Solymos, P.; et al. Vegan: Community Ecology Package, R package version 2.5-5; 2019. [Google Scholar]
- R Core Team. R: A Language and Environment for Statistical Computing; R Foundation for Statistical Computing: Vienna, Austria, 2018. [Google Scholar]
- Stephens, M.; Smith, N.J.; Donnelly, P. A new statistical method for haplotype reconstruction from population data. Am. J. Hum. Genet. 2001, 68, 978–989. [Google Scholar] [CrossRef]
- Garrick, R.; Sunnucks, P.; Dyer, R.J. Nuclear gene phylogeography using PHASE: Dealing with unresolved genotypes, lost alleles, and systematic bias in parameter estimation. BMC Evol. Biol. 2010, 10, 118. [Google Scholar] [CrossRef]
- Jombart, T.; Devillard, S.; Balloux, F. Discriminant analysis of principal components: A new method for the analysis of genetically structured populations. BMC Genet. 2010, 11, 94. [Google Scholar] [CrossRef]
- Paradis, E.; Schliep, K. ape 5.0: An environment for modern phylogenetics and evolutionary analyses in R. Bioinformatics 2018, 35, 526–528. [Google Scholar] [CrossRef]
- Goudet, J.; Jombart, T. Hierfstat: Estimation and Tests of Hierarchical F-Statistics, R package version 0.04-22; 2015. [Google Scholar]
- van Hintum, T.; van de Wiel, C.; Visser, D.; van Treuren, R.; Vosman, B. The distribution of genetic diversity in a Brassica oleracea gene bank collection related to the effects on diversity of regeneration, as measured with AFLPs. TAG Theor. Appl. Genet. 2007, 114, 777–786. [Google Scholar] [CrossRef]
- Enjalbert, J.; Goldringer, I.; David, J.L.; Brabant, P. The relevance of outcrossing for the dynamic management of genetic resources in predominantly selfing Triticum aestivum L. (bread wheat). Genet. Sel. Evol. 1998, 30, S197. [Google Scholar] [CrossRef]
- Siol, M.; Prosperi, J.; Bonnin, I.; Ronfort, J. How multilocus genotypic pattern helps to understand the history of selfing populations: A case study in Medicago truncatula. Heredity 2008, 100, 517–525. [Google Scholar] [CrossRef] [PubMed]
- Jullien, M.; Navascués, M.; Ronfort, J.; Loridon, K.; Gay, L. Structure of multilocus genetic diversity in predominantly selfing populations. Heredity 2019, 123, 176–191. [Google Scholar] [CrossRef] [PubMed]
- Thomas, M.; Demeulenaere, E.; Dawson, J.C.; Khan, A.R.; Galic, N.; Jouanne-Pin, S.; Remoue, C.; Bonneuil, C.; Goldringer, I. On-farm dynamic management of genetic diversity: The impact of seed diffusions and seed saving practices on a population-variety of bread wheat. Evol. Appl. 2012, 5, 779–795. [Google Scholar] [CrossRef]
- Zhang, P.; Dreisigacker, S.; Buerkert, A.; Alkhanjari, S.; Melchinger, A.E.; Warburton, M.L. Genetic diversity and relationships of wheat landraces from Oman investigated with SSR markers. Genet. Resour. Crop. Evol. 2006, 53, 1351–1360. [Google Scholar] [CrossRef]
- Enjalbert, J.; Dawson, J.C.; Paillard, S.; Rhoné, B.; Rousselle, Y.; Thomas, M.; Goldringer, I. Dynamic management of crop diversity: From an experimental approach to on-farm conservation. Comptes Rendus Biol. 2011, 334, 458–468. [Google Scholar] [CrossRef]
- Raquin, A.L.; Depaulis, F.; Lambert, A.; Galic, N.; Brabant, P.; Goldringer, I. Experimental estimation of mutation rates in a wheat population with a gene genealogy approach. Genetics 2008, 179, 2195–2211. [Google Scholar] [CrossRef]


| No | Name (abbr.) | Type of Variety (abbr.) | Type of Conservation (abbr.) | Farm (Country of Origin) | Description and Source of Original Variety |
|---|---|---|---|---|---|
| 1 | Renan (RN) | Modern variety (MV) | None | None | Modern French variety (INRA). The most common variety for organic farming in France. |
| 2 | Haute Loire (HL) | Landrace (LR) | ex situ (EX) | FM (France) | Landrace from the mountainous region in central France. Conserved ex-situ in the French National Gene Bank. Under on-farm cultivation since 2004, in Northwestern France. |
| 3 | Piave (PI) | Landrace (LR) | ex situ (EX) | GC (Italy) | Landrace from Northern Italy. Conserved ex-situ in Instituto di Genetica e Sperimentazione Agronomica di Vicenza, Italy, obtained from their regional gene bank. |
| 4 | Rouge de Bordeaux (RB) | historical variety (HV) | in situ (IN) | JFB (France) | historical Southwestern French variety from the late 1800’s. The initial sample used in this experiment came from a farming community in the Bordeaux region and was never conserved ex-situ. |
| 5 | Solina d’Abruzzo (SO) | Landrace (LR) | in situ (IN) | TDS (Italy) | Landrace from the mountainous region in Central Italy. In continuous cultivation in situ. |
| 6 | Zonne hoeve (ZH) | Mixture of modern varieties (MIXMV) | in situ (IN) | PVI (The Netherlands) | Mixture of two modern German varieties (Rektor and Bussard). Provided by the farmer who cultivated these two as mixture for more than ten years in the central region of the Netherlands. |
| 7 | Melange de Touselles (TO) | Mixture of landraces (MIXLR) | in situ (IN) | HF (France) | Farmer composed mixture from four different landraces conserved ex situ: Three T. aestivum and one T. turgidum. Conserved in situ for ten years. |
| 8 | Redon (RD) | Mixture of landraces (MIXLR) | in situ (IN) | VC (France) | Farmer composed mixture from seven spikes, each from a different landrace accession from the Redon region from the French National Gene Bank and conserved in situ for ten years. |
| Number | Varieties | Variety Type | Conservation Type | N | |||||
|---|---|---|---|---|---|---|---|---|---|
| 1 | RN | MV | NC | 165 | 0.0062 | 0.0057 | 3 | 0.2354 | 0.0000 |
| 2 | HL | LR | EX | 165 | 0.0003 | 0.0012 | 5 | 0.0870 | 0.0000 |
| 3 | PI | LR | EX | 165 | 0.0027 | 0.1046 | 41 | 0.4334 | 0.2315 |
| 4 | RB | HV | IN | 172 | 0.0028 | 0.3364 | 37 | 0.6012 | 0.5713 |
| 5 | SO | LR | IN | 206 | 0.0094 | 0.1607 | 192 | 0.9850 | 0.7497 |
| 6 | ZH | MIXMV | IN | 154 | 0.0030 | 0.1642 | 23 | 0.8685 | 0.4347 |
| 7 | TO | MIXLR | IN | 145 | 0.0042 | 0.3025 | 61 | 0.9340 | 0.7283 |
| 8 | RD | MIXLR | IN | 153 | 0.0040 | 0.3364 | 35 | 0.9301 | 0.7414 |
© 2020 by the authors. Licensee MDPI, Basel, Switzerland. This article is an open access article distributed under the terms and conditions of the Creative Commons Attribution (CC BY) license (http://creativecommons.org/licenses/by/4.0/).
Share and Cite
Khan, A.R.; Goldringer, I.; Thomas, M. Management Practices and Breeding History of Varieties Strongly Determine the Fine Genetic Structure of Crop Populations: A Case Study Based on European Wheat Populations. Sustainability 2020, 12, 613. https://doi.org/10.3390/su12020613
Khan AR, Goldringer I, Thomas M. Management Practices and Breeding History of Varieties Strongly Determine the Fine Genetic Structure of Crop Populations: A Case Study Based on European Wheat Populations. Sustainability. 2020; 12(2):613. https://doi.org/10.3390/su12020613
Chicago/Turabian StyleKhan, Abdul Rehman, Isabelle Goldringer, and Mathieu Thomas. 2020. "Management Practices and Breeding History of Varieties Strongly Determine the Fine Genetic Structure of Crop Populations: A Case Study Based on European Wheat Populations" Sustainability 12, no. 2: 613. https://doi.org/10.3390/su12020613
APA StyleKhan, A. R., Goldringer, I., & Thomas, M. (2020). Management Practices and Breeding History of Varieties Strongly Determine the Fine Genetic Structure of Crop Populations: A Case Study Based on European Wheat Populations. Sustainability, 12(2), 613. https://doi.org/10.3390/su12020613