Article

Sustainability Reporting as a Mixture of CSR and Sustainable Development. A Model for Micro-Enterprises within the Romanian Forestry Sector

by
Marian Socoliuc
1,
Cristina-Gabriela Cosmulese
1,*,
Marius-Sorin Ciubotariu
1,
Svetlana Mihaila
2,
Iulia-Diana Arion
3 and
Veronica Grosu
1
1
Department of Accounting, Audit and Finance, “Stefan cel Mare” University, 720229 Suceava, Romania
2
Department of Accounting, Academy of Economic Studies of Moldova, 2005 Chișinău, Moldova
3
University of Agricultural Sciences and Veterinary Medicine Cluj-Napoca, Str. Manastur 3-5, Cluj-Napoca, 400372 Cluj, Romania
*
Author to whom correspondence should be addressed.
Sustainability 2020, 12(2), 603; https://doi.org/10.3390/su12020603
Submission received: 7 December 2019 / Revised: 1 January 2020 / Accepted: 10 January 2020 / Published: 14 January 2020

Abstract

:
In the last decades, the issue of the behavior geared towards society and the environment of small and medium-sized enterprises (SMEs) has created a new niche for economic researches. Most studies point out that entities operating in the forestry sector, despite having difficulties in applying valid corporate social responsibility (CSR) instruments, are concerned about the role they play in society. Therefore, they tend to develop their business by giving importance to the principles of sustainable development. The aim of the paper was to propose an econometric model to report the sustainability of non-financial performance for the companies operating in the forestry field. The main objectives of the study focused on defining and analyzing the studied problem through the specialized literature, defining and conceptualizing the statistical model in order to identify the risk factors and vulnerability, influencing the forestry sector in Romania. In this context, based on a sample of 248 Romanian active companies in the forestry sector in four distinct sectors, we calculated a number of indicators specific to the forestry sector in order to identify the risks and vulnerabilities and analyze the entities associated with this sector. Our research led us to the conclusion that, as far as the forestry sector is concerned, the companies that operate in Statistical classification of economic activities in the European Community (NACE) 240 and NACE 210 have registered superior results compared to the average in regards to the vulnerability of the sector, while those that operate in NACE 220 and NACE 230 focus mostly on those vulnerabilities regarding the risk zone of their sustainable development. The study could be useful both to stakeholders by giving them the possibility to identify those entities, classified according to the NACE code, taking into account the sector vulnerabilities and the risks associated with the profile market, as well as to the state that could influence through economic policies the sectors in which vulnerabilities are manifested.

1. Introduction

Within the context of increasing interest for sustainable development, the business entities need to explain the manner in which their activity influences the environment and the society at large. As far as Romania is concerned, like in the case of the other European countries, more than 99% of the companies that operate within the economy are part of the small and medium-sized enterprise (SME) category. Consequently, the understanding of the impact of their activities on the quality of the environment and the community is gradually becoming a target in itself.
The forestry field is environmentally sensitive. Forestry companies often focus on environmental strategies in order to improve the legitimacy of their economic activities [1]. In Romania, the impact of the companies operating in the field of forestry and exploitation of the environment and the way to diminish it has become of utmost top importance. Being part of an environmentally sensitive industry, forestry companies often focus their communication strategies on environmental issues in order to attain the legitimacy of their economic activities [2].
This should be a priority in the business strategy of all companies carrying out activities that have a negative impact on the environment itself. It is necessary and vital for the future generations that these companies combine both the economic and financial dimensions with the social and environmental ones so as to provide users with a broader perspective on their activities [3]. Most market shifts, combined with multiple reforms within the European agricultural sector, have led to a reduction in the profitability of the forest sector [4]. Compensation contracts can encourage forestry development and bio-security efforts [5]. In addition to the financial reporting that is disclosed to the public, they include an environmental report, too. This report can outline the actions through which these companies contribute to the protection of the environment, as well as to the improvement of the standard of living of the society that they operate in [6,7]. Large companies are more likely to face government institutions [4], mass media, environmental organizations, and other stakeholders by being able to demonstrate that they are socially responsible [8]. Nowadays, we live in a world where positive financial results are of utmost importance. That is why we need to pay more attention to the concept of social responsibility and sustainability reporting, too.
Starting from the belief that the resources offered to us by the environment are limited and their regeneration time is a very long one in itself, it is very important to focus on identifying all the means by which the sustainability of the environment can be reached. Forestry companies need to address the corporate social responsibility (CSR) issue so that, apart from the financial balance sheet presented on the Public Finance website, in the case of the non-listed companies, an environmental review should be designed, too. The existence of this balance sheet expresses the interest that the companies operating in this field of activity have in terms of environment protection. This sustainability report will give companies a much more credible and more favorable picture in regards to the information users. Based on this balance sheet, companies will broaden the database that the external users need in order to establish the investment decisions.
Sustainable development has been declared a political goal for the European Union since 1997, and, starting with 2002, the European Council adopted the EU’s project for the Sustainable Development Strategy during its session held in Barcelona. The key objectives of the Sustainable Development Strategy aim at four key segments, as shown in the following figure (Figure 1).
As can be observed, environmental protection is a key element of sustainable development in the context of the efficient management of global resources. In this case, both the economic and social life, combined with the natural environment itself, represent a complex global system that has multiple interconnections based on the human development, decisions, or actions in a field that has multiple implications in other areas [9].
As far as Romania is concerned, these steps have been taken through the adoption of the National Strategy for Sustainable Development. Its declared objective is the alignment of Romania to the average performances registered in the European Union on all four strategic development directions, including the environmental policy and, consequently, the protection of the forest fund (Figure 2).
It is a well-known fact that the forest resources are unevenly distributed worldwide, and, thus, in the above map, one can notice this inequality of forest fund and its distribution in the counties of Romania. In this respect, based on these figures, we could mention the fact that there is a visible national discrepancy between the counties. The national fund can be divided into two categories: those that are rich in forestry resources (i.e., Suceava, Caraş-Severin, and Valcea counties) with a percentage of about 40%–50%, and those lacking these resources (i.e., Călăraşi, Ialomita, and Ilfov) with approximately 3%–5% of the forest out of the total area of the county.
According to the Romanian Government [11], from a socio-economic point of view, the exploitation of forests generates resources, especially wood. There is various use with an emphasis on the energy field (about half of the renewable energy consumed in the EU is generated by wood), timber, paper and the panel industry, etc. Forests also provide “non-timber” products, such as food (i.e., forest fruits and mushrooms), cork, resins, oils, etc. It also contributes to the development of certain services (i.e., hunting, tourism, etc.). Forests are a source of jobs, especially in rural areas. Forests occupy an important place within the national and European culture.
The idea outlines the benefits brought by its resources. Regardless of the category, it belongs to, each resource contributes to the welfare of the environment, especially to society itself.
The study has a regional character by taking into account a sample of 248 companies active in the forestry sector from the N-E region of Romania, which carry out their activity mainly in Suceava county. We mentioned that the forests covered more than a quarter of the surface of Romania, more precisely 27.6% at the end of 2018 [10]. Between 2001 and 2018, more than 300,000 hectares of forest were cut in Romania, according to an online platform called Global Forest Watch, which publishes interactive maps based on the images provided by satellites [12]. Due to this platform, we could understand and follow on any desired region the phenomenon of deforestation in Romania. The counties where the largest deforestation has been made in the last 15 years are in order: Suceava, Harghita, Maramures, and Cluj. According to the interactive maps published by Global Forest Watch, Suceava is the county that lost the largest area of forest in the 2001–2016 period, i.e., 46,300 hectares (the average for the country during the same period was 7100 hectares). This region was chosen because Suceava county ranks first on the national level in terms of forestry (439,046 thousand hectares) and also on the first place on deforested areas. Considering these aspects, we considered that the CSR issue is becoming extremely important in the forestry sector, as the massive deforestation in Romania is a national security problem.
The following research objectives supported the achievement of the aim of the present study: the 1st objective: defining and analyzing the studied problem based on the specialized literature by comparing the analysis methods proposed by the international researchers in order to identify their divergent and convergent opinions regarding the phenomenon studied; the 2nd objective: developing the phenomenological analysis framework based on a presentation of the European issue on sustainable development, identifying the national traceability of the issues of convergence and sustainable development in Romania, and presenting the actual situation of the studied sector with reference to Romania; the 3rd objective: identifying the risk factors and vulnerability, influencing the forestry sector in Romania based on the prospective analysis of the national market related to the forestry sector, a phenomenological analysis of the networking, and identification of the critical indicators for the suggested sample.
Our findings contributed to the following aspects. Firstly, we examined the connection between the corporate social responsibility (CSR) and concepts, such as corporate financial performance (CFP) [13,14,15,16], non-financial reporting [13,17], sustainable development, sustainability reporting, socially responsible firms [18], sustainability of SMEs [19], CSR disclosure [20], CSR mandatory [21], environmental reporting [22], social responsibility investment [23], corporate social performance [24], forest management [25]. Secondly, in this study, the two-stage least squares method (TSLS) technique [26] was used for developing an econometric model of estimating the risk/vulnerability of the sustainable development based on the general coefficient of vulnerability of the sector (GCVs), considering four areas of activity in the forestry sector. Finally, based on the econometric model, we discovered that, as far as the forestry sector is concerned, the companies that operate in the field of silviculture and other forestry activities and the field of support services to forestry have registered superior results compared to the average in regards to the vulnerability of the sector. At the same time, those that operate in the field of logging and gathering of wild growing non-wood products focus mostly on those vulnerabilities regarding the risk zone of their sustainable development.
The study is structured into six sections. The next section offers a theoretical framework that helps develop assumptions that would be tested, as well as a review of the literature on sustainability reporting as a mixture of CSR and sustainable development. In this respect, for a clearer vision of the concepts, we would resort to the structuring of analysis on related phenomena based on the technique of dissociation phenomena, studying sustainability reporting as a mixture of CSR and sustainable development. The third section sets out the research methodology of our study, including the data sources, the means that were used, and the details of the performed analysis. In this section, we have suggested a reporting model, facilitating the sustainable development assessment process in the context of the forestry sector. The fourth section presents the outcome of the study. The study ends with a conclusion of the findings of the study, as well as observations on their limitations.
The study could be useful both to stakeholders, by giving them the possibility to identify those entities, classified according to the NACE code, taking into account the sector vulnerabilities and the risks associated with the profile market, as well as to the state that could influence through economic policies the sectors in which vulnerabilities are manifested and to improve the social responsibility system construction.
The overall methodology and the measures to be taken are shown below.

2. Theoretical Background

2.1. A Brief Overview of the Scientific Field

In the context of today’s economy, the concept of “corporate social responsibility” has gained momentum. Its importance derives from the very attitude of the companies that have understood the importance of the impact of their activity on the environment they operate in.
The interest of the academic field in regards to environmental protection with the aid of all possible tools has grown, especially in the case of those companies carrying out activities that have a qualitative and quantitative impact on the environment. This can be quantified through the impressive amount of articles that were published in ISI Thompson Reuters indexed magazines and journals.
At first, the researchers were concerned with defining the concept of CSR and highlighting the advantages of its promotion within the economic entities. Nowadays, their concerns are also geared towards the design of new reporting tools and non-financial performance results that are a consequence of the activity of these companies through which stakeholders can have access to the information on the environment and society. Some authors [27,28,29] regard the CSR as being related to the equity concentration so that the public companies and the listed ones have a specific capacity to disclose information in the CSR activity. Other authors [8] have focused on disclosing the indexes and build correlations analysis for a better understanding of the CSR’s implementations.
As far as the non-financial reporting is concerned, we used the keywords “non-financial reporting” or “sustainability reporting” as search parameters. There were 867 results found (articles and proceeding papers) for 1994–2019. It is worth mentioning the fact that starting with 2012, the number of studies focusing on this specific issue has considerably become important internationally.
During the same period, the areas of interest for scientific research have diversified. Thus, since right after 1994, the studies focusing on the analyzed topic mostly took place within the fields of environmental studies and ethics; at present, the research process covers approximately 25 fields of interest, especially in the fields of management, business, economics, environmental sciences, environmental studies, etc.
As far as Romania is concerned, scientific research is less present. The research showed 34 results, namely articles and proceeding papers of Romanian authors. The themes of interest are not that diverse and are based on sectors, such as management, business, economics, and business and finance.
For the sake of exploring the main research fields of interest, we conducted an analysis of the frequency of the keywords from the titles/abstracts of those articles that were included in the Web of Science database by using the VOSviewer (see Figure 3).
The figure shown above emphasizes the existence of seven clusters that are connected with the scientific research on the non-financial reporting, the sustainability reporting, respectively. The amplest cluster refers to those topics referring to corporate sustainability, corporate reporting, environmental disclosure, impression management, innovation, institutional theory, integrated reporting, sustainability accounting, value creation, etc. The next cluster is formed based on such issues as the CSR reporting, the corporate sustainability reporting, the stakeholders’ engagement, the transparency, the social media, etc. The third cluster focuses on certain issues, such as CSR, corporate governance, disclosure of information, performance. The fourth one has in view certain issues regarding the management, organizational change, sustainable development, sustainability reporting, and the global reporting initiative. The fifth cluster focuses on certain topics, such as CSR reporting, non-financial reporting, sustainability performance, consumption, and efficiency. The issues related to the responsibility, the stakeholder theory, the financial performance, the environmental performance, and the ethics, etc. are part of the sixth cluster. The last one focuses mainly on the company’s performance, the strategy, and the CSR, etc.
As shown in the following figure (Figure 4), in Romania, the scientific research geared towards the issue of non-financial reporting/sustainability reporting is still in its beginnings by covering only seven items that are grouped in two clusters.
Consequently, we could state the fact that, at an international level, the researches on non-financial reporting, sustainability reporting, respectively, take place in different conditions with different results and highlight a variety of extension tendencies among the clusters.

2.2. Sustainability Reporting as a Mixture of CSR and the Sustainable Development

The social responsibility of the companies has created a niche in the theoretical field at the beginning of the 1960s and 1970s. It has become an open debate with lots of divergent opinions. The first decades after the war were centered on a social analysis as it was a transformation and adjusting period in terms of the position on the CSR issue. At the same time, it was a period when the CSR practices were entirely geared towards charity functions [30,31,32,33,34,35,36,37]. At that time, the debates on the role of the companies in society generated two theoretical approaches. Thus, on the one hand, Friedman [38], in his genuine liberal position, considered that the companies play a sole economic role, that is, they have the duty of maximizing their profits, based on the law and certain minimum ethical constraints. In 1962, Friedman [39] talked openly about the social responsibility doctrine that is viewed as fundamentally subversive. He believed that there were few trends that might be able to jeopardize the fundamental beliefs of the free society as much as the acceptance of the idea that the managers/businesspeople have another type of social responsibility than to make as much money as possible for their stakeholders. On the other hand, there are more and more studies that incorporate a vast record of duties towards society. For example, Davis [40,41,42] suggested extensive comments that refer to those obligations that business people have in regards to society in terms of the economic development that influences the population’s well-being (such as inflation, employment, competition, etc.). Davis [42] highlighted the fact that a company’s social results represent an important variable in the equation of the quality of life. Thus, business relationships can no longer be solely considered in relationship with economic results. The social observations need to play a significant role in all the business actions and decision-making processes.
An important contribution to the reconciliation of the two mainstreams was given by Carroll [43]. When talking about social responsibility, he makes reference to four categories, such as the economic, legal, ethical, and discretionary performances. Carroll’s inclusive view managed more or less to clear the incertitude regarding the very essence of the CSR concept that was a consequence of the term’s frequent use during the 1970s [37]. At the same time, many studies suggested the importance of a managerial type of approach of CSR [35]. At the international level, during the 1970s, a series of studies on the idea of a sustainable future and a worldwide economic system were published [44].
In the 1980s, based on a fairly limited regulation framework, the focus on refining the CSR issue gave way to the manifestation of a series of themes and concepts that were either complementary or alternative, such as the corporate social responsiveness, the corporate social performance, the business ethics, the stakeholder theory, etc. [35,36,37].
Peter Drucker is the one who took a special interest in the research on the importance of the corporations in the present-day society. In most of his studies, he either makes direct or indirect allusions to the fact that he remains faithful to his belief that the social dimension makes the companies be able to survive on the market, as enterprises exist as part both of the society and the economy. Drucker insists on the fact that a company “is in itself the very product of both society and of an economy” and that both the society and the economy itself can make it cease to survive overnight. Moreover, that enterprise does exist as long as both the society and the economy regard it as fulfilling a necessary, useful, and productive role in itself [45]. However, he considers that a company’s foremost social responsibility is to have enough profit in order to cover future costs. In case this responsibility fails to be met, then no other social responsibility could be fulfilled otherwise. That is due to the fact that “decaying businesses in a decaying economy are unlikely to be good neighbors, good employers, or socially responsible in any way” [46]. Apart from that, a company’s most suitable type of social responsibility is to transform a social issue into an economic opportunity with economic benefits, productive capability, human abilities, well-paid jobs, and well-being [46].
At the beginning of the 1990s, in terms of the CSR, there were three main trends that took shape in terms of the challenges and inherent crisis of an increasingly interconnected world, namely globalization, institutionalization, and strategic reconciliation [47]. The latest decades have both shown a vivid interest in the acknowledgment and the implementation of the CSR [37] and revealed substantial influences regarding the refinement of the analysis based on including certain strategic considerations in order to explain the concept. For example, Van Marrewijk [48] stated that the societal approach to CSR is the strategic result in regards to the latest circumstances and challenges that companies have to face. At the same time, this fact creates a new perspective that has companies totally re-think their position and act within the complex social circumstances they are themselves part of. Van Marrewijk and Were [48,49] suggested the existence of a hierarchical relationship among CSR, corporate sustainability, and corporate responsibility. Thus, the three (economic, environmental, and social) facets of sustainability can be expressed by a corporate responsibility approach for every company. As long as companies operate based on different value systems in varied circumstances, they have developed and will continue to develop several corporate sustainability levels that can be represented by the 4P-framework of corporate sustainability (principles-profit-people-planet). According to Van Marrewijk [48], these levels/interpretations are actually a reflection of different reasons that are at the basis of integrating the corporate sustainability in the companies’ business practices. Out of the six levels that were described by Van Marrewikj and were [49], the holistic one best reflects the full integration of corporate sustainability in every aspect of the business. This is due to the fact that sustainability represents the only alternative in place as long as all human beings and phenomena are interrelated to one another.
The role of CSR as a key strategic element has also been studied by Werther and Chandler [50] initially as an instrument for brand management, starting from the point of view that the connection between the stakeholders and the brands stands for the target of the brand as such. While its value grows, the strategic importance of the CSR grows, respectively. Later on, the idea of the strategic values of the CSR has been much more refined. They argued that, since an appropriate strategy became a source of sustainable competitive advantage in itself, this specific strategy needs to be recognized by the specific environment the companies competed in [51,52,53].
Starting from the assumption that, on the one hand, there is a close relationship between the companies and the society itself, and, on the other hand, that the relation manifesting in regards to the success of the corporations and the social well-being is a meaningful one, Kramer [54] identified two intersecting points, namely the inside-out linkages and the outside-in linkages. In other words, firstly, the companies have a major impact on society at large through their businesses, and, secondly, the outside social actions have an impact on the corporations. The strategic CSR refers to a mixture of these two aspects. Moreover, it can become more of a source of opportunities, innovations, and competitive advantage rather than a cost, a constraint, or a charitable act. In a well-known study, Kramer and Porter [55] talked in detail about introducing the concept of shared value which, in comparison with CSR that is considered to have little to do with businesses in general, is considered to be a key element of the companies’ profitability and competitive status. The CSR has become more and more popular for the business success as it provides companies assignments and strategies that put together the stakeholders and the society at large. According to Chandler [56], the CSR’s strategic effects are more visible when we consider the present-day business environment as being influenced by a series of forces that empower the groups of stakeholders (from the point of view of the well-being, the sustainable development, globalization, the telecommunications, the stakeholders’ reputation, etc.). From this perspective, the SCSR (i.e., the strategic CSR) refers to the change of the value-creating system based on integrating the CSR in the strategies and activities of the companies [56].
Taking into account the growing sensitivity towards the issue of the CSR and the need to integrate the principles of sustainable development in their activities, most companies, especially the big ones, as well as the multi-national corporations, start approaching their communication with their stakeholders in a different manner. Consequently, as far as Girella et al. [57] are concerned, taking into account the limitations of the traditional financial reporting, in the last few decades, new external means of reporting have come up. These new external means of reporting include sustainability, CSR, ESG (the environmental, social, and governance), together with the social and environmental accounts, the integrated reporting, etc. The disclosure of certain non-financial types of information regarding the mission, vision, the business model, the performances, the perspectives, the projects that have in view the business ethics, the environment itself, and the society are viewed more in terms of an appropriate answer to the stakeholders’ expectations in the present-day society [58]. Such an innovative means of non-financial communication are mainly the prerogative of large companies. The researches and the studies that have taken place during the past decades are a clear indication of this trend. In spite of the fact that companies in any country outnumber the SMEs, there are still information gaps on those strategies that are adopted by the SMEs for sustainable development as well as their results [59]. These gaps are a result of both of the inherent features of these companies and the very environment they operate in [57,60]. For example, Murillo and Lozano [61] pointed out the existence of certain confusions regarding the very understanding of the concept from the point of view of the practices referring to the studied SMEs, the relationship that exists between the CSR and the leadership, as well as the tendency towards an internal type of communicating their internal practices (mostly placed within their close area of influence). Moreover, there is no such thing as a quantitative and explicit expression of the CSR practices in specific results that affects the profit and loss account [60].
On the other hand, the need for communicating/reporting the CSR practices by SMEs is questioned. Several sophisms are identified when CSR is used. This was taken from the practice used by large corporations belonging to the small business sector. He argued that, while most SMSs are only important locally and, thus, have limited recognition, the large companies are constantly under the customers’ pressure. In this context, the leaders of the small businesses have the right to doubt regarding the relevance of the same CSR instruments, the means of communicating through reports and media, taking into account the fact that the SMEs have a fewer number of stakeholders, employees, and shareholders than the large companies [60]. Fassin’s conclusion was that the very essence of CSR refers to the implementation of certain responsible business practices, which is the organizational, not the formalizing type of culture. From the point of view of the interaction between the attitude and action [62], the result of a study that focused on those practices referring to the environment for those SMEs in the manufacturing sector of Auckland region (New Zealand) is very conclusive. The result shows that a positive attitude of the respondents does not mean a higher probability of getting involved in those actions that are geared towards environmental protection except for the ones regarding environmental management. From this point of view, it seems that a positive attitude made the managers overcome the obstacles regarding the costs and/or the regulations or not to be exclusively motivated by them. Baret and Helfrich [63] argued that non-financial reporting faces certain constraints. They describe them as a trilemma. They refer to certain constraints that refer to the CSR’s complexity, irreducibility, and “evolution”, certain constraints that stem from the inherent interests of the non-financial reporting, as well as those constraints that are associated with the expectations of the company.
The growing number of researches during the past years suggests the fact that the SMEs develop approaches that are specific to the CSR practices. In their study, Battisti and Perry [64] argued that the practices of the small and average businesspeople are based on their understanding of the responsibilities in terms of the environment (as they are motivated by the growing access to a series of actions that focus on the environment, such as energy-saving, recycling, the waste management, etc.). Del Baldo [65] even talks about a territorial model of development that is adjusted to the social and economic context of the specific region that the SMEs operate in. In spite of the obstacles they face, a group of SMEs has successfully managed to integrate sustainable development into their activities. They are part of their social and environmental practices. From this point of view, Matinaro et al. [66] identified a series of key factors in terms of sustainable business models for SMEs on the three levels of CSR. Their findings in the study were that such a business model requires an ample strategic effort that is essential for the business’ competitive advantage and success.
In order to support the 1st objective of our study by taking into account the specialized literature, we analyzed the most important studies that focused on the connection between the CSR and concepts, such as sustainable development, sustainability reporting, CSR disclosure, environmental reporting, social responsibility investment, corporate social performance, forest management, non-financial reporting, leadership.
The reason for choosing these works was the research field and the notoriety of research journals. Thus, we only chose the works published in top journals and whose design research was focused on keywords like CSR and the concepts and the aforementioned concepts (see Table A1).

3. Materials and Methods

The protection and safeguarding of the environment have an important role in close connection with Romania’s sustainable development, which is seriously conditioned by environmental protection [67].
The scientific approach starts from the need to develop an intelligent reporting model to facilitate the sustainable development assessment process in the context of the forestry sector that is affected by the phenomenon of illegal deforestation and other high-risk phenomena, both on the financial and fiscal level, and on strategic policies regarding the environment and the biodiversity protection. These research directions contain elements of risk associated with the sustainable development implementation process of the sector. The models will be analyzed based on the two-step analysis, respectively: step 1—the analysis of the sector vulnerability; step 2—the analysis of entities associated with the sector. Some authors analyze the vulnerabilities based on a random classification model [68,69]. The mapping of the research aimed at reaching each point and finalizing all the 4 stages (as is shown in Figure 5).

3.1. Sample

The study sample was composed of 248 companies selected on the basis of inclusion and exclusion criteria. The inclusion criteria consisted of (a) the selection of the entities from the forestry field according to their NACE code (four activity fields were considered relevant); (b) companies operating in the N-E region of Romania, the region in which the largest deforestations were registered in the period 2008–2017 (companies that have been continuously operating in the period 2008–2017). The exclusion criteria were constant in (a) companies that were newly established or companies that had suspended activity during the period under analysis; (b) the companies with activity adjacent to the forestry field and which did not comply with the four NACE codes: Silviculture and other forestry activities-0210, logging-0220, gathering of wild growing non-wood products-0230, support services to forestry-0240. The database was built through the authorized website, Listafirme.ro, taking into account the four relevant areas of the forestry sector. For these companies, the most important sector-specific financial indicators were collected from the annual reports, after which six relevant indicators were calculated to estimate the sectorial vulnerabilities (see Table 1, Table 2, Table 3, Table 4, Table 5, Table 6 and Table 7).

3.2. Measures

Indicators taken into account in order to establish the vulnerability of the sector or risk area from the point of view of sustainable development were based on accounting data and information provided by the financial reporting. For each of them, financial data regarding the values of the patrimonial fixed asset capitalization, the liquidity rate, the sustainable growth rate, the profitability of workforce use, the profitability rate, the risk of insolvency at 31 December were manually collected from the annual reports of the firms included in the sample. From all of the CSR indicators identified in the specialty literature, we found in the annual reports of unlisted firms, far too little information (incomplete information on the amounts spent) on health and safety costs at the workplace [70,71], corporate giving, waste management expenses [72,73], and employee training courses expenses [70,71,74]. Of all the categories of indicators listed above, the only category where we found indicated amounts spent (measured as a percentage of turnover) was corporate giving [75,76,77].
Studying the specialized literature, we could state that over time CSR has been correlated with different concepts, such as CFP, profit, labor turnover, sustainable development, financial performance, but neither of these studies has addressed the problem of conceptualizing an econometric model of estimating the risk/vulnerability of the sustainable development based on the general coefficient of vulnerability of the sector (GCVs). Even though CSR was analyzed, taking into account one or more financial indicators that we proposed as variables in our study, most recent studies set different aims in relation to the aims of the present study. In the following, we proceeded to analyze the recent specialized literature that had, like its topic, the study of CSR in correlation with different financial indicators used in this study in order to construct the econometric model. Thus, taking into account the variable fixed asset capitalization, various studies attempted to examine the relationship between CSR and CFP [15,78], with corporate political activity (CPA) serving as the moderator [16], or correlation between CSR and profit [79]. In the study undertaken by Dam and Scholtens [80], the variable liquidity rate was used to investigate “how ownership concentration in European multinational firms is associated with these firms’ CSR”. The variable rate of sustainable growth has been used in numerous studies to investigate “the effect of CSR on information asymmetry between firms and creditors” [81] and to examine the relationship between CSR and CFP [16], as well as in the relationship between CSR and financial performance [81]. Profitability of using workforce is one of the variables often used in studies to “investigate the relationship between the budget related to CSR, innovation, and training, defined as sustainable factors, and the financial results of small and medium-sized enterprises (SMEs)” [19], to examine the correlation between CSR and financial performance, to examine the relationship between CFP and CSR, as well as the relationship between corporate social responsibility activities (CSRA) and human capital (HC) and the relationship between HC and CFP [82]. To examine the relationship between CSR and CFP, Lin et al. [16] used the variable profitability rate. The variable insolvency risk was used by Yang, Bento, and Akbar [2019] to investigate whether CSR efforts enhance firm performance.
The following indicators are control variables included in the analysis to control the reliability of the model and reduce the risk of biases in order to achieve a sustainable reporting model.
The patrimonial fixed asset capitalization (PFAC)
P F A C = F A E ,
where:
  • PFAC—the patrimonial fixed asset capitalization;
  • FA—the value of fixed assets financially reported;
  • E—the amount of financially reported equity.
The indicator reflects the ability of the entities in a given sector to keep and develop, through the capitalization phenomenon, those fixed assets held at a given point in time in order to eliminate the influence of obsolescence through asset increases and periodical upgrades.
The over-unitary value of the indicator reveals a high degree of use of capital that was attracted to the detriment of the invested capital, while a negative value of the indicator reflects the failure of management policy, including the field of sustainable development.
The average value of the indicator assimilated to the statistical optimum for an analyzed sector is estimated by using the formula:
P F A C   ¯ =   i = 1 n F A i E i n
The sectorial dynamics of the indicator expressed on the basis of the average of the absolute weights of evolution in a relevant historical period is estimated by using the formula:
Δ P F A C =   i = 1 n P F A C i P F A C i 1
The sectorial analysis of the forestry sector indicator and the four domains based on the NACE (Statistical classification of economic activities in the European Community) classification of the fields of activity were generated by the following results for a sample of 248 selected entities that were analyzed over a representative reference period of 10 years (see Table 1).
The values in Table 1 indicated the compliance with the sustainable development strategy of the indicators achieved by the companies that had NACE 0240 as their main field of activity, while, at the opposite pole, the companies with high vulnerability towards sustainable development activated on the NACE 0220 field and NACE 0230, respectively. For the latter, there was a sub-unitary dynamic of the evolution of the indicator, making the allocation of the vulnerability coefficients difficult to be made.
● The liquidity rate (LR)
LR   =   C A F A ,
where:
  • LR—the liquidity rate;
  • CA—the value of the current financially reported assets;
  • FA—the value of the financially reported fixed assets.
The indicator reflects the degree of financial independence of the entities and the readiness to immediately access their funds in order to achieve sustainable development strategies.
The over-unitary value of the indicator reveals a high degree of financial independence as the overall average for the forestry sector is 41.58 units, mainly due to the forest resource holdings. At the same time, the accelerated diminution of the indicator may suggest the phenomenon of illegal cuts. The sub-unitary value of the indicator indicates high vulnerability and economic blockage risk. Forest fund growth efforts can be estimated based on this indicator only if the sectorial dynamics of the indicator expressed, based on the average of absolute weights of evolution in a relevant historical period, is over-unitary.
The average value of the indicator assimilated to the statistical optimum for an analyzed sector is calculated using the formula:
L R ¯ =   i = 1 n C A i F A i n
The sectorial dynamics of the indicator expressed on the basis of the average of absolute evolution weights in a relevant historical period is estimated by using the formula:
Δ L R =   i = 1 n L R i L R i 1
The sectorial analysis of the forestry sector indicator and the four branches according to the NACE classification of the fields of activity (i.e., 4 fields) generated the following results for the sample of 248 selected companies and analyzed over a representative 10 years reference period:
The values shown in Table 2 indicated the compliance with the sustainable development strategy of the indicators achieved by the companies that had NACE 0240 as their main field of activity, while, at the opposite pole, the companies with high vulnerability having NACE 0230 and NACE 0220 as their main activity field. For the latter, there was a sub-unitary dynamics of the evolution of the indicator.
● The sustainable growth rate (SGR)
SGR =   T E   ;
where:
  • SGR—the sustainable growth rate;
  • T—the amount of financially reported turnover;
  • E—the amount of financially reported equity.
The indicator reflects the ability of a business to sustainably grow the surplus of operating income (expressed through turnover), when compared to the entity’s equity, in a sector of activity, which is surprising in dynamics.
The over-unitary value of the indicator reveals a sustainable growth of the business if and only if the sectorial dynamics of the indicator expressed because of the average of the absolute evolution weights in a relevant historical period is over-unitary. The sub-unitary value of the indicator reflects vulnerability in the field of sustainable growth, whereas the negative value of the analyzed indicator indicates the risks of the business. The risk increases progressively as the negative value increases.
The average value of the indicator assimilated to the statistical optimum for an analyzed sector is estimated by using the formula:
S G R   ¯ =   i = 1 n T i E i n
The sectorial dynamics of the indicator based on the average of absolute evolution weights in a relevant historical period is estimated by using the formula:
Δ S G R =   i = 1 n S G R i S G R i 1
The sectorial analysis of the forestry sector indicator and the four branches according to the NACE classification of the fields of activity (4 fields) generated the following results for the sample of 248 companies selected and analyzed over a representative reference period of 10 years:
The values in Table 3 indicated the compliance with the sustainable development strategy of the indicators realized by the companies that had NACE 0220 as their main activity field, while, at the opposite pole, the companies with high vulnerability towards the sustainable development were represented by NACE 0230.
● The profitability of using workforce (PUW)
PUW   =   N P N E   ,
where:
  • PUW—the profitability of using workforce;
  • NP—the value of the financially reported net profit;
  • NE—the number of employees.
The sectorial analysis of the forestry sector indicator and the four branches according to the NACE classification of the fields of activity (four fields) for a sample of 248 selected companies whose indicators were analyzed over a representative reference period of ten years generated the following results:
As we might notice, the values presented in the above Table 4 indicated the convergence with the sustainable development strategy of companies operating in the field of forest exploitation (NACE 0220), while, at the opposite end, there were companies operating in the field of activity (NACE 0230, NACE 0240), where negative values of the average of the indicator were recorded.
● The profitability rate (PR)
PR   =   N P T   ,
where:
  • PR—the profitability rate;
  • NP—the value of the financially reported net profit;
  • T—the amount of financial reported turnover.
The profitability rates are defined in terms of statistical optimum as sub-unit and positive. Their value for sustainable development has to reach at least 15%. The positive values under the statistical optimum indicate certain vulnerabilities in regards to sustainable business management as well as certain negative values that indicate major risks related to the business management and administration.
As the study revealed, as far as the Romanian forestry sector is concerned, the overall average was sub-unitary. This fact reflects that the units, especially the autonomous governments, lack the managerial capacity for sustainable business management.
The average value of the indicator assimilated to the statistical optimum for an analyzed sector was estimated by using the formula:
P R ¯ =   i = 1 n N P i T i n
The sectorial dynamics of the indicator expressed because of the average of absolute evolution weights in a relevant historical period was estimated by using the formula:
Δ P R =   i = 1 n P R i P R i 1
In terms of the sectorial analysis of the forestry sector indicator, as well as the four branches based on the NACE classification of the fields of activity (4 fields) for the same sample of 248 selected companies whose indicators were analyzed over a representative reference period of ten years, the following results were obtained:
As could be seen, the values presented in the above Table 5 indicated compliance with the sustainable development strategy of the companies that had NACE 0210 as their field of activity. All other branches, as well as the general indicator belonging to the level of the forestry sector, indicated the noncompliance with the sustainable development of these companies.
● The risk of insolvency (RI)
RI   =   T D T   ,
where:
  • RI—the insolvency risk;
  • TD—the amount of used borrowed capital that is given by the total financially reported; debt ratio
  • T—the amount of financially reported turnover.
As far as Romania is concerned, the bankruptcy risk has been a major area of interest, especially during the economic crisis during which the phenomenon took place at a high level throughout the Romanian economy. The proposed indicator is relevant in relation to sustainable development as the emergence of bankruptcy risk is a clear signal that sustainable development cannot take place for a particular entity or sector. The amount of the debts accumulated by the entity may represent up to one point the interest of the strategic development managers of the company only when their increase is directly related to the increase in equity. Otherwise, the accumulation of debts is likely to stop the sustainable development, especially if the full coverage of these debts would require the results of more than two consecutive financial exercises (i.e., 700 days).
The statistical optimum of the insolvency risk indicator estimated for the forest sector in Romania was 1.14. This means that for the forest sector, the average period of payment of the total liabilities is of 416 days.
The recording of a value below this optimum reflected the good exercise of capacity and the absence of the insolvency risk. The exceeding of the sectorial dynamics of the indicator that was expressed based on the average of absolute evolution weight during a relevant historical period reflected a vulnerability in terms of the insolvency risk. At the same time, the exceeding of the unit value 2 of the indicator reflected the manifestation of imminent insolvency risk for the analyzed sector.
The average value of the indicator assimilated to the statistical optimum for an analyzed sector was estimated by using the formula:
R I ¯ =   i = 1 n TD T i n
The sectorial dynamics of the indicator expressed due to the average of absolute evolution weight in a relevant historical period was estimated by using the formula:
Δ R I =   i = 1 n R I i R I i 1
The sectorial analysis of the insolvency risk indicator in the forestry sector and the four branches based on the NACE classification of the fields of activity for a sample of 248 selected companies that were analyzed over a representative reference of ten years generated the following results:
Similar to the previous situations, the values registered in terms of the insolvency risk indicator suggested a compliance with the sustainable development strategy of those companies operating in the NACE 0210 field, as well as the NACE 0220, respectively, while, at the opposite end, there were those companies in the field of NACE 0240 (Table 6).
The following indicators were control variables included in the analysis to control the reliability of the model and reduce the risk of biases.
The following working hypotheses were formulated in order to achieve the proposed objective:
  • On a sectorial level, the patrimonial capitalization of fixed assets is a vulnerability that can affect sustainable development only when the sector evolution average of the indicator is below the overall average of the evolution on the forestry segment.
  • The liquidity rate of the entities operating in the forest segment affects and indicates the vulnerability of the sustainable development only when the average value of the sectorial calculated indicator exceeds a standard deviation (+/−) of 50%, whereas there is a sub-unitary evolution of the trend.
  • The sustainable growth rate that is calculated as a ratio between turnover and equity indicates a development vulnerability only when the overall dynamics of the indicator in a relevant reference period (of at least 10 years) is sub-unitary or when the indicator registers more than 3 negative values during the reference period.
  • Productivity represents a direct vulnerability and risk measurement indicator. The values exceeding with a standard deviation (+/−) of 50% the statistical optimum are represented by the general average of the forestry sector calculated in dynamics during a specific period (of at least 10 years) and are considered an indicator of high vulnerability. Consequently, if the negative values of profitability from the use of the workforce regardless of their values occur more than 3 times in the reference range, then this fact is an indication of the manifestation of the same systemic risk of the sustainable development vulnerability.
  • The risk of insolvency, given by the ratio between total debts and the turnover, exceeding the value of the statistical optimum calculated for the forest sector at 1.14 indicates an intrinsic vulnerability by de-capitalizing the companies in the analyzed segment and, implicitly, through their incapacity to ensure economic performance and sustainable development.
  • The risk chart, based on such indicators as the patrimonial fixed asset capitalization, the liquidity rate, the sustainable growth rate, the profitability of workforce use, the profitability rate, the risk of insolvency, can be built based on the historical data. It practically ensures the control levers of voluntary disclosure of managers regarding the sustainability report suggested to be implemented.
  • The reliability of using the sustainable reporting model is based on the model facility for managers and its ability to be confirmed by computing the reported financial information over a relevant historical period of at least 10 years.
The projection of a non-financial performance-reporting model for the microenterprises operating in the field of forest holdings and districts involved the estimation of the sectorial vulnerabilities, as shown in Table 7.
The presence of the vulnerabilities was coated as Vi > 0, while their absence was coated as Vi = 0.
The information that results from every section of the nonfinancial reports was quantified in a qualitative manner in order to trace out the positive aspects (i.e., the absence of the risk, R0) or the presence of the risk (Ri). For each Ri ≠ R
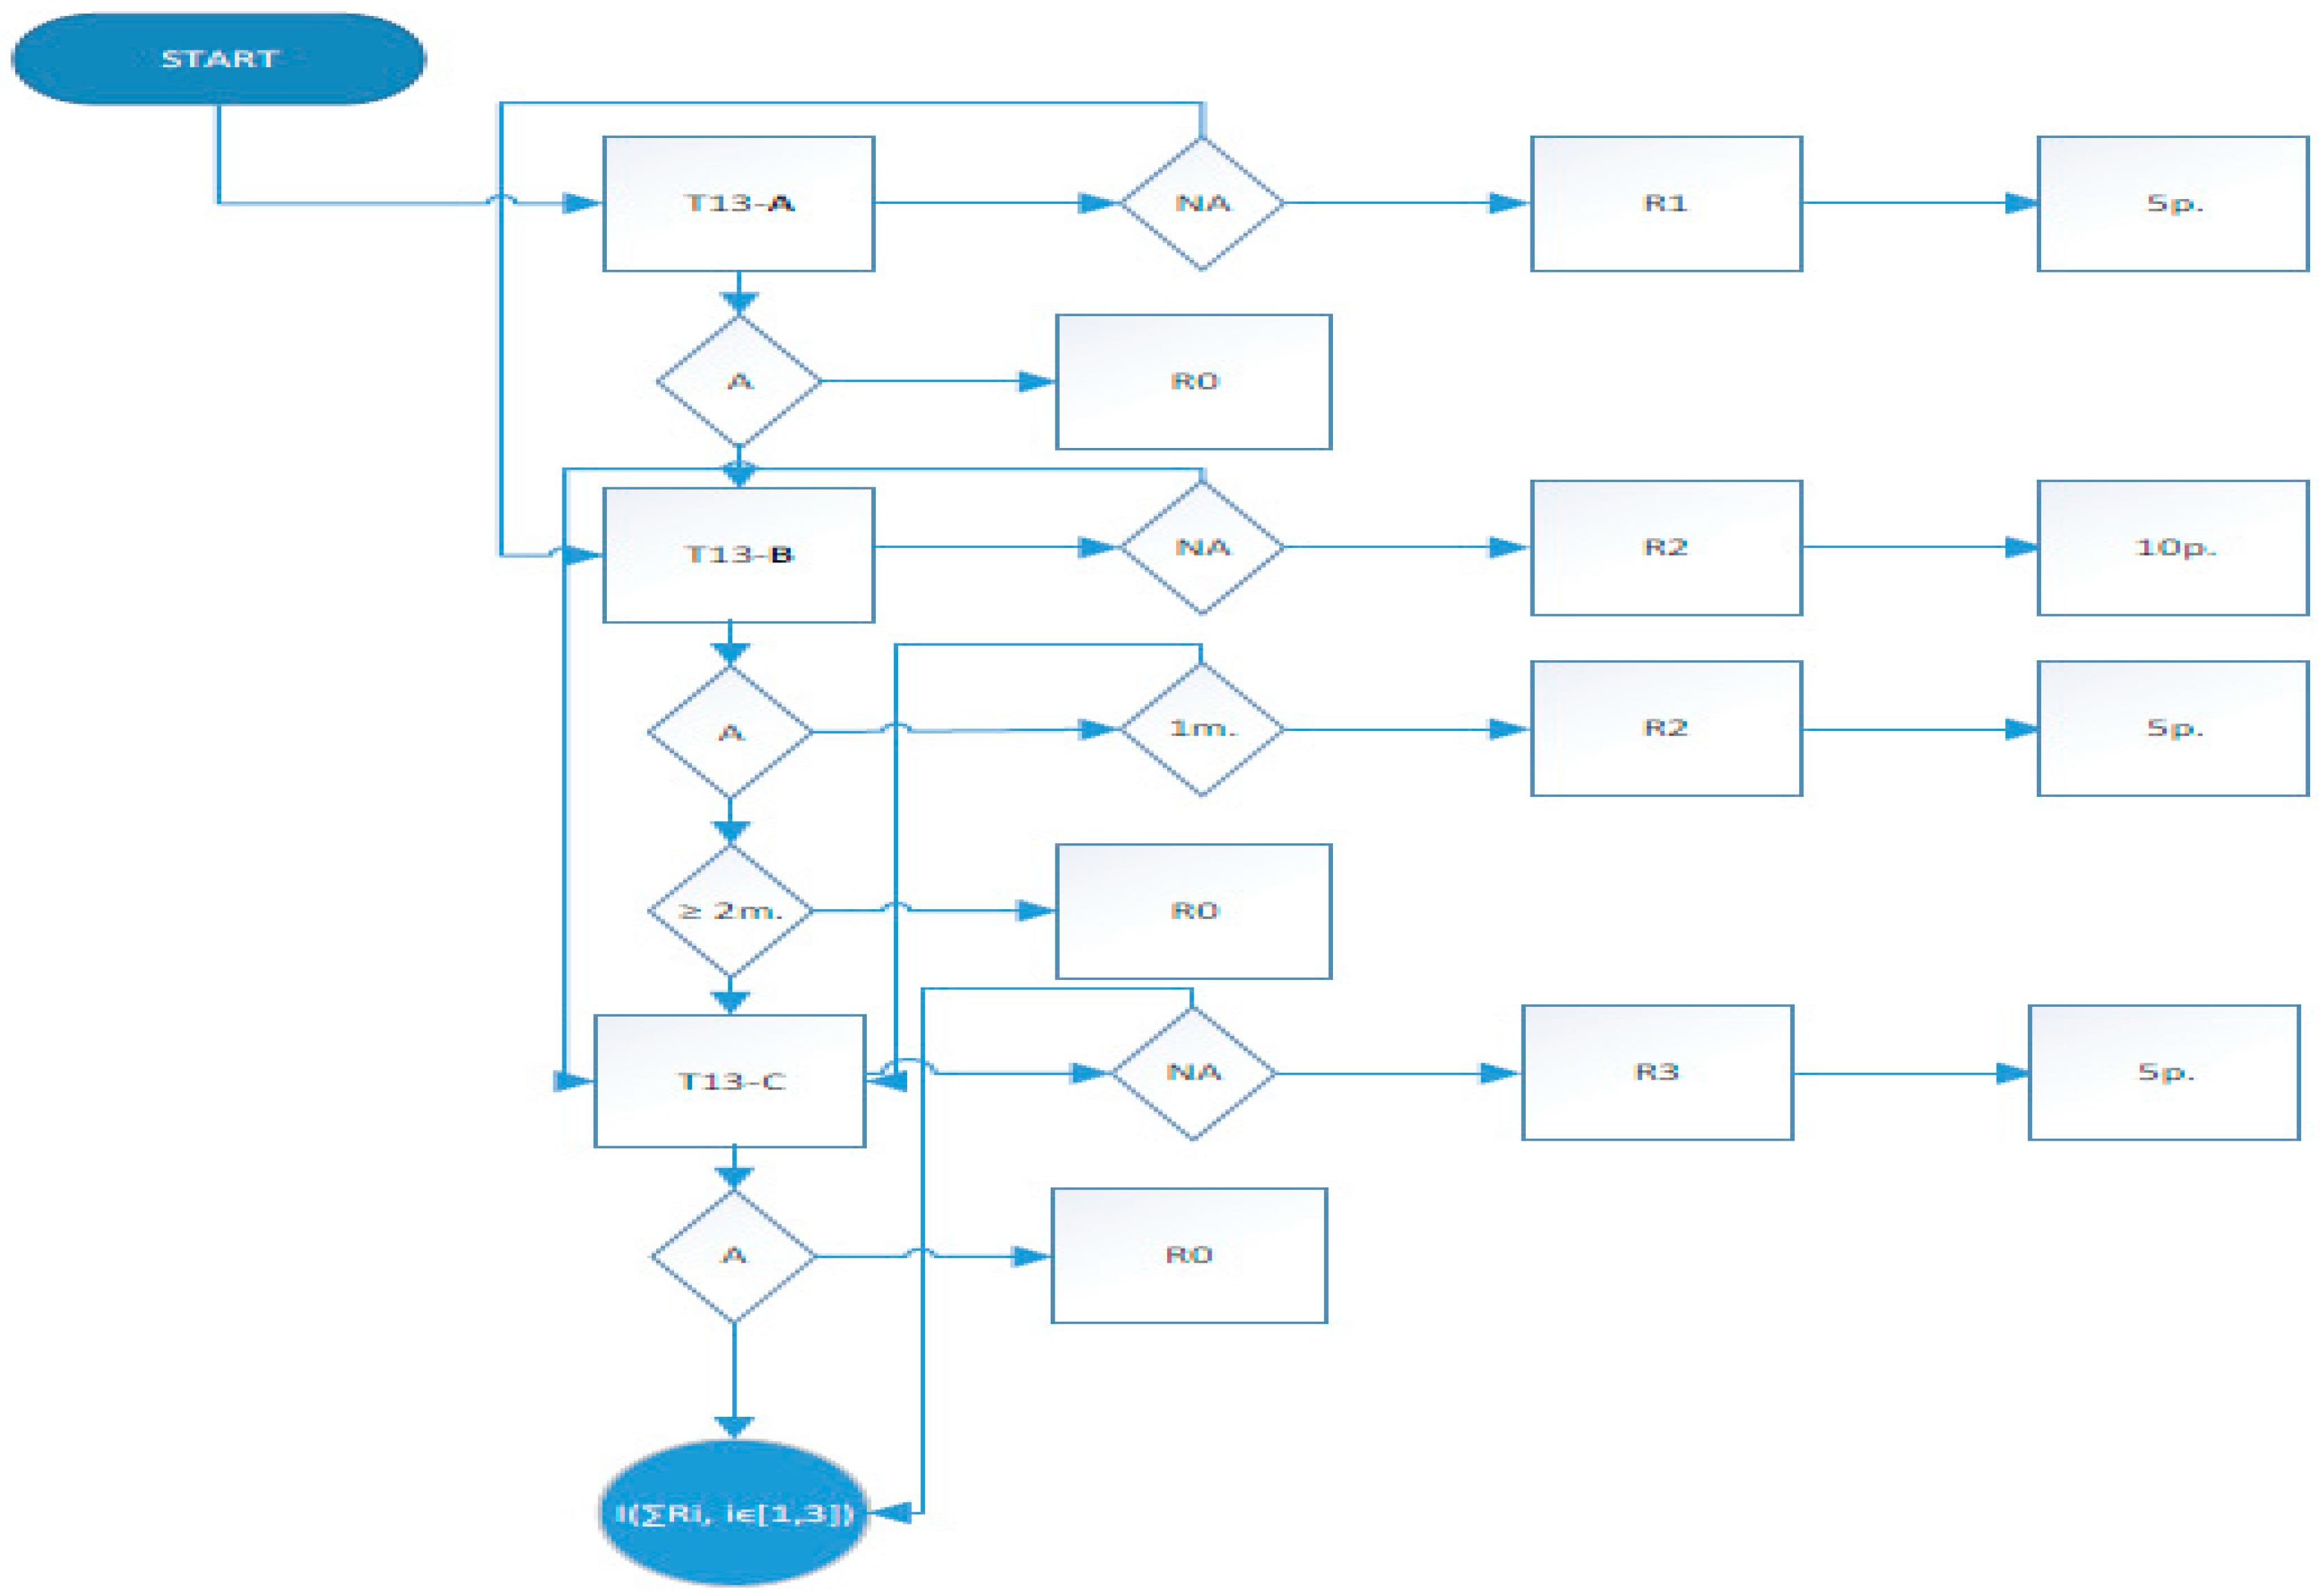
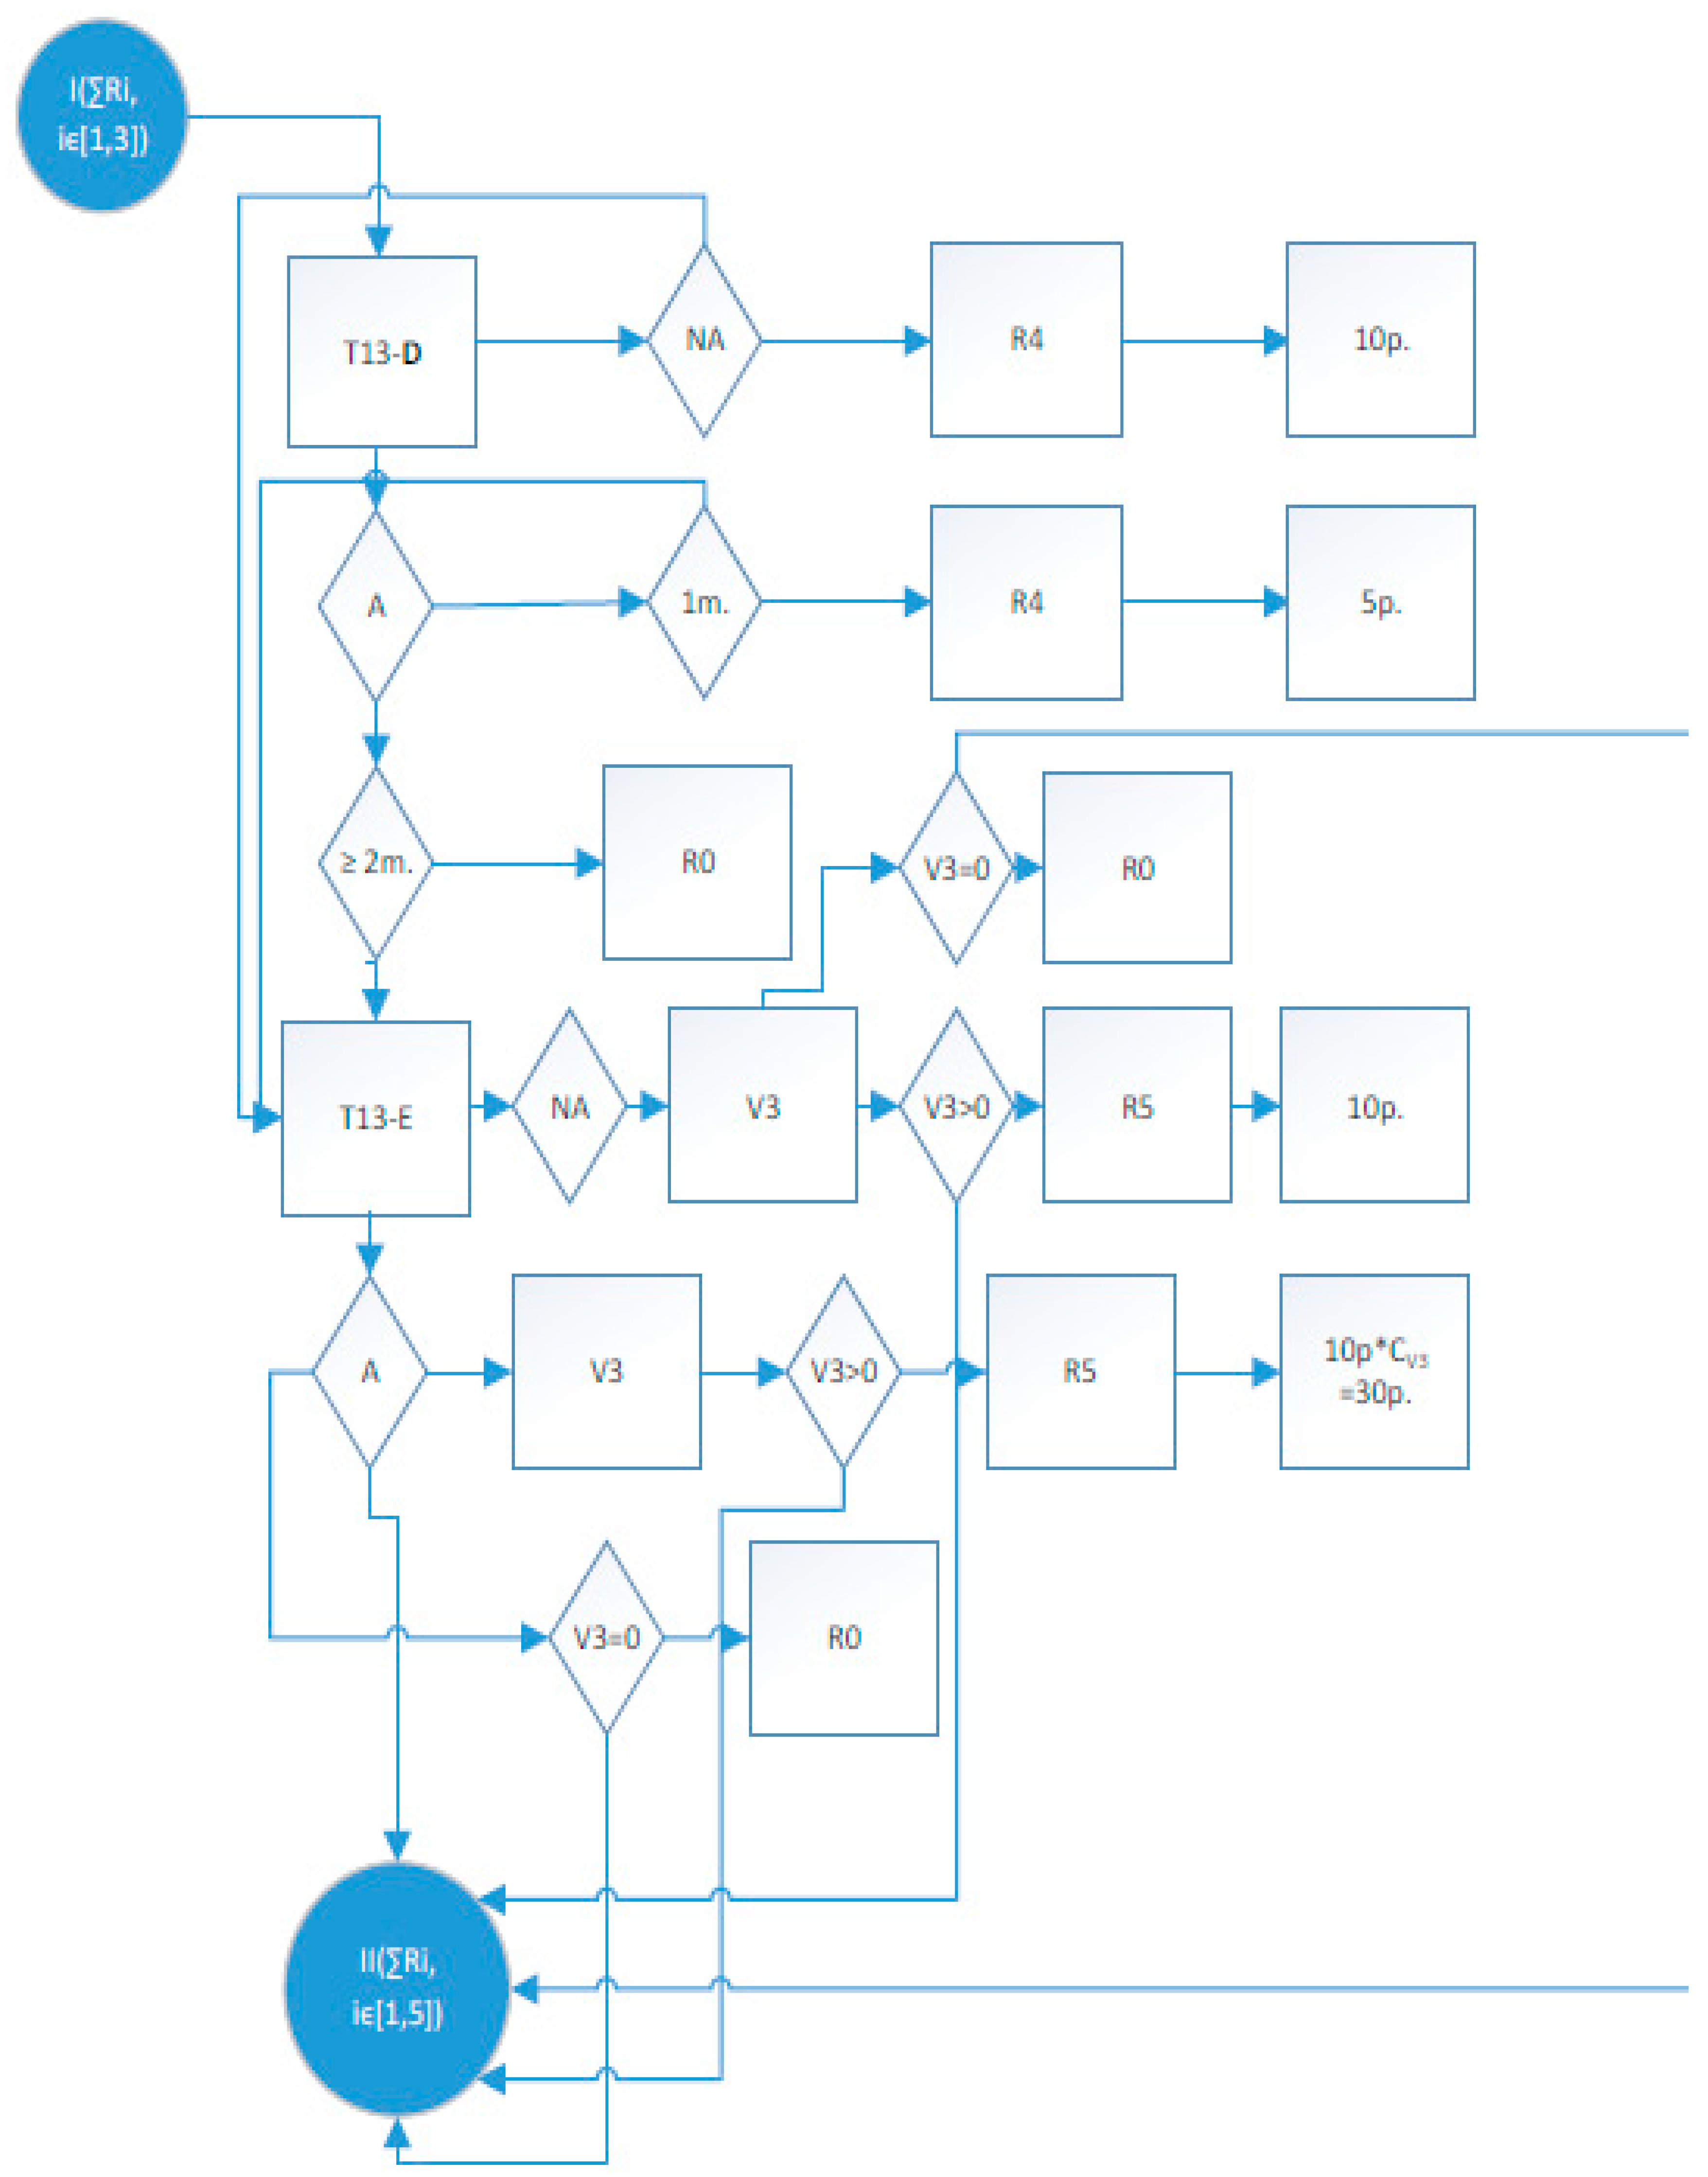
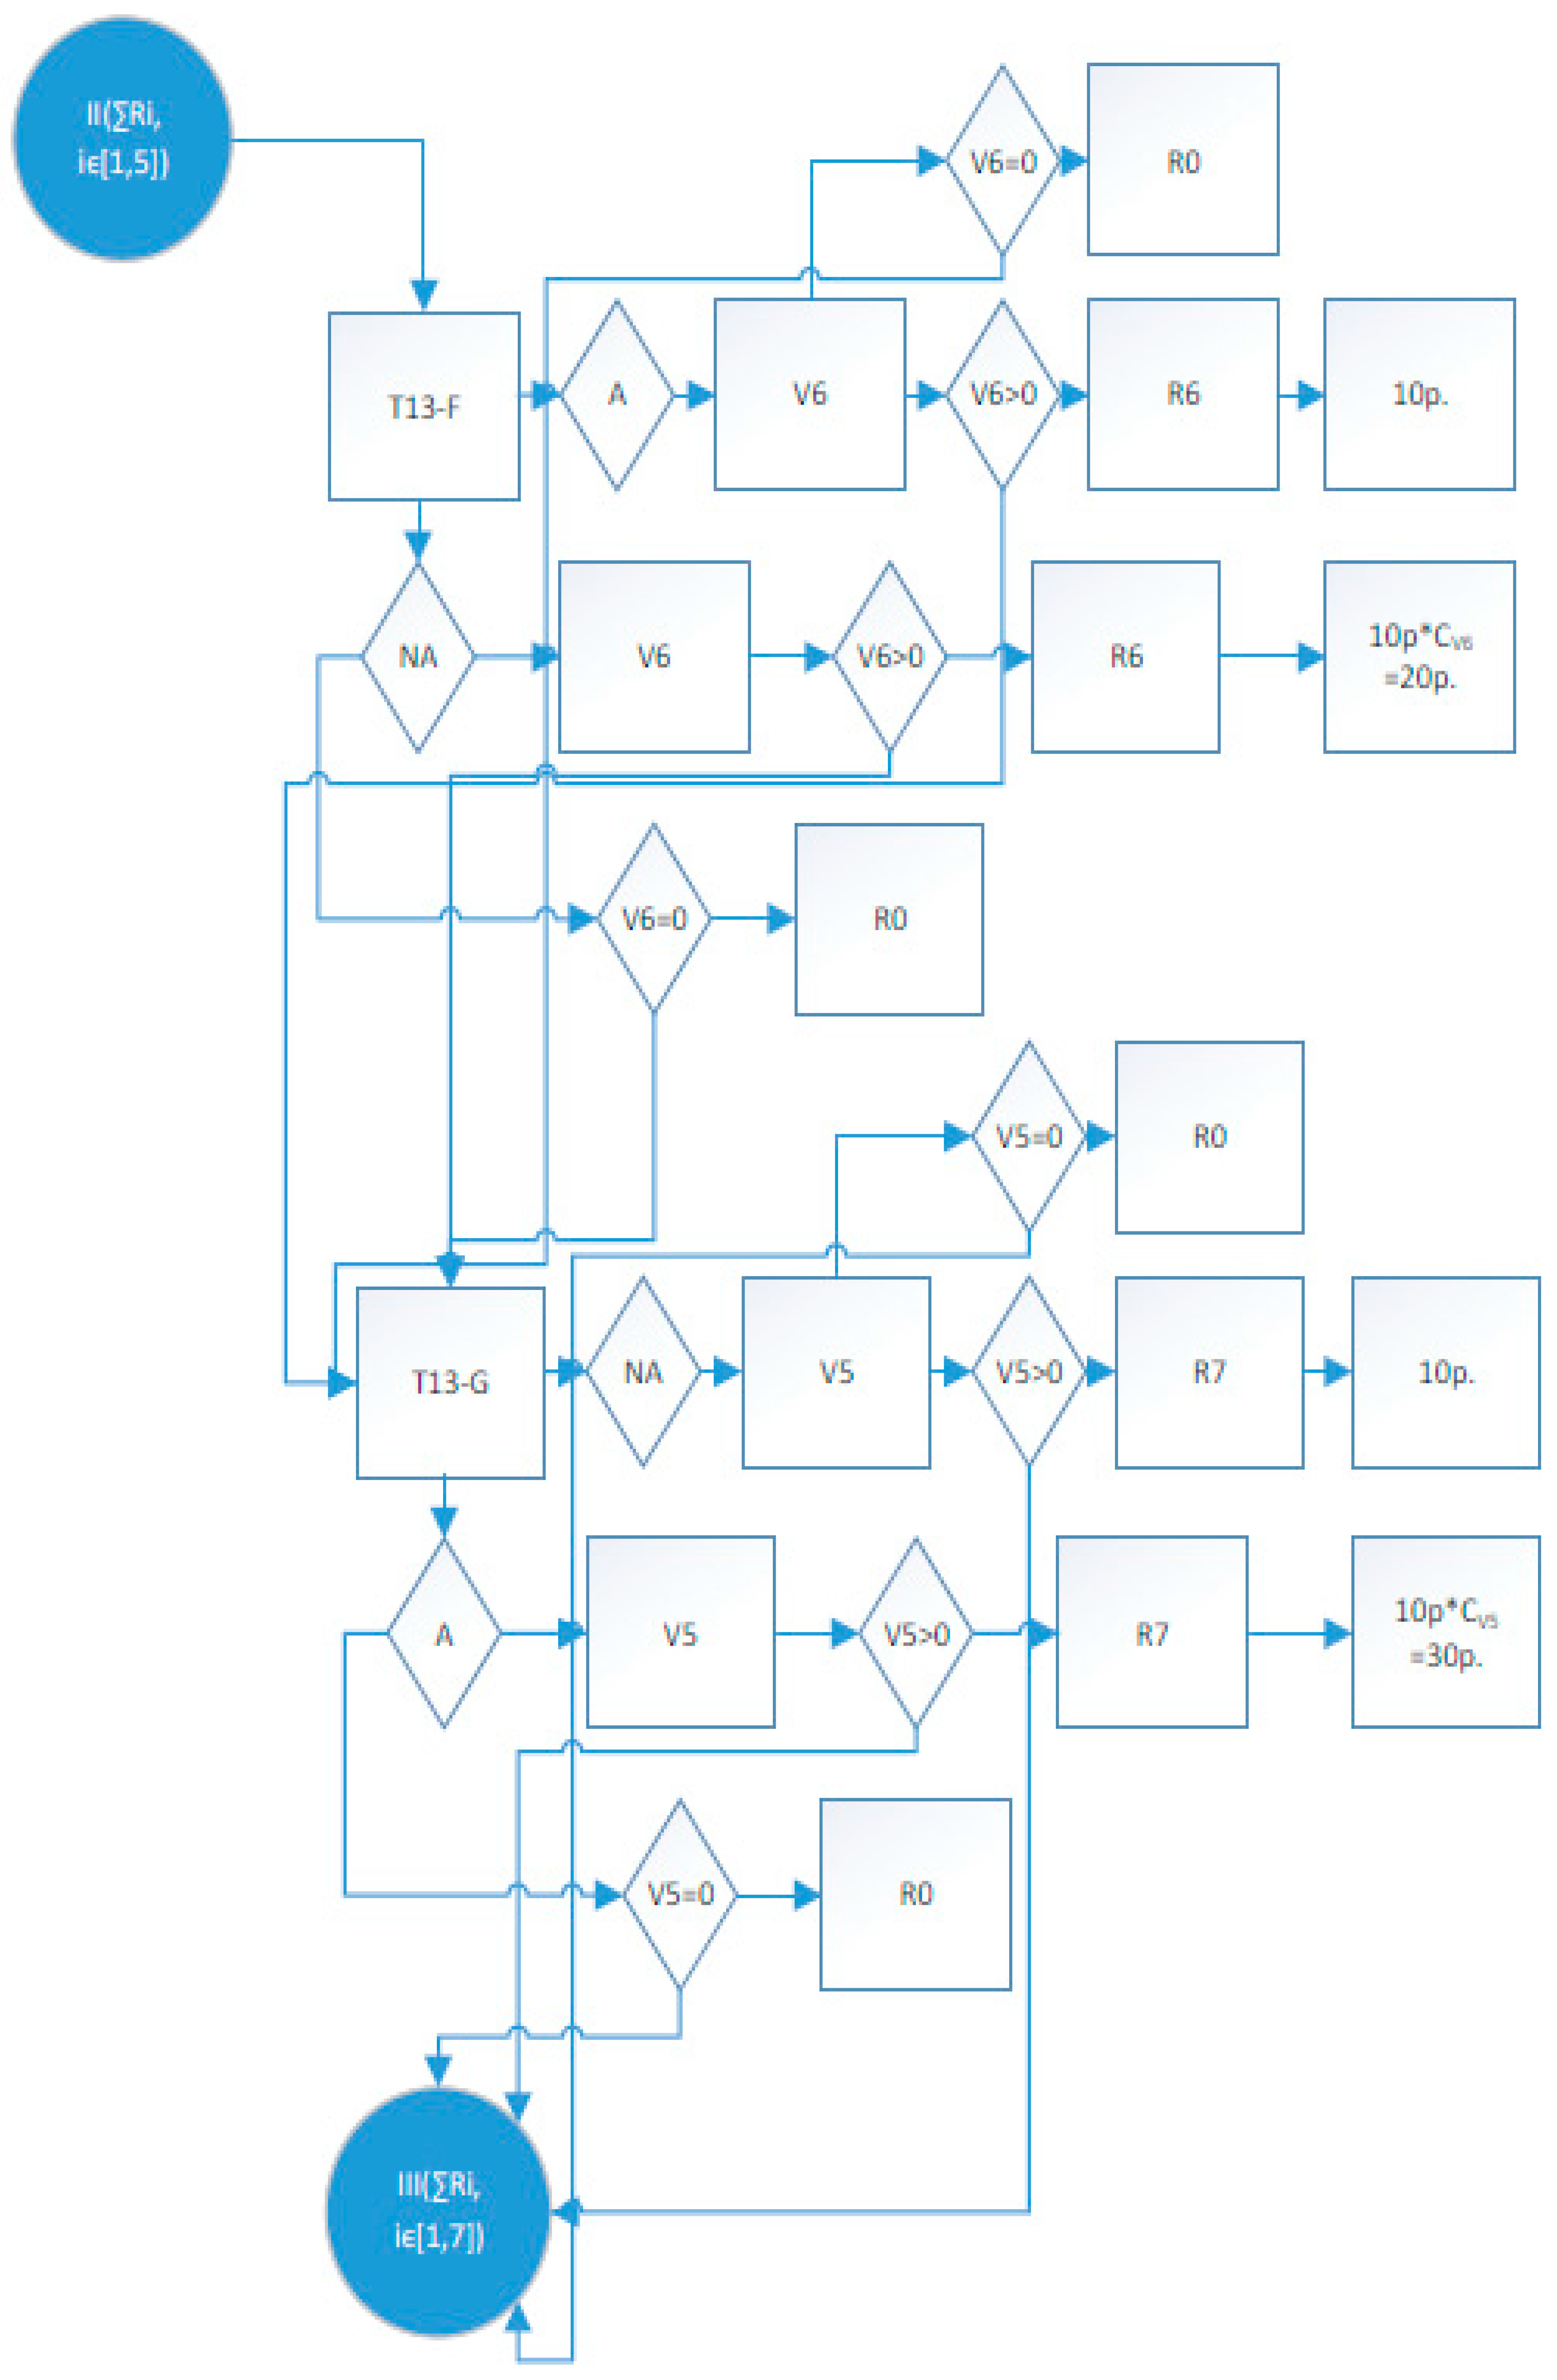
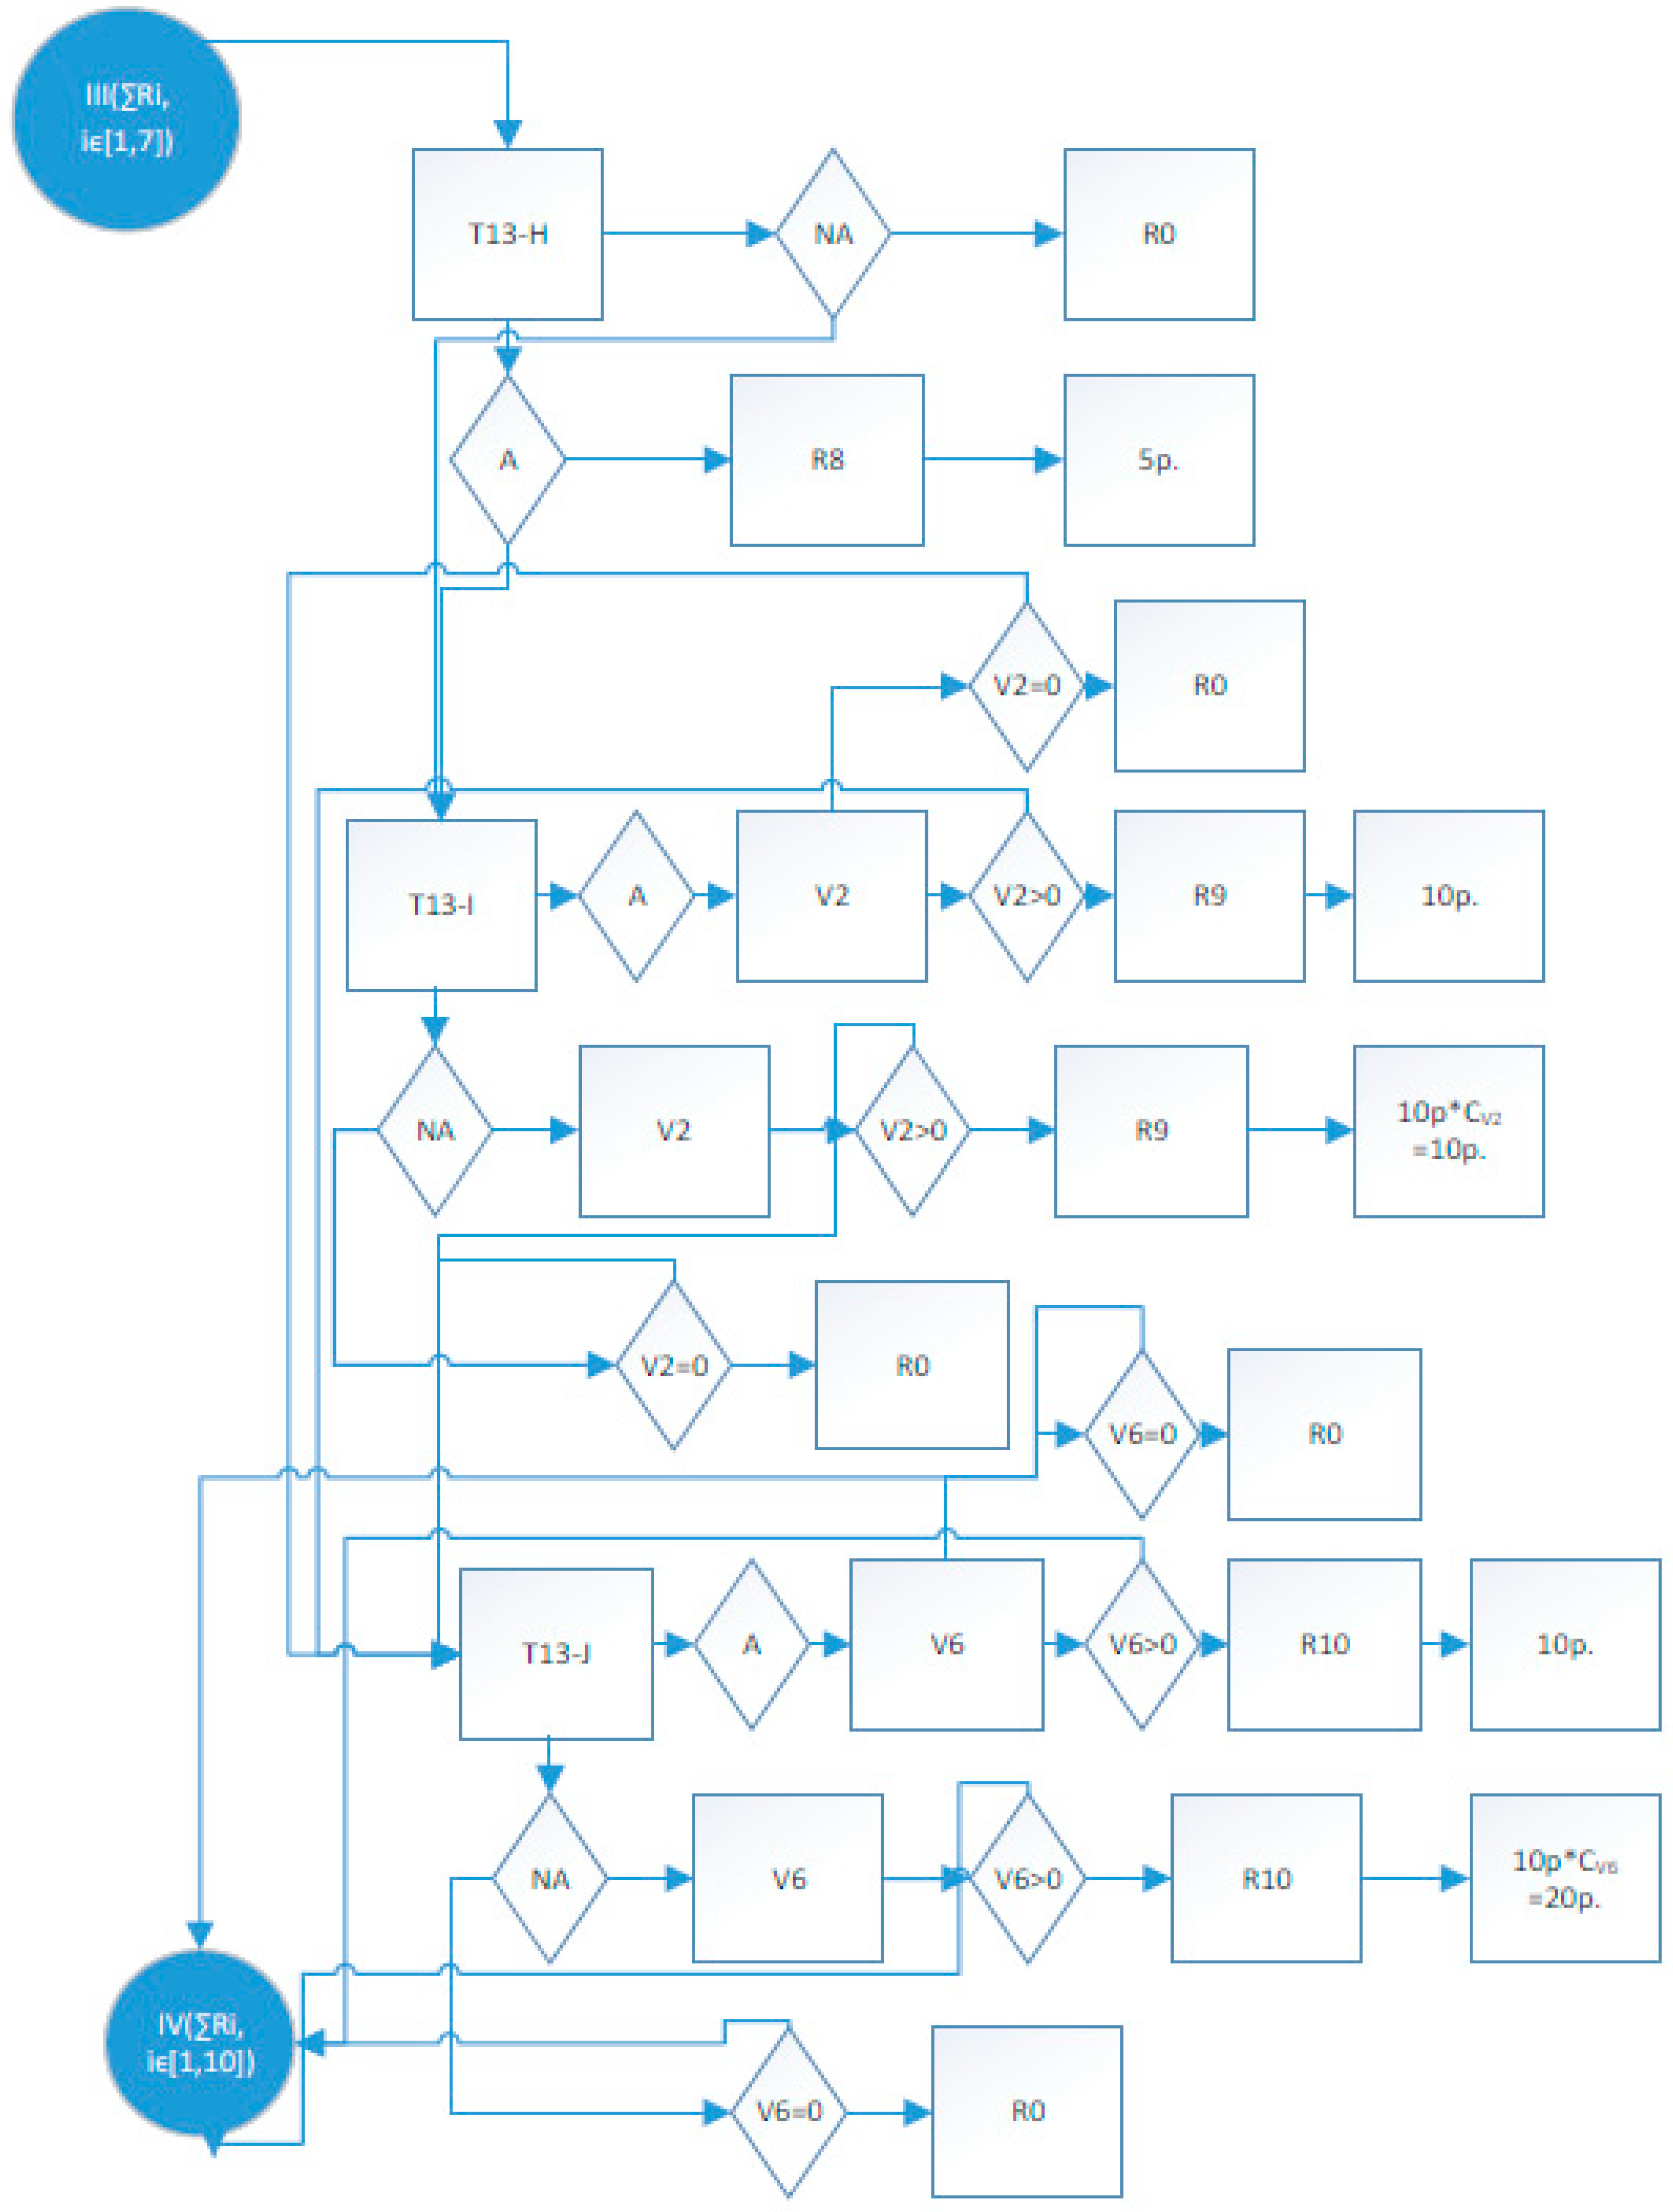
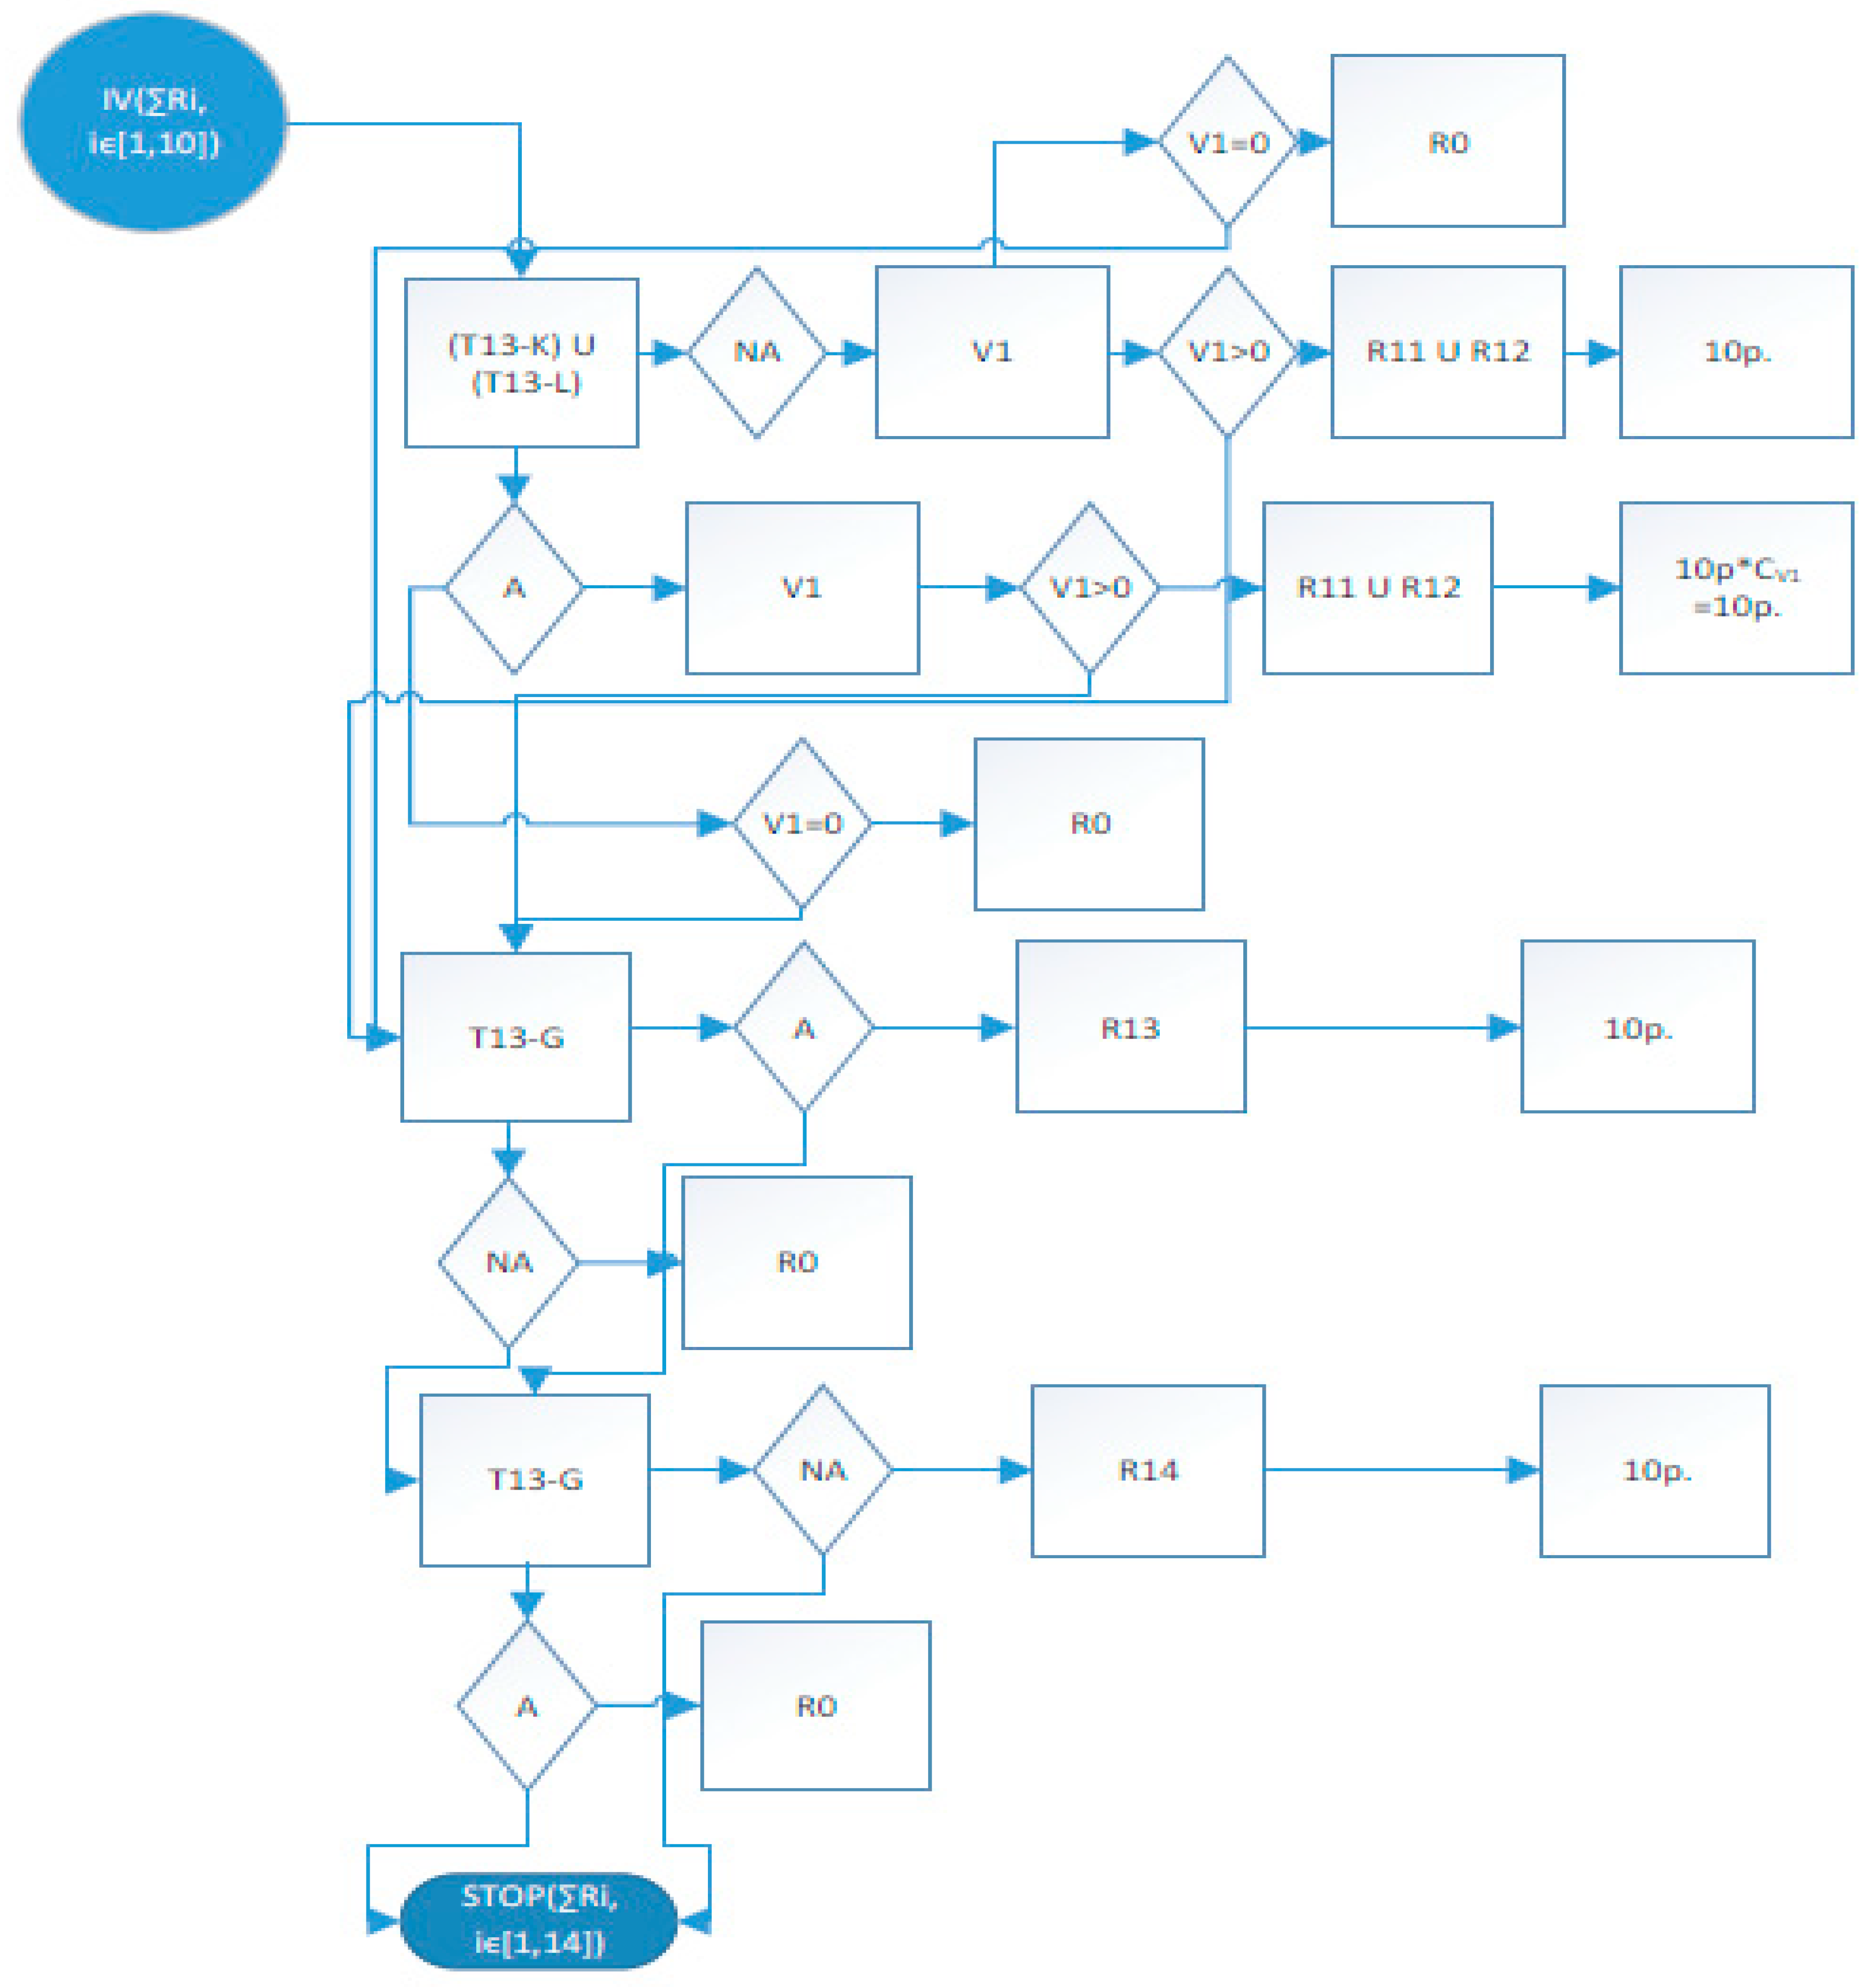
0, the risk level was quantified with a multiple of 5 points based on the risk level. The flowchart of risks, which could be transposed (depending on the authorities’ needs) on the software analysis, is presented step by step (Step 1—Figure A1, Step 2—Figure A2, Step 3—Figure A3, Step 4—Figure A4, Step 5—Figure A5). The steps presented in the diagrams Figure A1–A5 could be interpreted after quantifying each risk in a set of measures taken by the authorities, depending on the difference between the total level of risk and the minimum level of risk and a majority fixed on the basis of the legislative norms. These measures should lead to a high level of development of the sustainability of each entity included in the process.
The data interpretation was as follows:
- i     —indicator number- A     —allowed;
- R i     —risks;- N A —not allowed;
- R 0     —absence of the risk;- C V —coefficient of vulnerability;
- T13-A up to T13-N—indicators of nonfinancial reporting;
The sustainable reporting model of non-financial information devised by the authors should include at least the non-financial information presented from T13-A up to T13-N.
  • Your company has implemented an assimilation program of sustainable development principles comprised in the National Strategy of Sustainable Development (T13-A);
  • Have you taken measures within the company related to environmental protection? If yes, specify clearly these measures in the observations’ section (T13-B);
  • Do the organization and the functioning regulation comprise certain provisions regarding the ethical behavior of the employees within a group? (T13-C);
  • Are the measures of social cohesion promoted amongst the company’s employees? If yes, specify clearly these measures in the observations’ section (T13-D);
  • Have you taken measures to grow the company’s competitiveness? If yes, specify clearly these measures in the observations’ section (T13-E);
  • Has your company registered losses in the last three complete financial years? (T13-F);
  • Has your company registered profit in the last complete financial year? (T13-G);
  • From the point of view of the number of employees, do you fall into the category of microenterprises? If the answer is negative, please specify the category in the observations’ section (T13-H);
  • Do you think that the ratio between the current assets and the fixed assets held by the company is an improper one? (T13-I);
  • Does the period of payment of total liabilities exceed two full years? (T13-J);
  • Has the evolution of the turnover in the last 3 years been an upward one? If no, please specify in the observations’ section if the evolution was fluctuating or heading downwards (T13-K);
  • Is the ratio between the turnover and the shareholder’s capital improper? (T13-L);
  • Do you register debts for a due date more than 45 days to the state budget? (T13-M);
  • How do you appreciate the future evolution of the company? (T13-N).
The model of sustainable reporting of non-financial information could be implemented by the monitoring bodies of the sustainable development set up based on the implementation of the National Strategy for Sustainable Development. It could also be implemented in parallel with the implementation of a smart reporting model of assimilating the criteria of sustainable development, similar to the model of sustainable reporting previously presented.

4. The Empirical Analysis and the Results

By using GRETL version 2019d, an econometric model was developed based on the method of two-stage least squares (TSLS), a model that estimates the risk/vulnerability of the sustainable development based on the general coefficient of the vulnerability of the sector ( G C V s ). The general formula of the model was used as follows:
G C V s   = ( i = 1 n α i   I i   ) +
where:
  • G C V s —the dependent variable of the model;
  • α i —the regression coefficients;
  • I i   —the regressors of the model (i.e., the vulnerability indicators);
  • ε—the residual variable.
The value transposition of the general model on the basis of the TSLS method generated the following equation model:
^GCVs = + 0.0381*PFAC + 0.00388*LR − 0.00219*SGR + (4.06 × 10⁻⁵)*PUW
   (0.0145)   (0.000266)  (0.000610)  (7.20 × 10⁻⁶)
* n = 500, R-squared = 0.986; standard errors are given between parentheses
One could observe that the suggested model estimated for the forestry sector, as well as for the four specific fields of activity (n = 500), had both a high degree of statistical representation and a 98.6% homogeneousness of data that were well determined statistically and were representative for the studied phenomenon. Due to the restrictions of designing the model in a matrix format, only the indicators for which testing with p-value that had a high degree of statistical significance were introduced in the model: T patrimonial capitalization of fixed assets; T liquidity rate; the rate of sustainable growth and the productivity.
Statistical tests presented hereinafter indicated that, in the event of a null hypothesis, all the instruments were valid (i.e., the Sargan identification test), whereas the estimation based on the Pesaran–Taylor test for the heteroskedasticity showed the lack of heteroskedasticity. The R2 value indicated that the homogeneousness of the model was 98.58%, whereas the p-values of the selected regressors indicated the existence of highly significant statistical values.
Model TSLS using observations 1–500
Dependent variable: G C V s
Instrumented: PFAC LR SGR PUW
Instruments: PFAC_ LR_ SGR_ PUW_ RI_
CoefficientStd. Errorzp-value
PFAC0.03811620.01448842.63080.00852 ***
LR0.0038820.00026576714.6068<0.00001 ***
SGR−0.002186910.000609822−3.58610.00034 ***
PUW4.05704e-057.20011e-065.6347<0.00001 ***
Mean dependent variable0.462865S.D. dependent variable0.306318
Sum squared residue0.005327S.E. of regression0.072984
R-squared0.985808Adjusted R-squared0.943231
*** high statistical significance level
A high vulnerability is registered in the forestry sector of Romania in regard to sustainable development based on the National Strategy of Sustainable Development principles. These principles impose the implementation of a model of an intelligent reporting of assimilating the criteria of sustainable development. It is a model that was suggested by the present research. In terms of the fields of activity that are specific to the forestry sector, which was analyzed within the present research, we found the existence of a higher level of criteria manifesting in terms of sustainable development within the field of NACE code 0240 (GCV—general coefficient of vulnerability of the field −0.89) and NACE code 0210 (GCV—0.68). In terms of the NACE code 0220 and NACE code 0230, respectively, we observed a closeness to the risk zone regarding sustainable development, requiring a more careful observation of these sectors.

5. Discussion

This study developed an econometric model to report the sustainability of non-financial performance for the companies operating in the forestry field. To fulfill the purpose of the work, we calculated the main financial indicators specific to the four distinct forestry sector based on a sample of 248 Romanian active companies, in order to identify the risks and vulnerabilities and analyze the entities associated with this sector. If other specialty studies [13,14,15,16] analyze the relationship between CSR and CFP only from the point of view of quantitative financial indicators, our study starting from the calculation of the main financial indicators specific to the forestry sector developed a reporting model of the sustainability of the non-financial performance. This way, our study was able to estimate the risk/vulnerabilities of sustainable development through a general coefficient of the vulnerability of the sector. In order to calculate this coefficient, the authors considered six variables (patrimonial fixed asset capitalization, liquidity rate, rate of sustainable growth, profitability of using workforce, profitability rate, insolvency risk), revealing that one might establish the vulnerability of the sector or risk area in from the point of view of sustainable development.
Some authors have based their studies in the field of social analysis in terms of sustainability on the association with the company size, capital concentration, financial leverage, and profitability [8,83,84]. This reveals the strength of the company in terms of sustainability but at a limited financial level of directly measurable factors that cannot cover the whole range of risks and vulnerabilities that affect or can affect the development of a forestry and non-forest sector. In the research, we considered relevant the bilateral, quantitative analysis based on performance indicators and qualitative indicators. These were based on non-financial reporting with practical implementation and transformation in instruments that were used by authorities [85]. They possessed informational traceability that could be transposed into easy IT programs used by the decision-makers who analyze/evaluate the activity on the segment of sustainable development.
The steps presented in the Figure A1, Figure A2, Figure A3, Figure A4 and Figure A5 could be interpreted after quantifying the authorities’ every risk into a sets of measures depending on the gap between the total risk level and the minimum risk level and a major fixed based on legislation rules that should have the effect of the increasing sustainability development of each company as part of the process.
The formulated hypotheses were tested and demonstrated to be valid as follows:
  • The patrimonial capitalization of fixed assets at the level of estimated indicator generated a positive proper vulnerability on the sector and the fields of activity except for the NACE code 230 field whose performance was within the criteria of sustainable development. Its value of the coefficient of vulnerability was positive and inaccurate. The vulnerability impact coefficient for this indicator was selected at the reference value 1—reduced impact.
  • The liquidity rate of entities that do business in the forestry segment, in terms of the estimated indicator, generated a positive proper vulnerability in the sector and fields of activity except for the NACE code 240 field whose performance remained in the criteria of sustainable development. The value of the coefficient of vulnerability was positive and inaccurate. The impact vulnerability coefficient for this indicator was selected at the reference value 1—reduced impact.
  • The rate of sustainable growth for the estimated indicator generated a positive proper vulnerability at the level of sector and all the fields of activity. They were partially within the criteria of sustainable development. The impact vulnerability coefficient for this indicator was selected at the reference value 3—major impact.
  • The profitability of using the workforce at the level of the estimated indicator generated a positive proper vulnerability at the level of sector and field of activity. It had the NACE code 240. At the level of the field of activity NACE code 210, a value of the coefficient of vulnerability that was positive and improperly assimilated to the performance of sustainable development was found. At the level of the fields of activity with NACE code 220 and 230, the value of the coefficient of vulnerability was negative. These sectors registered major risks regarding sustainable development. The impact vulnerability coefficient for this indicator was selected at the reference value 2—medium impact.
  • The profitability rate had a negative value from the point of view of the indicator of sustainable development at the sectorial level and on fields of activity except NACE 210 and 230. This aspect indicated the existence of certain risks within the sustainable development that is assimilated into the management’s malfunctions. The value of the statistical optimum was exceeded only in the NACE 210 field, as the NACE 230 value of the indicator of vulnerability was null. This placed the field in the risk zone, too. From the point of view of the profitability rate, none of the fields of activity met the criteria of sustainable development. The impact vulnerability coefficient for this indicator was selected at the reference value 3—major impact.
  • The insolvency risk on the sectoral level was, on average, to be reduced since the value of the vulnerability coefficient was inaccurate by not corresponding to the statistical optimum. For the fields with NACE code 220 and 240, the absence of the insolvency risk was observed since the indicator had normal values that satisfied the conditions of sustainable development. However, in the field NACE 210 and 230, major vulnerabilities were found in terms of the insolvency risk and even of the closeness to the high-risk zone for NACE 230. Its vulnerability coefficient tended towards 0. The vulnerability impact coefficient for this indicator was selected at the reference value 2—an average impact.
The risk picture that resulted based on these indicators was statistically tested and demonstrated to be valid by the research itself.
The reliability of the sustainable reporting model resulted from the easiness of using it by the managers and from its capacity of being confirmed through the estimation by the financial information reported within a relevant of minimum 10 years.
The results of this study revealed the fact that, as far as the forestry sector is concerned, the companies that operate in the field of silviculture and other forestry activities and the field of support services to forestry registered superior results compared to the average in regards to the sector’s vulnerability. At the same time, those that operate in the field of logging and gathering of wild growing non-wood products focused mostly on those vulnerabilities regarding the risk zone of their sustainable development. The results of this study also had theoretical, as well as practical implications.
On a theoretical plan, the authors carried out an analysis of sustainability reporting as a mixture of CSR and sustainable development (see Table A1). The results of this study also had important implications for practice managers who, starting from the model proposed by us, could take concrete measures to mitigate the sector vulnerabilities and the risks inherent to their businesses. The study aimed to sound an alarm signal for them in the direction of awareness that only by implementing CSR policies integrated into the managerial process (adopting responsible social behavior), their business could become sustainable by improving the image and reputation of the entity [78] in relation with its clients and employees. In order to maximize shareholders’ long-term benefits, managers should consider CSR as a long-term strategy, and shareholders would fully understand its value [13]. Unfortunately, from the study, the authors observed that the managers of these entities were more concerned about obtaining positive financial results than with specific CSR activities. This fact arose from the fact that none of the entities taken into the study presents on its web page information related to mission, vision, principles, and values.
The results of the study could be useful also to the investors who were facilitated by the proposed model, identifying those sectors of activity in the forest field vulnerable from the perspective of the sector of activity and approaching the risk area regarding their sustainable development. As a result, their investment or divestment decisions would be well informed. We agreed with the opinion that the quality of information disclosure in CSR plays an essential role in socially responsible investments, shareholder value, community well-being, and financial stability [13]. Also, the state could influence through economic policies the sectors in which vulnerabilities are manifested. The findings of this study agreed with the contention of Hou [78], who posited that “in order to promote responsible and sustainable business practices, governments, businesses and society stakeholders need to be aware of the CSR strategies which best suit their welfare and the existing relationships between Government, business and society”. Therefore, we believed that national and international regulatory bodies should require economic operators in the forestry field to take urgent measures regarding their CSR policies. We supported this because the massive deforestation in the N-E region of Romania (the most forested area of the country) would lead in the coming years to adverse consequences for the entire ecosystem. The study tried to underline the fact that perhaps more than in other economic sectors, in the forestry sector, the obligation to implement CSR (CSR mandatory) policies is imposed even for small and medium-sized entities, an idea also supported by [21]. The suggested model might be implemented by the monitoring bodies of sustainable development as a result of the implementation of the National Strategy of Sustainable Development. It could also be implemented in parallel with the implementation of a model of intelligent reporting of the assimilation of criteria of sustainable development that is similar to the model of sustainable reporting.
Our study highlighted that it is more than necessary to integrate CSR activity at the level of small and medium-sized enterprises in Romania, belonging to the forestry sector, given the phenomenon of massive deforestation in our country, the lack of concern of these entities for reforestation with direct effects on the changes, climate, affecting the ozone layer, soil erosion, and increasing pollution level.

6. Conclusions

Throughout the study, the European and national (Romanian) context of the guidelines of the sustainable development of the forestry sector was identified and suggested to be followed until the end of 2030.
The identification of the approaches made in terms of the sustainable development allowed the design of the statistical evaluation method of those vulnerabilities and risks within the sustainable development of the forestry sector in Romania that are based on the analysis of the results that were reported by a number of 248 companies in Romania, which do business in four fields of the forestry sector during a 10 years’ (2008–2017) period. The results of the analysis concluded in identifying the vulnerability categories within the forestry sectors in Romania. They indicated the fact that those fields whose NACE code was 240 and 210 had superior results in comparison to the general average of the vulnerability of the sector. At the same time, those fields that were marked with the NACE code 220 and 230 mainly focused on the biggest vulnerabilities by taking into account the risk zone in terms of their sustainable development.
Thus, based on the results obtained, following our study, we could say that these types of entities would be conditioned as in the process of transition from a short-term strategy to a long-term strategy. This would ensure the sustainability of the business, resort to promoting and implementing a culture of social responsibility at the level of all internal functions (cross-cutting implementation), or periodically comparing its CSR activity with that of other competing companies. Therefore, we considered that employee involvement was fundamental for integrating CSR into all internal processes of entities.
The limitations of the study might refer in terms of its availability to implement the proposed reporting model by taking into account the specifics at the European level for every state member as well as the costs of implementing the system as such, which could otherwise be justified by the usefulness of quantifying the achievement of the sustainable development objectives at an microeconomic level within the European context. The study offered the possibility for further development of pragmatism in the context of deepening the analysis of new research directions. This fact has been enabled by the legislative changes or by the impulse of the conjectural factors within the European market. The authors proposed to extend the research on the entities operating in Ukraine, the neighboring country to the NE with Romania in order to conceptualize a standardized communication model of the reporting entities with the stakeholders, without incurring higher costs of reporting. This would contribute to their awareness of the negative effects caused by the clearing activities. Also, the authors proposed to develop qualitative research, taking into account the demands of the stakeholders to identify the determining factors that would lead to their support of CSR policies for entities operating in the forestry field.

Author Contributions

Conceptualization, M.S., C.-G.C., I.-D.A., and V.G.; methodology, M.S., C.-G.C., and V.G.; data curation, C.-G.C., S.M., and V.G.; writing—original draft preparation, M.S., M.-S.C., and S.M.; formal analysis, investigation, visualization, M.-S.C. supervision, validation, M.S., M.-S.C., and V.G. All authors have read and agreed to the published version of the manuscript.

Funding

This research received no external funding.

Acknowledgments

This work is supported by project POCU 125040, entitled “Development of the tertiary university education to support the economic growth —PROGRESSIO”, co-financed by the European Social Fund under the Human Capital Operational Program 2014–2020.

Conflicts of Interest

The authors declare no conflict of interest.

Appendix A

Table A1. The synthesis of the main impact studies on the researched field.
AuthorAimResults/ConclusionImpact
Li and Gao [86]This study explored the CSR activities of Chinese forestry companies listed on the Shanghai and Shenzhen stock exchanges and analyses how they differ from their international counterparts.“The results showed that Chinese forestry companies’ CSR contents, like their international counterparts, are diverse and include the environment, employees, communities, general social issues, consumers and products, investors and creditors, governments, and supply chains”.The average impact, due to the fact that the study refers only to listed entities and does not cover small and medium-sized entities.
Lu et al. [8]To investigate the asymmetric price transmission within the food supply chain (for the 2005–2016 period) and its components (i.e., cereals and bread; meat; milk, cheese and eggs; oils and fat) at the EU-28 level and EU country-specific level by using a multivariate panel vector error correction model (PVECM).The results indicated that the study also reveals that the two major firm characteristics, influencing levels of CSR disclosure by Chinese forestry enterprises in 2015, are the firm size and equity concentration.The average impact based on the fact that results cannot be generalized to a vast number of existing small-scale forestry enterprises in China.
Yin et al. [23]Based on the analysis of the connotation and realization mechanism of CSR, the paper pointed out that the coupling of forestry investment and social responsibility is embodied in the comprehensive benefit and social responsibility connotation of forestry investment, and the consistency between forestry investment and social responsibility investment.The results showed that the ecological and social benefits of forestry investment are far superior to economic benefits. It is proved that forestry investment is a feasible way for enterprises to fulfill their social responsibilities.Average impact, which is due to the fact that the recommendations and policies to be followed by the entities in the forestry sector but also by the governments of the countries.
Pätäria et al. [87]The key objective of this article was to examine the perceptions of students as future consumers concerning CSR and the future of the forest industry.Our findings indicated that nationality and study field are strongly associated with student CSR perceptions. In addition, students build their CSR perceptions on their personal values and their overall support for CSR. We additionally explored how respondents perceive the future of the forest industry. The results underlined the complex and context-dependent nature of sustainable forest use in a future bio-economy as an issue that cannot be managed at the corporate level but is dependent on perceptions, values, and levels of industry knowledge among stakeholders.High impact, based on the fact that this research has important managerial implications for the forest industry, particularly in the countries depending on forest resources.
Vartiak [88]The principal purpose of this paper was the identification of appropriate content of the CSR report, following the analysis and subsequent comparison of available CSR reports.The main finding was that in the Americas, Europe, and the Asia Pacific, the percentage of companies with CSR reports is almost equal. Also, there is no unified template for CSR reports.High impact due to the fact that the recommended content of the CSR report is interesting because it is a combination of ten highest-quality CSR reports.
Arminen et al. [24]To capture the multi-dimensionality of corporate responsibility (CR) and to empirically study the development paths of corporate social performance (CSP) among large US companies.Forest companies in the sample can be classified into four trajectories, all of which show consistent progress in the level of CSP between 1991 and 2009. That said, it appears that the forest industry is still ways off in achieving the third level in the hierarchy of CR strategies—namely, CR innovation.The research had a high impact due to the size of the sample taken in the study as well as through the analyzed period.
Lahtinen et al. [89]This study assessed “collaboration opportunities for developing common CR reporting for non-industrial private forest (NIPF) landowners and independent small and medium-sized sawmills (i.e., SME sawmills)”.“The NIPF landowners and sawmill managers share similar views on CR reporting to a large extent in that both groups mostly value the same economic and social indicators, while, at the same time, they have seen mostly the same environmental indicators as insignificant. Emphasis on the economic and social issues is a positive sign in the operations of the forestry—sawmilling businesses for promoting the social license to operate (SLO), while, for some environmental viewpoints, contradictions may exist”.Average impact, which is due to the fact that “further studies are required to deepen the understanding of the phenomenon of CR reporting in the context of SME businesses in forestry and sawmilling business, as well as in SMEs, more generally”.
Ševčík et al. [25]The paper proposed “indicators for sustainability reporting, which are not part of usual methodologies”.The main effect of the presented indicators can be seen that forest enterprises are more comparable in the public view. It is also possible to expect a deeper awareness of both investors and the general public of forest management and its societal benefits.The research had a high impact due to the “use of the proposed indicators also expands the scope for management decision-making in favor of all forest ecosystem services and with a higher effect in environmental and social aspects of management”.
Jindrichovska and Purcărea [22]The study analyzed the recent developments of environmental reporting in the Czech Republic and Romania and planned to introduce some basics of environmental reporting into compulsory reporting statements in the Czech Republic.Results indicated that the standard of CSR and environmental reporting is based on the same principles in both countries, but the particular approaches differ. Non-prescriptive approach to environmental reporting should be adopted in the Czech Republic, similarly to other developed countries.The average impact based on the fact that the study encourages greater openness to knowledge sharing about social and environmental reporting practices among Romanian and Czech companies, as well as providing insights into formulating government policy decisions to promoting social and environmental reporting.
Source: Authors’ compilation.

Appendix B. Risk Map

Figure A1. The risk flowchart—Step 1.
Sustainability 12 00603 g0a1
Figure A2. The risk flowchart—Step 2.
Sustainability 12 00603 g0a2
Figure A3. The risk flowchart—Step 3.
Sustainability 12 00603 g0a3
Figure A4. The risk flowchart—Step 4.
Sustainability 12 00603 g0a4
Figure A5. risk flowchart—Step 5.
Sustainability 12 00603 g0a5

References

  1. Garcia, A.S.; Mendes-Da-Silva, W.; Orsato, R.J. Sensitive Industries Produce Better ESG Performance: Evidence from Emerging Markets. J. Clean. Prod. 2017, 150, 135–147. [Google Scholar] [CrossRef]
  2. Colaço, R.; Simão, J. Disclosure of Corporate Social Responsibility in the Forestry Sector of the Congo Basin. For. Policy Econ. 2018, 92, 136–147. [Google Scholar] [CrossRef]
  3. Orlitzky, M.; Schmidt, F.L.; Rynes, S.L. Corporate Social and Financial Performance: A Meta-Analysis. Organ. Stud. 2003, 24, 403–441. [Google Scholar] [CrossRef]
  4. Ripoll-Bosch, R.; Díez-Unquera, B.; Ruiz, R.; Villalba, D.; Molina, E.; Joy, M.; Olaizola, A.; Bernués, A. An Integrated Sustainability Assessment of Mediterranean Sheep Farms with Different Degrees of Intensification. Agric. Syst. 2012, 105, 46–56. [Google Scholar] [CrossRef]
  5. Mato-Amboage, R.; Pitchford, J.W.; Touza, J. Public–Private Partnerships for Biosecurity: An Opportunity for Risk Sharing. J. Agric. Econ. 2019, 70, 771–788. [Google Scholar] [CrossRef]
  6. Burlaud, A.; Niculescu, M. Non Financial Information: A European Perspective. Audit Financ. 2015, 13, 102–112. [Google Scholar]
  7. Grosu, V.; Tanasă, S.-M.; Timofte, C. Raportarea Financiară Versus Raportarea Voluntară. O Analiză a Cadrului de Raportare în Ţările U.E.; Conferinţa Ştiinţifică Internaţională Studenţească—Provocările Contabilității în Viziunea Tinerilor Cercetători: Chișinău, Moldova, 2017. [Google Scholar]
  8. Hajdúchová, I.; Mikler, C.; Giertliová, B. Corporate Social Responsibility in Forestry. J. For. Sci. 2019, 65, 423–427. [Google Scholar] [CrossRef]
  9. Mensah, J. Sustainable Development: Meaning, History, Principles, Pillars, and Implications for Human Action: Literature Review. Cogent Soc. Sci. 2019, 5, 1653531. [Google Scholar] [CrossRef]
  10. National Institute of Statistics. 2019. Available online: http://www.insse.ro/cms/ro/tags/statistica-activitatilor-din-silvicultura (accessed on 23 September 2019).
  11. Guvernul României, Ministerul Apelor si Pădurilor. Strategia Forestieră Națională 2018–2027. 2019. Available online: http://www.mmediu.ro/app/webroot/uploads/files/2017-10-27_Strategia_forestiera_2017.pdf (accessed on 18 October 2019).
  12. Satellite Images: What Forest Area Romania Has Lost and the Counties Where It Was Cut the Most. 2019. Available online: https://pressone.ro/imagini-din-satelit-ce-suprafata-impadurita-a-pierdut-romania-si-judetele-unde-s-a-taiat-cel-mai-mult (accessed on 29 September 2019).
  13. Li, Z.; Minor, D.B.; Wang, J.; Yu, C. A Learning Curve of the Market: Chasing Alpha of Socially Responsible Firms. J. Econ. Dyn. Control 2019, 109, 103772. [Google Scholar] [CrossRef]
  14. Startseva, E.; Gurvitš, N.; Strouhal, J.; Pernica, K. Investigation of the Relationship between Corporate Social Responsibility and Performance Indicators of Companies. Econ. Manag. Innov. 2016, 8, 5–15. [Google Scholar]
  15. Galant, A.; Cadez, S. Corporate Social Responsibility and Financial Performance Relationship: A Review of Measurement Approaches. Econ. Res. Ekon. Istraživanja 2017, 30, 676–693. [Google Scholar] [CrossRef]
  16. Lin, W.L.; Law, S.H.; Ho, J.A.; Sambasivan, M. The Causality Direction of the Corporate Social Responsibility–Corporate Financial Performance Nexus: Application of Panel Vector Autoregression Approach. North Am. J. Econ. Financ. 2019, 48, 401–418. [Google Scholar] [CrossRef]
  17. Pizzi, S. The Relationship between Non-Financial Reporting, Environmental Strategies and Financial Performance. Empirical Evidence from Milano Stock Exchange. Adm. Sci. 2018, 8, 76. [Google Scholar] [CrossRef] [Green Version]
  18. Gordon, M.; Lockwood, M.; Hanson, D.; Vanclay, F.; Schirmer, J. Perceptions of Corporate Social Responsibility in Australian Forestry Companies. Int. J. Sustain. Soc. 2014, 6, 336–353. [Google Scholar] [CrossRef]
  19. Li, M. Study on Realization Mechanism of CSR in SME. In Proceedings of the 3rd International Conference on Economic Development and Education Management (ICEDEM), Dalian, China, 14–15 September 2019; Volume 7. [Google Scholar]
  20. Coluccia, D.; Fontana, S.; Solimene, S. Disclosure of Corporate Social Responsibility: A Comparison between Traditional and Digital Reporting. An Empirical Analysis on Italian Listed Companies. Int. J. Manag. Financ. Account. 2016, 8, 230–246. [Google Scholar] [CrossRef]
  21. Bhattacharyya, A.; Rahman, M.L. Mandatory CSR Expenditure and Firm Performance. J. Contemp. Account. Econ. 2019, 15, 100163. [Google Scholar] [CrossRef]
  22. Jindrichovska, I.; Purcarea, I. CSR and Environmental Reporting in the Czech Republic and Romania: Country Comparison of Rules and Practices. Account. Manag. Inf. Syst. 2011, 10, 202. [Google Scholar]
  23. Yin, J.; Wang, J.; Min, L. The Mechanism of Corporate Social Responsibility Fulfillment to Promote Forest Investment. Am. J. Ind. Bus. Manag. 2017, 7, 270. [Google Scholar] [CrossRef] [Green Version]
  24. Arminen, H.; Tuppura, A.; Toppinen, A.; Kozak, R. Corporate Responsibility Development Paths in the US Forest Sector. For. Int. J. For. Res. 2016, 89, 500–511. [Google Scholar] [CrossRef] [Green Version]
  25. Ševčík, M.; Hájek, M.; Mikulková, A. Specifics in the Introduction of Sustainability Reporting by Companies in the Forestry Sector. J. For. Sci. 2014, 60, 226–235. [Google Scholar] [CrossRef] [Green Version]
  26. Cheung, A. Corporate Social Responsibility and Corporate Cash Holdings. J. Corp. Finance 2016, 37, 412–430. [Google Scholar] [CrossRef] [Green Version]
  27. Mohd Ghazali, N.A. Ownership Structure and Corporate Social Responsibility Disclosure: Some Malaysian Evidence. Corp. Gov. Int. J. Bus. Soc. 2007, 7, 251–266. [Google Scholar] [CrossRef]
  28. Rouf, D. The Corporate Social Responsibility Disclosure: A Study of Listed Companies in Bangladesh. Bus. Econ. Res. J. 2011, 2, 19–32. [Google Scholar]
  29. Sufian, M.A.; Zahan, M. Ownership Structure and Corporate Social Responsibility Disclosure in Bangladesh. Int. J. Econ. Financ. Issues 2013, 3, 901–909. [Google Scholar]
  30. Pinkston, T.S.; Carroll, A.B. A Retrospective Examination of CSR Orientations: Have They Changed? J. Bus. Ethics 1996, 15, 199–206. [Google Scholar] [CrossRef]
  31. Carroll, A.B. The Four Faces of Corporate Citizenship. Bus. Soc. Rev. 1998, 100, 1–7. [Google Scholar] [CrossRef]
  32. Carroll, A.B. Corporate Social Responsibility: Evolution of a Definitional Construct. Bus. Soc. 1999, 38, 268–295. [Google Scholar] [CrossRef]
  33. Carroll, A.B. Ethical Challenges for Business in the New Millennium: Corporate Social Responsibility and Models of Management Morality. Bus. Ethics Q. 2000, 10, 33–42. [Google Scholar] [CrossRef]
  34. Schwartz, M.S.; Carroll, A.B. Integrating and Unifying Competing and Complementary Frameworks: The Search for a Common Core in the Business and Society Field. Bus. Soc. 2008, 47, 148–186. [Google Scholar] [CrossRef]
  35. Carroll, A.B. A History of Corporate Social Responsibility: Concepts and Practices. In The Oxford Handbook of Corporate Social Responsibility; En, A., Crane, A., McWilliams, D., Matten, J., Moon, D.S., Eds.; Oxford University Press Inc.: Oxford, NY, USA, 2008; pp. 19–46. [Google Scholar]
  36. Carroll, A.B.; Brown, J.A.; Buchholtz, A.K. Business & Society: Ethics, Sustainability, and Stakeholder Management, 10th ed.; Cengage Learning: Boston, MA, USA, 2018. [Google Scholar]
  37. Agudelo, M.A.L.; Jóhannsdóttir, L.; Davídsdóttir, B. A Literature Review of the History and Evolution of Corporate Social Responsibility. Int. J. Corp. Soc. Responsib. 2019, 4, 1. [Google Scholar] [CrossRef] [Green Version]
  38. Friedman, M. A Friedman Doctrine: The Social Responsibility of Business Is to Increase Its Profits. N. Y. Times Mag. 1970, 13, 32–33. [Google Scholar]
  39. Friedman, M.; Friedman, R.D. Capitalism and Freedom (40th Anniversary); University of Chicago Press: Chicago, IL, USA, 2002. [Google Scholar]
  40. Davis, K. Can Business Afford to Ignore Social Responsibilities? Calif. Manag. Rev. 1960, 2, 70–76. [Google Scholar] [CrossRef]
  41. Davis, K. The Case for and against Business Assumption of Social Responsibilities. Acad. Manag. J. 1973, 16, 312–322. [Google Scholar]
  42. Davis, K. Social Responsibility Is Inevitable. Calif. Manag. Rev. 1976, 19, 14–20. [Google Scholar] [CrossRef]
  43. Carroll, A.B. A Three-Dimensional Conceptual Model of Corporate Performance. Acad. Manag. Rev. 1979, 4, 497–505. [Google Scholar] [CrossRef] [Green Version]
  44. Meadows, D.H.; Meadows, D.L.; Randers, J.; Behrens, W.E.W. The Limits to Growth; Universe Books: New York, NY, USA, 1972. [Google Scholar]
  45. Drucker, P.F. The Essential Drucker: Selections from the Management Works of Peter; Drucker, F., Ed.; Perfect Bound: New York, NY, USA, 2001. [Google Scholar]
  46. Drucker, P.F. The Frontiers of Management (First Published in 1987); Routledge: London, UK, 2011. [Google Scholar]
  47. Carroll, A.B. Corporate Social Responsibility. Organ. Dyn. 2015, 44, 87–96. [Google Scholar] [CrossRef]
  48. Van Marrewijk, M.; Werre, M. Multiple Levels of Corporate Sustainability. J. Bus. Ethics 2003, 44, 107–119. [Google Scholar] [CrossRef]
  49. Van Marrewijk, M. Concepts and Definitions of CSR and Corporate Sustainability: Between Agency and Communion. J. Bus. Ethics 2003, 44, 95–105. [Google Scholar] [CrossRef]
  50. Werther, W.B., Jr.; Chandler, D. Strategic Corporate Social Responsibility as Global Brand Insurance. Bus. Horiz. 2005, 48, 317–324. [Google Scholar] [CrossRef]
  51. Werther, W.B., Jr.; Chandler, D. Strategic Corporate Social Responsibility: Stakeholders in a Global Environment, 2nd ed.; SAGE: Thousand Oaks, CA, USA, 2011. [Google Scholar]
  52. Burciu, A.; Kicsi, R. Knowledge as a Distinctive Resource of Competitive Advantage. Ecoforum J. 2015, 4. Available online: http://ecoforumjournal.ro/index.php/eco/article/view/214 (accessed on 23 October 2019).
  53. Iancu, E.; Burciu, A.; Kicsi, R. Innovative Economy and Knowledge Society Vectors. Ovidius Univ. Ann. Ser. Econ. Sci. 2014, 14, 187–193. [Google Scholar]
  54. Kramer, M. Strategy and Society: The Link between Competitive Advantage and Corporate Social Responsibility. Harv. Bus. Rev. Available online: https://pdfs.semanticscholar.org/77e9/9d84c1574c79cdbf15f1723637f7b24869c1.pdf (accessed on 23 October 2019).
  55. Kramer, M.R.; Porter, M. Creating Shared Value. Harv. Bus. Rev. 2011, 89, 62–77. [Google Scholar]
  56. Chandler, D. Strategic Corporate Social Responsibility: Sustainable Value Creation, 4th ed.; SAGE: Los Angeles, CA, USA, 2017. [Google Scholar]
  57. Girella, L.; Zambon, S.; Rossi, P. Reporting on Sustainable Development: A Comparison of Three Italian Small and Medium-sized Enterprises. Corp. Soc. Responsib. Environ. Manag. 2019, 26, 981–996. [Google Scholar] [CrossRef]
  58. Burciu, A.; Kicsi, R.; Condratov, I. Environmental Issues on the Trade-Related Agenda. Evidences from Romania. LUMEN Proc. 2018, 6, 156–165. [Google Scholar]
  59. Andreica, I.; Arion, F.; Muresan, I. SMEs’ Perception on Quality Standards in Romania. Bull. Univ. Agric. Sci. Vet. Med. Cluj Napoca. Hortic. 2010, 67, 273. [Google Scholar]
  60. Fassin, Y. SMEs and the Fallacy of Formalising CSR. Bus. Ethics Eur. Rev. 2008, 17, 364–378. [Google Scholar] [CrossRef]
  61. Murillo, D.; Lozano, J.M. SMEs and CSR: An Approach to CSR in Their Own Words. J. Bus. Ethics 2006, 67, 227–240. [Google Scholar] [CrossRef]
  62. Cassells, S.; Lewis, K. SMEs and Environmental Responsibility: Do Actions Reflect Attitudes? Corp. Soc. Responsib. Environ. Manag. 2011, 18, 186–199. [Google Scholar] [CrossRef]
  63. Baret, P.; Helfrich, V. The “Trilemma” of Non-Financial Reporting and Its Pitfalls. J. Manag. Gov. 2019, 23, 485–511. [Google Scholar] [CrossRef]
  64. Battisti, M.; Perry, M. Walking the Talk? Environmental Responsibility from the Perspective of Small-business Owners. Corp. Soc. Responsib. Environ. Manag. 2011, 18, 172–185. [Google Scholar] [CrossRef]
  65. Del Baldo, M. Corporate Social Responsibility and Corporate Governance in Italian SMEs: Towards a‘territorial’model Based on Small‘champions’ of CSR? Int. J. Sustain. Soc. 2010, 2, 215–247. [Google Scholar] [CrossRef]
  66. Matinaro, V.; Liu, Y.; Poesche, J. Extracting Key Factors for Sustainable Development of Enterprises: Case Study of SMEs in Taiwan. J. Clean. Prod. 2019, 209, 1152–1169. [Google Scholar] [CrossRef] [Green Version]
  67. Ionescu, R.; Zlati, M.; Antohi, V.; Stanciu, S. Reduced Inequalities as Factor of Sustainable Development: The Analysis Under Econometric Models. Sustainability 2018, 10, 3523. [Google Scholar] [CrossRef] [Green Version]
  68. Varian, H.R. Big Data: New Tricks for Econometrics. J. Econ. Perspect. 2014, 28, 3–28. [Google Scholar] [CrossRef] [Green Version]
  69. Einav, L.; Levin, J. Economics in the Age of Big Data. Science 2014, 346, 1243089. [Google Scholar] [CrossRef] [PubMed]
  70. Gabriel, M.; Lenain, P.; Mehrez, M.; Reynaud, J.; Soneja, P. Doing Well by Doing Good: The Role of Mexico’s Firms in Achieving Sustainable and Inclusive Growth; OECD Economics Department Working Papers No. 1383; OECD Publishing: Paris, France, 2017. [Google Scholar]
  71. Dumitrescu, D.; Simionescu, L. Empirical Research Regarding the Influence of Corporate Social Responsibility (CSR) Activities on Companies’ Employees and Financial Performance. Econ. Comput. Econ. Cybern. Stud. Res. 2015, 49, 52–66. Available online: http://www.ecocyb.ase.ro/nr20153/04%20-%20Dumitrescu%20Dalina.pdf (accessed on 28 December 2019).
  72. Roper, S.; Parker, C. Doing well by doing good: A quantitative investigation of the litter effect. J. Bus. Res. 2013, 66, 2262–2268. [Google Scholar] [CrossRef]
  73. Istrate, C.; Robu, I.B.; Pavaloaia, L.; Herghiligiu, I.V. Analysis of companies sustainability under the influence of environmental information disclosure. Environ. Eng. Manag. J. 2017, 16, 957–967. Available online: http://omicron.ch.tuiasi.ro/EEMJ/ (accessed on 28 December 2019).
  74. Voegtlin, C.; Greenwood, M. Corporate Social Responsibility and Human Resource Management: A Systematic Review and Conceptual Analysis. Hum. Resour. Manag. Rev. 2016, 26, 181–197. [Google Scholar] [CrossRef] [Green Version]
  75. Lee, J.; Graves, S.B.; Waddock, S. Doing Good Does Not Preclude Doing Well: Corporate Responsibility and Financial Performance. Soc. Responsib. J. 2017, 14, 764–781. Available online: https://www.researchgate.net/publication/321162861_Doing_Good_Does_Not_Preclude_Doing_Well_Corporate_Responsibility_and_Financial_Performance (accessed on 27 December 2019). [CrossRef]
  76. Gao, Y.Q.; Hafsi, T. Government Intervention, Peers Giving and Corporate Philanthropy: Evidence from Chinese Private SMEs. J. Bus. Ethics 2015, 132, 433–447. [Google Scholar] [CrossRef]
  77. Vitaliano, D.F. Corporate social responsibility and labor turnover. Corp. Gov. Int. J. Bus. Soc. 2010, 10, 563–573. [Google Scholar] [CrossRef]
  78. Hou, T.C. The Relationship between Corporate Social Responsibility and Sustainable Financial Performance: Firm-level Evidence from Taiwan. Corp. Soc. Responsib. Environ. Manag. 2019, 26, 19–28. [Google Scholar] [CrossRef] [Green Version]
  79. Bhardwaj, P.; Chatterjee, P.; Demir, K.D.; Turut, O. When and How Is Corporate Social Responsibility Profitable? J. Bus. Res. 2018, 84, 206–219. [Google Scholar] [CrossRef] [Green Version]
  80. Dam, L.; Scholtens, B. Ownership Concentration and CSR Policy of European Multinational Enterprises. J. Bus. Ethics 2013, 118, 117–126. [Google Scholar] [CrossRef]
  81. Yang, S.; He, F.; Zhu, Q.; Li, S. How Does Corporate Social Responsibility Change Capital Structure? Asia-Pac. J. Account. Econ. 2018, 25, 352–387. [Google Scholar] [CrossRef]
  82. Iwamoto, H.; Suzuki, H. An Empirical Study on the Relationship of Corporate Financial Performance and Human Capital Concerning Corporate Social Responsibility: Applying SEM and Bayesian SEM. Cogent Bus. Manag. 2019, 6, 1656443. [Google Scholar] [CrossRef]
  83. Chun, R. Corporate Reputation: Meaning and Measurement. Int. J. Manag. Rev. 2005, 7, 91–109. [Google Scholar] [CrossRef]
  84. Stanciu, S.; Zlati, M.L.; Antohi, V.M.; Bichescu, C.I. The Development Analysis of the Romanian Traditional Product Market Based on the Performance Model for Sustainable Economic Development. Sustainability 2019, 11, 1123. [Google Scholar] [CrossRef] [Green Version]
  85. Szabó, D.G.; Sørensen, K.E. New EU Directive on the Disclosure of Non-Financial Information (CSR). Nord. Nordic & European Company Law Working Paper No. 15-01; 2015; Available online: https://ssrn.com/abstract=2606557 (accessed on 12 December 2019).
  86. Li, Y.; Gao, L. Corporate Social Responsibility of Forestry Companies in China: An Analysis of Contents, Levels, Strategies, and Determinants. Sustainability 2019, 11, 4379. [Google Scholar] [CrossRef] [Green Version]
  87. Pätäri, S.; Arminen, H.; Albareda, L.; Puumalainen, K.; Toppinen, A. Student Values and Perceptions of Corporate Social Responsibility in the Forest Industry on the Road to a Bioeconomy. For. Policy Econ. 2017, 85, 201–215. [Google Scholar] [CrossRef]
  88. Vartiak, L. CSR Reporting of Companies on a Global Scale. Procedia Econ. Financ. 2016, 39, 176–183. [Google Scholar] [CrossRef] [Green Version]
  89. Lähtinen, K.; Toppinen, A.; Mikkilä, M.; Toivio, M.; Suur-Uski, O. Corporate Responsibility Reporting in Promoting Social License to Operate in Forestry and Sawmilling Industries. For. Int. J. For. Res. 2016, 89, 525–541. [Google Scholar] [CrossRef]
Figure 1. The key objectives of the Sustainable Development Strategy.
Sustainability 12 00603 g001
Figure 2. Geographical distribution of the forest fund (thousands of hectares); Source: The author’s estimation based on [10].
Sustainability 12 00603 g002
Figure 3. The co-occurrence of the keyword network (1994–2019); Source: Developed by the authors using the VOSviewer software.
Sustainability 12 00603 g003
Figure 4. The co-occurrence of the keyword network for the Romanian researches (1994–2019); Source: Developed by the authors using the VOSviewer software.
Sustainability 12 00603 g004
Figure 5. The four stages of the sustainable development assessment process; Source: Author’s elaboration.
Sustainability 12 00603 g005
Table 1. The sectorial estimation of the patrimonial fixed assets capitalization indicator (PFAC).
IndicatorPFAC
General Average PFACNACE 0210NACE 0220NACE 0230NACE 0240
The average of the sectorially segmented indicator (ASSI)1.44−10.287.33−11.68−0.04
The sectorial dynamics of the indicator expressed on the basis of the average of the absolute evolution weights (SDAE)211.91%163.84%101.97%92.81%296.43%
The statistical optimum (STAT.OPT)1.441.441.441.441.44
The standard deviation from the statistical optimum (STDEV)05.862.956.560.74
Table 2. The sectorial estimation of the liquidity rate indicator.
IndicatorLiquidity Rate
General Average LRNACE 0210NACE 0220NACE 0230NACE 0240
ASSI41.5865.3619.0410.87294.45
SDAE140.80%405.84%91.40%123.15%182.27%
STAT.OPT41.58
STDEV011.8911.2715.35126.43
Table 3. The sectorial estimation of the sustainable growth rate indicator.
IndicatorSustainable Growth Rate
General Average SGR NACE 0210NACE 0220NACE 0230NACE 0240
ASSI52.30−5.75122.79−409.290.41
SDAE91.51%145.33%86.22%86.64%162.93%
STAT.OPT52.30
STDEV029.0335.24230.7925.94
Table 4. Sectorial estimation of the profitability of using the workforce.
IndicatorThe Profitability of Using Workforce
General Average PUWNACE 0210NACE 0220NACE 0230NACE 0240
ASSI6286.7619506.533319.80−7590.09−6228.68
SDAE208.54%117.14%158.68%138.15%2548.34%
STAT.OPT6286.76
STDEV06609.881483.486938.436257.72
Table 5. The sectorial estimation of the profitability rate indicator.
IndicatorProfitability Rate
General Average PRNACE 0210NACE 0220NACE 0230NACE 0240
ASSI−0.130.12−0.06−0.40−2.18
SDAE685.94%94.45%1271.59%22,161.20%19,368.34%
STAT.OPT0.15
STDEV0.140.020.110.271.16
Table 6. The sectorial estimation of the risk of insolvency indicator.
IndicatorRisk of Insolvency
General Average RINACE 0210NACE 0220NACE 0230NACE 0240
ASSI1.140.300.981.657.86
SDAE114.61%102.85%109.21%758.49%248.61%
STAT.OPT1.14
STDEV00.420.080.253.36
Table 7. The estimation of the vulnerabilities regarding sustainable development in the forestry sector.
IndicatorValue Achieved at the Moment n − i, i = (1, 9)Value Achieved at the Moment nDynamics
( n n 1 )
Statistical OptimumVulnerability CoefficientGeneral Coefficient of Vulnerability of the Sector **
H1. Patrimonial capitalization of the fixed assets1.391.89211.91%1.44+0.62(0.62×1 + 0.58×1 + 0.15×3 + 0.09×2 − 0.12×3 + 1.05 ×2)/12 = 0.29
H2. Liquidity rate42.4234.08140.80%41.58+0.58
H3. Rate of sustainable growth57.346.9791.51%52.3+0.15
H4. Profitability of using workforce6.853.091.189.84208.54%6.286.76+0.09
H5. Profitability rate−0.13−0.12685.94%0.15−0.12
H6. Insolvency risk1.111.37114.61%1.14+1.05
* The coefficient of vulnerability = (Average value in the year of the indicator/Statistical optimum)/Sectorial dynamics of the indicator based on the average of the absolute evolution weights. The negative values of the indicator show the relative risk to business management in the field of sustainable development. The positive proper values indicate a sectorial vulnerability regarding the sustainable development, whereas the positive improper values confirm the sustainable development in the studied field of activity; ** The general coefficient of the vulnerability of the sector G C V s =   j = 1 n C j V j j = 1 n C j   , where:
  • G C V s —The general coefficient of the vulnerability of the sector;
  • Vj—The vulnerability coefficient estimated for every indicator, j = 1 , 6 ¯ ;
  • Cj—The j impact coefficient for the overall sustainable development, j = 1 , 6 ¯ , is, thus, allocated as follows:
  • H1—1        H3—3      H5—3
  • H2—1        H4—2      H6—2
The interpretation of the collected data should be analyzed in correlation with the vulnerability as follows:
V1
The patrimonial capitalization of fixed assets— C V 1 = 1
V2
The liquidity rate— C V 2 = 1
V3
The rate of sustainable growth— C V 3 = 3
V4
The profitability of using the workforce— C V 4 = 2
V5
The profitability rate— C V 5 = 3
V6
The insolvency risk— C V 6 = 2.

