Article

Eco-Efficiency in Measuring the Sustainable Production of Agricultural Crops

1
Faculty of Economics and Social Sciences, Department of Law and Enterprise Management in Agribusiness, Poznan University of Life Sciences, 60-637 Poznan, Poland
2
Institute for Agricultural and Forest Environment, Polish Academy of Sciences, 60-809 Poznan, Poland
*
Author to whom correspondence should be addressed.
Sustainability 2020, 12(4), 1418; https://doi.org/10.3390/su12041418
Submission received: 24 January 2020 / Revised: 11 February 2020 / Accepted: 12 February 2020 / Published: 14 February 2020

Abstract

:
Agriculture is one of the main factors with a direct impact on the natural environment (soil, water and air). An increased interest in the environmental impact of agricultural production results is due to—among other factors—significant human interference in the natural circulation of nutrients, posing a potential threat to the balance of ecosystems. Under current conditions, it is necessary to develop comprehensive diagnostic methods to control production processes in a way that would reduce costs and environmental burden throughout the product’s life cycle. Only a holistic approach that integrates environmental and economic analysis meets the criteria of analysis complexity, which is one of the main goals of methodical analysis of sustainable development. The article presents the results of the integrated environmental and economic assessment of selected crops. Maize and rapeseed production were assessed using the life cycle assessment (LCA) and life cycle costing (LCC) methodologies. The analysis was carried out on farms representing plant- and animal-based farming types. The conclusion presented in the study was based on the data from a study group consisting of 69 private commercial farms located in two regions of Poland. The calculated carbon footprint of both of winter rape and grain maize production was found to be higher in animal farming types. Pig farming type presented the highest overall costs of these crops, based on the approach of the LCC. Inclusion of carbon sequestration to the assessment of greenhouse warming potential allowed for the reduction of the net global warming potential (GWP) impact associated with the production of the analyzed crops. In both crops, mineral fertilization was the main factor influencing both the total carbon footprint and the LCC.

1. Introduction

Agricultural and rural areas are an open system composed of three interdependent and intertwined subsystems: the social, economic and environmental subsystems. So far, their development has been based on models focusing on the economic function (making microeconomic decisions so as to maximize economic benefits). However, that approach became widely criticized because neither the environmental balance nor the social balance is addressed if the economic balance is attained at the maximum profit level. Moreover, agricultural economists argue that—in addition to positive production and economic effects—the intensification of agricultural production results in a series of adverse environmental impacts. Over the years, the preponderance of private economic rationality over general social rationality in farming has resulted in agricultural development to the detriment of the natural environment and its non-renewable resources [1,2,3,4].
The problems described above forced a series of amendments to the European Union’s Common Agricultural Policy (CAP). Meanwhile, a shift in approach to agricultural and rural functions resulted in establishing new development models for them. Sustainable agriculture (SD) and multifunctional agriculture are the most widely discussed and most promoted models [5,6,7,8,9].
The SD concept also has a noticeable impact on the operations and strategic objectives of today’s enterprises, which include gaining a competitive edge, reducing the costs, improving the efficiency and implementing environmentally-friendly management methods (while addressing specific social expectations and maintaining relationships with various stakeholder groups). Changes in the micro- and macroenvironment, escalating customer demands and the ever stronger environmental restrictions force enterprises to implement new methods for production and environmental management which may contribute to the abovementioned objectives. One of such objectives is the eco-efficiency concept, which takes account of economic and environmental aspects in the improvement of products, processes and technologies. The analysis of eco-efficiency is an instrument enabling the selection of best-quality, environmentally benign solutions [10].
Addressing sustainability aspects in production systems and products requires a wider perspective of product–environment interactions in all stages of the cycle. In research on product sustainability and eco-efficiency, life cycle assessment (LCA) and life cycle costing (LCC) are of interest. The choice of methods was justified by the fact that LCA and LCC were specially developed as analytical tools for identifying and assessing the potential impact of a given product’s production on various environmental aspects. The essence of the method of life cycle cost analysis is to identify and estimate all costs associated with the product life cycle. The possibility of conducting a life cycle assessment integrated with cost analysis contributes to increasing the eco-efficiency of enterprises, and thus reducing their negative impact on the environment, while reducing operating costs [11,12,13]. As a result of using environmental methods, the assessment of products and services includes a comprehensive analysis of the environmental impact. This analysis includes the entire product life cycle, from raw material extraction to waste management, i.e., “from cradle to grave” [14].
The previous studies have shown that the use of high doses of mineral substances and industrial materials (e.g., fertilizers and pesticides) increases productivity but at the same time can cause excessive emission of reactive compounds to the environment (as their spatial range is large). Greenhouse gas (GHG) emissions are an important part of the impact of crop production on the environment, referred to in the so-called “carbon footprint” (CF). This can also be estimated using the LCA method, which takes into account greenhouse gas emissions throughout the entire production chain [15,16,17].
In 2013 the EU adopted an action plan for the reduction of gaseous emissions in sectors not covered by the EU’s Emission Trading System that requires the limitation of GHG emissions from agriculture by 20% by 2030 [18]. This means that the control of GHG emissions should be regarded as an important supporting instrument for environmental management in agricultural production in order to mitigate the effects of climate change. In the context of the global increase in demand for food, efforts for emissions reduction should also take into account technological changes allowing for mobilization of the agricultural production potential.
The aim of this study was focused on the comparative analysis of grain maize and winter rape production in different farming types by applying the LCA and LCC methods [19,20]. The paper was expanded to the size of a research article from conference papers (posters) presented at the 49th International Academic Conference IISES, 27-30 August, 2019 Dubrovnik, Croatia [21] and 7th International Conference on Sustainable Development, 04-05 September, 2019 Rome, Italy [22].

2. Materials and Methods

The study was conducted in 2017–2018 in a group of farms located in Poland, in two voivodeships: Wielkopolskie and Lubelskie. In total, 69 farms were surveyed. The selection of the research group was determined by the types of production represented by the largest number of family farms in Poland. The following types of activity were carried out on farms selected for research (according to the EU classification): field crops, pig production, milk production, mixed livestock production (pig and milk). When choosing a study group (in accordance with established criteria), information and assistance from local agricultural advisory centers was used. The description of farming types is presented in detail in Table 1
The data collected on farms included information on the farm’s production resources and a description of the production technology of both crops (field size and characteristics, duration of individual technological operations). The input materials for plant production have also been carefully inventoried: pesticides, fertilizers, fuel/engine oil, electricity and agricultural machinery (type of machine, work time spent for the cultivation of a given crop, lifetime of machine, total machine weight).
The LCA and LCC analysis were carried out in similar phases corresponding to LCA standard, namely: goal and scope definition; environmental life cycle inventory (LCI); life cycle impact assessment (LCIA) and interpretation [19,20,21,23,24]. The procedure already tested in previous studies of authors was used. The following activities were carried out in individual phases [21,22]:
  • The purpose, system boundaries, assumptions, limitations and functional unit were determined.
  • The set of input and output data was analyzed: data on the quantity and quality of materials and energy consumed were collected, as well as data on production results and estimated emissions. In this phase the life cycle inventory was made. All inputs and emissions were compiled and converted to a common functional unit. These data formed the basis for the LCIA assessment.
  • The classification and characterization procedure was performed (after selecting the category and category indicators). An important step in this phase is the evaluation of the potential environmental impact of the various emissions and resource consumption. Based on the characterization factors for emissions quantified in the inventory, aggregation of the masses per functional unit into one figure of impact category indicator was carried out. The formula for calculating the indicators of different impact categories is given in the following equation:
    I c a t = i ( M i × C F c a t i )
    where Icat is the indicator result for the impact category, Mi is the mass of consumed or emitted substance i assigned to the given impact category during classification (kg i per functional unit) and CFcati is the characterization factor for the given substance i.
  • The results were interpreted and conclusions drawn in line with the previously set study objective.
The life cycle impact assessment (phase 3) was carried out according to the CML methodology [25] and Intergovernmental Panel on Climate Change (IPCC) report [26]. Several categories of impacts have been considered. The first was the ability to cause a greenhouse effect, the so-called global warming potential (GWP100), presented as the indicator value in CO2 equivalent (eq.) units—an indicator used to quantify the impact of a given substance on the greenhouse effect. In addition, the acidification potential (AP), as kg SO2 eq., was determined, which is a consequence of acids being emitted to the atmosphere and subsequently deposited in surface soils and waters. Eutrophication potential (EP), expressed in kg PO4−3 eq. (eutrophication is referred to the pollution state of aquatic ecosystems in which the overfertilization of water and soil has turned into an increased growth of biomass) was also calculated. Further indicators were also identified: the abiotic depletion potential (ADP), which refers to the depletion of nonliving (abiotic) resources such as fossil fuels and minerals (ADP mineral in kg antimony eq. and ADP fossil fuel presented in megajoules (MJ)), and the photochemical ozone creation potential (POCP) in kg ethylene eq., which is used to assess the impact of gas emissions on the concentration of ozone on the earth’s surface arising from the reaction of these gases in the presence of strong sunlight. In the final stage of the analysis, normalization of indicators calculated for the identified impact categories was undertaken. Annual per capita normalization values and units for six impact categories in Europe in the year 2000 were chosen [26]. Indicators for the relevant impact categories for Europe were chosen as references in this analysis. The standardization procedure unifies impact indicators by dividing them by their reference values to be able to compare relevant environmental effects. Normalized impacts were subsequently weighted by multiplying each characterized impact with the equally weighting factor of 0.167. After applying weighting, it is possible to compare and aggregate different impacts. This way, the transformed impact categories, now with the same units, were summed to form a single score of an aggregated environmental indicator. PRé Sustainability SimaPro version 8 (Amersfoort, the Netherlands) LCA modelling software with its default life cycle inventory (ecoinvent version 3) and life cycle impact models was used for the evaluation of potential environmental impacts and life cycle cost associated with the production of the analyzed crops.
The LCC analysis of winter rape and grain maize was carried out in similar phases corresponding to LCA standard. The following cost items were included in the analysis: direct, purchase costs for seeds, fertilizers and pesticides, maintenance and repair costs of machines and vehicles, labor costs and other costs including fuel costs, lubricants and service costs, expressed in Polish Złoty (PLN) per ha and referenced to the functional unit of 1 Mg of grain yield.
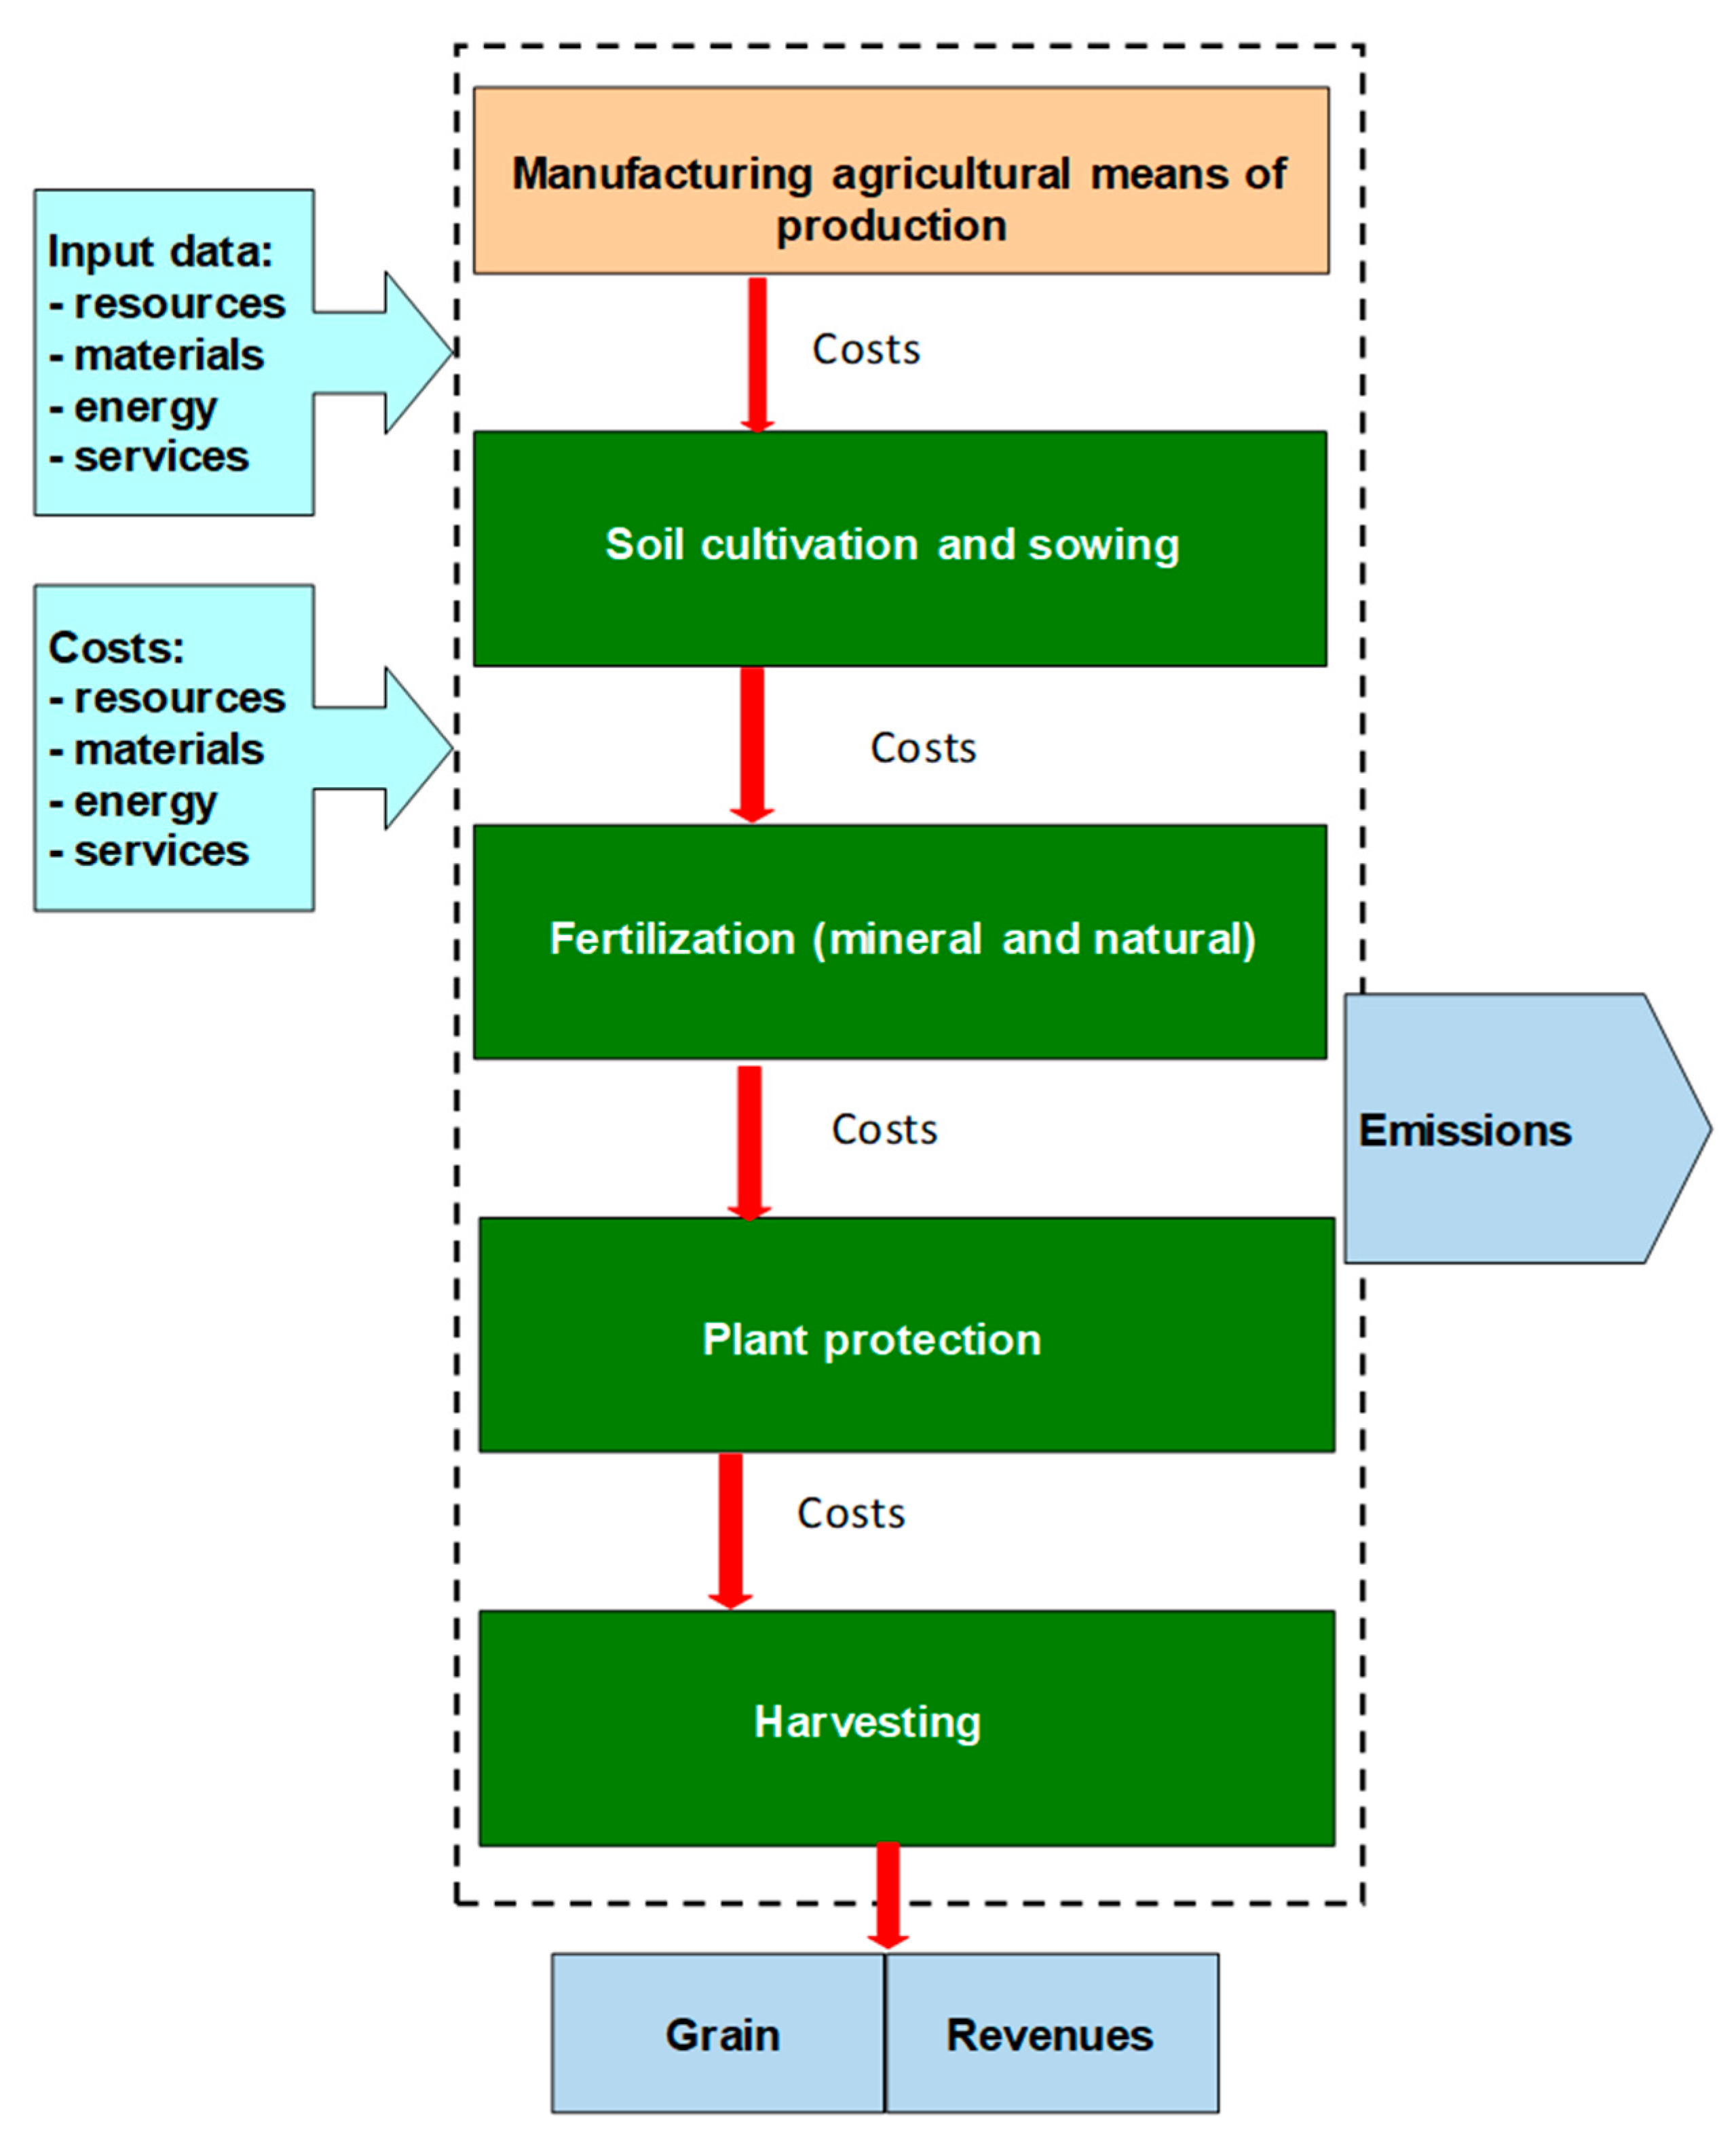
Carbon footprint (CF) was applied as a single most important measure of environmental impact of production. Carbon footprint is defined as the total amount of greenhouse gases produced to directly and indirectly support human activities, usually expressed in equivalent metric tons of carbon dioxide (CO2) [27]. The article adopts a methodology for calculating the carbon footprint as in the Publicly Available Specification (PAS) 2050 standard [28]. The carbon footprint calculated according to this methodology takes into account all emissions generated throughout the product life cycle (both direct and indirect emissions). In general, greenhouse gas (GHG) emissions in agriculture refer to three gases: CO2, N2O and CH4 (this is due to their high emissions in the long chain of agricultural production). The CF analysis was carried out in accordance with the LCA methodology, i.e., it covered the entire sequence: from extraction of raw materials, through the main stage of production, to the farm-gate [29]. As there were no coproducts in the production system, it was not necessary to use the allocation procedure for the inputs and outputs (Figure 1). Results analysis of CF and LCC have been referenced to the functional unit (FU) of 1 Mg of product (rapeseed or grain maize).

3. Results

An important aspect of the eco-efficiency analysis of winter rape production was the variability of its main components, as was demonstrated by differences in carbon footprint (as an environmental indicator) and life cycle costs (as an economic indicator) in relation to farming type.
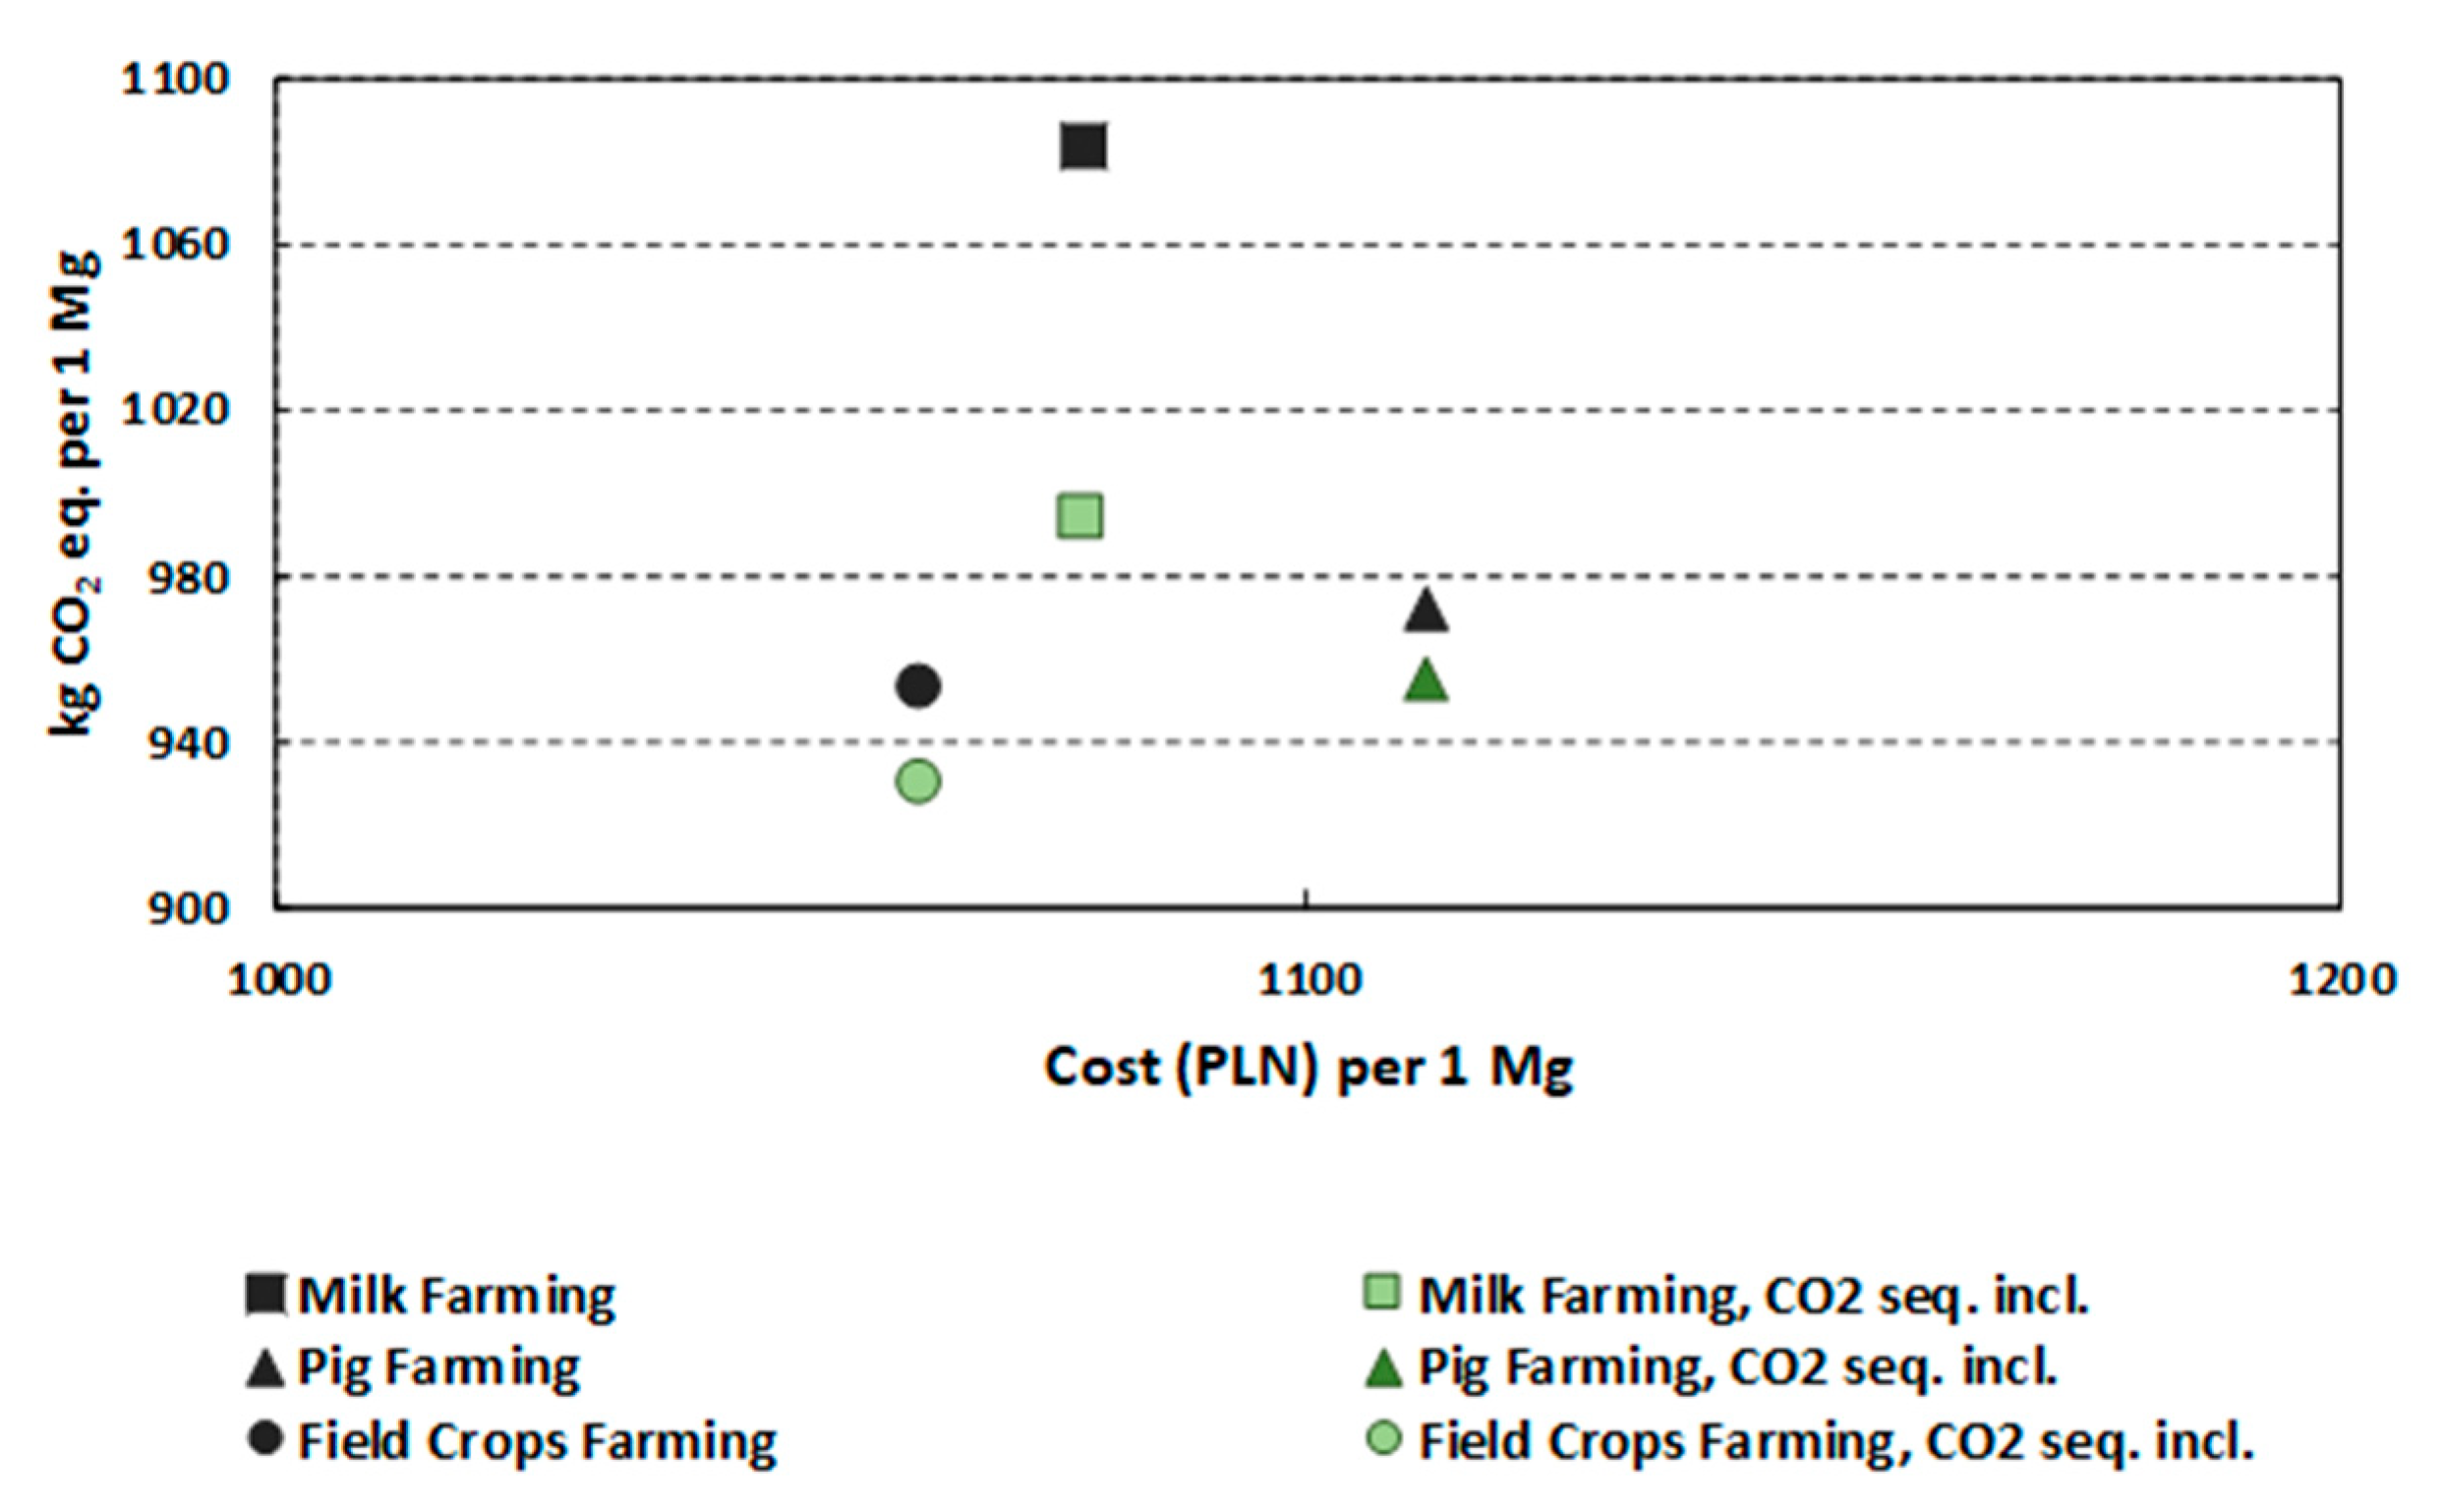
The highest value of the carbon footprint for winter rape production was shown for farms specialized in milk farming, while farms specialized in pig farming demonstrated high aggregated costs of production (Figure 2).
Winter rape cultivation in all farming types indicated that there was potential to reduce the GWP after accounting for soil carbon sequestration. In the milk farming type, carbon sequestration contributed most to the net impact of GWP, allowing a decrease in the value of the carbon footprint indicator by more than 8%.
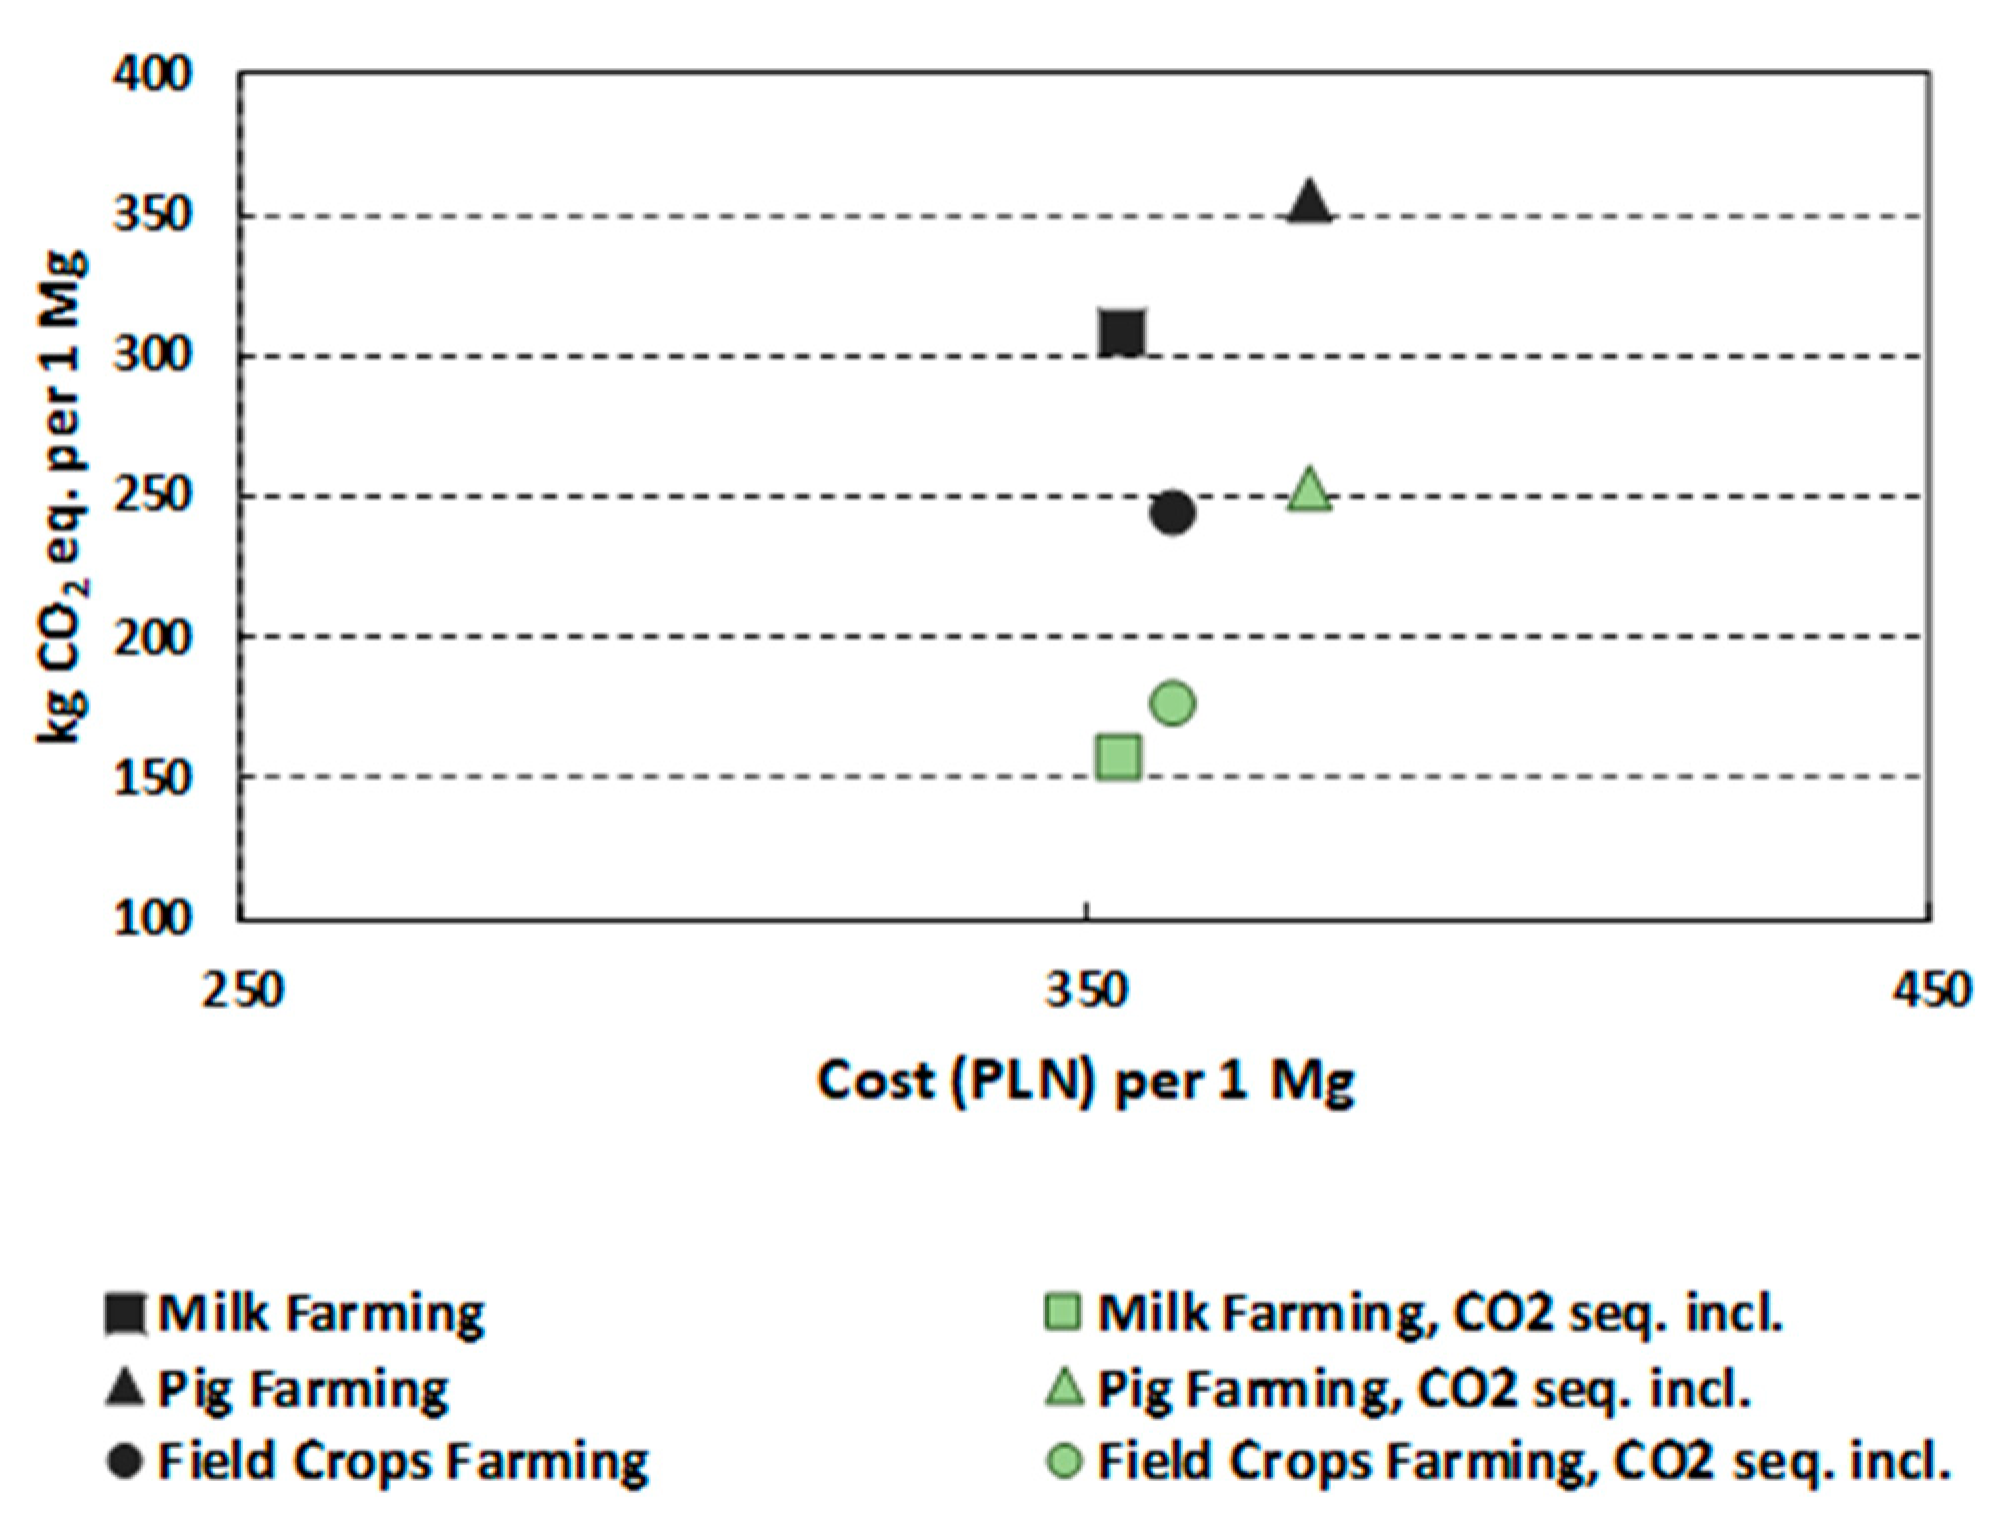
Analysis of sustainability of maize production showed the highest value of the carbon footprint indicator in farms specialized in pig farming. Farms specialized in pig farming demonstrated the highest aggregated costs of production as well (Figure 3).
Inclusion of carbon sequestered in maize fields, due to manure and crop residue availability, helped to lessen the net impact of GWP. The study indicated opportunities for GWP impact reduction if improvements in management of soil organic matter occur.
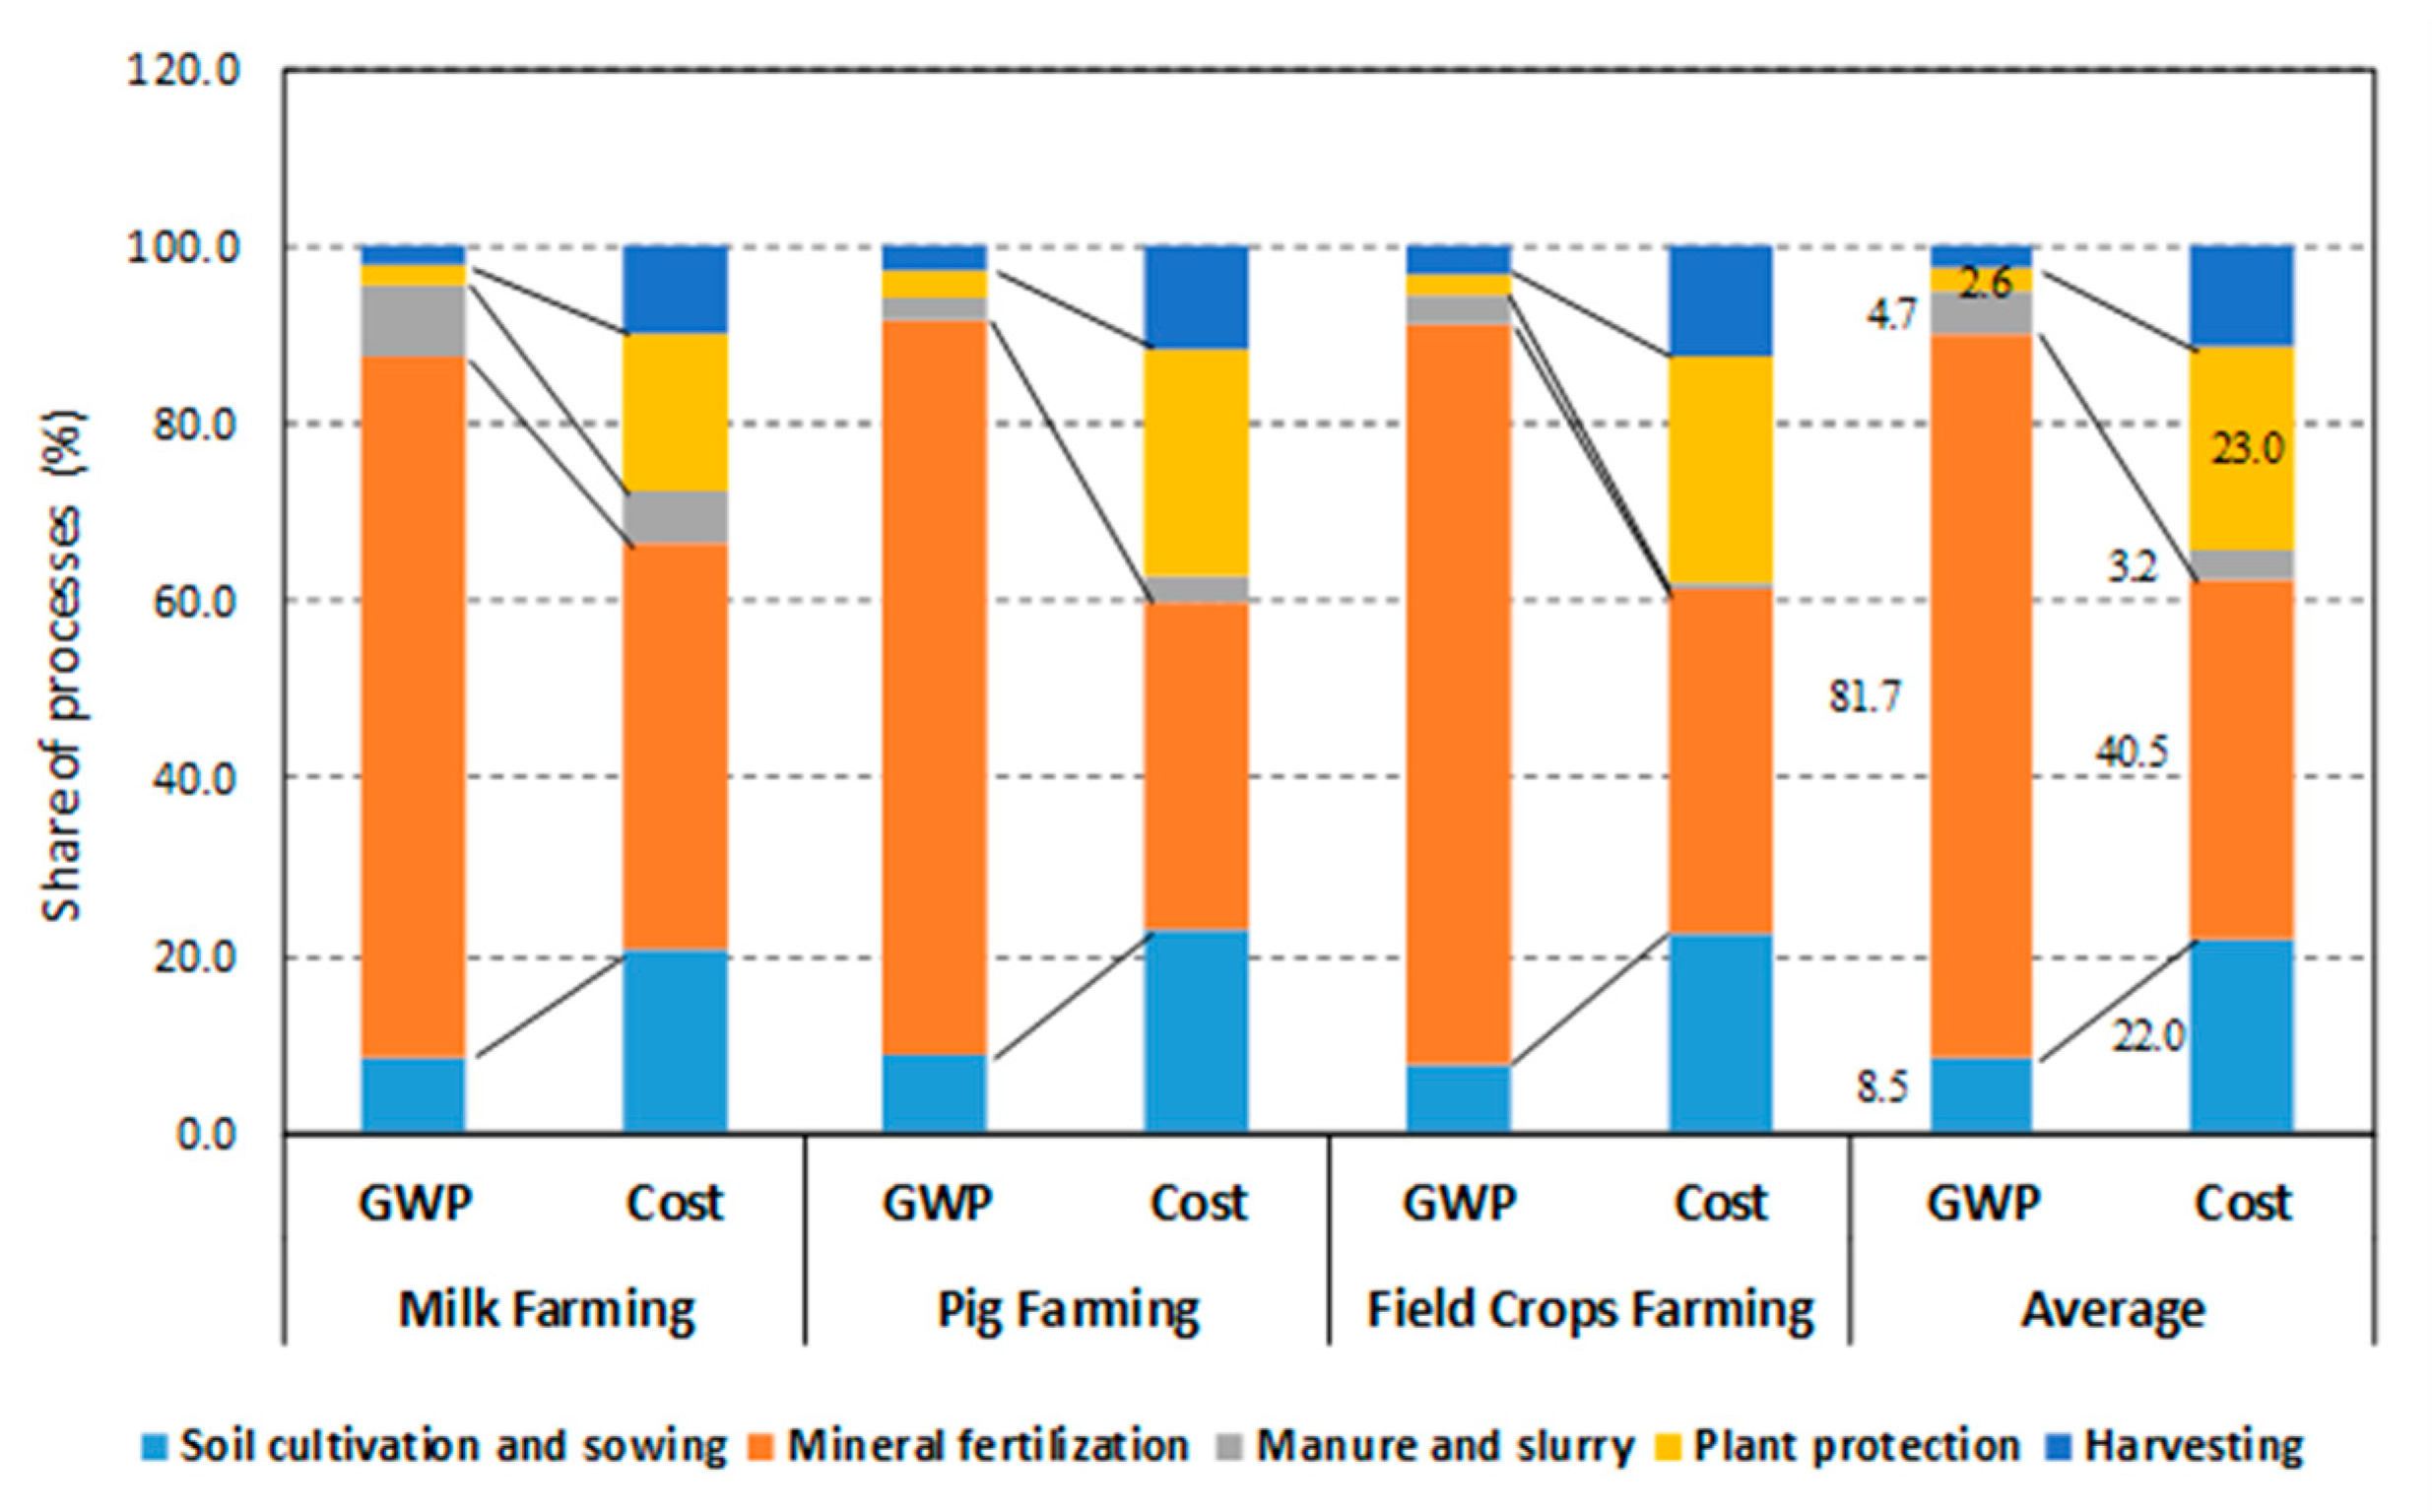
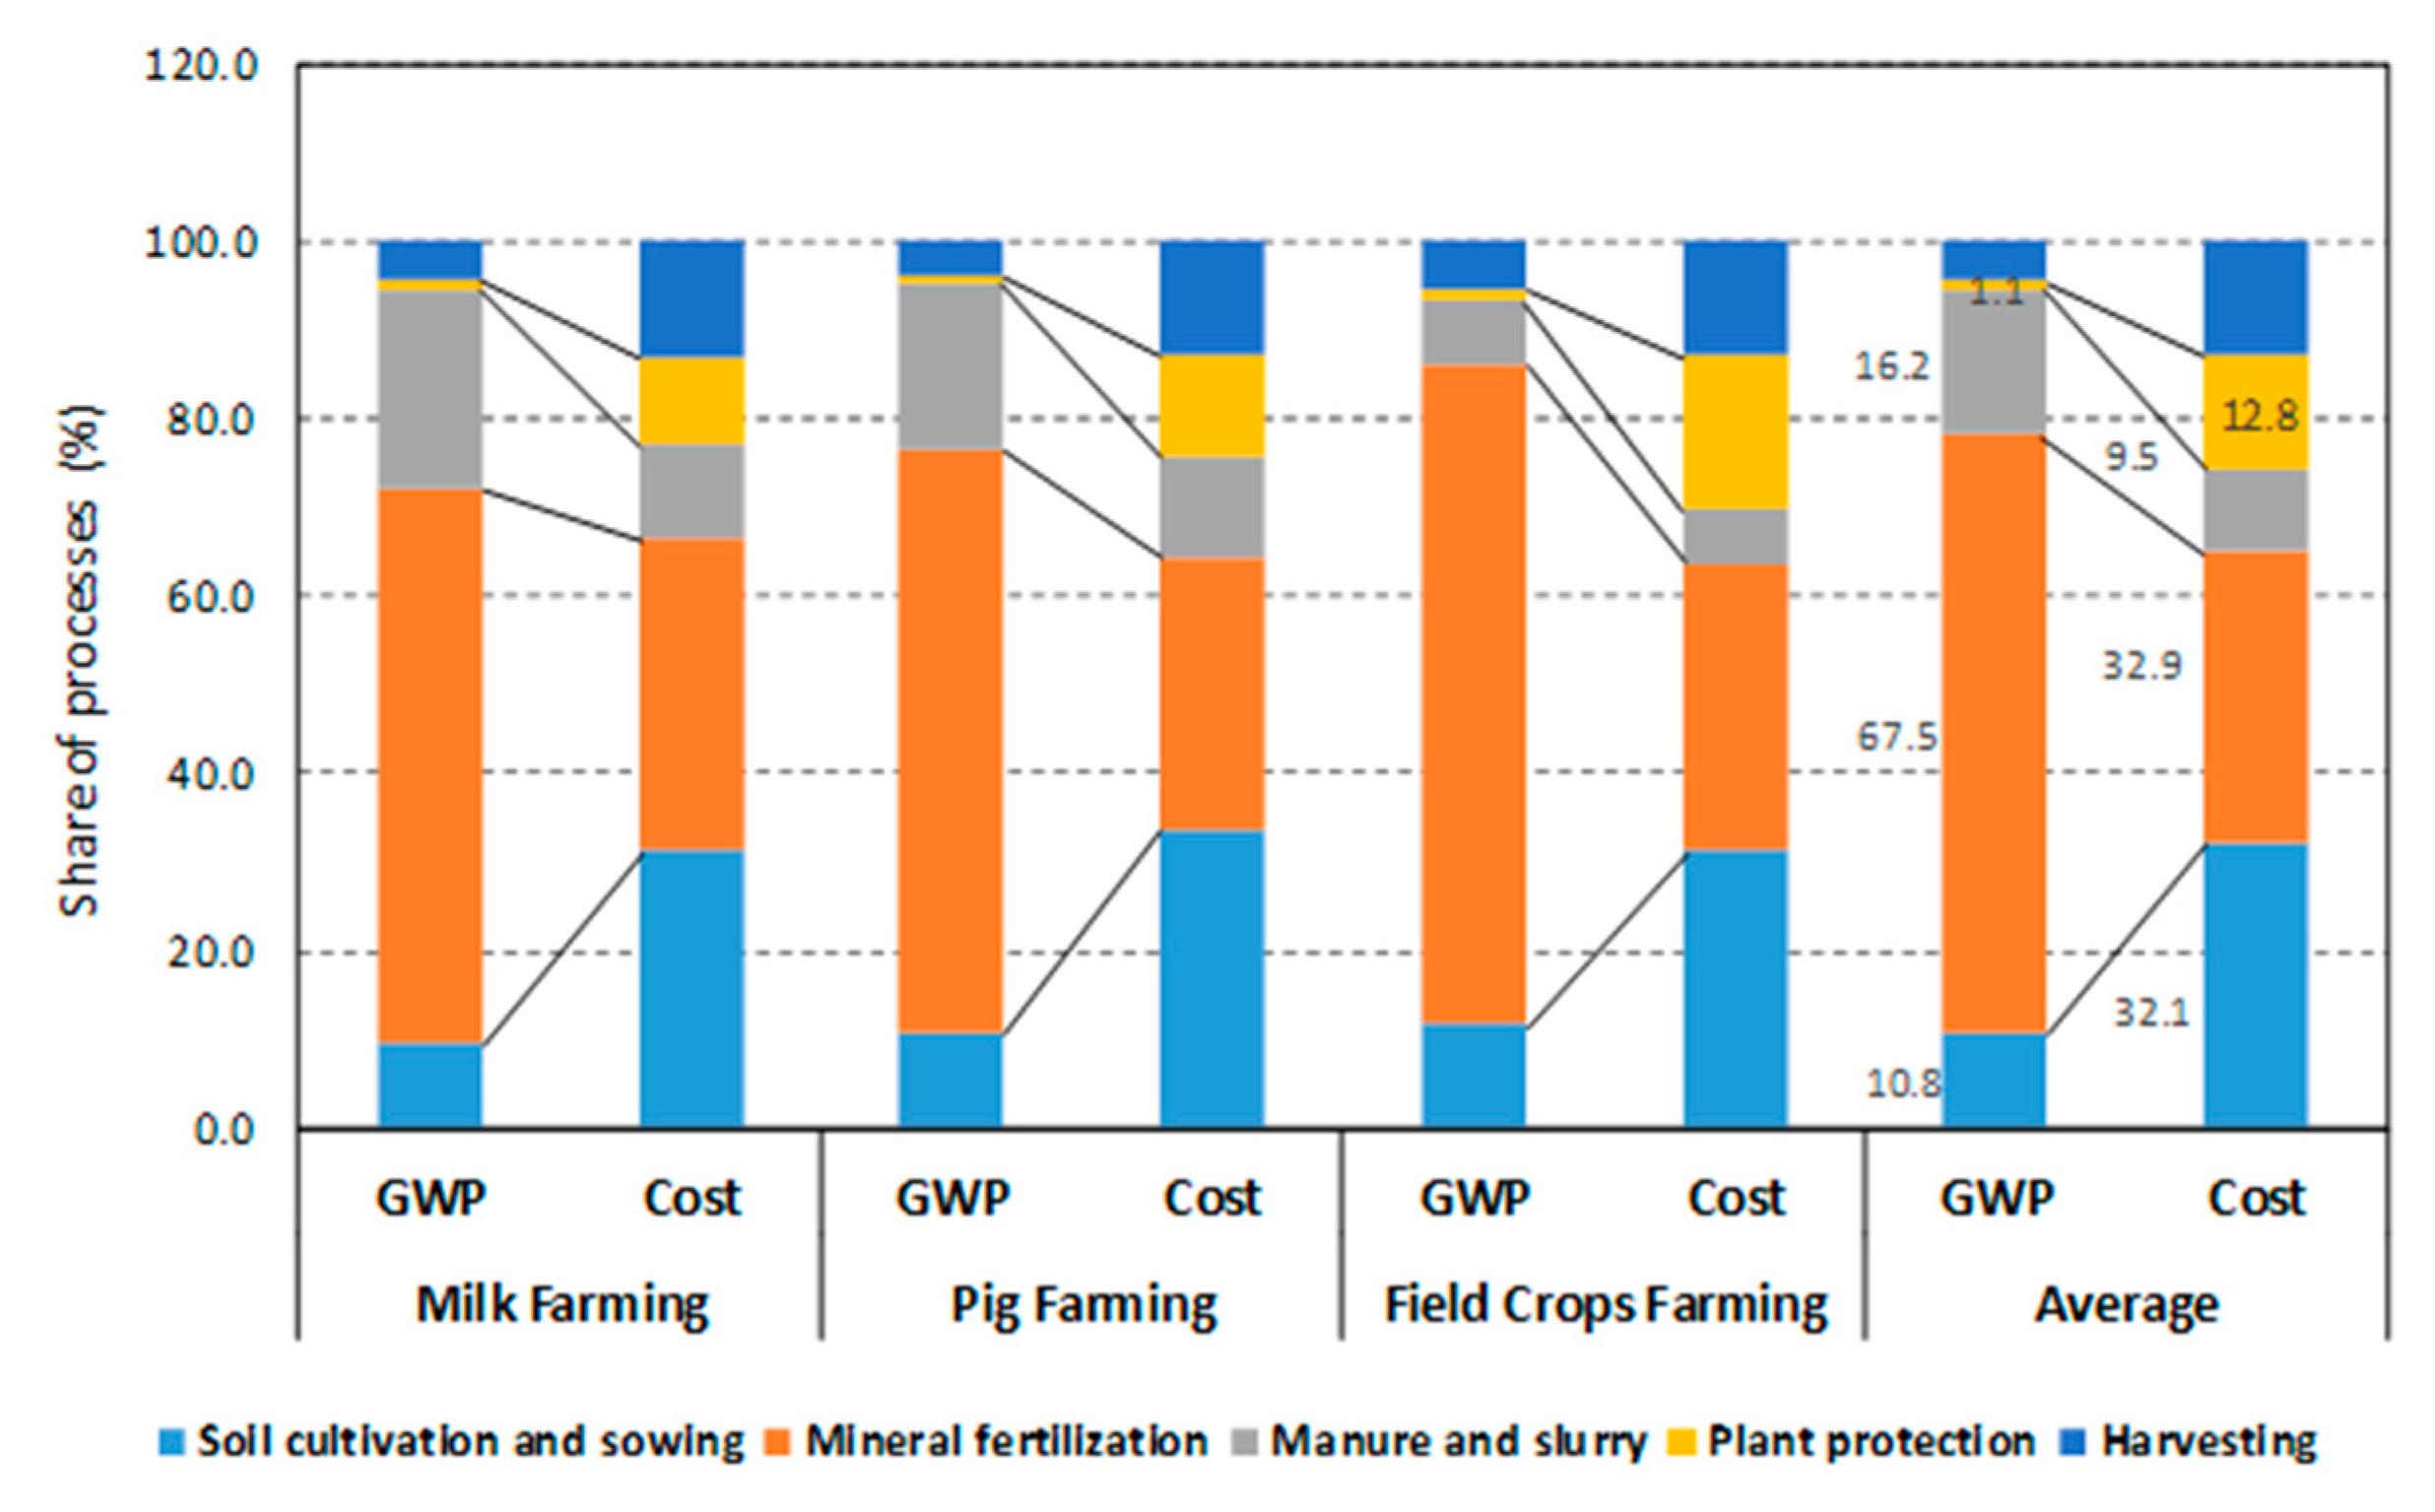
The obtained results showed that mineral fertilization had the greatest impact on the formation of potential environmental impacts among all technological processes of the system (Figure 4 and Figure 5).
Other technological operations—cultivation, sowing and application of manure and slurry—affected to environment a lesser extent. Plant protection and harvesting had a relatively minor impact. The fertilization process was a key factor (hotspot) driving the level of GWP and costs in the life cycle costing of production, independently from the farming type. Both environmentally and economically, the fertilization process is of particular concern and is a target for improvements, in order to shift to a more sustainable condition of production.
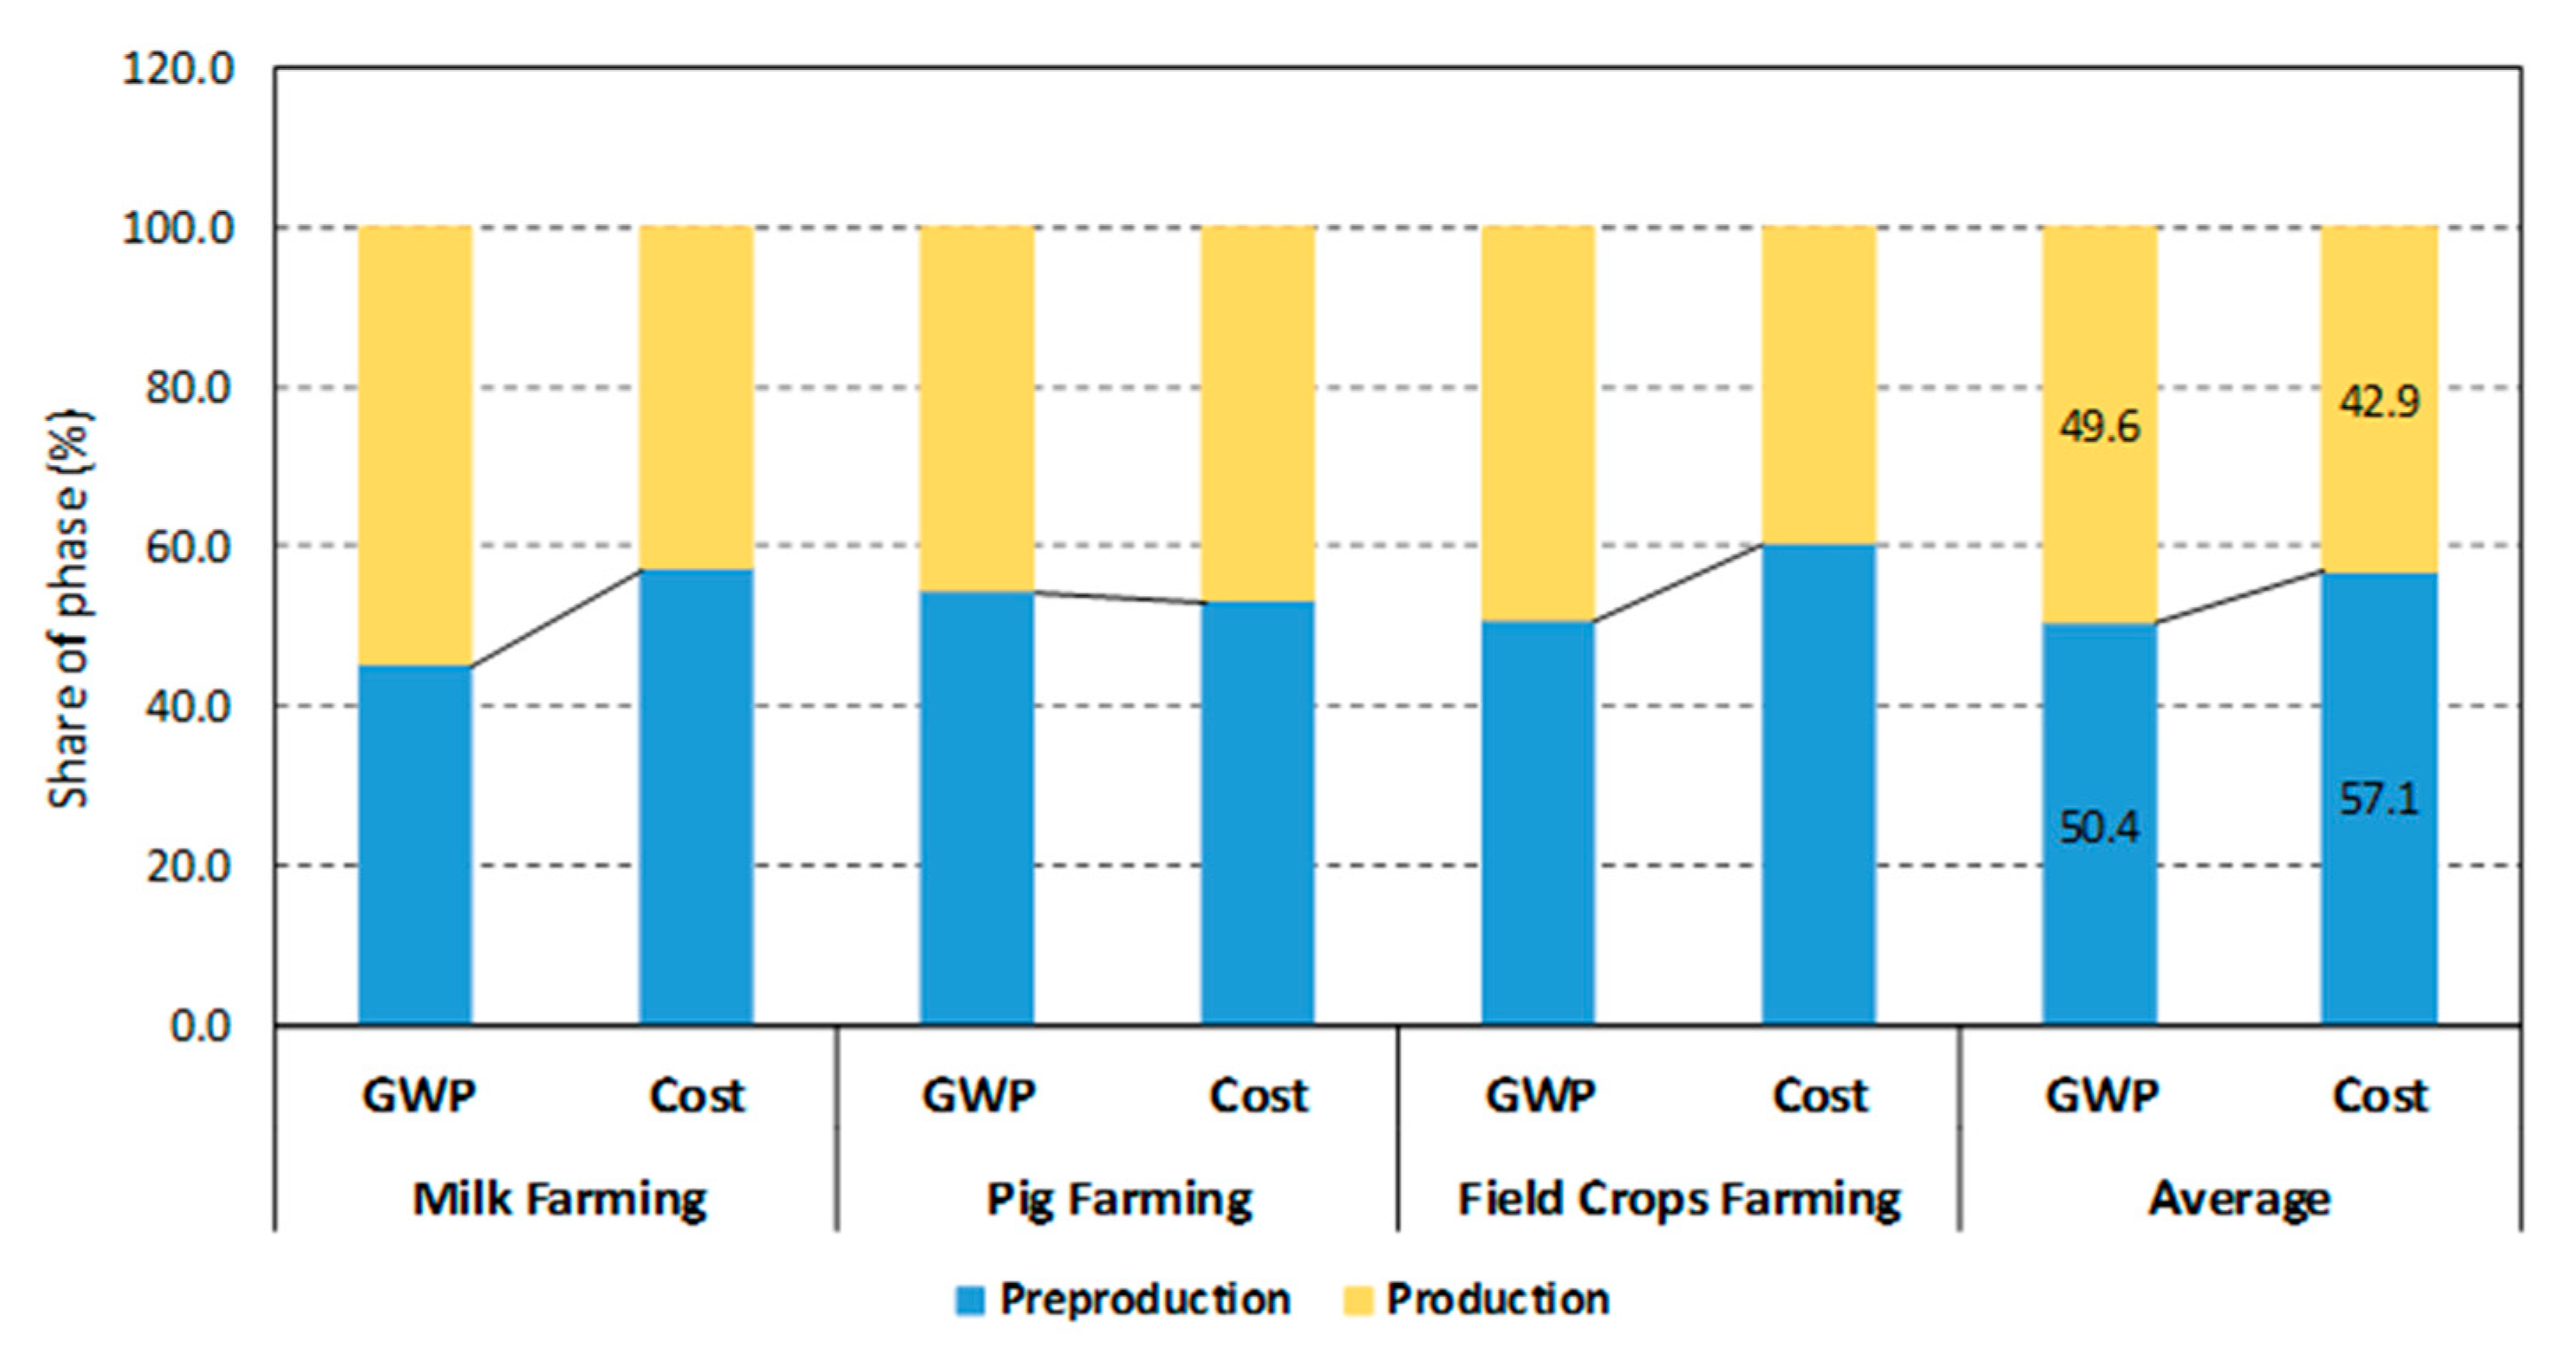
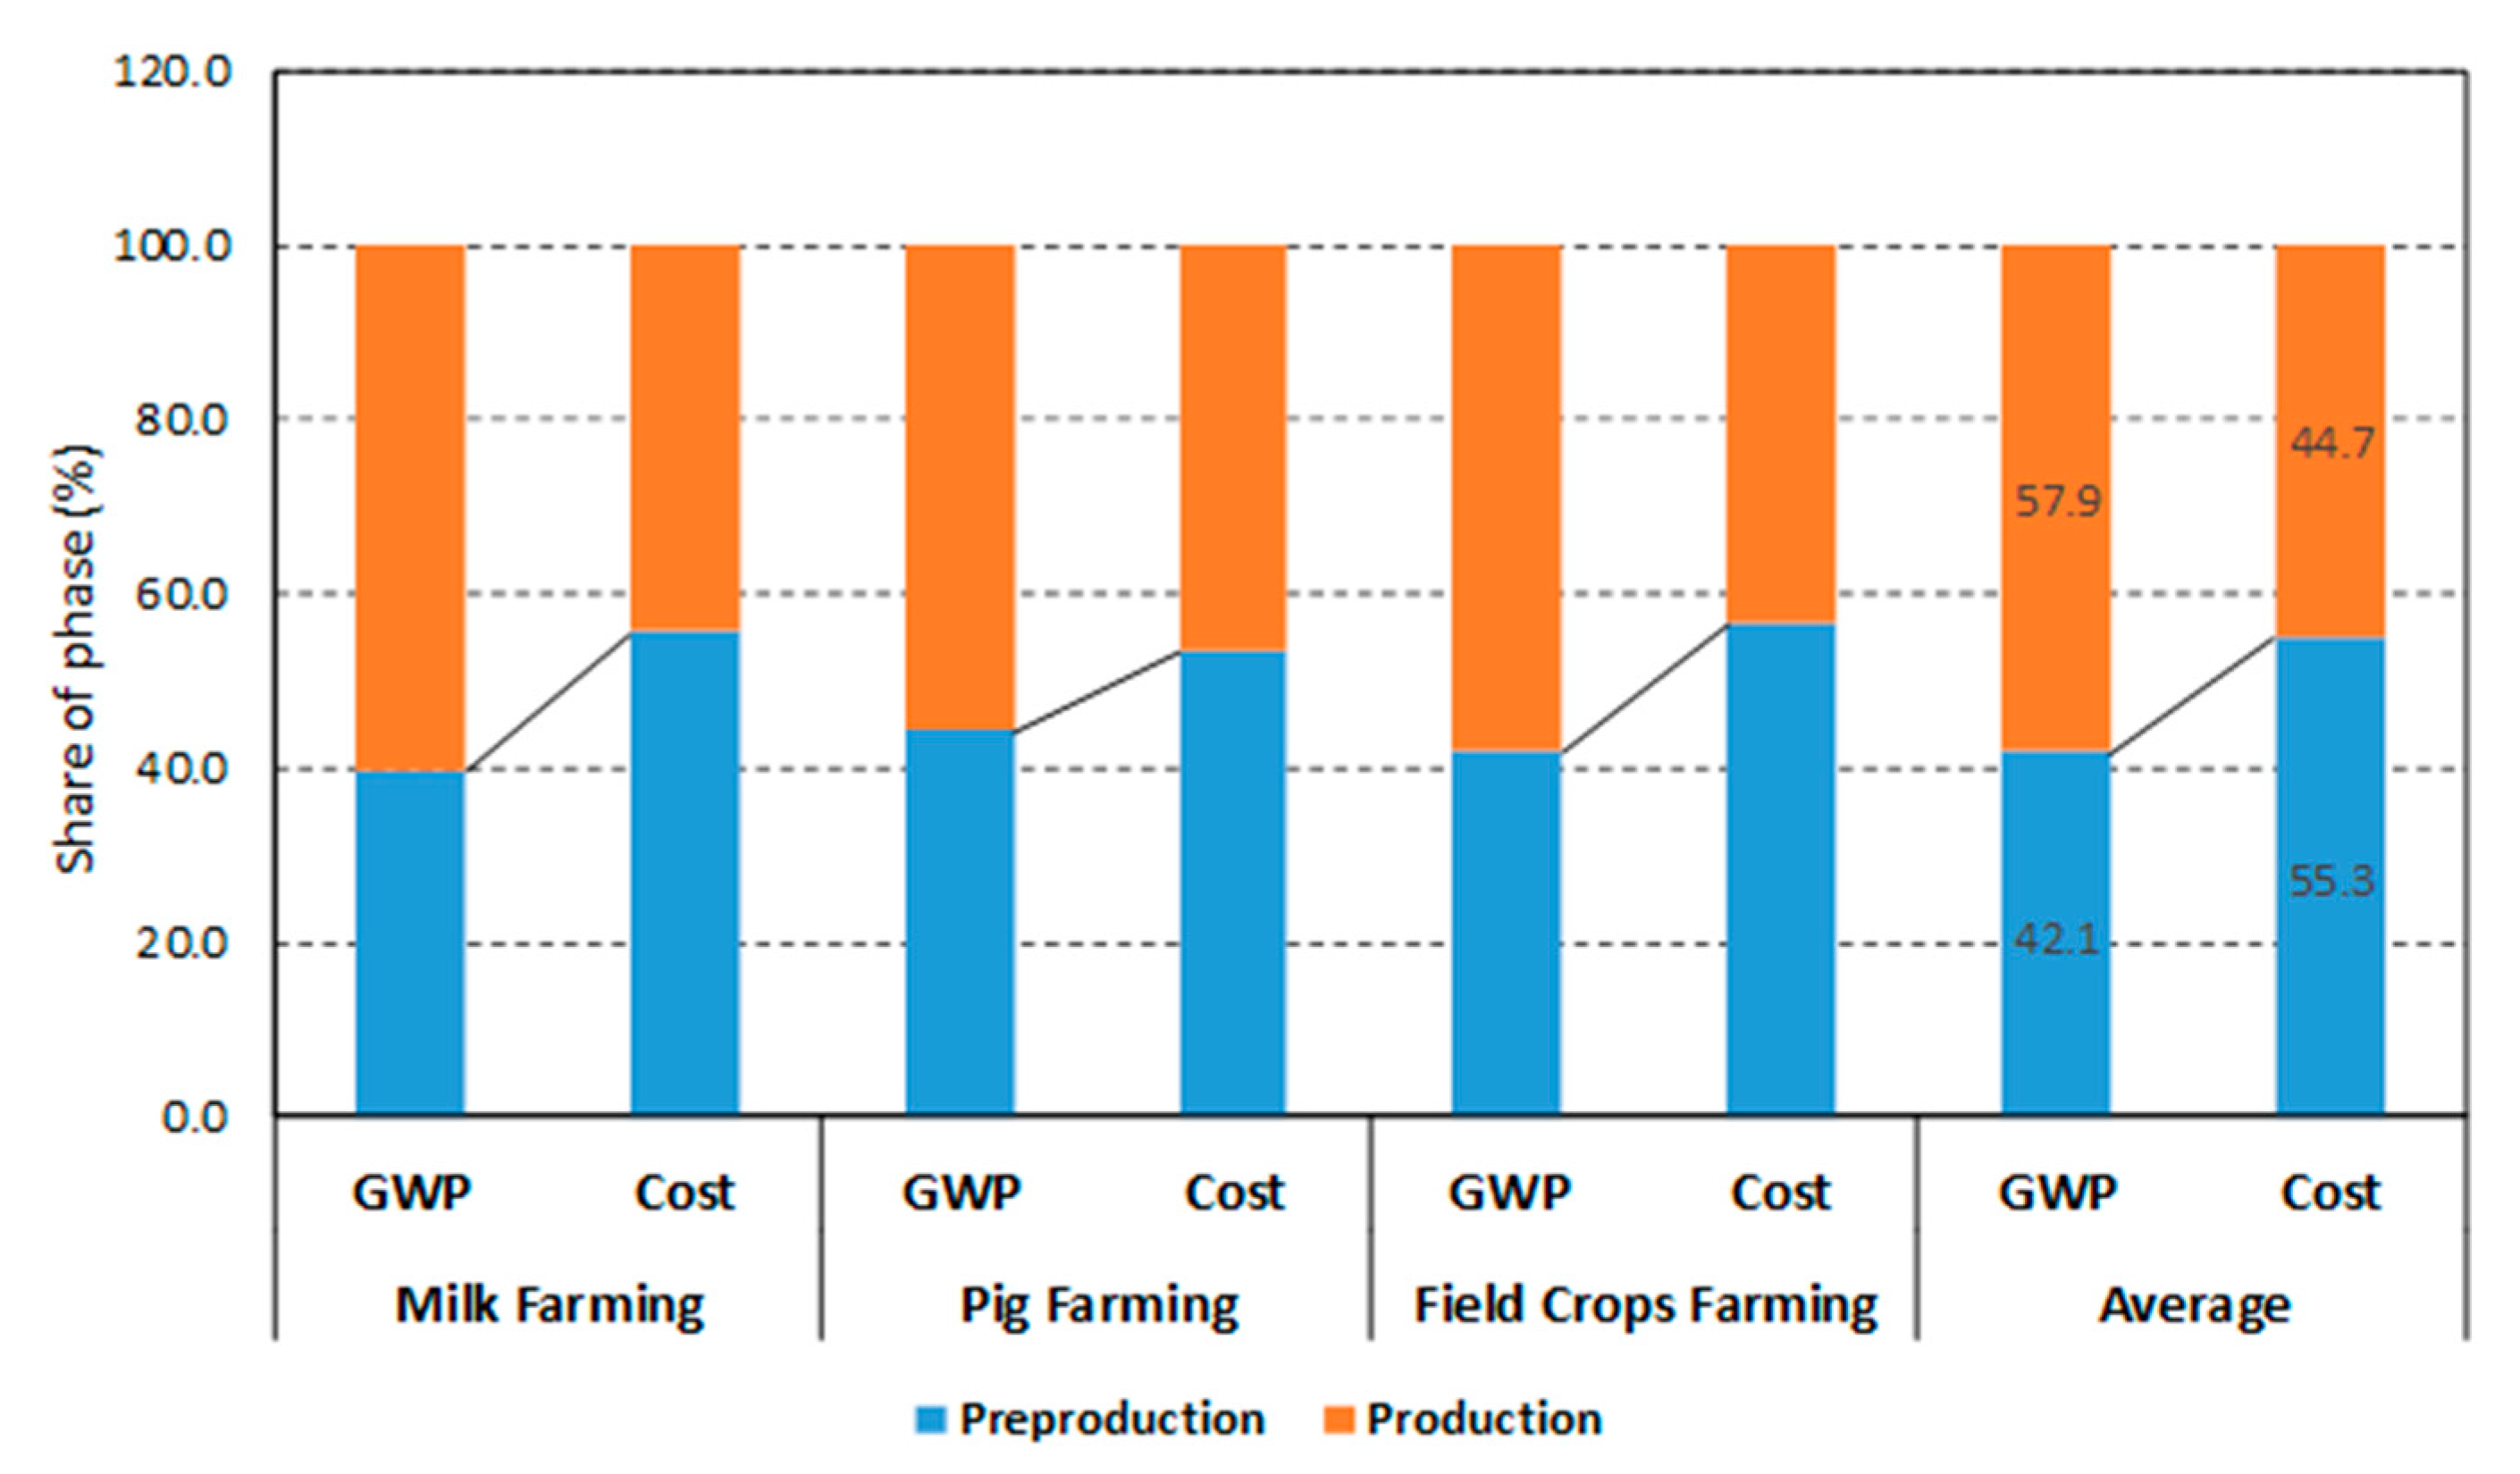
Preproduction phases linked with the direct input levels contributed most to the overall costs of winter rape production. Carbon footprint values were roughly equally distributed between the preproduction and production life cycle phases (Figure 6). Preproduction phases linked with the agricultural means of production contributed most to the overall costs of grain maize production as well. The production phase was more dominant in shaping the GWP impact (Figure 7).
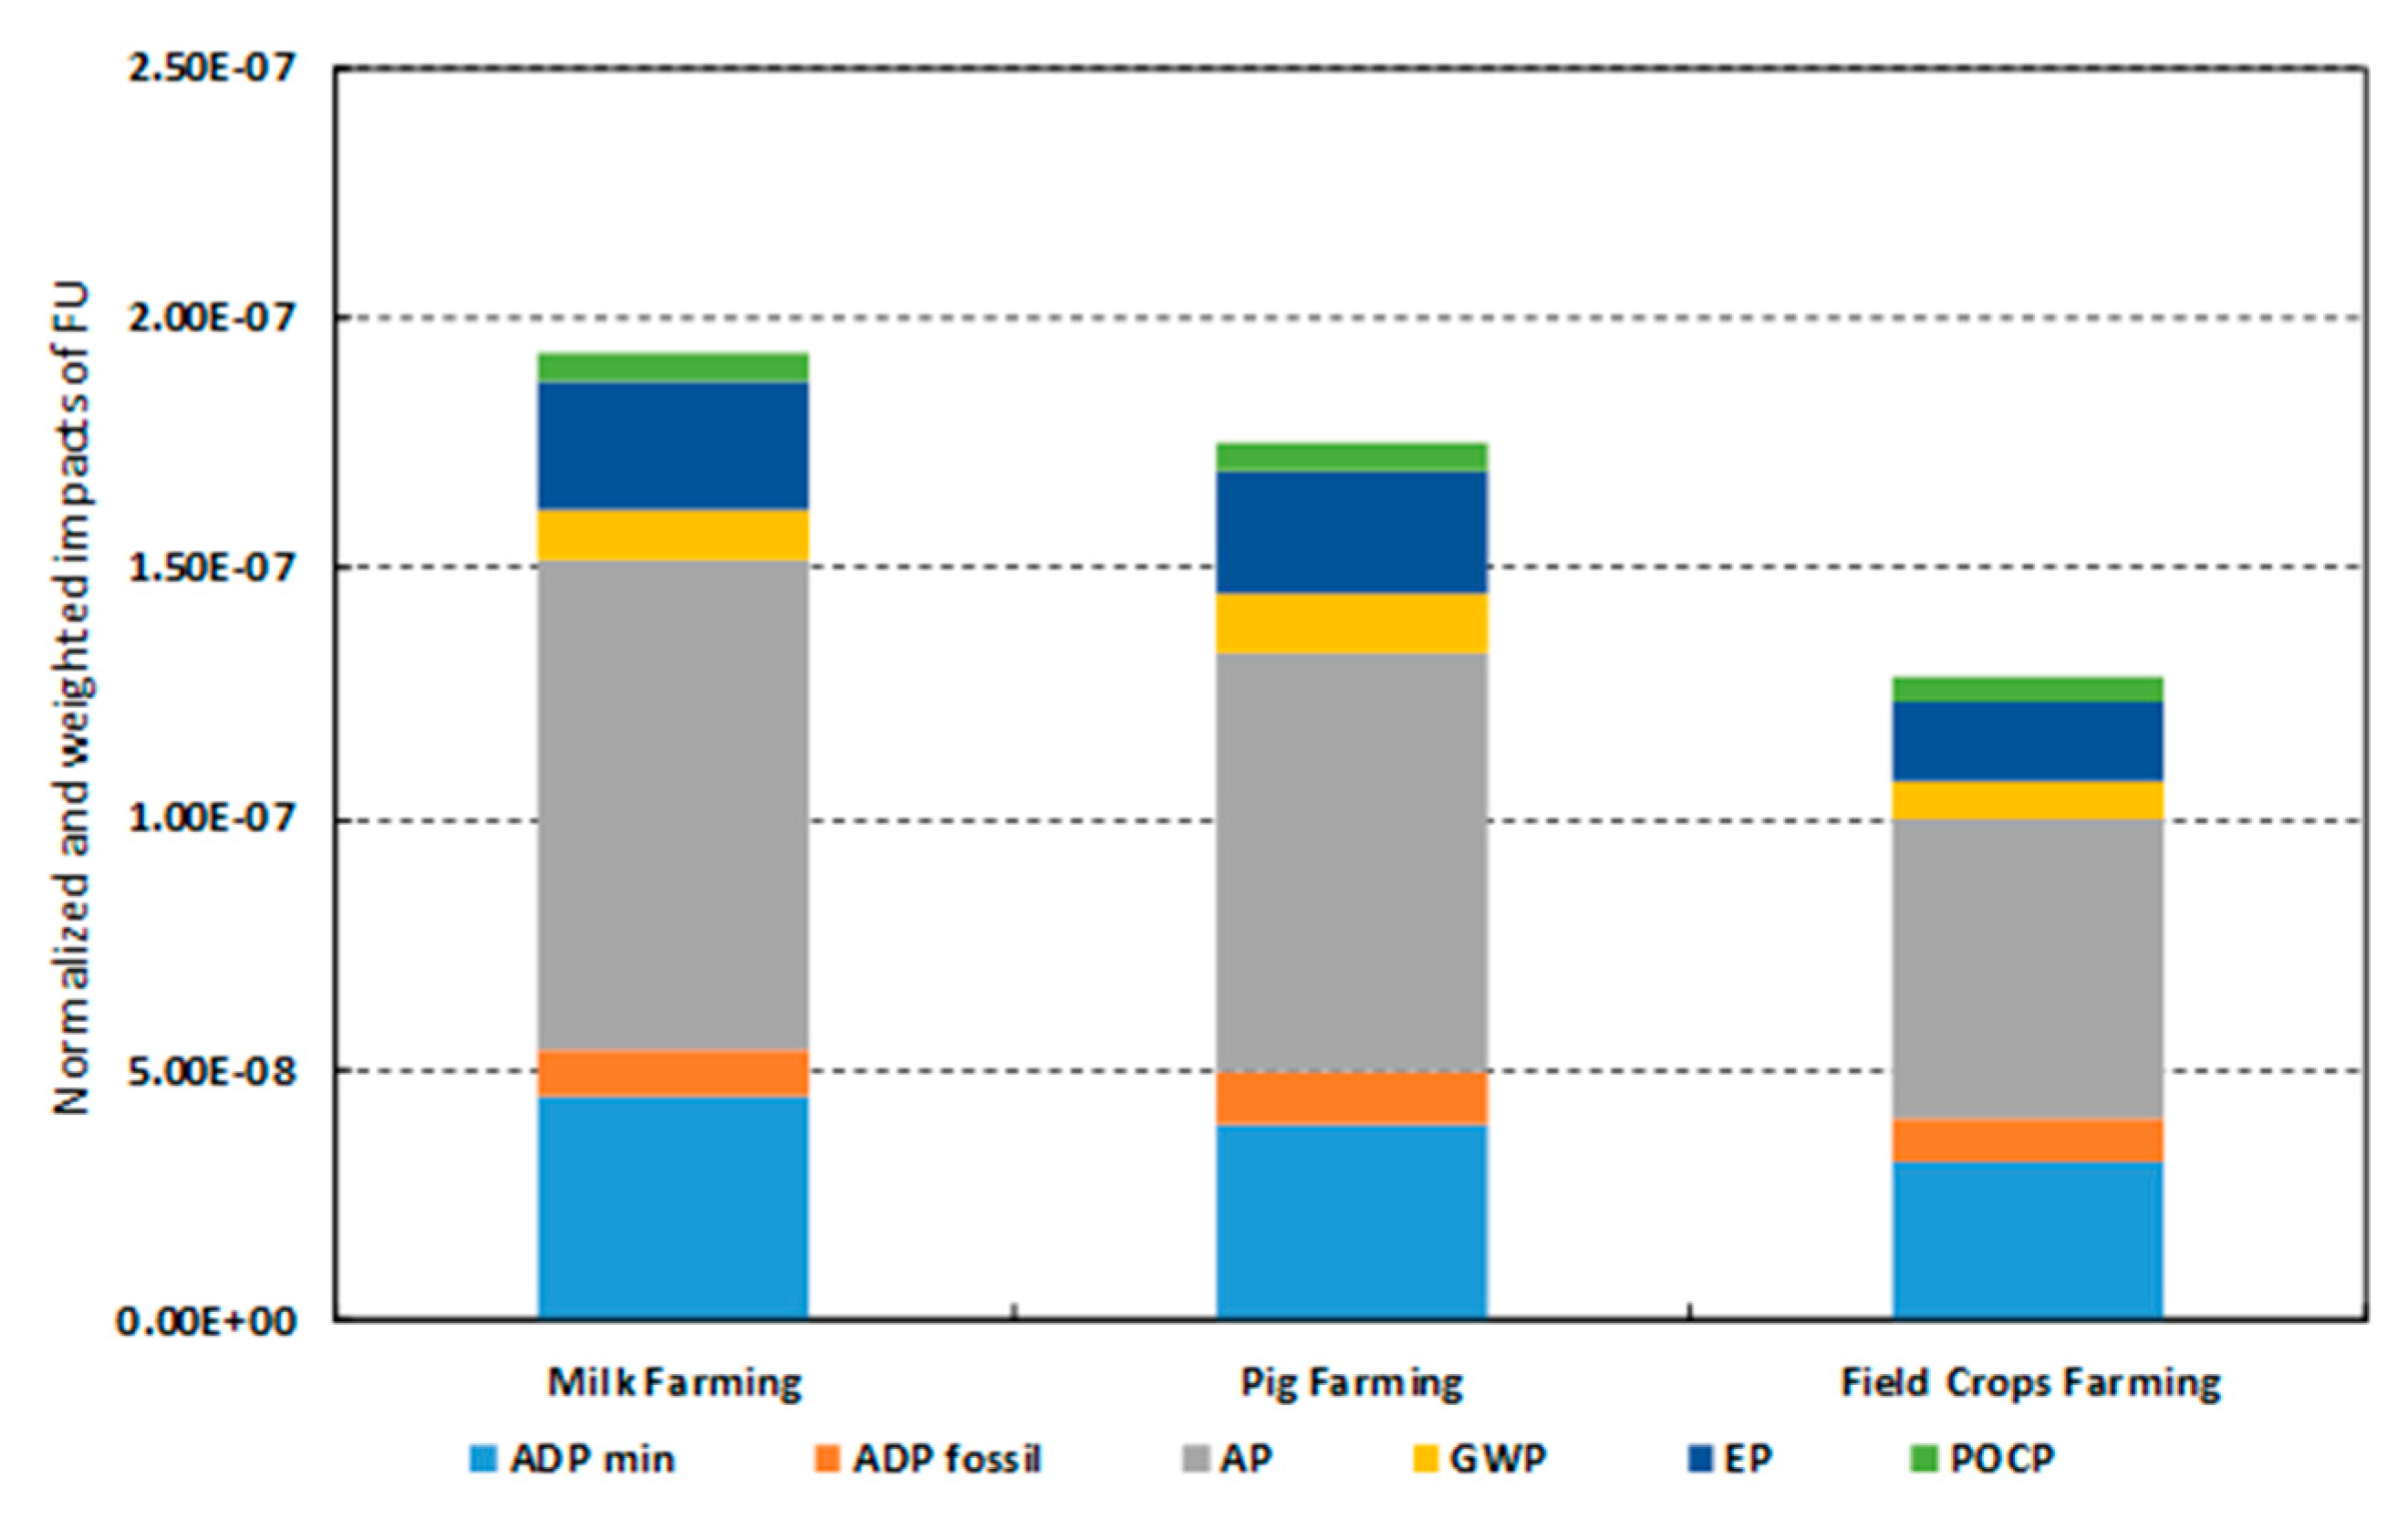
Additionally, in maize production, aggregated values of environmental indicators per 1 Mg of maize grain (FU) were calculated (Figure 8). Creating the aggregated single-score index was helpful in an overview of the importance of the environmental impacts in relation to farming type. Results show that the aggregated environmental index for maize grain production was higher in animal farming types than in the field crop farming. Environmental index was primarily influenced by total acidification potential (AP), followed by abiotic resource depletion for minerals (ADP min) and eutrophication potential (EP).

4. Discussion

Inclusion of soil carbon sequestration resulted in a considerable decrease of the overall GWP effect. Based on the availability of natural manure and crop residues, it was calculated that the climate impact of GHG emissions associated with grain maize could be the most reduced in the milk farming type (ca. 49%), followed by pig and field crop farming (ca. 29% and 28%, respectively). In general, grain maize cultivated in field crops had the lowest GHG intensity. In comparison, grain maize cultivation in Ontario (Canada) had relatively higher GHG emissions, ranging from 243 to 353 kg CO2 eq. 1 Mg−1 [30]. Of all the technological operations considered, mineral fertilization was the most influential factor, given the value of the impact (Figure 4 and Figure 5). Technological processes related to fertilization accounted for 68% GWP in maize and 82% GWP in rapeseed. Similar results for rapeseed were obtained under Chilean conditions by Iriarte et al. [31], in southern Europe (areas of the Mediterranean agroclimate) by Gasol et al. [32] and in the production of Crambe abyssinica in Poland by Krzyżaniak et al. [33]. The Spanish–Chilean team investigated that mineral fertilization was the dominant process in developing impact levels for 10 of 11 environmental impact categories [31]. In turn, the results of the Krzyżaniak team showed a relatively high importance of fertilization in 8 out of 10 examined impact categories. Fertilization constituted a contributory impact on the GWP for the rapeseed, with the share ranging from 63% to 93% [32,33]. Emissions associated with the use of mineral and natural fertilizers in maize contributed jointly, on average, almost 84% to the total GHG emissions. Emissions from other activities were of less importance. The dominant role of GHG emissions from N fertilizer were noticed in New Zealand [34]. The life cycle analysis of maize production in the United States showed that the most important source of impact on the greenhouse effect, acidification and eutrophication was field emissions, which was followed by technological operations [35]. The LCC analysis revealed that mineral fertilization was also the major factor influencing the life cycle costs of both crops independent of analyzed farming type.
The fact that the use of fertilizers in field production technologies has the greatest impact on the final GWP value is associated with nitrogen compound emissions. This effect resulted from direct emissions of N2O as well as their indirect emissions as a result of earlier deposition of NH3 and NOx (when using nitrogen fertilizers on the field).
The obtained research results, compared to the values published in the literature, indicate that the production process in the analyzed farms has a lower potential for environmental impact. For example the studies conducted in UK [36] presented twice as high potential of global warming (GWP), potential of eutrophication (EP) and abiotic depletion potential (ADP) quantified per functional unit of 1 Mg for the product. British data—compared to the analyzed farms—showed only lower values of indicators for the acidification impact category (AP). In turn, the analysis of the environmental impact of rapeseed production in Chile from the life cycle perspective showed the same values of GWP level as in the surveyed farms [31].
After normalization of calculated environmental indicators for maize grain (aggregated values per 1 Mg of grain as in Figure 8) it can be stated that the biggest environmental risk related to this production system (in the overall environmental profile) is associated with soil acidification (AP). The analyzed maize production system also showed a relatively large impact on the abiotic depletion (ADP mineral), eutrophication and greenhouse effect. Similar results—after data normalization to global values—were also obtained by Huerta et al. [37].

5. Conclusions

The sustainable production profile of both researched crops was based on the analysis of the environmental impacts and the life cycle costing. Among the farming types there was a marked variability of GWP. The results of aggregated costs showed a narrower range of variation between farming types.
The production inputs can explain many differences in yields and in the levels of environmental impact. Material and financial inputs in the production of analyzed crops depend on both the intensity of operations as well as local conditions (e.g., soil conditions).
The fertilizing process was defined to be the hotspot in GWP and aggregated costs. Both environmentally and economically, fertilization is of particular concern for reducing these indicators, in order to shift to a more sustainable level of production. It should be noted that the impact indicators examined can be reduced through specific actions. Efforts should be made to improve fertilizer production technology, simplify cultivation operations and use optimized fertilizer doses in a timely manner.
Normalized environmental effects point to acidification as the main threat to the environment.
Preproduction phases linked with the direct input levels contributed most to the overall costs of both analyzed crops. GWP values were generally evenly distributed between preproduction and production (with a slight advantage for the production phase in maize).
Relatively low contribution of GWP to the environmental score indirectly indicates that crop production in agriculture, independently from farming types, is not necessarily the most important source of GHG emissions compared to the other sectors of production.
The presented results are part of wider research. Their purpose is to identify agricultural products that have the greatest environmental impact throughout the entire life cycle, “from cradle to grave.” The results can be used to assess the potential for improvement and to determine if—and how—the life cycle impact of the products with the most impact can be reduced (or at least to improve the socioeconomic costs of crops).

Author Contributions

Conceptualization, R.B. and J.B.; methodology, J.B.; validation, R.B. and J.B.; formal analysis, J.B.; investigation, R.B. and J.B.; data curation, J.B.; writing—original draft preparation, R.B.; writing—review and editing, R.B. and J.B.; visualization, J.B.; project administration, J.B.; funding acquisition, J.B. All authors have read and agreed to the published version of the manuscript.

Funding

This research was funded by the National Science Centre, Poland grant number 2016/21/B/HS4/01963. The APC was funded by Poznan University of Life Sciences.

Conflicts of Interest

The authors declare no conflict of interest.

References

  1. Piontek, B. Koncepcja Rozwoju Zrównoważonego i Trwałego Polski; PWN: Warszawa, Poland, 2002. [Google Scholar]
  2. Woś, A.; Zegar, J.S. Rolnictwo Społecznie Zrównoważone; IERiGŻ: Warszawa, Poland, 2002. [Google Scholar]
  3. Runowski, H. Systemy rolnictwa w scenariuszu przyszłości. In Polska Wieś 2025. Wizja Rozwoju; Wilkin, J., Ed.; IRWiR PAN: Warszawa, Poland, 2005. [Google Scholar]
  4. Baum, R.; Wielicki, W. Prognoza przeobrażeń w rolnictwie do roku 2030 w kontekście zrównoważonego rozwoju. Wieś i Rolnictwo 2007, 1, 19–32. [Google Scholar]
  5. Baum, R. Ocena Zrównoważonego Rozwoju w Rolnictwie (Studium Metodyczne); Rozprawy Naukowe 434; Uniwersytet Przyrodniczy w Poznaniu: Poznań, Poland, 2011. [Google Scholar]
  6. Prus, P. Perspectives for Sustainable Development of Agricultural and Rural Areas. In Ecosystem Health and Sustainable Agriculture 1. Sustainable Agriculture; Jakobsson, C., Ed.; Uppsala University: Uppsala, Sweden, 2012; pp. 51–59. [Google Scholar]
  7. Prus, P.; Mejszelis, M. Multifunctional development of rural areas in terms of the concept of sustainable development. In Human and Nature Safety, Proceedings of the International Scientific Conference, Vilnius, Lithuania, 16–17 May 2012; Aleksandras Stulginskis University: Kaunas, Lithuania, 2012; pp. 112–115. [Google Scholar]
  8. Łuczka, W.; Smoluk-Sikorska, J. Sustainable consumption–between theory and practice. In Proceedings of the 8th International Scientific Conference Rural Development 2017, Kaunas, Lithuania, 23–24 November 2017; pp. 1–6. [Google Scholar]
  9. Prus, P. Sustainable farming production and its impact on the natural environment-case study based on a selected group of farmers. In Proceedings of the 8th International Scientific Conference Rural Development 2017, Kaunas, Lithuania, 23–24 November 2017; pp. 1280–1285. [Google Scholar]
  10. Baum, R.; Bieńkowski, J. Eco-efficiency as Part of Sustainable Farm Development. Folia Oeconomica. Acta Univ. Lodz. 2019, 2, 23–42. [Google Scholar] [CrossRef] [Green Version]
  11. Goedkoop, M.J.; Heijungs, R.; Huijbregts, M.; De Schryver, A.; Struijs, J.; Van Zelm, R. ReCiPe 2008, A Life Cycle Impact Assessment Method Which Comprises Harmonised Category Indicators at the Midpoint and the Endpoint Level. First Edition Report I: Characterisation; Ministerie van Volkshuisvesting, Ruimtelijke Ordening en Milieubeheer: Hague, The Netherlands, 2013. [Google Scholar]
  12. Rebitzer, G.; Ekvall, T.; Frischknecht, R.; Hunkeler, D.; Norris, G.; Rydberg, T.; Schmidt, W.-P.; Suh, S.; Weidema, B.P.; Pennington, D.W. Life cycle assessment. Part 1: Framework, goal and scope definition, inventory analysis and applications. Environ. Int. 2004, 30, 701–720. [Google Scholar] [CrossRef] [PubMed]
  13. Lozano, S.; Iribarren, D.; Moreira, M.T.; Feijoo, G. The link between operational efficiency and environmental impacts. A joint application of Life Cycle Assessment and Data Envelopment Analysis. Sci. Total Environ. 2009, 407, 1744–1754. [Google Scholar] [CrossRef] [PubMed]
  14. PKN PN-EN ISO 14040. Environmental Management. Life Cycle Assessment. Principles and Framework; ISO: Warszawa, Poland, 2006. [Google Scholar]
  15. Dong, G.; Mao, X.; Zeng, A. Carbon footprint accounting and dynamics and the driving forces of agricultural production in Zhejiang Province, China. Ecol. Econ. 2013, 91, 38–47. [Google Scholar] [CrossRef]
  16. Shrestha, B.M.; Desjardins, R.L.; McConkey, B.G.; Worth, D.E.; Dyer, J.A.; Cerkowniak, D.D. Change in carbon footprint of canola production in the Canadian Prairies from 1986 to 2006. Renew. Energy 2013, 63, 634–641. [Google Scholar] [CrossRef]
  17. Brandão, M.; Levasseur, A.; Kirschbaum, M.U.K.; Weidema, B.P.; Cowie, A.L.; Jørgensen, S.V.; Hauschild, M.Z.; Pennington, D.W.; Chomkhamsri, K. Key issues and options in accounting forcarbon sequestration and temporary storage in life cycle assessment and carbon footprinting. Int. J. Life Cycle Assess. 2013, 18, 230–240. [Google Scholar] [CrossRef]
  18. European Council Conclusions 2014. 2030 Climate and Energy Policy Framework. Conclusions. 23/24 October 2014, EUCO 169/14. Available online: http://www.consilium.europa.eu/uedocs/cms_data/docs/pressdata/en/ec/145397.pdf (accessed on 21 July 2019).
  19. Brentrup, F.; Küsters, J.; Kuhlmann, H.; Lammel, J. Environmental impact assessment of agricultural production systems using the life cycle assessment methodology. I. Theoretical concept of a LCA method tailored to crop production. Eur. J. Agron. 2004, 2, 247–264. [Google Scholar] [CrossRef]
  20. Heijungs, R.; Settanni, E.; Guinée, J. Toward a computational structure for life cycle sustainability analysis: Unifying LCA and LCC. Int. J. Life Cycle Assess. 2013, 18, 1722–1733. [Google Scholar] [CrossRef] [Green Version]
  21. Bieńkowski, J.; Baum, R.; Holka, M. Life cycle assessment and life cycle costing in measuring the eco-efficiency of winter rape production. Conference paper (Book of Abstracts). In Proceedings of the 49th International Academic Conference, Dubrovnik, Croatia, 27–30 August 2019; pp. 23–24. [Google Scholar] [CrossRef]
  22. Bieńkowski, J.; Baum, R.; Holka, M. Life cycle assessment and life cycle costing in measuring the sustainability performance of maize production. Conference paper (Book of Abstracts). In Proceedings of the 7th International Conference on Sustainable Development, Rome, Italy, 4–5 September 2019; pp. 142–143. Available online: Https://ecsdev.org/images/conference/7thICSD2019/Proceedings-abstracts-7ICSDpdf (accessed on 11 January 2020).
  23. European Commission-Joint Research Centre-Institute for Environment and Sustainability. International Reference Life Cycle Data System (ILCD) Handbook-Recommendations for Life Cycle Impact Assessment in the European Context; Publications Office of the European Union: Luxemburg, 2011. [Google Scholar]
  24. Rebitzer, G.; Seuring, S. Methodology and application of life cycle costing. Int. J. Life Cycle Assess. 2003, 8, 110–111. [Google Scholar] [CrossRef] [Green Version]
  25. Guinée, J.B.; Gorrée, M.; Heijungs, R.; Huppes, G.; Kleijn, R.; de Koning, A.; van Oers, L.; Wegener Sleeswijk, A.; Suh, S.; Udo de Haes, H.A.; et al. Handbook on Life Cycle Assessment. Operational Guide to the ISO Standards. I: LCA in Perspective. IIa: Guide. IIb: Operational Annex. III: Scientific Background; Kluwer Academic Publishers: Dordrecht, The Netherlands, 2002. [Google Scholar]
  26. IPCC 2006. 2006 IPCC Guidelines for National Greenhouse Gas Inventories. Volume 2 Energy. Task Force on National Greenhouse Gas Inventories. Available online: http://www.ipcc-nggip.iges.or.jp/public/2006gl/vol2.html (accessed on 27 May 2019).
  27. What Is a Carbon Footprint–Definition. Available online: https://timeforchange.org/what-is-a-carbon-footprint-definition/ (accessed on 3 January 2020).
  28. BSI 2011. PAS 2050: Specification for the Assessment of the Life Cycle Greenhouse Gas Emissions of Goods and Services; British Standards Institute: London, UK, 2011. [Google Scholar]
  29. Milà i Canals, L.; Sim, S.; García-Suárez, T.; Neuer, G.; Herstein, K.; Kerr, C.; Rigarlsford, G.; King, H. Estimating the greenhouse gas footprint of Knorr. Int. J. Life Cycle Assess. 2011, 16, 50–58. [Google Scholar] [CrossRef]
  30. Jayasundara, S.; Wagner-Riddle, C.; Dias, G.; Kariyapperuma, K.A. Energy and greenhouse gas intensity of corn (Zeamays L.) production in Ontario: A regional assessment. Can. J. Soil Sci. 2014, 94, 77–95. [Google Scholar] [CrossRef]
  31. Iriarte, A.; Rieradevall, J.; Gabarrell, X. Life cycle assessment of sunflower and rapeseed as energy crops under Chilean conditions. J. Clean. Prod. 2010, 18, 336–345. [Google Scholar] [CrossRef]
  32. Gasol, C.M.; Salvia, J.; Serra, J.; Antón, A.; Sevigne, E.; Rieradevall, J.; Gabarrell, X. A life cycle assessment of biodiesel production from winter rape grown in Southern Europe. Biomass Bioenergy 2012, 40, 71–81. [Google Scholar] [CrossRef]
  33. Krzyżaniak, M.; Stolarski, M.; Śnieg, M.; Christou, M.; Alexopoulou, E. Life cycle assessment of Crambe abyssinica production for an integrated multi-product biorefinery. Environ. Biotechnol. 2013, 9, 72–80. [Google Scholar] [CrossRef] [Green Version]
  34. MAF. Carbon Footprint of New Zealand Arable Production–Wheat, Maize. Silage, Maize Grain and Ryegrass Seed; Technical Paper; New Zeland’s Ministry of Agriculture and Forestry: Wellington, New Zealand, 2011.
  35. Kim, S.; Dale, B.E.; Jenkins, R. Life cycle assessment of corn grain and corn stover in the United States. Int. J. Life Cycle Assess. 2009, 14, 160–174. [Google Scholar] [CrossRef]
  36. Williams, A.G.; Audsley, E.; Sandars, D.L. Determining the Environmental Burdens and Resource Use in the Production of Agricultural and Horticultural Commodities; Main Report. Defra Research Project IS0205; Cranfield University and Defra: Bedford, UK, 2006; Available online: http://www.defra.go.uk (accessed on 17 June 2019).
  37. Huerta, J.H.; Alvear, E.M.; Navarro, R.M. Evaluation of two production methods of Chilean wheat by life cycle assessment (LCA). IDESIA 2012, 30, 101–110. [Google Scholar] [CrossRef] [Green Version]
Figure 1. Boundary system for the life cycle assessment (LCA) and life cycle costing (LCC) analysis of the winter rape and maize production. Source: own elaboration.
Sustainability 12 01418 g001
Figure 2. Combined results of the LCC in Polish Złoty (PLN) and global warming potential (GWP) (obtained in the LCA analysis) of the winter rape production for different farming types. Source: own calculations.
Sustainability 12 01418 g002
Figure 3. Combined results of the LCC and GWP (LCA analysis) of grain maize production for different farming types. Source: own calculations.
Sustainability 12 01418 g003
Figure 4. Contribution of field operations with associated inputs to GWP and costs of winter rape production for different farming types. Source: own calculations.
Sustainability 12 01418 g004
Figure 5. Contribution of field operations with associated inputs to GWP and costs of grain maize production for different farming types. Source: own calculations.
Sustainability 12 01418 g005
Figure 6. GWP and costs at preproduction and production life cycle phases of winter rape cultivation in different farming types. Source: own calculations.
Sustainability 12 01418 g006
Figure 7. GWP and costs at preproduction and production life cycle phases of grain maize production for different farming types. Source: own calculations.
Sustainability 12 01418 g007
Figure 8. Aggregated environmental indicator values: abiotic depletion potential (ADP), acidification potential (AP), GWP, eutrophication potential (EP), photochemical ozone creation potential (POCP) per 1 Mg of maize grain (FU) for different farming types. Source: own calculations.
Sustainability 12 01418 g008
Table 1. Production characteristics of the studied farms according to the type of farming (averages from the study years with min–max range in parentheses). Source: own calculations.
SpecificationFarming Type
MilkPigField Crops
UAA 1, ha 53.9
(12.0–338.7)
52.1
(15.2–104.1)
61.8
(11.9–173.5)
Winter rape sowing area, ha5.4
(0.0–18.9)
8.0
(0.0–12.0)
11.9
(0.0–52.0)
Grain maize sowing area, ha1.4
(0.0–18.9)
0.8
(0.0–8.0)
9.2
(0.0–52.0)
Stocking rate, LSU 2 ha−1 UAA1.44
(0.57–4.00)
0.91
(0.30–1.77)
0.00
(0.00–0.04)
Rapeseed yield, Mg ha−13.1
(2.6–3.6)
3.4
(3.0–4.2)
2.6
(1.0–4.0)
Grain maize yield, Mg ha−19.0
(7.9–10.0)
6.6
(6.0–7.1)
9.8
(5.8–13.0)
NPK 3 fertilization, kg NPK ha−1 UAA231.0
(158.4–381.8)
240.5
(73.5–516.9)
256.2
(122.4–399.0)
1 Usable agricultural area, 2 Livestock unit, 3 Nitrogen, phosphorus, and potassium.