Article

Key Factors for Project Crowdfunding Success: An Empirical Study

by
Aladino Fernandez-Blanco
*,
Joaquin Villanueva-Balsera
*,
Vicente Rodriguez-Montequin
and
Henar Moran-Palacios
Project Engineering Department, University of Oviedo, 33004 Oviedo, Spain
*
Authors to whom correspondence should be addressed.
Sustainability 2020, 12(2), 599; https://doi.org/10.3390/su12020599
Submission received: 26 November 2019 / Revised: 26 December 2019 / Accepted: 10 January 2020 / Published: 14 January 2020

Abstract

:
Crowdfunding is a response to the financing problem of innovative projects in an environment of severe economic crisis. Its competitive advantage lies in its independence from banking institutions and the distribution of risk among a certain number of funders. Since its inception, the number of successfully completed projects has grown to a point where it has started to suffer a downturn that puts its sustainability at risk. This study concerns this particular period of downturn, in order to identify attributes that characterize it, and to define behavioral stereotypes that may be associated with new projects. On a wide data set from sufficiently contrasted projects, and through the use data mining techniques, we extracted the most influential factors in determining the success or failure of the projects, that will subsequently be grouped together using clustering techniques. Six groups of projects have been identified, each with their own characteristics that define them, two of them clearly guide the projects to success and another one allows the modification its characteristics to move away from failure. This achieved strategy allows us to estimate which potential group would be the result of a new project.

1. Introduction

Nowadays, it is not easy to finance a novel idea or project. The different entities capable of giving financial support to new projects—far from facilitating credit access—use their administrative tools to make sure that behind each project there is a minimum risk, as low credibility shows the probability of no return on investment, thus avoiding the problem of lack of liquidity during the project’s life cycle [1].
The advance of information and communication technologies allows access to unlimited and immediate sources of information, multiplying the impact of any activity simply by disseminating it across the appropriate forums, social networks or specific platforms [2]. This new environment is particularly suitable for giving access to resource acquisition and improving the market for projects that would otherwise remain stagnant or backward [3].
“Crowdfunding” has emerged as a way of financing ideas and turning them into projects, especially those difficult to finance because of their innovative character. Anyone can contribute economically, either to obtain a reward, or altruistically–for the satisfaction of having collaborated on a project. Thus, a double objective is achieved: obtaining the finance for its development and simultaneously gaining clients, since client and promoter are an indissoluble part of the method in this type of project.
By means of crowdfunding, unlike the traditional sale of products, the necessary funds are advanced, which reduces risk and makes the project development possible. The contact is carried out through specific platforms that connect people interested in a particular type of product with entrepreneurs offering them. Otherwise, they would not come into contact, causing unmet needs and unrealized expectations [4]. So, a crowdfunding campaign is considered “successful” when the project reaches the minimum necessary funds (budgeted in advance) and is usually considered “very successful” if the funds reached exceed the budgeted amount.
The rise of these platforms has been unquestionable since 2006, when the Sellaband platform was created, aimed at raising funds for musical projects. It was the first online platform with an interface just as it is known nowadays. Since then, its number has not stopped growing; 2011 ended with 348 platforms [5] and 2017 closes with more than 2000 active platforms [6] and a large amount of money raised; Kickstarter, the industry’s most popular platform, has accumulated a total revenue of just over $4 Billion [7].
Despite this positive data, crowdfunding has not reached maturity, since the failure rate is far from improving over the time. According to a study by Professor Mollick, based on an extensive database of Kickstarter projects between 2009 and 2012, the average success rate during that period was 48.1% [8]. The data that the platform shows in its statistics are even worse, starting with success rates in 2010 and 2011 of 43% and 46% respectively, and finishing with the last couple of years 2015 and 2016 with 36% and 32% success. 2016 stands out as the first year in which there is a recess in the number of projects proposed for funding, 14.5% less than the previous year [9]. The success rate results of Indiegogo, the second most popular crowdfunding platform, are even lower, as it closed 2015 with a success rate of less than 10% [10].
The sudden popularity of crowdfunding attributed to the impact of the most successful projects, has led to generalize this model to any new project with the risk of maladjustment. In spite of the improvements introduced in the platforms, the apparent facility to obtain financing leads creators to pursue this model, even when there are no real conditions to be successful. To increase success, platforms try to avoid projects with certain associated risks by frequently updating their standards, as they are the most interested part in managing successful projects that make a profit [11].
Leaving aside considerations of taste, aesthetics or fashion, it is essential to know, both for platforms and for entrepreneurs, which criteria represent a greater guarantee of success, in order to avoid unnecessary work, resource consumption and bad image.
The greatest uncertainty for a creator of these projects is whether the required financing will be guaranteed or not, due the lack of reliable methods or tools to direct or reorient a project towards success, as is discussed in Section 2.2. The main motivation for this study is the search for a tool based on the key factors of crowdfunding, these will allow a creator to adapt or modify the trajectory of a project based on a series of “pattern” scenarios with known characteristics. This interest is also stimulated because there is no tool capable of identifying which factors should be modified to guide the success or failure of a particular type of project. This contribution not only benefits the sponsors of the project by ensuring a product, but will also benefit the creator and the platform that hosts the project, contributing to the project funding sustainability. One of the foundations that allows the sustainable growth of this financing model is the constant search for satisfaction in both directions, through the reciprocity provided by this environment [12].
To solve this problem, we performed a retrospective analysis or AAR (After Action Review) of the project results, whether successful or failed, following the guidelines of the Project Management Institute (PMI), to determine the causes. Knowing how, why or what decisions have been taken to achieve the success of the project is crucial if we are to standardize the actions that ensure success or keep the project from failure [13].
We will use a data mining tools on a data set described in Section 4.3, to induce new knowledge from a historical compilation of other projects [14]. For this purpose, it is necessary to perform some preliminary steps of exploration and cleaning in order to limit the problem to our needs. Later, there will be an AAR analysis of the data resulting from the closing of projects in crowdfunding environments.
This process will allow for the grouping of common factors in successful and failed projects, as shown in Section 5.1 and Section 5.2, giving rise to six different types of project stereotypes, characterized by their most influential factors. The advantage for the creator of a project is clear, as comparative models are provided on which to associate any crowdfunding project, discussed in Section 6, allowing us to set a strategy and modify the project variables based on the most appropriate model, even after the funding period has started.

2. Theoretical Framework

2.1. What Is Crowdfunding?

Taking as a starting point the previous idea of “crowdsourcing”—with which it is possible to outsource a work to a group of people through an open call [15]—Michael Sullivan cited the term “crowdfunding” for the first time in his blog Fundavlog, based on the principle of collective collaboration [16]. Later and more accurately, it was defined as: “An open call, primarily through the Internet, for the provision of financial resources, either in the form of a donation or in exchange for some kind of reward and/or voting rights in order to support initiatives for specific purposes” [17].
The advantages of using a crowdfunding platform are several; from speeding up and making bureaucratic procedures cheaper [18], to carrying out matchmaker functions and serving as an advertising window [19]. They are also in charge of supplying the precious resource to the promoter of the idea, only if a certain economic amount is reached [17].
In order to achieve this type of financing, it is necessary to offer a new product or one with a high added value because it is innovative, or other factors differentiate it from the rest, or it is offered at a price clearly below the market price [8]. For this reason, the use of techniques to maximize resources as much as possible—like Bootstrapping techniques—is inexcusable [20].
It is possible to develop crowdfunding techniques through different means, although nowadays it could not be imagined without the use of the internet, both for its ease of access and distribution capacity [8]. The project stakeholders can benefit from the internet while using new communication channels and multiplying the potential of groups and collaborations, simplifying the development of many tasks [21].

2.2. Literature Review

The problem of predicting success or failure not only involves the creator, but also the platforms; for this reason, it is increasingly common to direct the study towards the behavior of the platforms, as their benefits are proportional to the success of the projects [11].
One of the first important contributions using data sets from Kickstarter and supported by the theoretical framework known to date, is a common behavior observed that in most successful projects, it has been observed that the projects that exceed the minimum amount of money for development, do so with a very small profit margin. On the other hand, projects that fail are usually far from reaching this minimum amount, as evidenced by [8] and [22].
It has also been found that a high money collection at the start of the funding campaign is linked to the success of the projects, which underlines the importance of promoting the project from its inception [23]. This behavior is explained by the “U” shaped pattern, observed in a high number of successful projects [24]. As well as the large initial accumulation, there is usually a strong increase in contributions happening at the end of the campaign in these cases, attributed to the fear of the product running out toward the end of the collection. To explain this, Kuppuswamy and Bayus highlight the strong importance of backers for the success of projects adding an explanation linking this fact to the spectator effect [25], which claims that a potential promoter does not contribute to a project of its interest, under the assumption that others will provide the necessary funds [26].
There are also certain features not directly associated with the project, such as the personal attributes of the creator, which are able to condition the decision of the crowd and increase the success rate [27]. Using a crowdfunding data set to connect with external data from social networks such as Facebook or Twitter, Mitra and Gilbert focused their research on the language used in the projects, showing how using persuasion and certain phrases and words reduced the failure rate significantly [28].
The influence of time periods on crowdfunding campaigns has also been studied in depth, Etter et al. extracted characteristics from a data set of 16,000 projects to create success predictors and observe the variation in success rate based on time series, finally reaching 76% accuracy, using a predictor only valid for the first four hours of the campaign [23]. Other authors focus the interest of their studies on shorter periods with the purpose of a taxonomic study [29] or the creation of tools that could lead to the project’s success [30].
The specific use of project updates during publication as well as promotion activities in social networks have shown a high correlation with success [29]—especially in the initial stages, where social impact is most important [22]. It is not surprising that one of the most common reasons that lead to the failure of projects is the inability of creators to connect with investors [8], so there are proposals that recommend investors use Twitter, since the importance of this social network as a powerful tool for improving the success of projects has been observed, as evidenced by [31] and [32].

3. Crowdfunding as a Project-Financing Method

3.1. Fundamentals of Crowdfunding

The economic growth of a country is not understood unless it is supported by technological development and innovation, in order to gain adaptability by incorporating new techniques and increasing the efficiency of processes [33]. Even in periods of financial restriction, investment in innovation can be a stimulus for companies aimed at reducing production [34].
Environmental conditions are key to generating confidence in an investor, as external factors can contribute negatively and even lead to the failure of a technically successful project [35]. In an environment of economic crisis, projects with high levels of innovation cause an aversion for a non-specialized investor, due to the risk of the unknown and the uncertainty of the novelty itself [3]. Thus, these projects are often the most fragile and punished.
These economic constraints have led to the birth of the crowdfunding functional ecosystem [36], thanks to a considerable reduction in the sense of risk by dividing the economic target into many smaller parts, as many as backers. In contrast to traditional financing based on project portfolio, in a new or an emerging company have not an organisational structure to manage the financing [37].
The figure of the single investor characteristic of traditional of project finance models becomes a multitude of potential investors, who can collaborate in the development of a project with a small economic contribution, with the advantage that there is no intermediary, only a virtual platform and its managers. This small contribution becomes actual only if a minimum amount is reached, which is fixed beforehand. Otherwise, the amount contributed is returned. This system, known as “All-Or-Nothing”, contrasts with other known models and is used on most platforms of this type because it requires more involvement on the part of the entrepreneur and reduces the risk for the project collaborator [38]. On the other hand, it also provides a sign of confidence to potential contributors to the project since this system reveals the funds retained from the rest of contributors [39].
Table 1 compares the main attributes that differentiate traditional financing methods and crowdfunding.

3.2. Challenges of Crowdfunded Projects

To carry out ambitious projects or innovation through mass funding may be a not so obvious need for a creator, due to the skepticism caused by the direct loss of control, with the inclusion of new elements such as the uncertainty of non-compliance [40]. In addition to the intrinsic danger of using the internet as a medium, which involves accepting the challenge of navigating a very active environment susceptible to change, constantly stimulated by collective trends, updates, etc., this fact is also able to threaten projects with important innovation factor in their products, such as highly technological ones [41].
Part of the solution to these problems is mitigated by making use of the high capacity for sharing on blogs [42]. Blogs open the door to a multitude of users, from enthusiasts to specialists, who can provide solutions to various problems [43], and even generate valuable feedback during the development of the project, thus making it possible to improve the adaptation of the product to the environment and the user, complementing behavioral, technical and contextual skills [44].
On the other hand, sharing ideas or knowledge without any type of protection, intellectual or any other, increases the risk of plagiarism [19], which is further aggravated if the project does not reach the minimum necessary amount, since it cannot be funded despite having been publicized both on the platform itself and on social networks [45], once the funding is cancelled, it is not possible to present the project on the same platform, because one of the admission criteria is the originality of the projects.

4. Research Methodology

4.1. Research Settings

The use of data science techniques allows us to relate each factor with the final success, which is particularly useful in sectors where it is necessary to study a huge amount of data [46]. Its potential lies in the capability to extract information beyond a simple relationship between variables, using statistical analysis software among others [47]. To perform this process, we will use the CRISP-DM methodology (Cross Industry Standard Process for Data Mining), because it is flexible and sufficiently tested to allow for the conversion of data into knowledge in an organized way [48]. It consists of six iterative phases ensuring that each analysis process benefits from previous experience.
Once the data set has been adapted to the needs of this study, the projects will be grouped based on their similarity. This new structure allows a new characterization while expanding information to create self-organized maps, which by their visual and abstract nature help to identify areas of projects that share properties and then analyze them individually. Subsequently, it is necessary to use indicators based on success and failure that will contribute greatly to the characterization of each of the stereotypes.
The application of the methodology used is focused on providing fidelity to the techniques used, and avoiding the use of variables that add uncertainty to the results. In this way, the value of the existing information is increased by adding new links between the factors that condition success, greatly facilitating the characterization of a project according to its properties and most influential factors.

4.2. Data Collection

The selection of Kickstarter as a data source is attributed to its leadership and wide popularity, as it appears in the top five hundred most searched websites in the world [49], with a contribution to the success of more than 167,000 projects since its creation [50].
We use a public raw data set, which has been used partially by several authors and includes a significant time window for crowdfunding, in which there is a sustained growth in the number of projects funded [9]. This data set is characterized by gathering information without a clearly defined objective and includes 45,815 projects developed between March 2009 and January 2012, arranged into 12 categories: Art, Comics, Dance, Design, Fashion, Food, Games, Music, Photography, Publishing, Technology and Theater [51].
For this study, only the projects that have been performed are selected, those that did not reach the end are not part of the study and therefore those that are alive or have been cancelled by the platform or the creator are left out and without opportunity as explained at the end of Section 3.2. As a result, a data set with 23,941 projects highly representative for this study and in which 55.28% of the projects are successful is obtained. Table 2 shows the number of projects by category, success rate and number of backers.
However, some of the projects that collect over the minimum necessary do it a very small margin [8], so high collection values have not been deleted in order to analyze whether this subset can form a group with common characteristics, unlike other authors who do not consider them relevant for their study [52].

4.3. Variables Review

Eight numerical attributes are selected from the original data set, specifically those which can provide more information without limiting the model development. In order to enhance the magnitude of the study, new attributes capable of providing new information have also been created. In summary, the data set consists of 13 useful attributes, shown in Table 3 with their description.
According to its value during the financing period, three types of attributes are identified:
  • Fixed variables. The project creator must assign their values before the funding campaign: Goal, Month, Levels, Duration, Min_RL, Max_RL, Range_RL.
  • Development variables. They are only modified with the efforts of the creator during the development of the campaign: Comments, Updates and Backers.
  • Indicator variables. They are dependent on the previous ones and give an idea of the final impact of the financing: Pledged, Rate_Pledge_Goal, Pledged_Backer.
Mitra and Gilbert assessed a binary variable for their study, which identified which projects were successful or failed [28]. In this case, success is defined as the projects with a pledged value equal to or greater than the goal, and failure as the opposite case.
As a first contact with the data, the linear correlation of the attributes of the data set is studied. Figure 1 shows the correlation of variables selected for this study.
The high correlation between Backers, Pledged and Comments has already been observed previously, albeit partially [22,53].
The apparent correlation between Range_RL and Max_RL, as well as the absence of it between Rate_Pledge_Goal and the rest of the variables, denotes the need to use more advanced methods that provide more information than linear ones, such as the use of multivariate techniques.

5. Clustering Methodology

5.1. Justification of Use

The generalization in data collection allows the development of sophisticated techniques for extracting knowledge from information and data. These techniques are embedded within the KDD (Knowledge Discovery in Databases) analysis stage and are known as data mining techniques. The use of these techniques enables subsequent clustering of projects for labeling, following the principle of “maximizing the intraclass similarity and minimizing the interclass similarity” [14].
This approach is based on the behavior of artificial neural networks, where the process starts with a project as an input and, through a competitive process associated with each neuron, generates a new vector called centroid, which is representative of all the projects related by this process.
Subsequently, in order to group the input in k sets, the “K-means” algorithm is chosen as the most appropriate clustering model due to its non-hierarchical nature [54]. The Davies–Bouldin index is used to identify the optimum value of k. This index can be interpreted as the distance of each case to the newly identified cluster. The index decreases when the items in each cluster are more homogeneous [55]. Following this criterion, the algorithm distinguishes seventy neurons distributed in six clusters as the optimal value of k.
In Figure 2, each of the six clusters obtained is shown by colors. This is the result of applying the K-means technique on the grid of representative centroids identified using SOM.

5.2. Analysis of Success and Failure

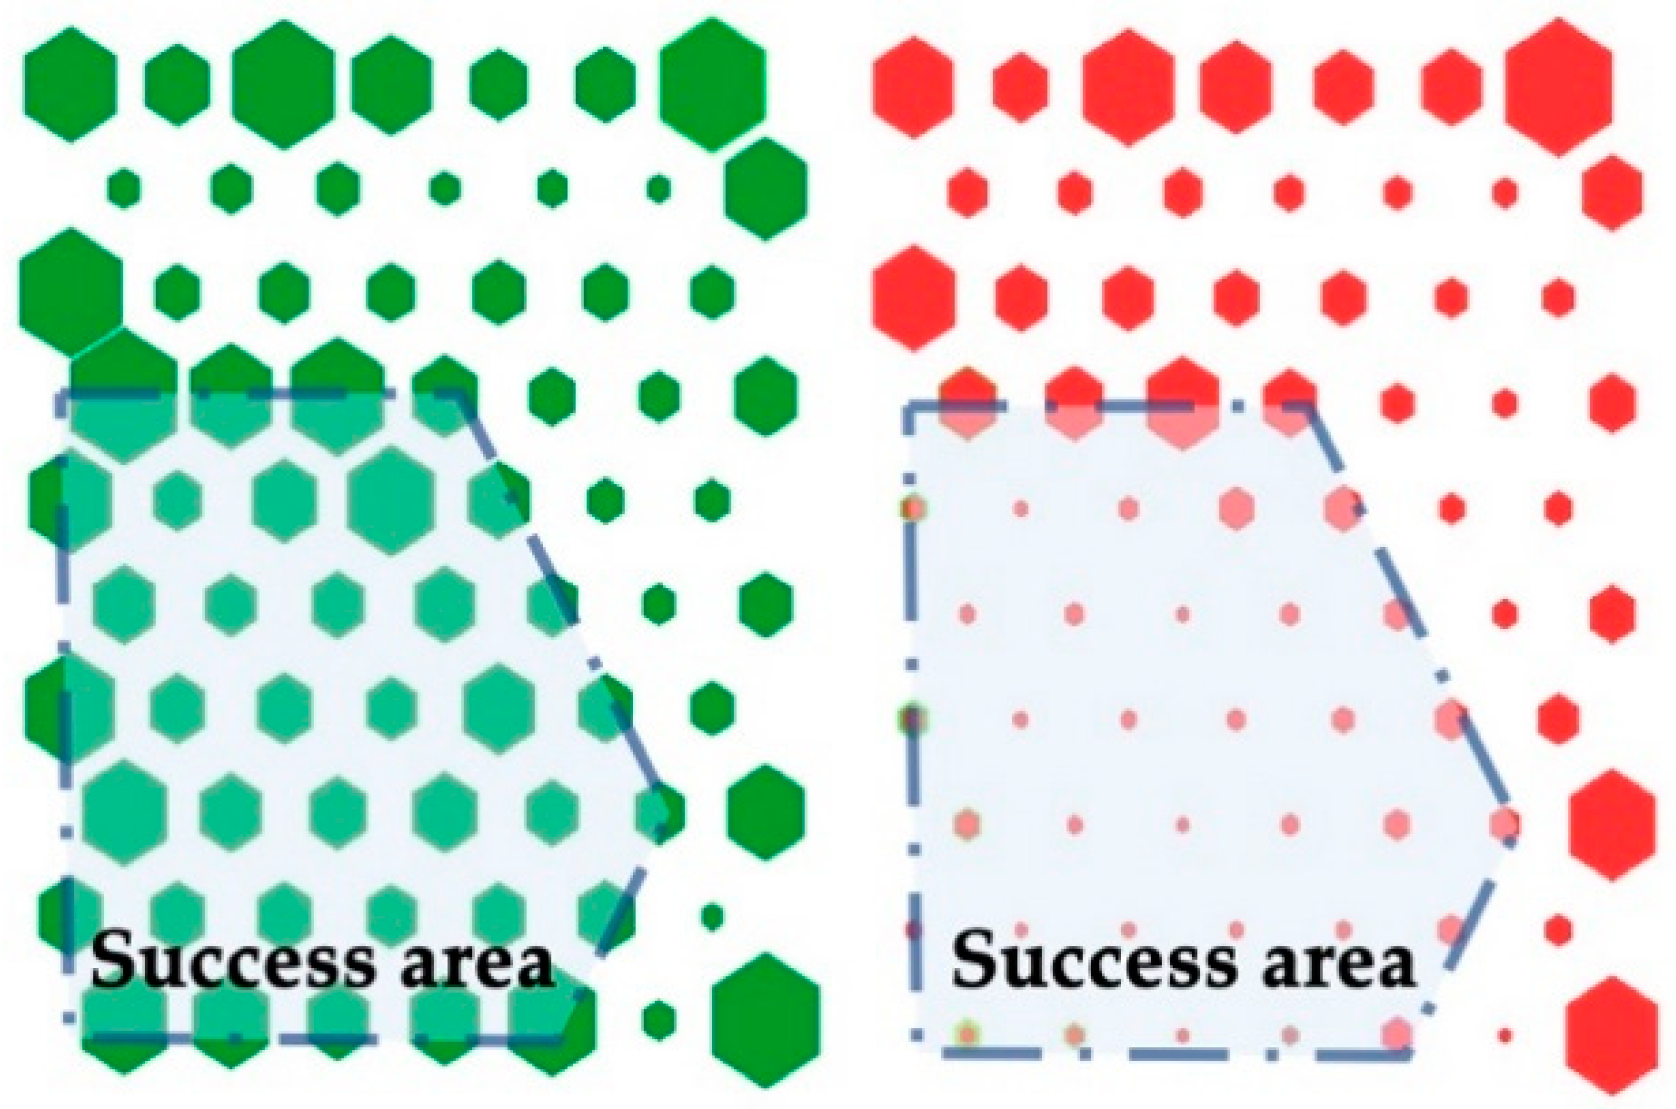
Starting from the neuron grid generated for the k-means cluster map, the number of projects labeled as success or failure is displayed. To allow the understanding of the chart, the size of each cell has been drawn proportionally to the number of projects it contains. In this way, Figure 3 shows the two projections made on Figure 2, one of success in green and failure in red. By superimposing these on the k-means cluster map it is possible to identify which zones or which clusters have more success or failure.
When comparing the two charts, there is an area of high interest, since it contains a higher number of successful projects and a reduced number of failed projects—the area in the lower left of the chart. This section is defined as a “Success Area”, and can be associated with clusters 3 and 2 in Figure 2. Both clusters make up 43.64% of the total of successful projects, with a relation ratio of 76% of success and only 24% of failure, which is clearly differentiated in the success–failure ratio in the initial data set.
Likewise, another section of the chart can be defined as a “Failure Area” (top section), that includes clusters 1 and 5 where 58.90% of all failed projects are located, with a 40% success rate and 60% failure rate, representing the inverse behavior to the initial set.

5.3. Cluster Taxonomy

Once the neurons that belong to each cluster have been identified, a first characterization of clusters is carried out based on the number of projects that continue and the proportion of successful and failed ones—the authors commonly call it success rate.
Table 4 shows the projects classified by cluster and success rate. Clusters 2, 3 and 4 are highlighted for surpassing the success rate, while the rest of the clusters are below.
Since the sample does not show a normal distribution, it was decided that we should use the non-parametric Kruskal–Wallis test, in order to test whether the samples presented the same distribution, and identify if there were significant differences between clusters.
The results obtained with all the attributes determined that there were statistically significant differences between the distribution of each variable among the clusters. Therefore, the behavior of the attributes that define each cluster can be analyzed.
Table 5 shows the location in each cluster of the maximum and minimum average values for each variable—the empty cells indicate that there is no variable taking the highest or lowest values in that cluster.
Using the duration attribute as a guideline, the projects with the highest average duration are classified in cluster 1, whereas those with the lowest duration are classified in cluster 5. The same reasoning can be applied to the rest of the attributes.

5.4. Self-Organizing Map Analysis

The presence of similar behavior between projects is analyzed by the generation of clusters using Self-Organizing Maps (SOM), a technique introduced by Teuvo Kohonen [56], which has been previously used to determine the success or failure of projects, based on determining the project characteristics of groups [57].
The SOM model allows us to cluster a new project in a grid area and associate it with the trend of success or failure. However, it is necessary to characterize each cluster in order to know the suitability of a project according to the cluster to which it belongs.
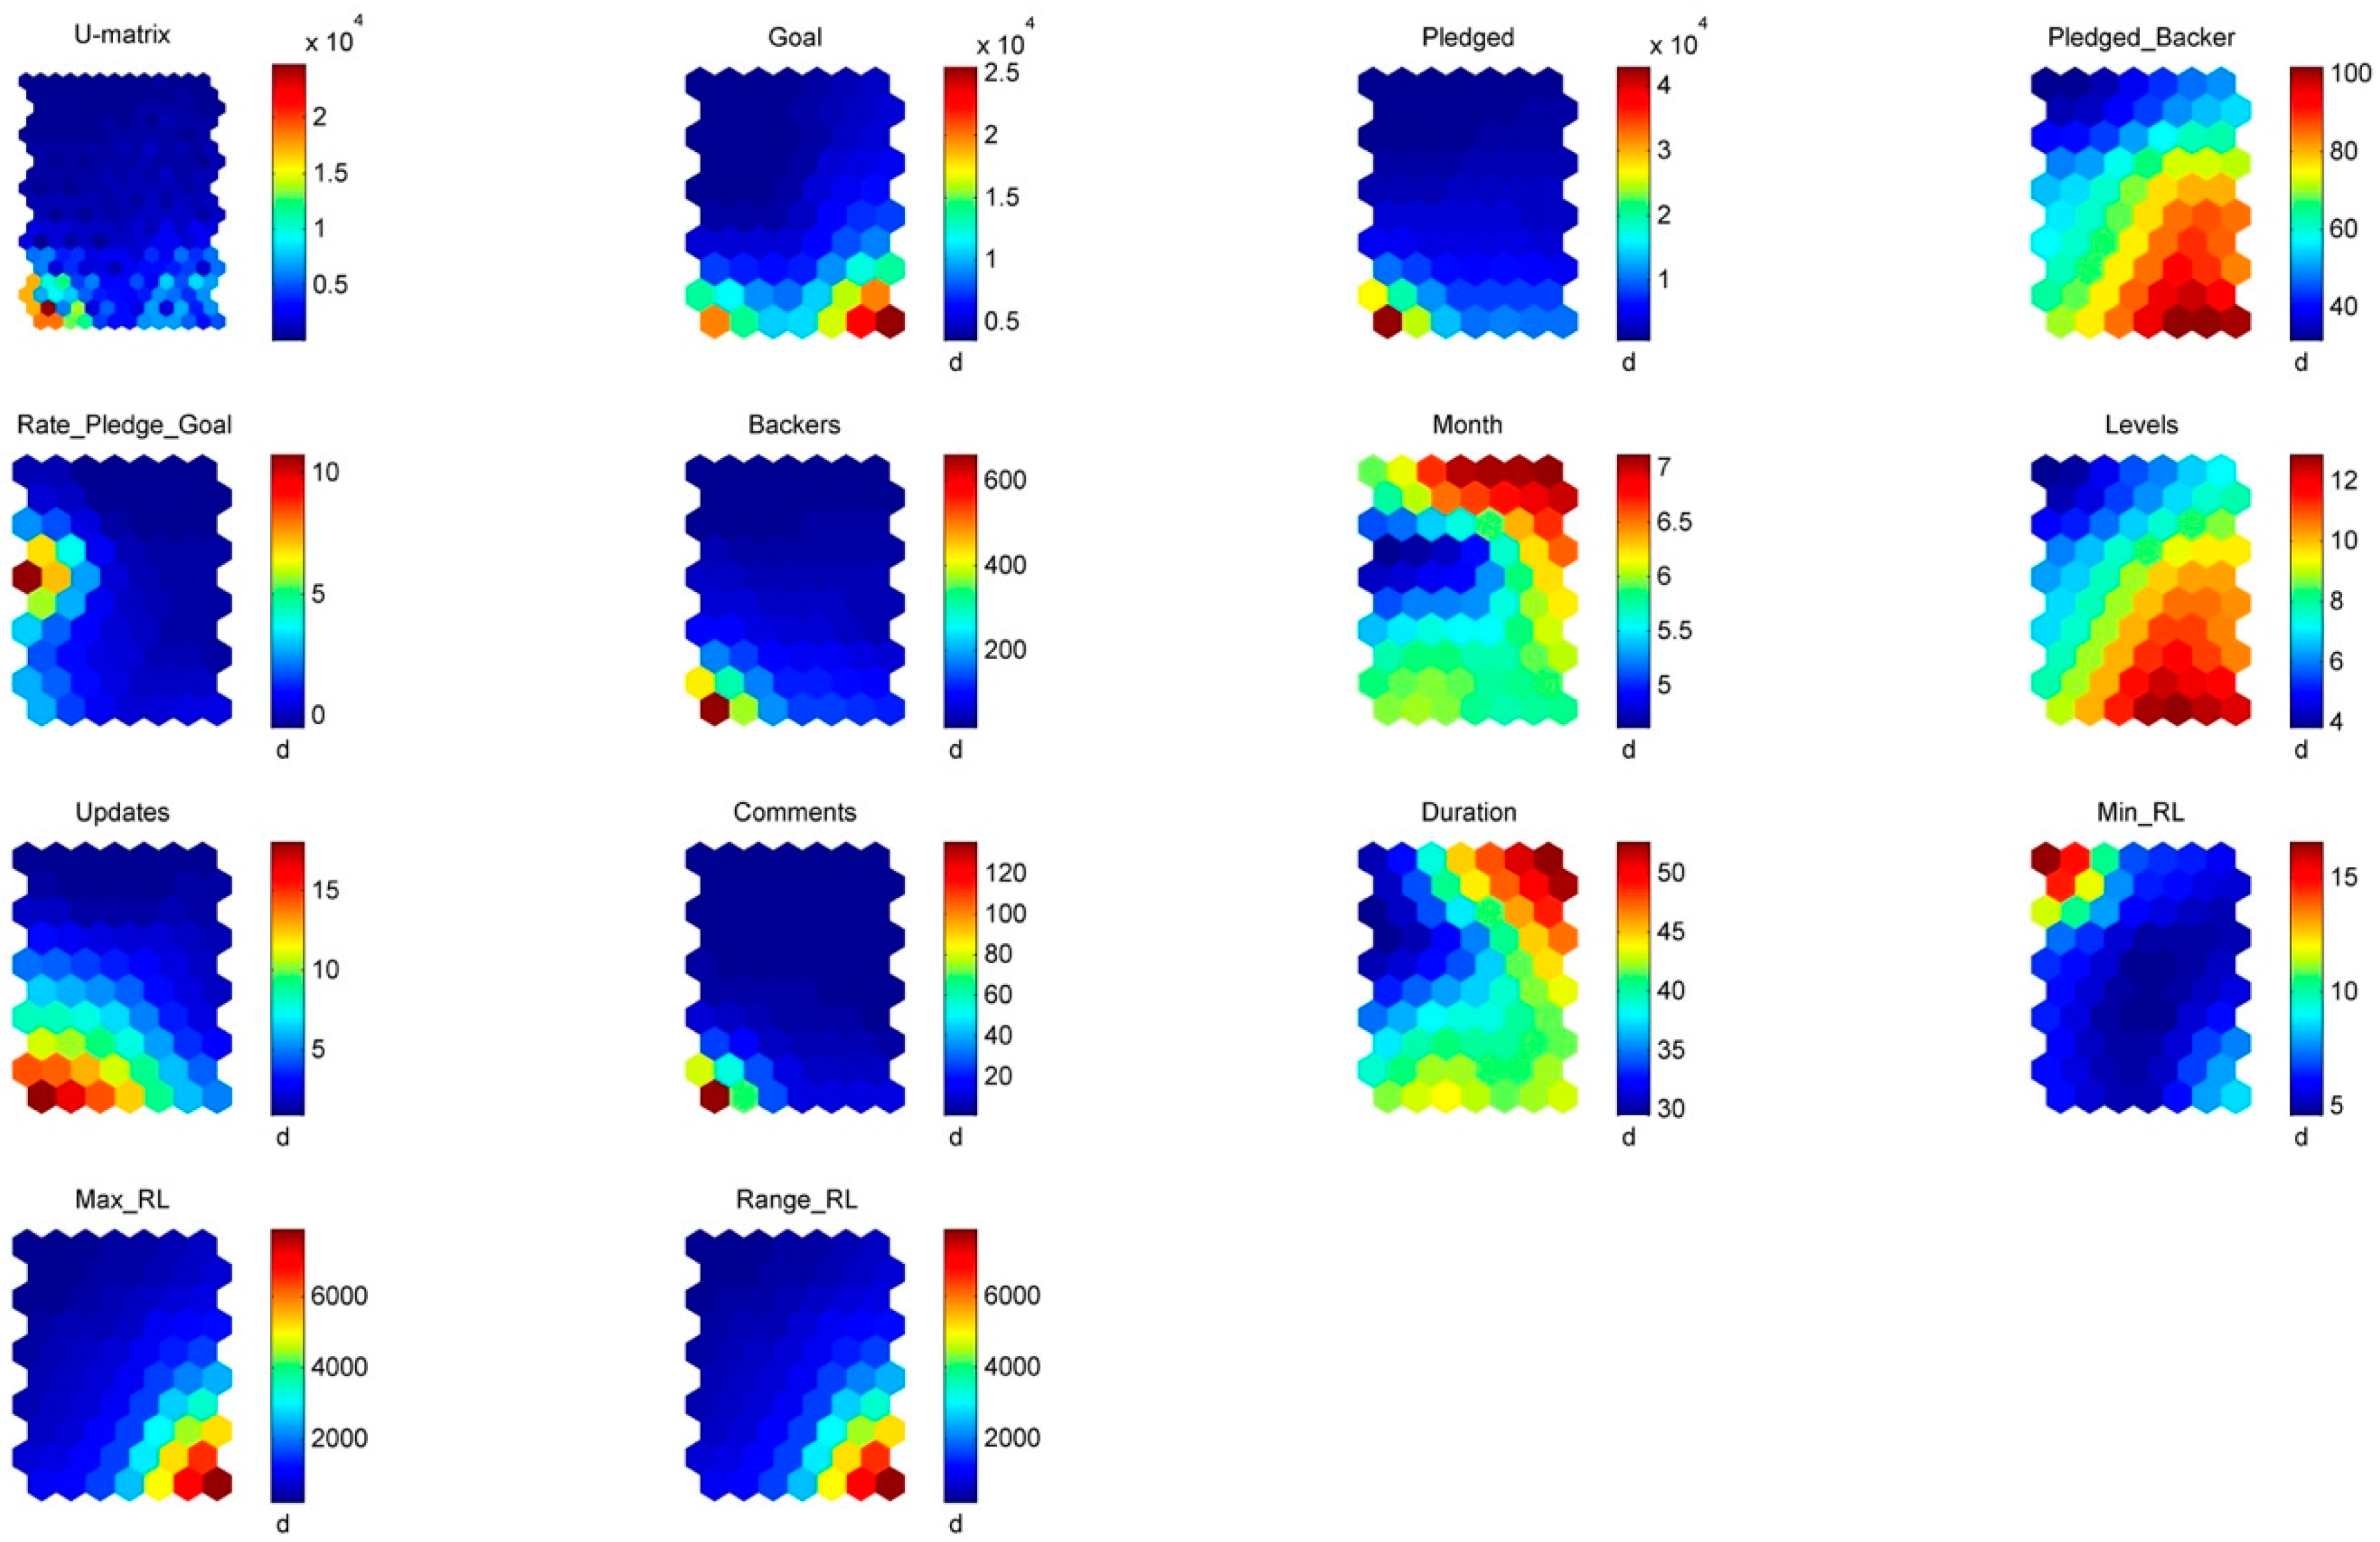
In order to extend the capabilities of the study, starting from the results of the SOM, a graph is created using the U-matrix, in which the distance between the centroid of each neuron and its closest neighbors is represented. It can be read that the low values represent a high degree of similarity between neurons in that region.
Figure 4 consists of the SOM model U-matrix followed by thirteen charts, one for each variable. In the chart of the variables, each cell color represents the value taken by that variable in the centroid of the neuron. This rendering allows the comparison of one or several attributes through the grid.
The maps for Backers, Pledged, Comments and Updates take the highest values in the lower left corner, where there is also less similarity or greater distance between the centroids, as indicated by the U-matrix.
The decentralization of the Goal variable should be highlighted—taking high values in two different groups. The zone with higher Goal values is related to zones of high value in Max_RL and Range_RL and, although to a lesser extent, to zones of high value in Pledged_Backer and Levels. On the other hand, the area with not so high Goal values corresponds to high values of Backers, Updates, Pledged and Comments, which complement the importance of the Updates during the collection campaign, a trend observed by other authors [29].
The attribute Rate_Pledge_Goal—or success quantity—although it is calculated from the information of Pledged, shows no relationship in the maps between them. This means that this new variable provides additional information to that initially provided by Pledged.

5.5. Cluster Success Characterization

After analyzing the cluster-attribute performance, the relationship between the different project categories and each cluster is considered. For this purpose, Table 6 shows the percentage of successful projects in each cluster by category, with green indicating values over 50% and red indicating values below.
This success distribution provides valuable information for subsequent cluster characterization but does not consider the number of projects in each cell. In order to do this, indicators are defined to quantify the success distribution by category and cluster considering the overall category success.
Table 7 provides the total number of projects by category and cluster which, together with Table 6, allows for a better understanding of the distribution of success.
At first, two indexes are defined, which allow for the monitoring of both successful and failed projects. SRI (Success Rate Index) assesses the number of successful projects in relation to those that have failed, whereas FRI (Fail Rate Index) assesses the number of failed projects with respect to those that have been successful. In both cases, they are calculated for each category and cluster.
SRI i , j = S i , j F i , j
FRI i , j = 1 SRI i , j
Let i denote the list of twelve project categories, and let j denote the six clusters. S and F correspond to the number of successful projects and the number of failed projects, respectively.
In order to increase the significance of SRI and FRI, two other indexes are defined: SOA (Success ratio Over the Average) and FOA (Fail ratio Over the Average). High SOA values in a cluster indicate that a category has a success rate above the overall average; similarly, high FOA values indicate that a category has a failure rate above the overall average. They help us to understand whether a category is highly successful or not, depending on the total success or failure by category.
SOA i , j = SRI i , j SRI i ¯ SRI i ¯
FOA i , j = FRI i , j FRI i ¯ FRI ¯ i
Let S R I ¯ i denote average of success rate index, and F R I ¯ i denote average of fail rate index in the i category.
Table A1 in Appendix A shows the distribution of the mean values obtained for SOA and FOA by category and cluster, and Table A2 in 
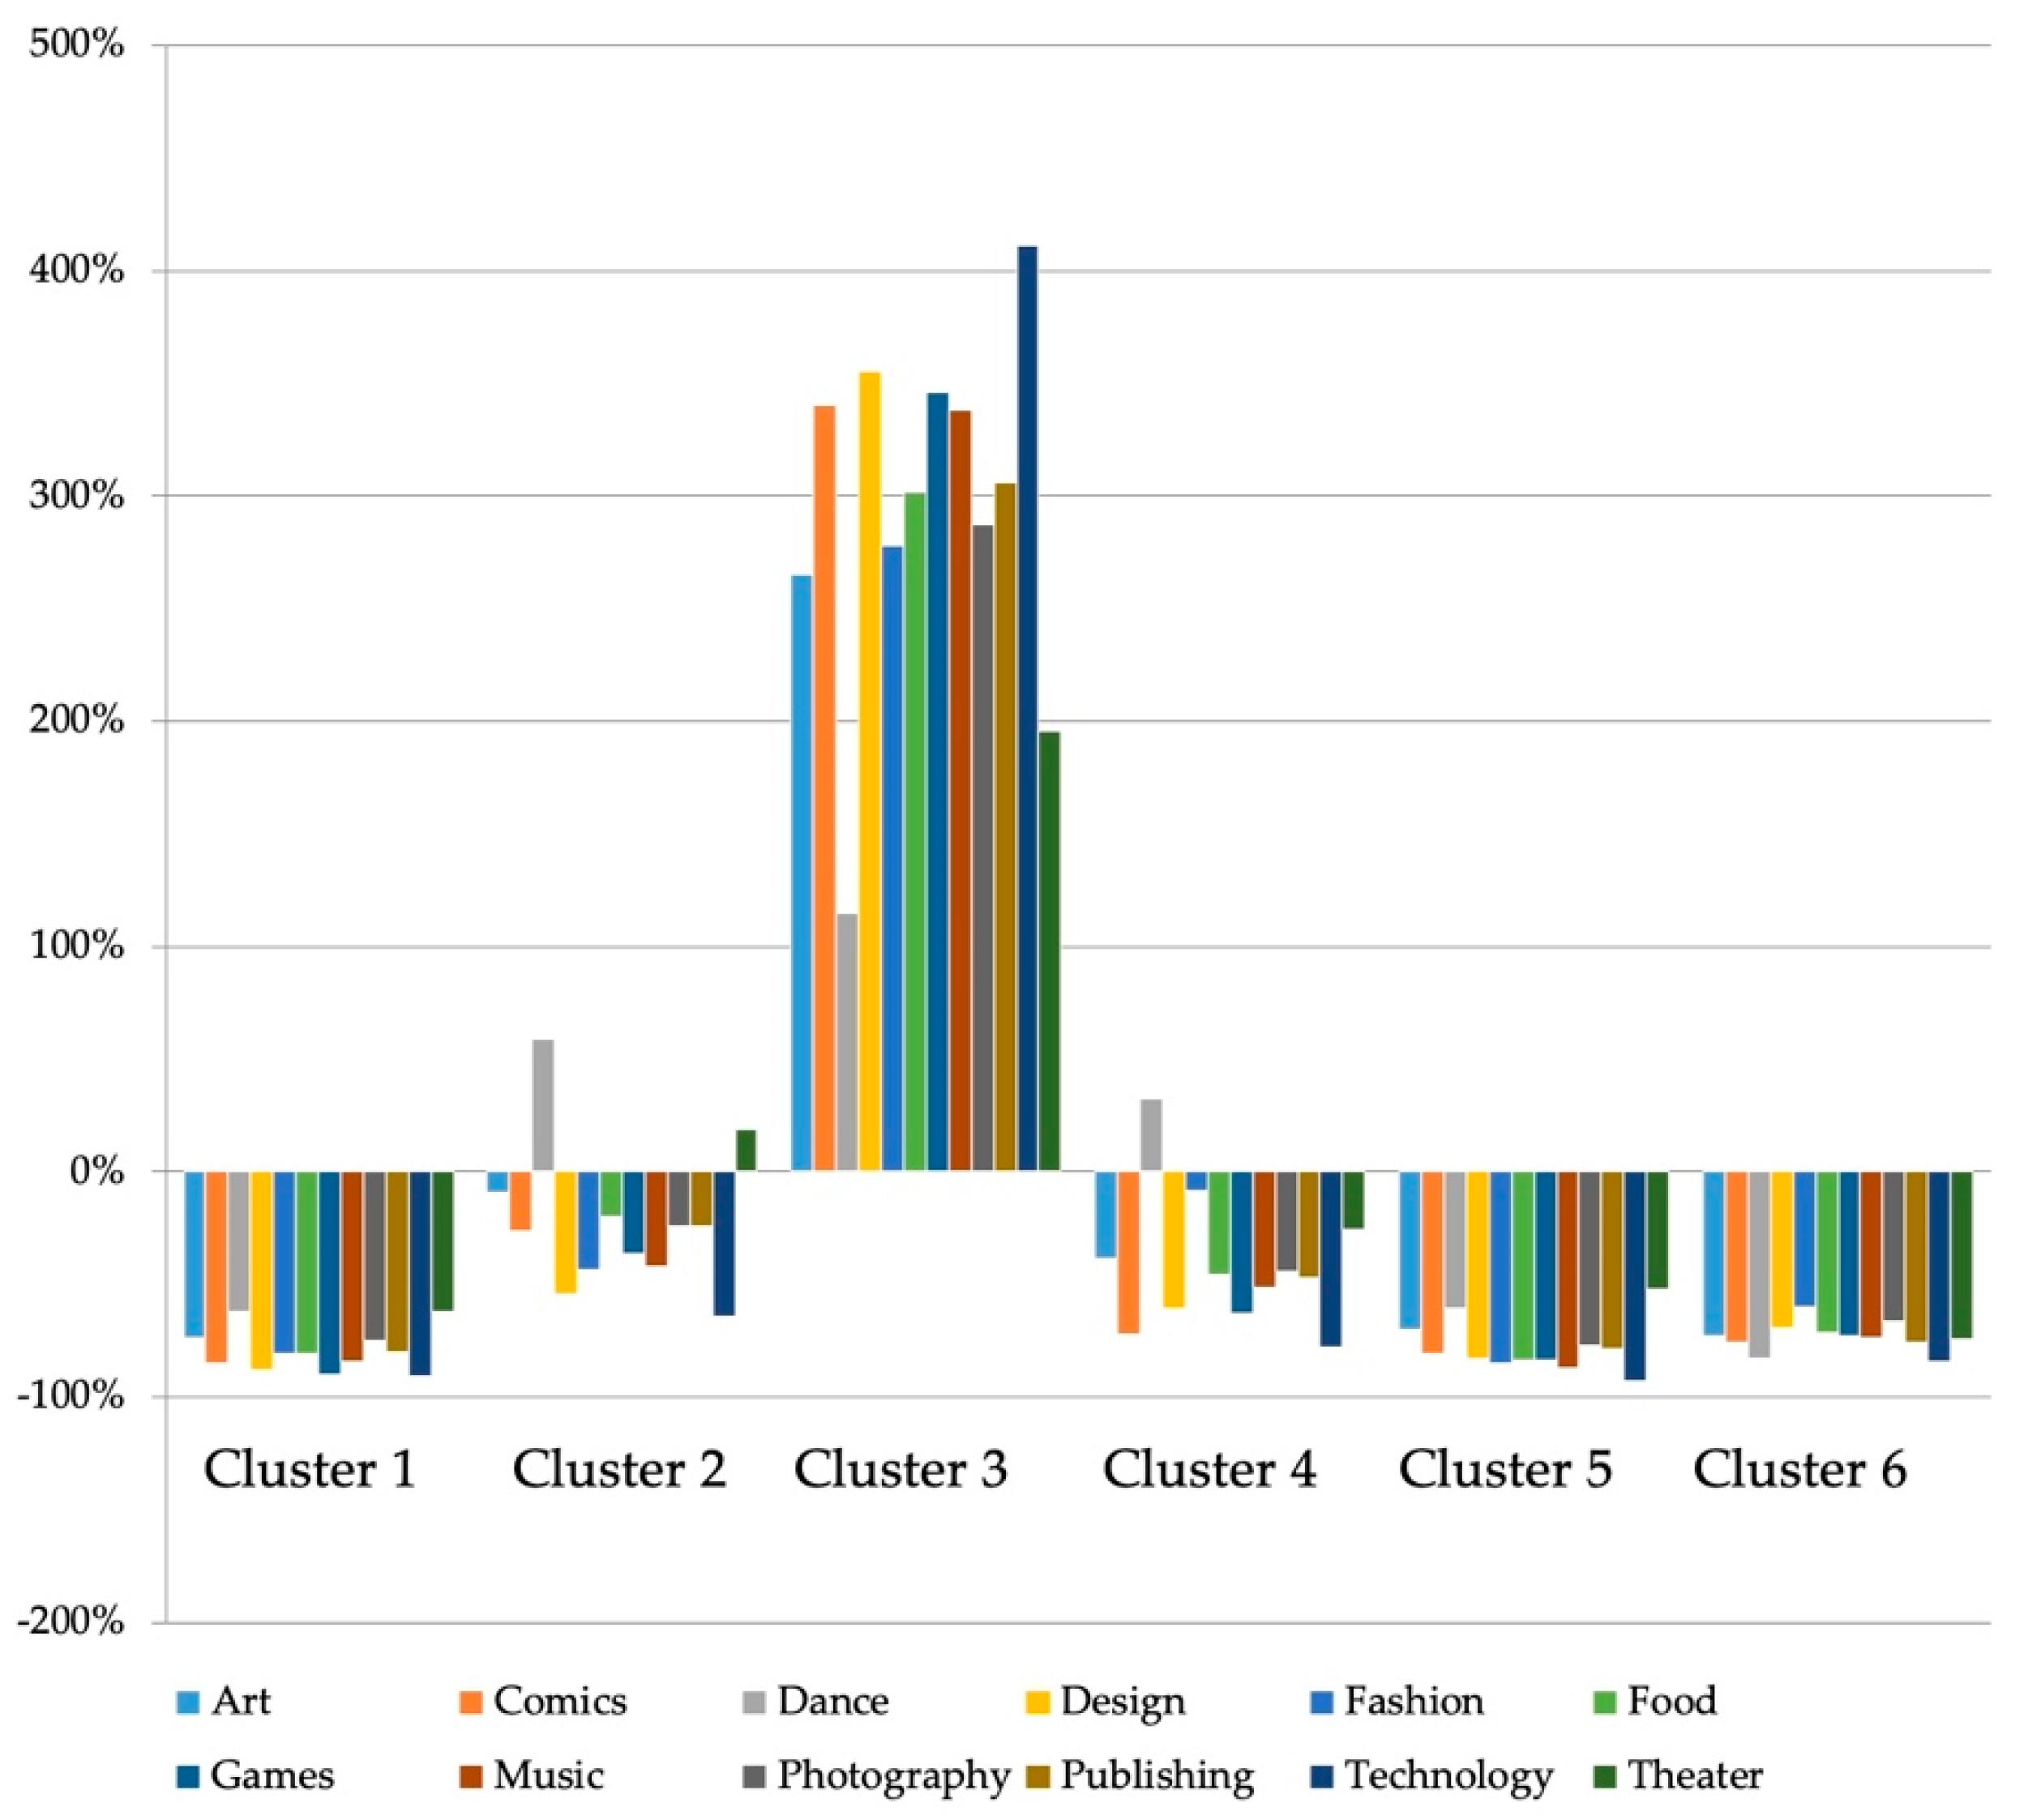
Appendix A shows the mean, median and standard deviation taken by the SRI, FRI, SOA and FOA indicators in each cluster. It should be noted that SOA and FOA are shown as percentages because they are relative values calculated according to SRI and FRI, respectively.
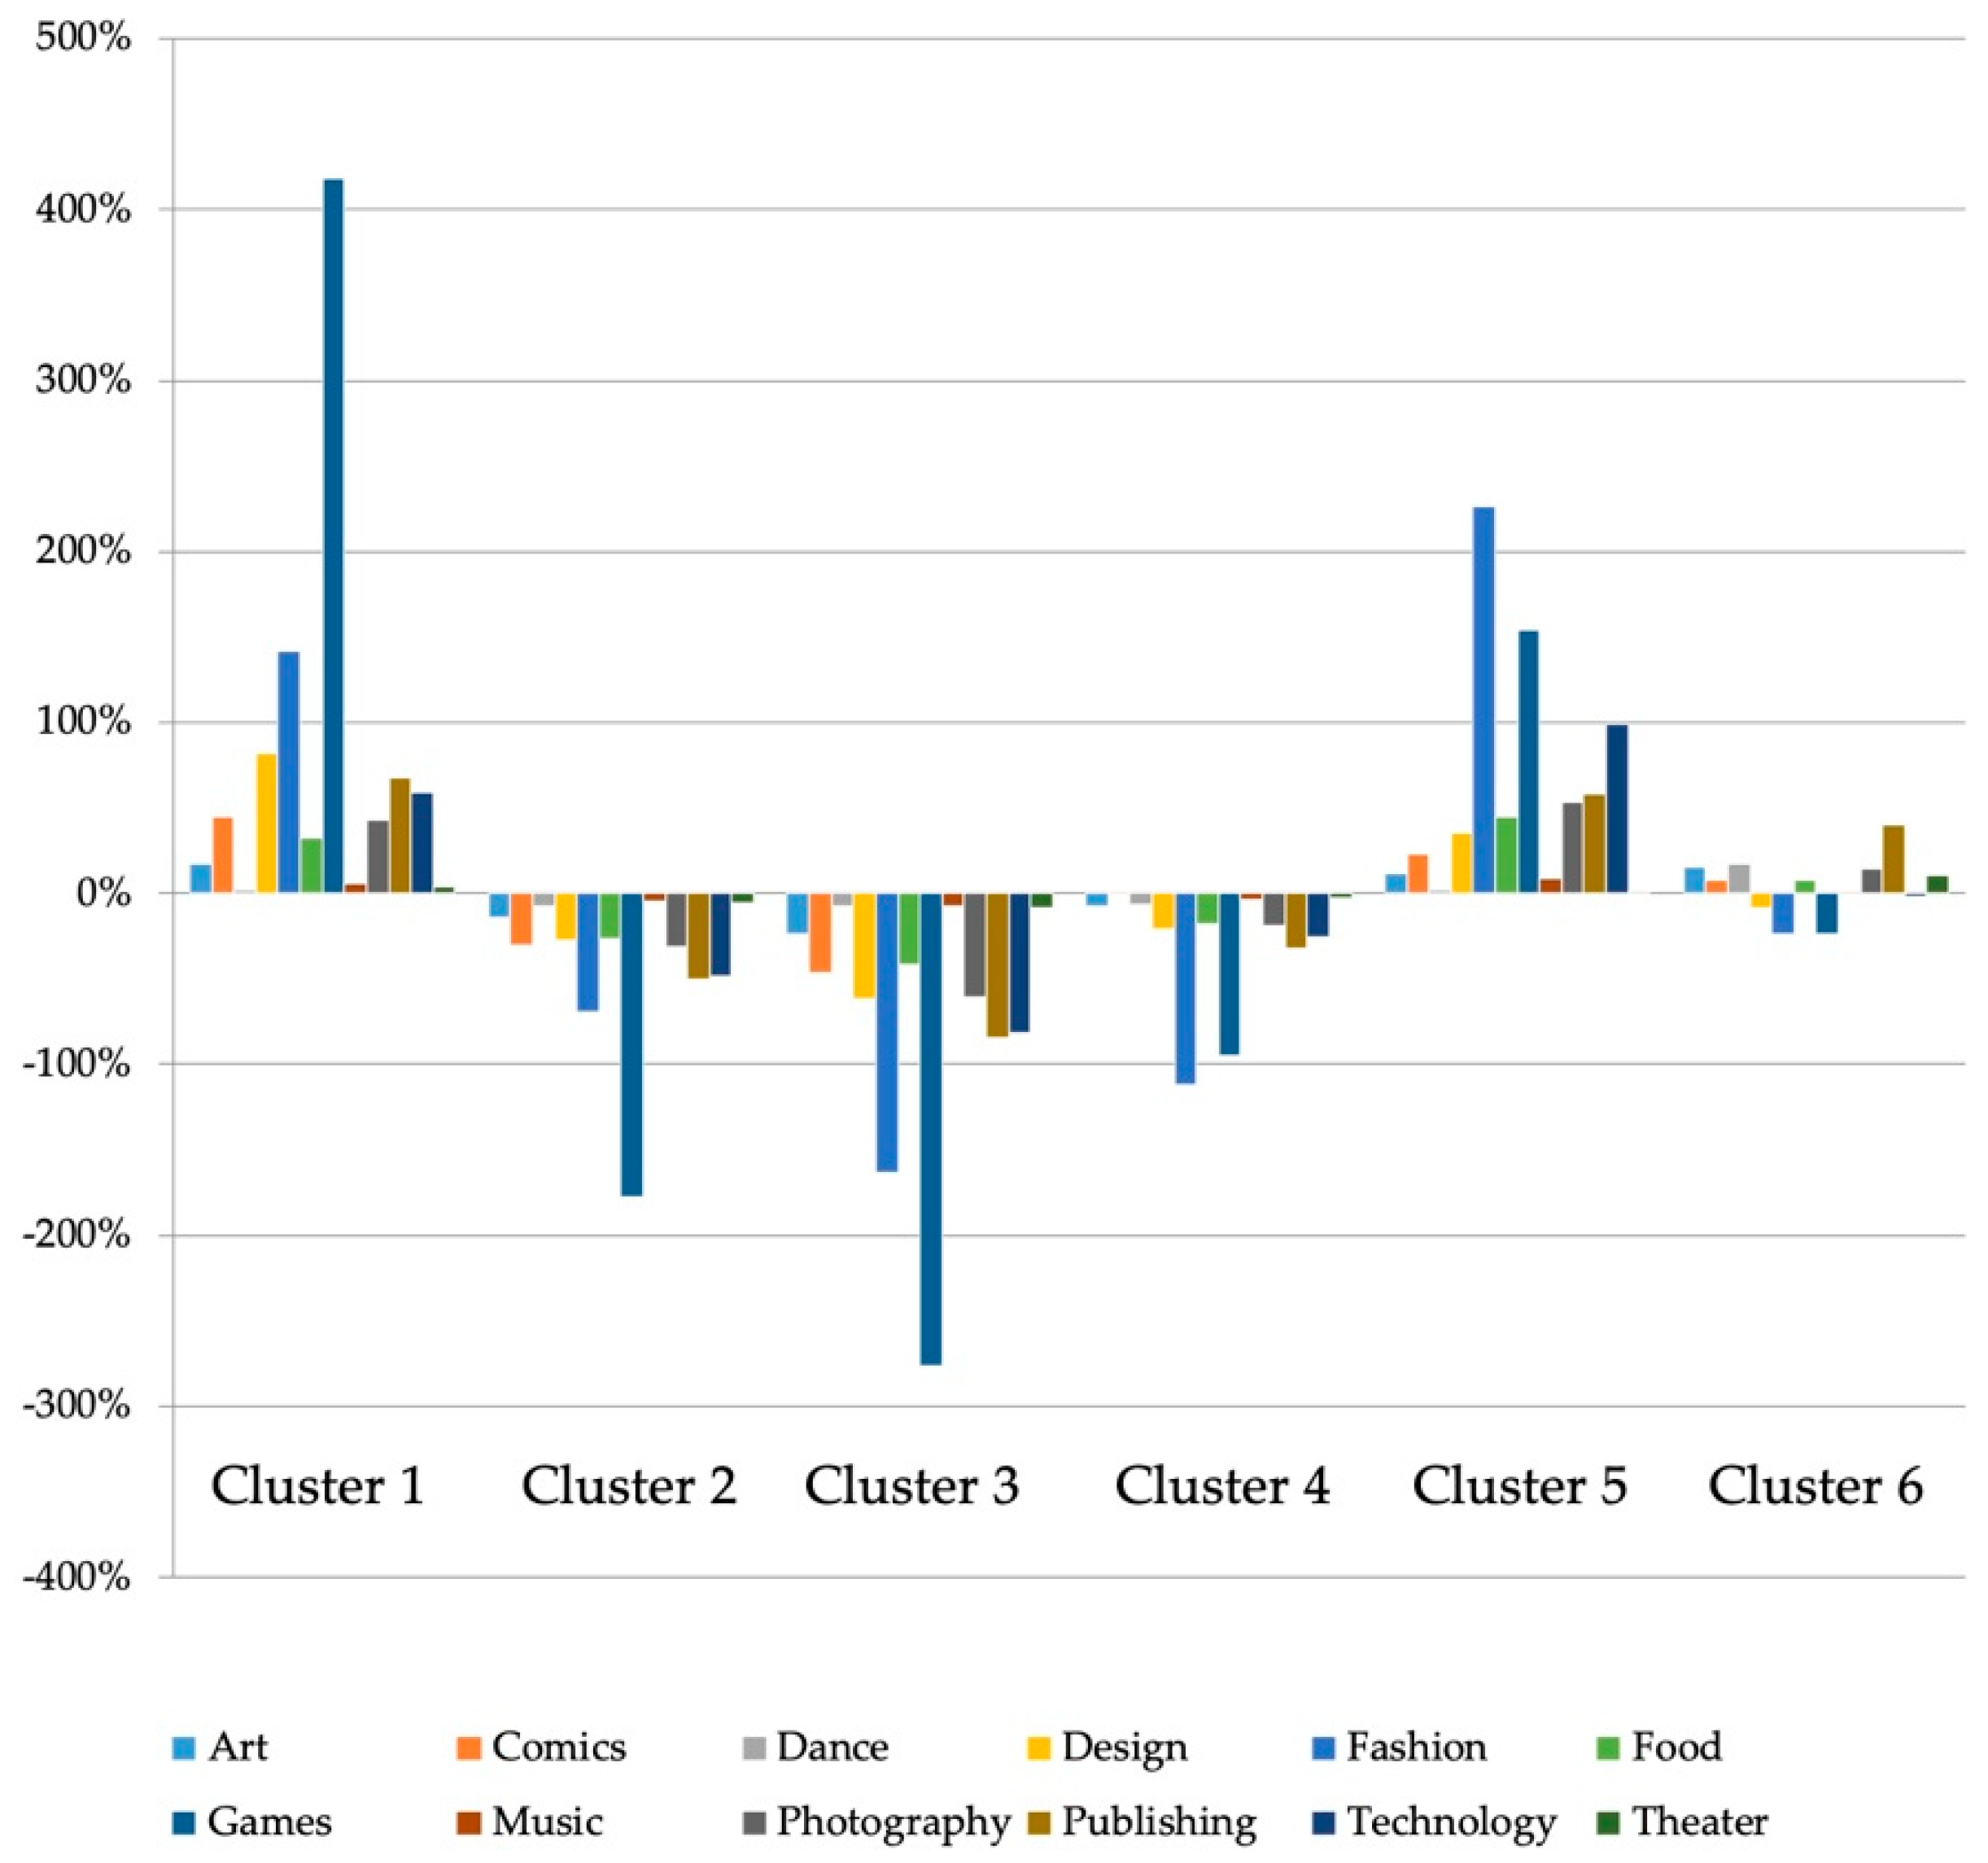
Figure 5 represents SOA indexes, where cluster 3 stands out for having a success rate above average in all project categories. The technology category stands out for having the highest values of SOA, surpassing the success rate of the cluster by more than four times in this particular category. With regard to the rest of the clusters, attention should be drawn to Dance in clusters 2 and 4, and Theater in cluster 2.
In contrast with the previous indicator, in the case of FOA in Figure 6, clusters 1 and 5 stand out as the most unfavorable, especially for the Games category—which has the highest failure rate—as well as Fashion category in cluster 5.

6. Discussion

Six clusters have been identified by similarities in the characteristics of the attributes. They can be summarized in the two major groups identified in Figure 3 as a success area. The greatest number of projects that achieve the success and the least number of failures are in that area.
Subsequently, relative indices have been calculated which make it possible to identify the extent of success and failure with respect to that achieved by the category average.
The strategy used to carry out the discussion of the paper consists of analyzing the attributes that define each one of the clusters, taking information from Table 5, as well as the behavior of the SOA and FOA indicators in each one of the clusters, information that is taken from Figure 5 and Figure 6.
Merging these two information sources allows us to know the characteristics of each group, and which success or failure index would be expected by each category inside them.
It starts by defining the behavior of each cluster by the representative attributes in each one.
Observing the Pledged, Comments, Updates and Backers projections in the maps of 
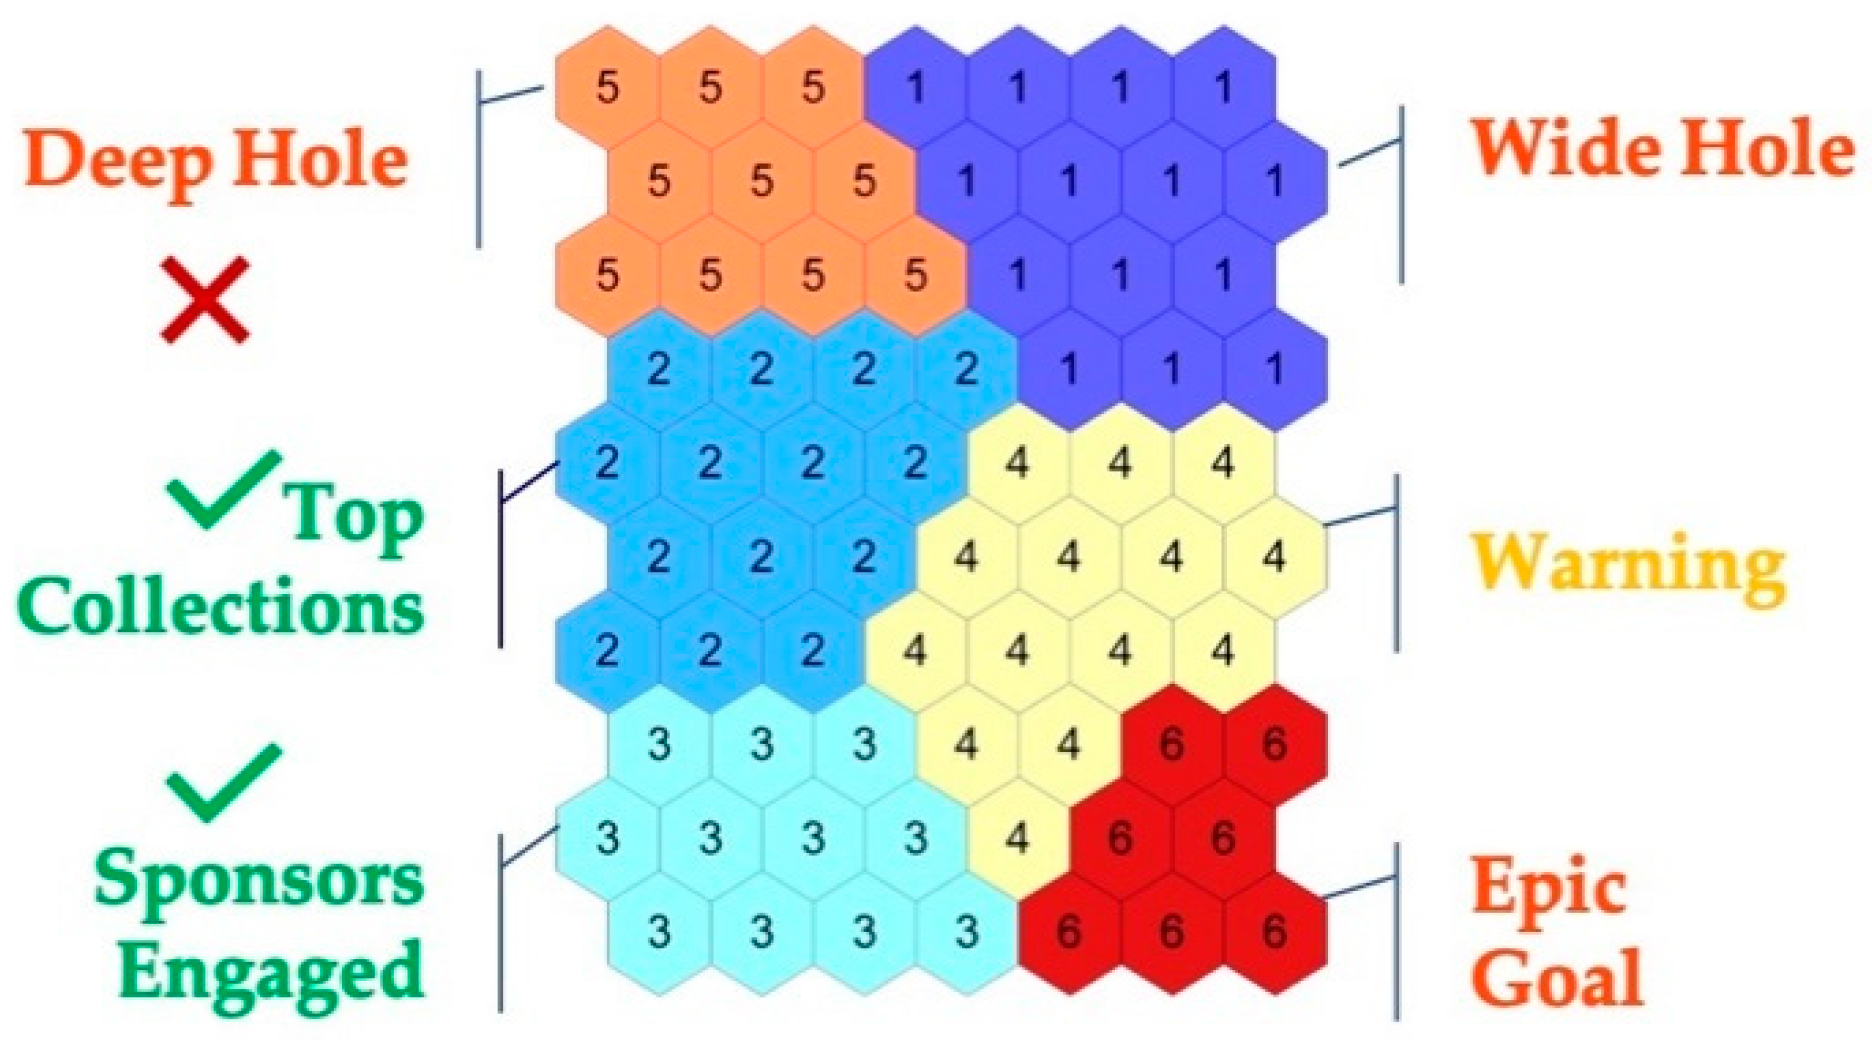
Figure 4, the similarities in the distribution of these variables are appreciated, since the highest values are grouped in the lower left corner of each map, which also corresponds to cluster 3 in Figure 7. Cluster 3 is associated with a likely success of the project, since the SOA index is very positive for all categories, as well as no FOA index being positive.
This relationship underscores the importance of maintaining high values in these attributes in order to set the goal of success. Three of these attributes are classified as “Development Variables”, which mean that they can be modified during the development of the funding campaign to strengthen the project and induce success. For all these reasons, this is known as the “Sponsors Engaged”.
The characteristics of cluster 3 are indisputable when aiming to prioritize the success of projects, but not to maximize profits. Even for categories associated with the performing arts, where success is scattered, it is in cluster 3 where the highest SOA values are found.
As shown in Table 5, cluster 2 contains the highest average collection values for Rate_Pledged_Goal, as well as the second highest average SRI value (2.47). Therefore, cluster 2 is renamed “Top Collections”. This is reflected in the fact that the FOA index never shows positive values, but only Dance and Theater categories have a slight activation of the SOA index, having a significant success with respect to the average of the category.
Cluster 4 has a success rate of 65.04%, which can be considered as an acceptable risk, keeping in mind the innovative nature of this type of projects. It has the third greatest average SOA value and the highest values of Pledged_Backer as shown in Table 5. This is then referred to as “Warning”.
Most projects contained in clusters 1 and 5 fail, with success rates of around 40%. They also have the highest average FOA values, so it has been decided to highlight them as groups to be avoided. These two clusters have certain similarities, since they contain a similar number of projects and success rates of 40.13% and 39.77% respectively. Both clusters are not particularly suitable for hosting projects in the Games and Fashion categories, as both have the highest FOA values.
The projects located in cluster 1 have the highest average duration and the lowest Rate_Pledged_Goal values. Cluster 5 is characterized as having the lowest averages of Pledged, Comments, Updates, Backers and Duration. This situation is of a disadvantage to the Technology category, presenting the highest values of FOA. In order to differentiate the failure of these clusters, the duration attributes will be used, naming them “Wide Hole” and “Deep Hole” respectively.
Cluster 6 has a success rate lower than 48% as can be seen in Table 4, as well as SOA values comparable to those obtained in Cluster 1 and 5. Although it contains projects with a high risk, its most representative feature is its high Goal, as shown in Table 5. Thus, Cluster 6 has been renamed as “Epic Goal”.
After this discussion, we have found the attributes that define the success of each cluster. We suggest that these attributes are a consequence of the behavior of the cluster. For example, belonging to cluster 3 indicates that a project will have many followers, but there is no guarantee that the consequent will be able to deduce the antecedent—that is, the presence or absence of that attribute does not determine cluster membership.

7. Conclusions

Crowdfunding arises as a response to the problem of financing innovative projects in an environment of strong economic crisis, the paralysis of the growth of this model motivates the interest of this study towards a help tool that makes this model more sustainable. For do this, it was selected a sufficiently representative data set of projects known from other authors, and modern data mining techniques were applied. As a result, our conclusions may add knowledge to this means of acquiring resources in this very representative period of time.
The association of projects in clusters has been decisive in understanding how they work, by grouping and characterizing them by their particularities. An examination of the data set has revealed that it can be distributed over six different clusters. This assignment of projects to clusters allows any project to be subsequently incorporated into its corresponding cluster, making it easier for a creator to define a strategy or reorient a project in order to drive it to success, based on its position in the system.
Clusters known as “Top Collections” and “Sponsors Engaged” are the most suitable to host a project with the maximum potential for success, being characterized by a collection much higher than expected and a strong commitment between the Backers and project through good two-way communication. The name “Top collections” makes it easier to identify the cluster with the highest amount collected above the goal, and “Sponsors Engaged” identifies a cluster with projects more closely linked to communication with backers.
The cluster called “Warning” has a sufficient enough success rate to allow the creator to safely modify the characteristics of his project and improve its potential for success.
The “Deep Hole” and “Wide Hole” clusters are characterized by a very high failure rate. The first of them contains projects with the lowest values in certain basic attributes for the good development of crowdfunding—Comments and Updates, among others. The second cluster groups projects with the longest average duration. Both are considered as clusters to be avoided by any creator, which require the maximum effort to relocate them to the success zone. To facilitate the identification of the most inappropriate clusters to a creator, the designation “Hole” has been chosen. The “Deep hole” cluster contains projects with characteristics that are very difficult to modify to redirect the project to success, and the “Wide hole” cluster is understood as a cluster with a greater number of failed projects, though its characteristics allow a greater margin of modification than “Deep Hole”.
The relevance of having identified these six clusters and their attributes allows project managers to use a tool that facilitates the estimation of the economic and financial viability of the crowdfunding project being undertaken. In this way, resources and efforts can be dedicated to improving the quality and benefit ratios of the project.

Author Contributions

Conceptualization, A.F.-B. and J.V.-B.; Formal analysis, H.M.-P.; Investigation, A.F.-B.; Methodology, V.R.-M.; Supervision, V.R.-M.; Writing—original draft, A.F.-B. and J.V.-B.; Writing—review and editing, A.F.-B. and H.M.-P. All authors have read and agreed to the published version of the manuscript.

Funding

This work was funded by the Science, Technology and Innovation Plan of the Principality of Asturias (Spain) Ref: FC-GRUPIN-IDI/2018/000225, which is part-funded by the European Regional Development Fund (ERDF).

Conflicts of Interest

The authors declare no conflict of interest.

Appendix A

Table A1. Distribution of of SOA and FOA mean values by category and cluster.
123456
SOAFOASOAFOASOAFOASOAFOASOAFOASOAFOA
Art−0.740.17−0.09−0.142.65−0.23−0.39−0.08−0.700.12−0.730.16
Comics−0.850.45−0.26−0.303.40−0.46−0.720.01−0.810.23−0.760.08
Dance−0.620.020.59−0.071.15−0.080.32−0.06−0.610.02−0.830.17
Design−0.880.82−0.54−0.273.55−0.62−0.61−0.20−0.830.36−0.69−0.08
Fashion−0.811.42−0.44−0.702.78−1.63−0.08−1.12−0.852.27−0.60−0.24
Food−0.810.32−0.20−0.263.02−0.41−0.46−0.17−0.830.45−0.720.08
Games−0.904.18−0.37−1.783.46−2.76−0.63−0.95−0.841.54−0.73−0.24
Music−0.840.06−0.42−0.043.38−0.07−0.51−0.03−0.870.09−0.730.00
Photography−0.750.43−0.24−0.312.88−0.60−0.44−0.18−0.770.53−0.670.14
Publishing−0.800.68−0.24−0.503.06−0.84−0.47−0.32−0.790.58−0.760.40
Technology−0.910.59−0.64−0.484.11−0.82−0.78−0.26−0.930.99−0.85−0.02
Theater−0.620.040.19−0.051.95−0.08−0.26−0.03−0.520.01−0.740.11
Table A2. Statistic values of SRI, FRI, FOA and SOA by cluster.
SRIFRIFOASOA
MeanMedianSdMeanMedianSdMeanMedianSdMeanMedianSd
Cluster 10.660.440.552.732.312.1576.39%43.70%114.71%−79.41%43.70%114.71%
Cluster 22.471.722.060.670.600.43−40.97%−28.81%47.47%−22.19%−28.81%47.47%
Cluster 311.3110.606.610.110.090.05−71.74%−53.26%77.97%294.87%−53.26%77.97%
Cluster 41.821.111.660.940.900.62−28.31%−17.89%36.58%−42.02%−17.89%36.58%
Cluster 50.700.430.632.542.321.7459.92%40.41%68.87%−77.91%40.41%68.87%
Cluster 60.750.690.401.631.460.714.70%7.89%17.84%−73.34%7.89%17.84%

References

  1. Bustos Contell, E. La Financiación de la Pyme: Préstamo Participativo vs. Capital Riesgo; Aeca: Madrid, Spain, 2013; ISBN 978-84-15467-68-7. [Google Scholar]
  2. Behringer, N.; Sassenberg, K. Introducing social media for knowledge management: Determinants of employees’ intentions to adopt new tools. Comput. Hum. Behav. 2015, 48, 290–296. [Google Scholar] [CrossRef]
  3. Lee, N.; Sameen, H.; Cowling, M. Access to finance for innovative SMEs since the financial crisis. Res. Policy 2015, 44, 370–380. [Google Scholar] [CrossRef] [Green Version]
  4. Negruşa, A.L.; Rus, R.V.; Sofică, A. Innovative Tools Used by Business Networks and Clusters in Communication. Procedia-Soc. Behav. Sci. 2014, 148, 588–595. [Google Scholar] [CrossRef] [Green Version]
  5. Belleflamme, P.; Lambert, T.; Schwienbacher, A. Crowdfunding: Tapping the right crowd. J. Bus. Ventur. 2014, 29, 585–609. [Google Scholar] [CrossRef] [Green Version]
  6. Galkiewicz, D.P.; Galkiewicz, M. Crowdfunding Monitor 2018: An Overview of European Projects Financed on Startnex and Kickstarter Platforms between 2010 and mid-2017 2018; Bermag: Szczecin, Poland, 2018. [Google Scholar]
  7. Pardes, A. Wired Magazine; Conde Nast: New York, NY, USA, 2019. [Google Scholar]
  8. Mollick, E. The dynamics of crowdfunding: An exploratory study. J. Bus. Ventur. 2014, 29, 1–16. [Google Scholar] [CrossRef] [Green Version]
  9. Bidaux, T. Kickstarter in 2017-Year in Review. Available online: http://icopartners.com/2018/01/kickstarter-2017-year-review/ (accessed on 1 October 2018).
  10. Zhao, Q.; Chen, C.-D.; Wang, J.-L.; Chen, P.-C. Determinants of backers’ funding intention in crowdfunding: Social exchange theory and regulatory focus. Telemat. Inform. 2017, 34, 370–384. [Google Scholar] [CrossRef]
  11. Belleflamme, P.; Omrani, N.; Peitz, M. The economics of crowdfunding platforms. Inf. Econ. Policy 2015, 33, 11–28. [Google Scholar] [CrossRef]
  12. Zvilichovsky, D.; Inbar, Y.; Barzilay, O. Playing Both Sides of the Market: Success and Reciprocity on Crowdfunding Platforms; Elsevier: Amsterdam, The Netherlands, 2015. [Google Scholar]
  13. PMBOK. Guía de los Fundamentos Para la Dirección de Proyectos (Guía del PMBOK); Project Management Institute: Newtown Square, PA, USA, 2013; ISBN 978-1-62825-009-1. [Google Scholar]
  14. Han, J.; Kamber, M. Data Mining: Concepts and Techniques, 3rd ed.; Elsevier: Burlington, MA, USA, 2011; ISBN 978-0-12-381479-1. [Google Scholar]
  15. Howe, J. The rise of crowdsourcing. Wired Mag. 2006, 14, 1–4. [Google Scholar]
  16. Mary Anne, M.G. Everyone is a venture capitalist: The new age of crowdfunding. Res.-Technol. Manag. 2012, 55, 4–7. [Google Scholar]
  17. Schwienbacher, A.; Larralde, B. Crowdfunding of Small Entrepreneurial Ventures. Handbook of Entrepreneurial Finance; Oxford University Press: Oxford, UK, 2010. [Google Scholar]
  18. Tran, T.; Dontham, M.R.; Chung, J.; Lee, K. How to Succeed in Crowdfunding: A Long-Term Study in Kickstarter. Available online: https://www.researchgate.net/publication/305637974_How_to_Succeed_in_Crowdfunding_a_Long-Term_Study_in_Kickstarter. (accessed on 15 February 2017).
  19. Gerber, E.M.; Hui, J. Crowdfunding: Motivations and deterrents for participation. ACM Trans. Comput.-Hum. Interact. (TOCHI) 2013, 20, 34. [Google Scholar] [CrossRef]
  20. Lahm, R.J., Jr.; Little, H.T., Jr.; Hall, G. Bootstrapping business start-ups: A review of Current Business Practices. In Proceedings of the Conference on Emerging Issues in Business and Technology: Finance and Accounting: Special Topics (Entrepreneurship) Paper presentation, Citeseer, The Pennsylvania State University, Philadelphia, PA, USA, 2005. [Google Scholar]
  21. Mishra, A.; Chandrasekaran, A.; MacCormack, A. Collaboration in Multi-Partner R&D Projects: The Impact of Partnering Scale and Scope. J. Oper. Manag. 2015, 33–34, 1–14. [Google Scholar]
  22. Lu, C.-T.; Xie, S.; Kong, X.; Yu, P.S. Inferring the Impacts of Social Media on Crowdfunding; ACM Press: New York, NY, USA, 2014; pp. 573–582. [Google Scholar]
  23. Etter, V.; Grossglauser, M.; Thiran, P. Launch Hard or Go Home! Predicting the Success of Kickstarter Campaigns; ACM Press: New York, NY, USA, 2013; pp. 177–182. [Google Scholar]
  24. Strickler, Y. Shortening the Maximum Project Length. The Kickstarter Blog. Available online: https://www.kickstarter.com/blog/shortening-the-maximum-project-length (accessed on 12 June 2016).
  25. Kuppuswamy, V.; Bayus, B.L. Crowdfunding Creative Ideas: The Dynamics of Project Backers in Kickstarter. SSRN Electron. J. 2013, 5, 1–37. [Google Scholar] [CrossRef] [Green Version]
  26. Fischer, P.; Krueger, J.I.; Greitemeyer, T.; Vogrincic, C.; Kastenmüller, A.; Frey, D.; Heene, M.; Wicher, M.; Kainbacher, M. The bystander-effect: A meta-analytic review on bystander intervention in dangerous and non-dangerous emergencies. Psychol. Bull. 2011, 137, 517–537. [Google Scholar] [CrossRef] [PubMed] [Green Version]
  27. Hekman, E.; Brussee, R. Crowdfunding and online social networks. Retrieved May 2013, 15, 2014. [Google Scholar]
  28. Mitra, T.; Gilbert, E. The Language that Gets People to Give: Phrases that Predict Success on Kickstarter; ACM Press: New York, NY, USA, 2014; pp. 49–61. [Google Scholar]
  29. Xu, A.; Yang, X.; Rao, H.; Fu, W.-T.; Huang, S.-W.; Bailey, B.P. Show me the money! An analysis of project updates during crowdfunding campaigns. In Proceedings of the SIGCHI Conference on Human Factors in Computing Systems; ACM: New York, NY, USA, 2014; pp. 591–600. [Google Scholar]
  30. Greenberg, M.D.; Pardo, B.; Hariharan, K.; Gerber, E. Crowdfunding support tools: Predicting success & failure. In Proceedings of the CHI’13 Extended Abstracts on Human Factors in Computing Systems; ACM: New York, NY, USA, 2013; pp. 1815–1820. [Google Scholar]
  31. An, J.; Quercia, D.; Crowcroft, J. Recommending investors for crowdfunding projects. In Proceedings of the 23rd International Conference on World Wide Web; ACM: New York, NY, USA, 2014; pp. 261–270. [Google Scholar]
  32. Chung, J.; Lee, K. A Long-Term Study of a Crowdfunding Platform: Predicting Project Success and Fundraising Amount; ACM Press: New York, NY, USA, 2015; pp. 211–220. [Google Scholar]
  33. Boldeanu, F.T.; Constantinescu, L. The main determinants affecting economic growth. Bull. Transilv. Univ. Brasov. Econ. Sci. Ser. V 2015, 8, 329. [Google Scholar]
  34. Malamud, S.; Zucchi, F. Liquidity, innovation, and endogenous growth. Eur. Cent. Bank 2016, 132, 519–541. [Google Scholar]
  35. Bakker, G. Money for nothing: How firms have financed R&D-projects since the Industrial Revolution. Res. Policy 2013, 42, 1793–1814. [Google Scholar]
  36. InfoDev. Crowdfunding’s Potential for the Developing World. Available online: http://www.infodev.org/crowdfunding (accessed on 6 June 2016).
  37. Beraldi, P.; Violi, A.; Ferrara, M.; Ciancio, C.; Pansera, B.A. Dealing with complex transaction costs in portfolio management. Ann. Oper. Res. 2019, 1–16. [Google Scholar] [CrossRef]
  38. Cumming, D.J.; Leboeuf, G.; Schwienbacher, A. Crowdfunding models: Keep-it-all vs. all-or-nothing. In Proceedings of the Paris December 2014 Finance Meeting EUROFIDAI-AFFI Paper. 2015. Available online: http://dx.doi.org/10.2139/ssrn.2447567 (accessed on 5 July 2016).
  39. Solomon, J.; Ma, W.; Wash, R. Don’t wait! How timing affects coordination of crowdfunding donations. In Proceedings of the 18th ACM Conference on Computer Supported Cooperative Work & Social Computing; ACM: New York, NY, USA, 2015; pp. 547–556. [Google Scholar]
  40. Aubert, B.A.; Kishore, R.; Iriyama, A. Exploring and managing the “innovation through outsourcing” paradox. J. Strateg. Inf. Syst. 2015, 24, 255–269. [Google Scholar] [CrossRef]
  41. Wilhelm, M.; Hutchins, M.; Mars, C.; Benoit-Norris, C. An overview of social impacts and their corresponding improvement implications: A mobile phone case study. J. Clean. Prod. 2015, 102, 302–315. [Google Scholar] [CrossRef]
  42. Noel, L. Using Blogs to Create a Constructivist Learning Environment. Procedia-Soc. Behav. Sci. 2015, 174, 617–621. [Google Scholar] [CrossRef] [Green Version]
  43. Digout, J.; Azouri, M.; Decaudin, J.-M.; Rochard, S. Crowdsourcing, Outsourcing to Obtain a Creativity Group. Arab Econ. Bus. J. 2013, 8, 6–15. [Google Scholar] [CrossRef] [Green Version]
  44. IPMA. Individual Competence Baseline for Project, Programme & Portfolio Management. Available online: https://www.pma.at/files/downloads/440/ipmaicb4.pdf (accessed on 27 September 2018).
  45. Valančienė, L.; Jegelevičiūtė, S. Valuation of Crowdfunding: Benefits and Drawbacks. Econ. Manag. 2013, 18. [Google Scholar] [CrossRef] [Green Version]
  46. Sohrabi, M.K.; Akbari, S. A comprehensive study on the effects of using data mining techniques to predict tie strength. Comput. Hum. Behav. 2016, 60, 534–541. [Google Scholar] [CrossRef]
  47. R Core Team R: A Language and Environment for Statistical Computing. Available online: http://www.R-project.org/ (accessed on 27 September 2018).
  48. Peter, C.; Janet, C.; Randy, K.; Tom, K.; Thomas, R.; Shearer, C.R.H.; Rober, W. CRISP-DM 1.0 Step-by-Step Data Mining Guide. Available online: https://www.bibsonomy.org/bibtex/d20b2a4a6204b04306c3fa3fcaf8ddbf (accessed on 5 October 2018).
  49. Gedda, D.; Nilsson, B.; Såthén, Z.; Søilen, K.S. Crowdfunding: Finding the Optimal Platform for Funders and Entrepreneurs. Technol. Innov. Manag. Rev. 2016, 6, 10. [Google Scholar] [CrossRef]
  50. Kickstarter Estadísticas de Kickstarter. Available online: https://www.kickstarter.com/help/stats (accessed on 9 August 2019).
  51. Public Data Set. Available online: https://fusiontables.google.com/DataSource?docid=1tO8U__v4_oATOq6uo9dl-rPyg-dga3rnkZSbw9M#rows:id=1 (accessed on 9 August 2019).
  52. Zheng, H.; Li, D.; Wu, J.; Xu, Y. The role of multidimensional social capital in crowdfunding: A comparative study in China and US. Inf. Manag. 2014, 51, 488–496. [Google Scholar] [CrossRef]
  53. Wang, N.; Li, Q.; Liang, H.; Ye, T.; Ge, S. Understanding the importance of interaction between creators and backers in crowdfunding success. Electron. Commer. Res. Appl. 2018, 27, 106–117. [Google Scholar] [CrossRef]
  54. Coates, A.; Ng, A.Y. Learning Feature Representations with K-Means. In Neural Networks: Tricks of the Trade; Montavon, G., Orr, G.B., Müller, K.-R., Eds.; Springer: Berlin/Heidelberg, Germany, 2012; Volume 7700, pp. 561–580. ISBN 978-3-642-35288-1. [Google Scholar]
  55. Davis, D.L.; Bouldin, D.W. A Cluster Separation Measure. IEEE Trans. Pattern Anal. Mach. Intell. 1979, 1, 224–227. [Google Scholar] [CrossRef]
  56. Ong, J.; Sibte, S. Data Mining Using Self-Organizing Kohonen maps: A Technique for Effective Data Clustering & Visualisation. In Proceedings of the International Conference on Artificial Intelligence, IC-AI ’99, Las Vegas, NV, USA, 28 June–1 July 1999. [Google Scholar]
  57. Rodríguez Montequín, V.; Villanueva Balsera, J.; Cousillas Fernández, S.M.; Ortega Fernández, F. Exploring Project Complexity through Project Failure Factors: Analysis of Cluster Patterns Using Self-Organizing Maps. Complexity 2018, 2018, 1–17. [Google Scholar] [CrossRef]
Figure 1. Correlation for key variables.
Sustainability 12 00599 g001
Figure 2. K-means cluster map.
Sustainability 12 00599 g002
Figure 3. Success (green) and Failure (red) projection.
Sustainability 12 00599 g003
Figure 4. Map of Variable distribution.
Sustainability 12 00599 g004
Figure 5. Success ratio Over the Average by category.
Sustainability 12 00599 g005
Figure 6. Fail ratio Over the Average by category.
Sustainability 12 00599 g006
Figure 7. Cluster characterization.
Sustainability 12 00599 g007
Table 1. Main differences between traditional funding and crowdfunding.
Traditional FundingCrowdfunding
Type of projectNeed to select the most appropriate funding model to projectValid for any innovative project
Viability studyNecessary risk analysis and financial feasibility studyNot necessary
FunderIndependent entityCustomer
Cost of fundPercentage fixed in advanceProportional to the funding success
Project protectionHigh confidentialityHigh risk of rights violations due to public exposure
ExpandableYes, with solvency requirementsNo
Table 2. Main features of the categories.
CategoryNumber of ProjectsSuccess RateNumber of Backers
Art330457.35%132,920
Comics86853.69%77,752
Dance59072.71%21,922
Design141647.81%317,998
Fashion92733.55%29,437
Food116751.67%69,866
Games92936.49%379,453
Music723866.37%387,692
Photography126645.97%39,479
Publishing363141.23%145,083
Technology70039.71%97,696
Theater190571.02%78,703
Table 3. Data dictionary of the data set.
VariableRangeDescription
Goal0.01–1,200,000Minimum amount required in dollars
Pledged0–10,266,845Maximum amount reached in dollars
Rate_Pledge_Goal ¹0–10,000Achieved Goal Percentage
Bakers0–87,142No. of contributors to each project
Levels0–80No. of contribution levels
Updates0–142No. of project updates
Comments0–19,311No. of feedbacks from each contributor
Month1–12Campaign end month
Duration1–92Total duration of funding in days
Min_RL ¹0–5000Minimum possible contribution in dollars
Max_RL ¹0–10,000Maximum possible contribution in dollars
Range_RL ¹0–9999Difference between Max_RL and Min_RL
Pledged_Backer ¹0–3757Average amount provided by Backer
Notes: ¹ New attributes result of the transformation of the existing features.
Table 4. Distribution of the success rate for each cluster.
ClusterNumber of ProjectsSuccess Rate
1536740.13%
2511468.71%
3247491.43%
4274065.04%
5513739.77%
6310947.57%
Table 5. Distribution of lowest and highest average variable values. (-, empty cells).
ClusterValuesStudied Variables
1LowestRate_Pledged_Goal
HighestDuration
2Lowest-
HighestRate_Pledged_Goal
3Lowest-
HighestPledged, Comments, Updates, Backers
4LowestMin_RL
HighestLevels, Pledged_Backer
5LowestPledged, Levels, Duration, Goal, Comments, Updates, Max_RL, Backers, Pledged_Backer
HighestMin_RL
6Lowest-
HighestGoal, Max_RL
Table 6. Distribution of success by category and cluster.
Cluster 1Cluster 2Cluster 3Cluster 4Cluster 5Cluster 6
Art43.65%72.95%91.53%64.41%46.76%44.64%
Comics28.44%66.47%92.20%42.67%34.07%39.34%
Dance63.95%88.10%90.91%86.05%64.74%44.19%
Design22.22%52.22%91.54%48.12%29.29%42.17%
Fashion19.69%41.74%82.76%53.76%16.23%33.60%
Food33.33%67.42%91.23%58.38%30.05%42.40%
Games10.71%42.62%83.96%30.14%16.03%24.07%
Music52.29%79.97%96.79%77.00%46.26%64.74%
Photography32.14%59.20%88.11%51.56%30.24%38.98%
Publishing26.08%57.47%87.84%48.42%27.28%29.95%
Technology20.00%50.00%93.46%38.00%16.36%30.22%
Theater61.98%83.68%92.73%76.19%67.40%52.88%
Notes: Highlights that the success of projects associated with the performing arts (Dance, Music and Theater) is spread among neighboring clusters, hindering category–cluster association.
Table 7. Distribution of projects by category and cluster.
Cluster 1Cluster 2Cluster 3Cluster 4Cluster 5Cluster 6
Art669706295354879401
Comics2251672057513561
Dance147168334315643
Design261316260133280166
Fashion1932305893228125
Food213267114173183217
Games16818318773156162
Music16581473592116512581092
Photography336250143128291118
Publishing882736370285964394
Technology16013410750110139
Theater455484110168497191

