Abstract
This work investigates the possibility of implementing a nature-based solution (NBS) based on the photosynthetic process of Laurus nobilis L. (common laurel), for reducing peak CO2 concentrations in an air-tight museum environment, namely the Refectory of the Santa Maria delle Grazie Church (Milan, Italy), home of Leonardo da Vinci’s painting “Last Supper”. The phytoremediation potential of laurel plants was evaluated at CO2 ≅ 1000 ppm under controlled environmental conditions. Furthermore, light-saturated net assimilation (Pnmax) was measured at two CO2 concentrations (380 and 1000 ppm) during the growing season. Steady-state gas exchanges were not affected by elevated CO2 in the short-term, while Pnmax was significantly increased, also showing higher values in spring and autumn, and a reduction during summer. Our estimated CO2 removal rates indicate that, in order to control visitors’ respiratory CO2 emissions in view of an increase in visitor numbers in the Refectory, a possible NBS in the form of an external greenhouse, connected to the HVAC system of the museum, should allocate from 58 to 112 young laurel plants, depending on their seasonal phytoremediation capacity. These results, although preliminary, allow to hypothesize the possibility of controlling CO2 indoors through a combination of traditional air-cleaning systems and a properly designed NBS, thus increasing the sustainability of air-tight museum environments.
1. Introduction
Indoor air quality has become a fundamental issue worldwide, following the increase in time (80–90%) that people spend inside private or public buildings, in particular during winter [1]. Outdoor air can be rich in compounds harmful for people’s health, mainly arising from the combustion of fossil fuels and industrial emissions, including carbon monoxide (CO), nitrogen oxides (NOX), tropospheric ozone (O3), Sulphur dioxide (SO2), volatile organic compounds (VOCs) and particulate matter (PM). Added to indoor-generated air pollutants, these result in high indoor air pollution levels, that can be frequently higher than those recorded outside [2,3]. Among the important molecules necessary to monitor in indoor environments, there is also carbon dioxide (CO2). The use of fossil fuels and land use changes are the main causes of the increase in atmospheric CO2 concentration, which nowadays is about 407 ppm, more than 46% higher than in 1750 (≅ 278 ppm) [4]. In indoor environments, CO2 levels further increase as a consequence of people’s respiration [5]. At low concentrations, CO2 is not toxic for human health, however, elevated concentrations of this gas might contribute to the appearance of the so called “sick building syndrome” (SBS) symptoms, and affect people’s comfort [5,6]. Recommended levels of CO2 for a good indoor air quality should not exceed 1000 ppm [7].
Indoor air pollution is a critical issue in museum environments, where it not only represents a health hazard for visitors and workers, but also a risk for the conservation of the works of art [8], since materials, interacting with the environment, respond to chemical and physical stimuli with a natural and irreversible process of degradation [9]. Technical standards [10] define acceptable values of environmental conditions for the conservation of artworks, but case-specific investigations are required to identify the potential degradation factors of each work of art and, as a consequence, the appropriate ranges of microclimatic parameters, as well as threshold concentrations of gaseous molecules and airborne particulate, are required to minimize preservation risks [11]. In order to protect people’s health and guarantee an appropriate conservation of cultural heritage, devices like HVAC (heat, ventilation, air conditioning and cooling) systems, coupled with different types of air filters to remove particulate and gaseous pollutants from air, are widely used within museums [12,13]. However, the ventilation rate of HVAC systems in museums must be strictly calibrated, since it can generate convective air movements affecting artworks, which increase the deposition of particles and gases, thus favoring deterioration [13]. In air-tight museum environments with limited ventilation, indoor CO2 could be removed through adsorption, using sorption-type filters with activated carbons [14,15,16]. Nevertheless, these systems are not cost/effective, and some of them have a short lifespan or need a constant maintenance [17,18,19]. Eco-friendly and sustainable control measures are therefore needed for regulating CO2 levels within air-tight museums.
An alternative and sustainable approach to improve indoor air quality is represented by the implementation of nature-based solutions (NBS). By the reproduction of, or inspiration from natural processes, NBS constitute an innovative approach, which brings co-benefits to health, the environment and society [20]. Furthermore, NBS represent more sustainable, low-cost and efficient solutions to different societal issues, compared to traditional methods [21]. In this regard, several studies have shown that air quality can be improved by exploiting the ability of vegetation to remove gaseous and particulate pollutants, through stomatal uptake (absorption) and non-stomatal deposition (adsorption) [22,23,24]. This air phytoremediation process has been largely investigated in the urban environment, considering green infrastructure elements such as for example green roofs [25], green walls [26], and urban forests [27,28,29,30,31]. In addition, several studies have quantified the ability of potted plants and botanical air filtration systems to remove indoor airborne pollutants, and mitigate CO2 excess, while simultaneously releasing oxygen from the photosynthetic process [32,33,34,35,36,37,38]. However, although the latter topic has received increasing attention in recent years (see the reviews of Brilli et al., [39], Pettit et al., [40] and Irga et al., [41]), to the best of our knowledge, the possibility to use plants for improving air quality in air-tight museum environments has not been investigated so far.
In this context, the present work evaluates the possibility of reducing the CO2 levels produced by visitors’ respiration in an air-tight museum environment, through the implementation of a NBS, based on the photosynthetic process operated by potted evergreen plants grown indoor. Specifically, the case of the Refectory of the Santa Maria delle Grazie Church (Milan, Italy), has been considered, since it preserves one of the most important works of art in the world: the “Last Supper” (or the “Cenacle”), masterpiece of Leonardo da Vinci, made between 1494 and 1497, and included in the UNESCO World Heritage List. This painting presents serious conservation problems due to the technique “a secco” used by Leonardo, coupled with the high levels of humidity present inside the Refectory when it was still in use, as well as the increase in atmospheric pollution in the surrounding urban area during modern times. Following numerous microclimatic investigations [11], the Refectory room was made completely air-tight by means of a physical separation from the outside, that includes two “filter areas” at the visitors’ entrance and exit doors. The internal atmosphere is constantly maintained in slight overpressure to prevent the diffusion of pollutants from the surrounding urban atmosphere, and a HVAC system with several air filters is installed to abate pollutants in the incoming air [42,43], as well as to control temperature (maintained at 24–25°C and 20–22 °C during summer and winter, respectively) and relative humidity (maintained at 50%) [44]. To ensure optimal conditions for the painting, the HVAC system strongly limits the air exchange rate from the outdoor (around 0.67 h−1); therefore, in order to prevent the increase of CO2 levels indoor, the number of visitors and the length of the visit are kept strictly limited (30 people for 15 min, from 8:00 AM to 17:00 PM for 6 days/week) [44]. In spite of this limitation, however, diurnal CO2 levels in the Refectory room frequently reach the threshold concentration of 1000 ppm [44]. Considering that the museum has more than 300,000 unsatisfied visit requests every year, and the admittance of at least part of such visitors would cause the exceedance of the 1000 ppm CO2 threshold, an appropriate control of indoor CO2 is needed, in order to guarantee the wellbeing of visitors and workers, in view of a possible increase in the number of visitors, thus allowing a greater enjoyment of the “Last Supper”.
The typical Mediterranean evergreen tree Laurus nobilis L. (common laurel) was considered for the phytoremediation process, due its ability to assimilate CO2 through the whole year, and because of its symbolic importance in art [45]. Such aspects make this species particularly suitable for the realization of a NBS in this important museum environment. Our specific objectives were: i) estimating the capacity of L. nobilis to reduce indoor CO2 levels in an air-tight, controlled environment; ii) quantifying the light-saturated maximum net assimilation (Pnmax) of L. nobilis at different CO2 partial pressures. Such data are needed in order to optimize the design of a possible NBS to control CO2 in the Refectory of the Santa Maria delle Grazie Church, in view of a possible increase in the number of visitors.
2. Materials and Methods
2.1. Plant Material and Experimental Design
Laurus nobilis plants, two years old, coming from the forest nursery of the Aurunci Regional Park (Southern Latium, Italy), were used as experimental material. The plants were grown in the Experimental Garden of the Department of Environmental Biology, Sapienza University of Rome (Italy), inside 7 l pots, filled with garden soil supplemented with a slow releasing fertilizer (Nitrophoska Blue, 12–12–17 and microelements), and watered daily to prevent the occurrence of stress conditions.
Two experimental activities were carried out. Firstly, the response of gas exchanges to the maximum CO2 values measured in the Refectory during the visiting hours (≅ 1000 ppm, Table 1), has been investigated though a CO2 fumigation experiment, carried out under controlled environmental conditions. Furthermore, the photosynthetic response of L. nobilis to varying light intensity (Pn vs. PAR response curves) has been measured under different CO2 partial pressures (ambient, ≅ 380ppm, and 1000ppm) during spring, summer, and autumn 2017.

Table 1.
Minimum and maximum monthly CO2 concentrations measured in the Refectory of Santa Maria delle Grazie during the year 2014. Maximum concentrations are recorded during the visiting hours (08:00–17:00) while minimum concentrations occur overnight and during the museum closing days.
2.2. CO2 Fumigation Experiment in Controlled Environmental Conditions
The fumigation experiment was carried out at the Department of Environmental Biology, inside two closed “walk-in” chambers (2.5 × 3.9 × 3.0 m), one used as control and one for CO2 fumigation. Air temperature was maintained at 27 ± 1.2 °C, and 20 ± 1.5 °C (mean ± s.d.) during day and night, respectively. Relative humidity (RH) was 59 ± 4%, and vapor pressure deficit (VPD) was 1.4 ± 0.3 kPa. In each chamber, a photosynthetically active radiation (PAR) of approximately 700 μmol m−2s−1 was provided for 12 h per day by 6 metal halide lamps (1000 W, Philips HPI-T). Microclimatic conditions were monitored at 6-min intervals, and did not differ significantly between chambers. Plants were watered at full capacity over the whole duration of the experiment.
Prior to the start of the fumigation, 30 plants were left to acclimate for 5 days to the chamber conditions. At the end of this acclimation period, they were grouped into two experimental sets: 15 plants were fumigated with CO2 at 988.7 ± 37.1 ppm h for 4 h per day (09:00–13:00), for 5 days (set “F”), while the other 15 were employed as control (not-fumigated, set “C”). In the fumigation chamber, pure CO2 was supplied from a CO2 cylinder into the air-mixing, for dilution with ambient air. The control chamber was instead supplied with ambient air only (CO2 was kept at 380 ± 10 ppm). CO2 concentrations inside the chambers were monitored continuously through an infra-red gas analyzer (IRGA, model CIRAS 2, PP Systems, Amesbury, MA, USA, employed in “analyser only” mode, without the foliar cuvette).
Steady State Gas Exchange Measurements
Leaf level gas exchange measurements were carried out with two intercalibrated CIRAS 2 portable analyzers, equipped with a leaf cuvette (PP Systems, Hitchin, UK). CIRAS 2 records the following parameters: net assimilation (Pn, μmolCO2 m−2s−1), leaf transpiration (E, mmolH2O m−2s−1), stomatal conductance (gs, mmolH2O m−2s−1), substomatal CO2 concentration (Ci, ppm). Simultaneously, CIRAS 2 also records environmental parameters such as irradiance (PAR, µmol photons m−2s−1), relative air humidity (RH, %), as well as air and leaf temperature (Tamb and Tleaf, respectively °C). The ratio between sub-stomatal and external CO2 concentration (Ci/Ca, dimensionless) was also calculated.
Steady-state gas exchanges were measured both continuously, during CO2 fumigation, and as “spot” measurements, carried out at the end of the fumigations. Both measurements were carried out on fully developed leaves placed at the top of the plants.
Continuous measurements were carried out on a different L. nobilis individual for each fumigation day (5 plants in total), in order to assess the instantaneous photosynthetic capacity of the species under high CO2 levels. Each leaf was inserted in the foliar cuvette and left acclimatizing for 15 min prior to the start of the fumigation. Gas exchange parameters were recorded automatically every half minute by the CIRAS2 for the whole duration of the fumigation treatment, under the environmental conditions and CO2 levels reached in the chamber. About 400 measurements were recorded for each day of fumigation (DOF).
At the end of each fumigation (between 14:00 and 16:00), “spot” gas exchange measurements were also carried out on both F and C plants, in order to assess plant functional response to the high CO2 treatment. One leaf per plant was measured, for a total of 15 measurements for sampling date and experimental set. During these spot measurements, CO2 in the leaf cuvette was maintained at normal atmospheric concentration (≅ 380 ppm).
2.3. Photosynthetic Light Response at Different CO2 Concentrations
The CIRAS 2 instrument was also used to measure the response of photosynthesis to changing light intensity (Pn vs. PAR response curves), under different CO2 partial pressures. Such measurements were carried out in the laboratory between 09:00 and 14:00. Cuvette environment was maintained at 60% RH and 25 °C T, while photosynthetic active radiation was progressively reduced step-wise from the maximum value of 1200 µmol photons m−2 s−1 up to 0, by using the CIRAS 2 built-in light emitting diodes. Each intensity level was maintained for 5–7 min to allow photosynthetic response to stabilize before taking the measurements (6–10 records for each light step). For each plant, Pn/PAR response curves were measured at two CO2 concentrations: 380 ppm (ambient value) and 1000 ppm. CO2 concentration in the leaf cuvette was controlled using the CIRAS 2 inner CO2 cartridge. From the analysis of the Pn/PAR curves, the following photosynthetic traits were derived: Pnmax (μmolCO2 m−2s−1), the maximum photosynthesis at saturating light intensity, which indicates the instantaneous CO2 removal performance on the basis of leaf area; Φ (μmolCO2 µmol photons−1), photosynthesis quantum yield, which indicates the amount of CO2 fixated for each absorbed photon [46]. The quantum yield was calculated empirically, as the slope of the linear part of the Pn/PAR curve (between 50 and 250 µmol photons m−2 s-1). The number of points considered was assessed for each single curve according to the “best fit” method, considering a minimum of four data points [47].
The measurements were carried out in four different moments of the vegetative season 2017: Spring (between 15 and 19 of May), early Summer (from 20 June to 7 July), late Summer (from 19 to 25 July) and in Autumn (from 9 to 13 October). For each period, 3–4 plants were measured.
2.4. Estimate of Laurus nobilis Capacity to Remove Indoor CO2
The instantaneous CO2 removal performance on the basis of leaf area, derived from Pn/PAR response curves (Pnmax, μmolCO2 m−2s−1), was used to develop preliminary baseline data for the planning and design of a pilot plantscape installation, targeted at reducing CO2 levels in the Refectory of Santa Maria delle Grazie Church. The Refectory is a large rectangular hall measuring 36.65 × 8.85 m, and with a height of 10.3 m, isolated from the outside with a system of air-tight triple doors. Therefore, it is possible to calculate the total volume of air indoors, which is approximately equal to 3340 m3. Assuming air as an ideal gas at standard temperature and pressure, it is possible to roughly estimate the molar amount of CO2 contained in the Refectory as follows:
where VR is the volume of air indoor (3340 m3), X is the maximum daily CO2 concentration in ppm measured in the Refectory (996.18 ppm, Table 1), and 0.022414 m3 mol−1 is the molar volume of air.
[CO2] (μmol) = (VR ∗ X)/0.022414
Assuming an average of 12h of photosynthetic activity, the daily CO2 removal by 1 m2 leaf area of L. nobilis is equal to:
Daily CO2 removal (μmol m−2 day−1) = Pnmax ∗ 3600 ∗ 12
The residual CO2 concentrations in the Refectory is then easily derived as the difference between the initial molar concentration Equation (1), and the CO2 subtracted after 1 day of photosynthetic activity by 1 m2 of leaf area Equation (2). By reverting Equation (1), this value can be expressed again in ppm, and used for a preliminary dimensioning of the total leaf surface area needed to be allocated in a NBS, in order to satisfy the need to increase the daily number of visitors allowed in the Refectory without exceeding the recommended 1000 ppm CO2 threshold. Specifically, a potential increase of the daily visitors’ number of about one third was evaluated.
2.5. Statistical Analysis
Continuous gas exchange measurements were analyzed by a One-way Analysis of Variance (ANOVA). In order to determine significant differences in gas exchange parameters between control and CO2-fumigated plants for each day of fumigation, a T-test at p < 0.05 was applied. The parameters derived from the Pn/PAR response curves were analyzed with the two-way ANOVA, considering CO2 concentration and month of measurement as factors. Two-way ANOVA was followed by post hoc Neuman-Keuls test at p < 0.05 when necessary. Data reported in figures and tables are expressed as mean ± standard deviation. All analyses were performed by using the software STATISTICA 7.0 (Statsoft, OK, USA).
3. Results
3.1. CO2 Fumigation Experiment
Figure 1 shows the hourly trend of continuous gas exchanges, recorded on laurel plants during the CO2 fumigation experiment. There was no significant difference (p > 0.05) in gas exchanges between fumigation days, thus only hourly values averaged over the whole fumigation period are shown. Net photosynthesis (Pn, Figure 1a), stomatal conductance (gs, Figure 1b) and the Ci/Ca ratio (Figure 1c) showed only slight variations during the course of the fumigation. Hourly Pn data were distributed around an overall mean value of 7.19 ± 2.49 μmol CO2 m−2s−1, and average gs values were 17.80 ± 6.52 mmol H2O m−2s−1. The overall average Ci/Ca was 0.32 ± 0.16.
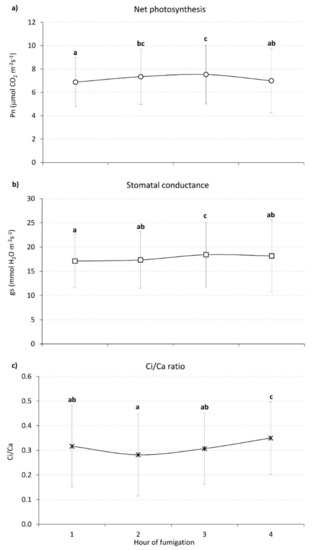
Figure 1.
Continuous gas exchanges recorded on L. nobilis plants during the four hours of fumigation at [CO2] 988.7 ± 37.1 ppm h. (a) Net photosynthesis (Pn, μmolCO2 m−2s−1); (b) stomatal conductance (gs, mmolH2O m−2s−1); (c) Ci/Ca ratio (dimensionless). Each point represents the mean of the measurements made in each fumigation hour on five laurel plants during the five days of fumigation (N ≅ 400). Different letters indicate statistically significant differences between means (p < 0.05).
“Spot” gas exchange measurements recorded after each fumigation are shown in Figure 2. It is interesting to highlight that net photosynthesis was significantly reduced (p < 0.01) in CO2 fumigated plants only during the second day of fumigation (DOF 2, Figure 2a), while stomatal conductance did not differ significantly between control and fumigated plants through the whole experiment (Figure 2b). The Ci/Ca ratio showed a slight, but significant (p < 0.05), increase in fumigated plants at DOF 2, concurrently with the Pn reduction (Figure 2c).
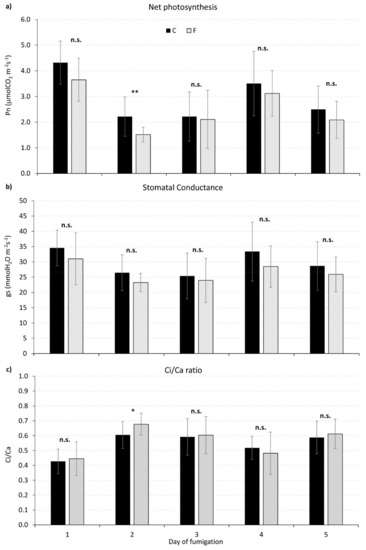
Figure 2.
Spot gas exchange measurements recorded on control and fumigated plants. During these spot measurements, CO2 was maintained at normal atmospheric concentration (≅ 380 ppm). (a) Net photosynthesis (Pn, μmolCO2 m−2s−1); (b) stomatal conductance (gs, mmolH2O m−2s−1); (c) Ci/Ca ratio (dimensionless). For each day of fumigation, asterisks show the significance of differences between control (C, black) and fumigated (F, grey) plants (T test, *** p ≤ 0.001; ** p ≤ 0.01; * p ≤ 0.05; n.s. = not significant, p > 0.05, N = 15).
3.2. Photosynthetic Light Response Curves under Different CO2 Concentrations
Figure 3 shows the average Pn/PAR curves, recorded on L. nobilis plants in different months from May to October, at two CO2 concentration (380 ppm and 1000 ppm, Figure 4a,b, respectively). For both CO2 concentrations and during all measuring dates, maximum net assimilation Pnmax was reached at 1000 μmol photons m−2s−1, that therefore corresponds to the saturating light intensity for L. nobilis.
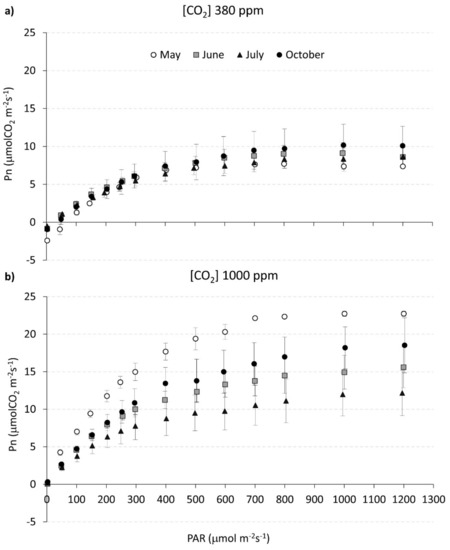
Figure 3.
Pn vs. PAR curves measured in Laurus nobilis plants, in different months and at two CO2 concentrations (380 ppm and 1000 ppm). Each data point represents the mean (± s.d.) of Pn/PAR values measured in 3–4 plants in May (white circle), June (grey square), July (black triangle), October (black circle), at two different CO2 concentrations: (a) 380 ppm and (b) 1000 ppm (20 ≤ N ≤ 35).
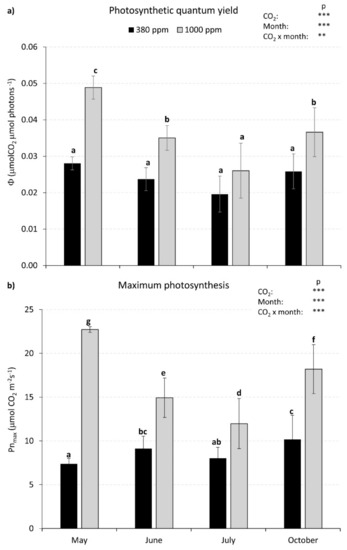
Figure 4.
(a) Photosynthetic quantum yields (Φ, μmolCO2 µmol photons−1), in the different months at [CO2] 380 ppm (black) and [CO2] 1000ppm (grey); (b) Maximum photosynthesis (Pnmax, μmolCO2 m−2s−1), measured at saturating light intensity (PAR = 1000 µmol photons−1), [CO2] 380 ppm (black) and [CO2] 1000 ppm (grey). Different letters indicate statistically significant differences between means (p < 0.05). The insets show the results of the two-way ANOVA, asterisks showing the significance of factors/interaction (*** p ≤ 0.001; ** p ≤ 0.01; * p ≤ 0.05).
No marked seasonal trend is evident in the Pn/PAR curves measured at [CO2] 380 ppm (Figure 3a). On the contrary, the curves measured at 1000 ppm clearly show a different seasonal response to changing light intensity.
Such differences are better highlighted in Figure 4, showing the average quantum yield (panel a, Φ, μmolCO2 µmol photons−1) and the maximum photosynthesis at saturating light intensity (panel b, Pnmax, μmolCO2 m−2s−1), derived from the curves of Figure 3. At [CO2] 380 ppm, Φ did not show any significant difference between months (Figure 4a). Conversely, at [CO2] 1000 ppm, Φ displayed a significant seasonal trend, showing the highest values in May (0.049 ± 0.003 μmolCO2 µmol photons−1), a progressive reduction in June (0.035 ± 0.003 μmolCO2 µmol photons−1) and July (0.026 ± 0.008 μmolCO2 µmol photons−1), followed by a partial recovery in October (0.037 ± 0.007 μmolCO2 µmol photons−1) (Figure 4a).
As for Pnmax, this trait only showed slight seasonal variations at [CO2] 380 ppm (Figure 4b). A marked seasonal trend was again evident at [CO2] 1000 ppm: Pnmax values were highest in May (22.72 ± 0.34 μmolCO2 m−2s−1), and were progressively reduced during summer, reaching a minimum in July (11.97 ± 2.86 μmolCO2 m−2s−1), followed by a recovery in October (18.19 ± 2.79 μmolCO2 l m−2s−1). The overall Pnmax mean at 1000 ppm was equal to 15.79 ± 3.90 μmolCO2 l m−2s−1.
3.3. Estimate of Laurus nobilis Capacity to Remove Indoor CO2 from the Refectory of Santa Maria delle Grazie Church
Applying Equation (1), the maximum amount of CO2 contained within the Refectory can be estimated as equal to 148.44 mol. Then, the residual CO2 in the Refectory after 12h of photosynthetic activity operated by 1 m2 leaf area of L. nobilis was derived. In this regard, in Equation (2), the maximum and minimum Pnmax recorded during the Pn/PAR curves at 1000 ppm CO2 in May (≅ 23 μmolCO2 m−2s-1) and July (12 μmolCO2 m−2s−1), respectively (Figure 4b), were considered, obtaining maximum and minimum daily CO2 removal of 0.99 and 0.52 mol CO2 m−2 day−1, respectively.
Accordingly, the residual CO2 in the Refectory after the photosynthetic assimilation ranged from a minimum of 147.45 mol CO2, to a maximum of 147.93 mol CO2, corresponding to maximum and minimum Pnmax values, respectively. Such values can be reconverted into ppm by reverting Equation (1), thus deriving the maximum (6.67 ppm) and minimum (3.48 ppm) daily potential improvement of CO2 concentration operated by 1 m2 of leaf surface of L. nobilis.
These values can be used to estimate the potential total leaf surface area that should be allocated in a NBS, in order to satisfy the need to increase the daily number of visitors allowed in the Refectory without exceeding the recommended 1000 ppm CO2 threshold. Considering that, due to the current number of visitors, maximum indoor CO2 levels in the Refectory increase ≅ 600 ppm over the ambient value (i.e., from ≅ 400 ppm to ≅ 1000 ppm), a reduction of one third such value (≅ 200 ppm) would lower maximum CO2 to ≅ 800 ppm, thus allowing a potential increase of the daily number of visitors of about one third (i.e., from 30 to 40 people each 15 min round). The leaf surface area needed for such reduction would therefore range from a minimum of 29 to a maximum of 56 m2. Since potted laurel plants of about 1.5 m of height have an average total leaf area of ≅ 0.5 m2, it is possible to estimate that the approximate number of plants that should be necessary to accommodate within the NBS in order to obtain such ideal CO2 reduction would range between a minimum of 58 to a maximum of 112 plants.
4. Discussion
Plant phytoremediation potential for indoor CO2 is underpinned by the photosynthetic process, therefore measuring gas exchanges under high [CO2] is fundamental for planning a NBS targeted at reducing indoor CO2 levels [34,37,48]. The gas exchange rates recorded in our experiment are in the range of those reported for laurel plants in natural environments (2.8 ≤ Pn ≤ 5 μmolCO2 m−2s−1 and 20 ≤ gs ≤ 55 mmolH2O m−2s−1, [49]). Such low values of photosynthetic traits are a common characteristic of evergreen sclerophyllous woody species, representing a physiological adaptation to the stressful conditions typical of the Mediterranean environment [50,51]. Indeed, Maatallah et al. [52], who investigated the drought effects on L. nobilis seedlings, found a maximum net photosynthesis of 3.8 μmol CO2 m−2s−1 and a minimum of 0.5 μmol CO2 m−2s−1 on well-watered and drought stressed plants, respectively.
Besides a transient reduction of net assimilation occurring during the first day of fumigation, no significant effect of high CO2 on steady-state gas exchanges was evident. Continuous measurements recorded during the fumigations showed only slightly higher Pn and lower gs values, coherently with what reported for other Mediterranean evergreen tree species under high [CO2] [53]. Photosynthetic quantum yield (Φ) and light-saturated net photosynthesis (Pnmax) were instead significantly increased by high CO2 during the whole growing season. There is a large amount of literature about the effects of high CO2 on plants (see the reviews by Hättenschwiler et al. [54], and Ainsworth and Long [55]), highlighting that elevated CO2 increases carboxylation and reduces photorespiration, particularly in those functional groups, such as trees, whose photosynthesis is Rubisco-limited also at elevated [CO2] [56]. Supporting evidence of stimulated CO2 assimilation at high [CO2] on Mediterranean evergreen trees was also provided under chamber conditions [57,58], as well as in natural CO2 springs [59]. In the long-term, however, acclimation to high CO2 could occur, determining a down-regulation of photosynthesis caused by the reduction of Rubisco activity or content, the decrease in stomatal aperture and density, or the occurrence of nutrient imbalances [59,60,61]. Such downward acclimation must be taken into account when planning a NBS targeted at reducing indoor CO2, since it could negatively affect plant phytoremediation potential, thus making necessary to continuously replace plant material with an additional economic cost. It is, however, worth emphasizing that there are few evidences of photosynthetic acclimation to CO2 occurring in trees, particularly in young or juvenile individuals [55,62], thus making young potted trees a more sustainable choice for an indoor NBS, if compared to herbaceous species. Furthermore, it is unlikely that such photosynthetic acclimation would occur in the NBS considered in this study, since CO2 level within the Refectory of Santa Maria delle Grazie Church varies with the flux of visitors, dropping to values as low as 300 ppm during the museum closing hours (Table 1).
Besides acclimation, the potential stomatal sink strength for CO2 is often limited by the suboptimal growth conditions typically found in indoor environments [36,39,48]. Among these, low light quality and intensities, as well as the lack of an appropriate light-dark cycle (photoperiod), have been recognized as the main sources of limitation for the physiological activity of indoor plants [63]. In our case, light saturation of photosynthesis in L. nobilis occurred at PAR ≅ 1000 μmol m−2s−1, similarly to what highlighted for other woody species in interiorscapes [31]. Interestingly, our results also highlight that, at high [CO2], both Φ and Pnmax showed a marked seasonal trend, with lower values during summer in respect to spring and autumn. The seasonal dynamics of photosynthesis in Mediterranean evergreen species has been extensively studied, mainly in relation with drought or high temperature stress occurring during the summer period [50,64,65]. In our case, since water availability was not limited through the whole experiment, we can argue that both ambient air temperatures (Supplementary Materials Figure S1) and plant phenology, played a role in determining the observed seasonal trend, ultimately affecting the CO2 phytoremediation potential on a seasonal basis [66].
The abovementioned factors should be taken into account when transferring the removal rates estimated in laboratory experiments to the planning of a NBS, particularly in relation to a challenging museum environment such as the Refectory of Santa Maria delle Grazie Church. In this case, the most feasible way to realize a NBS would be to connect the HVAC system of the Refectory to an external greenhouse, in which plants could be grown under controlled environmental conditions, in order to guarantee optimal irrigation, fertilization, temperature and irradiance levels (PAR ≅ 1000 μmol m−2s−1) to sustain maximum CO2 removal in the museum. The CO2-rich air recirculating from the museum would be filtered by plants in the greenhouse, and then streamed back in the Refectory, after an additional filtration from the HVAC to control water vapor, VOCs and PM that could be emitted by plants and visitors as well (Figure 5). However, our estimated CO2 removal rates per unit leaf area point out that, for lowering [CO2] in the Refectory to ≅ 800 ppm to allow a potential one third increase in the number of visitors, the external greenhouse should allocate from a minimum of 58 to a maximum of 112 laurel plants of ≅ 1.5 m of height. This would require a minimum greenhouse surface area of ≅ 30 m2. Based on these results, the use of plants as a standalone means to control indoor CO2 in the Refectory appears impractical, mainly because of the large volume of the Refectory itself, that requires a massive phytoremediation effort. This is in agreement with previous studies, underlining that botanical air filtration systems, such as green walls or potted plants, can be self-sufficient for passive air phytoremediation only in the case of small rooms with few occupants [34,36,67]. Therefore, in the specific case of the Refectory, the use of physicochemical CO2 filtration systems cannot be fully avoided.
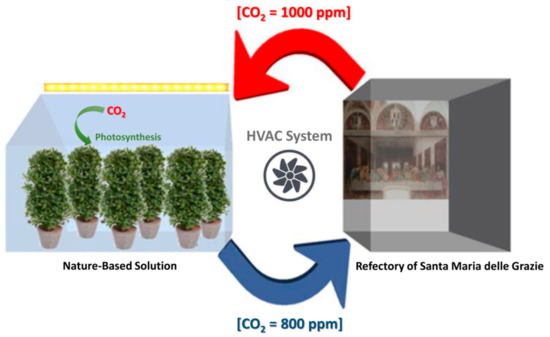
Figure 5.
Basic outline scheme of the proposed Nature Base Solutions.
Despite the abovementioned limitations, the NSB based on plant phytoremediation can be evaluated as an additional installation to improve the efficiency of traditional filtration systems, to reduce CO2 levels while releasing an equimolecular amount of oxygen in such a challenging museum environment. In particular, phytoremediation efficiency will be higher during periods of maximum plant physiological activity, such as spring and autumn, thus increasing the efficiency of CO2 filtration. In this sense, our results support previous researches advocating the possibility to combine traditional air-cleaning technologies with properly designed NBS, also with the help of smart sensor technologies [39], as a promising solution for improving indoor air quality, opening the road for the possible optimization of energy use and maintenance cost of the HVAC systems also in air-tight museum environments.
5. Conclusions
Our work represents the first quantitative investigation aimed at providing science-based evidence and knowledge for planning a NBS in an air-tight museum environment, where high CO2 levels limit the visitors’ fruition of an important work of art such as the Leonardo da Vinci’s “Last Supper”. Such a NBS could improve the efficiency of traditional air cleaning technologies, to control [CO2] in the considered museum in view of a potentially increased number of visitors.
There is, however, the need of further research, in order to develop optimum combined systems for such pioneering installations, targeted at solving an important societal issue such as indoor air pollution. For instance, besides photosynthetic acclimation, daytime respiratory CO2 emissions from the soil substrate, including microbial and root respiration, should be taken into account when calculating the CO2 removal rates within the greenhouse. The fertilization and irrigation schedules needed to sustain the maximum CO2 removal rate, as well as the replacement cycles of plant material, should be also optimized. Furthermore, the costs of energy consumption for potential nature-based or traditional air-cleaning solutions, as well as for a combination of both, should be quantified and compared, in order to determine the best choice in terms of both cost effectiveness and energy efficiency. It is also necessary to test further plant species, with higher CO2 removal rates than L. nobilis, as well as other, more efficient botanical air filtration systems, such as for example green walls, which reduce the space needed to allocate the plant material and, at the same time, limit the soil substrate and its CO2 emissions. In this regard, the system phytoremediation capacity towards multiple indoor air pollutants, such as PM, NOx, and O3, should be also considered and quantified for a proper cost/benefit evaluation. Finally, it must be underlined that our modelling approach represents a simplification of the issue of building ventilation, since the amount of CO2 in the indoor air is a dynamic function of different parameters, such as Tair, RH, as well as the number of air exchanges, CO2 concentration outdoors, and the number of people producing CO2 allowed indoor. Therefore, a CO2 dynamic model should be implemented and tested for planning the specific case-study.
In spite of this, our data represent the starting point for the development of such a NBS, opening the road to the possibility of their implementation in other indoor environments, such as schools, hospitals, or public offices, through the employment of the natural and low cost photosynthetic process, rather than relying on “grey” technologies only. The “Cenacle”, that preserves Leonardo’s genius, can thus become a model of sustainability, and pave the way to the development of innovative solutions for the future.
Supplementary Materials
The following are available online at https://www.mdpi.com/2071-1050/12/2/565/s1.
Author Contributions
Conceptualization, F.M., F.A., A.A., E.S.; methodology and experimental design, F.M., E.S.; investigation, E.S., C.G.; formal analysis, E.S.; writing—original draft preparation, E.S., C.G.; writing—review and editing, F.M., F.A., A.A.; Supervision and funding acquisition, F.M. All authors have read and agreed to the published version of the manuscript.
Funding
This research was funded by the following grants: Sapienza University of Rome, “Ricerca di Università anno 2015”, grant number C26A15PWLH; Ministero della Salute, Centro Nazionale per la Prevenzione ed il Controllo delle Malattie—CCM Project 2018: “Integrazione, formazione e valutazione di impatto dell’inquinamento ambientale sulla salute: Rete Italiana Ambiente e Salute (RIAS)”.
Acknowledgments
The authors wish to thank the Direction of the Museum of the Cenacolo Vinciano in Milan, for the logistic support provided during the research, and for supplying the CO2 concentrations data measured in the Refectory of Santa Maria delle Grazie. We also thank the Anonymous Referees for their constructive comments and suggestions, which have helped us to considerably improve the paper.
Conflicts of Interest
The authors declare no conflict of interest
Abbreviations
Ci (ppm), substomatal CO2 concentration; Ci/Ca, ratio between substomatal and external CO2 concentration; DOF, day of fumigation; E (mmol H2O m−2s−1), leaf transpiration; gs (mmol H2O m−2s−1), stomatal conductance; HVAC, heating, ventilating and air conditioning systems; PAR (µmol photons m−2 s−1), Photosynthetic Active Radiation; Pn (μmol H2O m−2s−1), net assimilation; Pnmax (μmolCO2 m−2s−1), maximum photosynthesis at saturating light intensity; RH (%), Relative air Humidity; Tamb (°C), ambient temperature; Tleaf (°C), leaf temperature; VPD (kPa), Vapor Pressure Deficit; Φ (μmolCO2 µmol photons−1), photosynthesis quantum yield.
References
- European Commission. Indoor Air Pollution: New EU Research Reveals Higher Risks than Previously Thought. Press Release. Available online: https://europa.eu/rapid/press-release_IP-03-1278_en.htm (accessed on 3 October 2019).
- World Health Organization (WHO). Who Guidelines for Indoor Air Quality: Selected Pollutants; WHO: Copenhagen, Denmark, 2010; ISBN 978-92-890-0213-4. [Google Scholar]
- Al Horr, Y.; Arif, M.; Katafygiotou, M.; Mazroei, A.; Kaushik, A.; Elsarrag, E. Impact of indoor environmental quality on occupant well-being and comfort: A review of the literature. Int. J. Sustain. Built Environ. 2016, 5, 1–11. [Google Scholar] [CrossRef]
- Blunden, J.; Arndt, D.S. State of the Climate in 2018. Bull. Amer. Meteor. Soc. 2019, 100. [Google Scholar] [CrossRef]
- Satish, U.; Mendell, M.J.; Shekhar, K.; Hotchi, T.; Sullivan, D.; Streufert, S.; Fisk, W.J. Is CO2 an Indoor Pollutant? Direct Effects of Low-to-Moderate CO2 Concentrations on Human Decision-Making Performance. Environ. Health Perspect. 2012, 120, 1671–1677. [Google Scholar] [CrossRef] [PubMed]
- Seppänen, O.A.; Fisk, W.J.; Mendell, M.J. Association of Ventilation Rates and CO2 Concentrations with Health and Other Responses in Commercial and Institutional Buildings. Indoor Air 1999, 9, 226–252. [Google Scholar] [CrossRef] [PubMed]
- ASHRAE. ANSI/ASHRAE Standard 62.1-2013: The Standards for Ventilation and Indoor Air Quality; American Society for Heating, Refrigeration and Air Conditioning Engineering: Atlanta, GA, USA, 2013. [Google Scholar]
- Krupińska, B.; Van Grieken, R.; De Wael, K. Air quality monitoring in a museum for preventive conservation: Results of a three-year study in the Plantin-Moretus Museum in Antwerp, Belgium. Microchem. J. 2013, 110, 350–360. [Google Scholar] [CrossRef]
- Camuffo, D. Microclimate for Cultural Heritage: Measurement, Risk Assessment, Conservation, Restoration, and Maintenance of Indoor and Outdoor Monuments; Elsevier: Amsterdam, The Netherlands, 2019; ISBN 978-0-444-64107-6. [Google Scholar]
- UNI 10829. Historical and Cultural Heritage: Environmental Conditions for Preservation; Ente Italiano di Unificazione: Milan, Italy, 1999. [Google Scholar]
- Camuffo, D.; Bernardi, A. The microclimate of Leonardo’s Last Supper. Boll. geofisico. Eur. Cult. Herit. Newsl. Res. 1991, 14, 39–75. [Google Scholar]
- Bellia, L.; Capozzoli, A.; Mazzei, P.; Minichiello, F. A comparison of HVAC systems for artwork conservation. Int. J. Refrig. 2007, 30, 1439–1451. [Google Scholar] [CrossRef]
- Camuffo, D.; Van Grieken, R.; Busse, H.-J.; Sturaro, G.; Valentino, A.; Bernardi, A.; Blades, N.; Shooter, D.; Gysels, K.; Deutsch, F.; et al. Environmental monitoring in four European museums. Atmos. Environ. 2001, 35, S127–S140. [Google Scholar] [CrossRef]
- Lee, K.-M.; Lim, Y.-H.; Park, C.-J.; Jo, Y.-M. Adsorption of Low-Level CO2 Using Modified Zeolites and Activated Carbon. Ind. Eng. Chem. Res. 2012, 51, 1355–1363. [Google Scholar] [CrossRef]
- Hu, S.-C.; Shiue, A.; Chang, S.-M.; Chang, Y.-T.; Tseng, C.-H.; Mao, C.-C.; Hsieh, A.; Chan, A. Removal of carbon dioxide in the indoor environment with sorption-type air filters. Int. J. Low-Carbon Technol. 2017, 12, 330–334. [Google Scholar] [CrossRef]
- Shiue, A.; Hu, S.-C.; Chang, S.-M.; Ko, T.-Y.; Hsieh, A.; Chan, A. Adsorption Kinetics and Breakthrough of Carbon Dioxide for the Chemical Modified Activated Carbon Filter Used in the Building. Sustainability 2017, 9, 1533. [Google Scholar] [CrossRef]
- Rajan, P.E.; Krishnamurthy, A.; Morrison, G.; Rezaei, F. Advanced buffer materials for indoor air CO2 control in commercial buildings. Indoor Air 2017, 27, 1213–1223. [Google Scholar] [CrossRef] [PubMed]
- Soreanu, G.; Dixon, M.; Darlington, A. Botanical biofiltration of indoor gaseous pollutants—A mini-review. Chem. Eng. J. 2013, 229, 585–594. [Google Scholar] [CrossRef]
- United States Environmental Protection Agency (EPA). Guide to Air Cleaners in the Home; EPA 402-F-08-004; United States Environmental Protection Agency (EPA): Washington, DC, USA, 2008.
- European Commission. Towards an EU Research and Innovation Policy Agenda for Nature-Based Solutions & Re-Naturing Cities: Final Report of the Horizon 2020 Expert Group on ’Nature-Based Solutions and Re-Naturing Cities’; European Commission: Brussel, Belgium, 2015; ISBN 978-92-79-46051-7. [Google Scholar]
- Maes, J.; Jacobs, S. Nature-Based Solutions for Europe’s Sustainable Development. Conserv. Lett. 2017, 10, 121–124. [Google Scholar] [CrossRef]
- Manes, F.; Vitale, M.; Maria Fabi, A.; De Santis, F.; Zona, D. Estimates of potential ozone stomatal uptake in mature trees of Quercus ilex in a Mediterranean climate. Env. Exp. Bot. 2007, 59, 235–241. [Google Scholar] [CrossRef]
- Fares, S.; Savi, F.; Fusaro, L.; Conte, A.; Salvatori, E.; Aromolo, R.; Manes, F. Particle deposition in a peri-urban Mediterranean forest. Environ. Pollut. 2016, 218, 1278–1286. [Google Scholar] [CrossRef]
- Janhäll, S. Review on urban vegetation and particle air pollution—Deposition and dispersion. Atmos. Environ. 2015, 105, 130–137. [Google Scholar] [CrossRef]
- Li, Y.; Babcock, R.W. Green roofs against pollution and climate change. A review. Agron. Sustain. Dev. 2014, 34, 695–705. [Google Scholar] [CrossRef]
- Pugh, T.A.M.; MacKenzie, A.R.; Whyatt, J.D.; Hewitt, C.N. Effectiveness of Green Infrastructure for Improvement of Air Quality in Urban Street Canyons. Environ. Sci. Technol. 2012, 46, 7692–7699. [Google Scholar] [CrossRef]
- Manes, F.; Incerti, G.; Salvatori, E.; Vitale, M.; Ricotta, C.; Costanza, R. Urban ecosystem services: Tree diversity and stability of tropospheric ozone removal. Ecol. Appl. 2012, 22, 349–360. [Google Scholar] [CrossRef]
- Manes, F.; Marando, F.; Capotorti, G.; Blasi, C.; Salvatori, E.; Fusaro, L.; Ciancarella, L.; Mircea, M.; Marchetti, M.; Chirici, G.; et al. Regulating Ecosystem Services of forests in ten Italian Metropolitan Cities: Air quality improvement by PM10 and O3 removal. Ecol. Indic. 2016, 67, 425–440. [Google Scholar] [CrossRef]
- Marando, F.; Salvatori, E.; Fusaro, L.; Manes, F. Removal of PM10 by Forests as a Nature-Based Solution for Air Quality Improvement in the Metropolitan City of Rome. Forests 2016, 7, 150. [Google Scholar] [CrossRef]
- Fusaro, L.; Mereu, S.; Salvatori, E.; Agliari, E.; Fares, S.; Manes, F. Modeling ozone uptake by urban and peri-urban forest: A case study in the Metropolitan City of Rome. Environ. Sci. Pollut. Res. 2018, 25, 8190–8205. [Google Scholar] [CrossRef] [PubMed]
- Nowak, D.J.; Hirabayashi, S.; Doyle, M.; McGovern, M.; Pasher, J. Air pollution removal by urban forests in Canada and its effect on air quality and human health. Urban For. Urban 2018, 29, 40–48. [Google Scholar] [CrossRef]
- Oh, G.S.; Jung, G.J.; Seo, M.H.; Im, Y.B. Experimental study on variations Green. of CO2 concentration in the presence of indoor plants and respiration of experimental animals. Hortic. Environ. Biotechnol. 2011, 52, 321–329. [Google Scholar] [CrossRef]
- Wang, Z.; Zhang, J.S. Characterization and performance evaluation of a full-scale activated carbon-based dynamic botanical air filtration system for improving indoor air quality. Build. Environ. 2011, 46, 758–768. [Google Scholar] [CrossRef]
- Pennisi, S.V.; van Iersel, M.W. Quantification of Carbon Assimilation of Plants in Simulated and In Situ Interiorscapes. Hort. Sci. 2012, 47, 468–476. [Google Scholar] [CrossRef]
- Dela Cruz, M.; Christensen, J.H.; Thomsen, J.D.; Müller, R. Can ornamental potted plants remove volatile organic compounds from indoor air?—A review. Environ. Sci. Pollut. Res. 2014, 21, 13909–13928. [Google Scholar] [CrossRef]
- Torpy, F.R.; Irga, P.J.; Burchett, M.D. Profiling indoor plants for the amelioration of high CO2 concentrations. Urban For. Urban Green. 2014, 13, 227–233. [Google Scholar] [CrossRef]
- Torpy, F.; Zavattaro, M.; Irga, P. Green wall technology for the phytoremediation of indoor air: A system for the reduction of high CO2 concentrations. Air Qual. Atmos. Health 2017, 10, 575–585. [Google Scholar] [CrossRef]
- Cao, Y.; Li, F.; Wang, Y.; Yu, Y.; Wang, Z.; Liu, X.; Ding, K. Assisted Deposition of PM2.5 from Indoor Air by Ornamental Potted Plants. Sustainability 2019, 11, 2546. [Google Scholar] [CrossRef]
- Brilli, F.; Fares, S.; Ghirardo, A.; de Visser, P.; Calatayud, V.; Muñoz, A.; Annesi-Maesano, I.; Sebastiani, F.; Alivernini, A.; Varriale, V.; et al. Plants for Sustainable Improvement of Indoor Air Quality. Trends Plant Sci. 2018, 23, 507–512. [Google Scholar] [CrossRef] [PubMed]
- Pettit, T.; Irga, P.J.; Torpy, F.R. Towards practical indoor air phytoremediation: A review. Chemosphere 2018, 208, 960–974. [Google Scholar] [CrossRef] [PubMed]
- Irga, P.J.; Pettit, T.J.; Torpy, F.R. The phytoremediation of indoor air pollution: A review on the technology development from the potted plant through to functional green wall biofilters. Rev. Environ. Sci. Biotechnol. 2018, 17, 395–415. [Google Scholar] [CrossRef]
- Gasparini, F.; Christescu, A. Controllo della qualità dell’aria. In Leonardo. L’ultima Cena. Indagini, Ricerche, Restauro; Basile, G., Marabelli, M., Eds.; Istituto Centrale per il Restauro and Nardini: Firenze, Italy, 2007; pp. 107–114. ISBN 978-88-404-4159-7. [Google Scholar]
- Daher, N.; Ruprecht, A.; Invernizzi, G.; De Marco, C.; Miller-Schulze, J.; Heo, J.B.; Shafer, M.M.; Schauer, J.J.; Sioutas, C. Chemical Characterization and Source Apportionment of Fine and Coarse Particulate Matter Inside the Refectory of Santa Maria delle Grazie Church, Home of Leonardo Da Vinci’s “Last Supper”. Environ. Sci. Technol. 2011, 45, 10344–10353. [Google Scholar] [CrossRef]
- Gasparini, F.; Stolfi, G. The Cenacolo Vinciano: Engineering and Microclimate within the Refectory. In Proceedings of the 49th AiCARR Internationa Conference, Rome, Italy, 26–28 February 2014; pp. 93–109. [Google Scholar]
- Caneva, G.; Bohuny, L. Botanic analysis of Livia’s villa painted flora (Prima Porta, Roma). J. Cult. Herit. 2003, 4, 149–155. [Google Scholar] [CrossRef]
- Singsaas, E.L.; Ort, D.R.; DeLucia, E.H. Variation in measured values of photosynthetic quantum yield in ecophysiological studies. Oecologia 2001, 128, 15–23. [Google Scholar] [CrossRef]
- Sharkey, T.D.; Bernacchi, C.J.; Farquhar, G.D.; Singsaas, E.L. Fitting photosynthetic carbon dioxide response curves for C3 leaves. Plant Cell Environ. 2007, 30, 1035–1040. [Google Scholar] [CrossRef]
- Irga, P.J.; Torpy, F.R.; Burchett, M.D. Can hydroculture be used to enhance the performance of indoor plants for the removal of air pollutants? Atmos. Environ. 2013, 77, 267–271. [Google Scholar] [CrossRef]
- Arena, C.; Vitale, L.; Santo, A.V. de Photosynthesis and photoprotective strategies in Laurus nobilis L. and Quercus ilex L. under summer drought and winter cold. Plant Biosyst. 2008, 142, 472–479. [Google Scholar] [CrossRef]
- Manes, F.; Seufert, G.; Vitale, M. Ecophysiological studies of Mediterranean plant species at the Castelporziano state. Atmos. Environ. 1997, 31, 51–60. [Google Scholar] [CrossRef]
- Salvatori, E.; Fusaro, L.; Manes, F. Chlorophyll Fluorescence for Phenotyping Drought-Stressed Trees in a Mixed Deciduous Forest. Ann. Bot. 2016, 6, 39–49. [Google Scholar]
- Maatallah, S.; Ghanem, M.E.; Albouchi, A.; Bizid, E.; Lutts, S. A greenhouse investigation of responses to different water stress regimes of Laurus nobilis trees from two climatic regions. J. Arid Environ. 2010, 74, 327–337. [Google Scholar] [CrossRef]
- Killi, D.; Bussotti, F.; Gottardini, E.; Pollastrini, M.; Mori, J.; Tani, C.; Papini, A.; Ferrini, F.; Fini, A. Photosynthetic and morphological responses of oak species to temperature and [CO2] increased to levels predicted for 2050. Urban For. Urban Green. 2018, 31, 26–37. [Google Scholar] [CrossRef]
- Hättenschwiler, S.; Miglietta, F.; Raschi, A.; Körner, C. Thirty years of in situ tree growth under elevated CO2: A model for future forest responses? Glob. Chang. Biol. 1997, 3, 463–471. [Google Scholar] [CrossRef]
- Ainsworth, E.A.; Long, S.P. What have we learned from 15 years of free-air CO2 enrichment (FACE)? A meta-analytic review of the responses of photosynthesis, canopy properties and plant production to rising CO2. New Phytol. 2005, 165, 351–372. [Google Scholar] [CrossRef]
- Ainsworth, E.A.; Rogers, A. The response of photosynthesis and stomatal conductance to rising [CO2]: Mechanisms and environmental interactions. Plant Cell Environ. 2007, 30, 258–270. [Google Scholar] [CrossRef]
- Manes, F.; Vitale, M.; Donato, E.; Paoletti, E. O3 and O3+CO2 effects on a mediterranean evergreen broadleaf tree, holm oak (Quercus ilex L.). Chemosphere 1998, 36, 801–806. [Google Scholar] [CrossRef]
- Paoletti, E.; Manes, F. Effects of Elevated Carbon Dioxide and Acidic Rain on the Growth of Holm Oak. In Developments in Environmental Science; Air Pollution, Global Change and Forests in the New Millenium; Elsevier: Amsterdam, The Netherlands, 2003; Volume 3, pp. 375–389. [Google Scholar]
- Tognetti, R.; Johnson, J.D.; Michelozzi, M.; Raschi, A. Response of foliar metabolism in mature trees of Quercus pubescens and Quercus ilex to long-term elevated CO2. Environ. Exp. Bot. 1998, 39, 233–245. [Google Scholar] [CrossRef]
- Körner, C.; Miglietta, F. Long term effects of naturally elevated CO2 on mediterranean grassland and forest trees. Oecologia 1994, 99, 343–351. [Google Scholar] [CrossRef]
- Scarascia-Mugnozza, G.; Angelis, P.D.; Matteucci, G.; Valentini, R. Long-term exposure to elevated [CO2] in a natural Quercus ilex L. community: Net photosynthesis and photochemical efficiency of PSII at different levels of water stress. Plant Cell Environ. 1996, 19, 643–654. [Google Scholar] [CrossRef]
- Ceulemans, R.; Taylor, G.; Bosac, C.; Wilkins, D.; Besford, R.T. Photosynthetic acclimation to elevated CO2 in poplar grown in glasshouse cabinets or in open top chambers depends on duration of exposure. J. Exp. Bot. 1997, 48, 1681–1689. [Google Scholar] [CrossRef]
- Zielinska-Dabkowska, K.M.; Hartmann, J.; Sigillo, C. LED Light Sources and Their Complex Set-Up for Visually and Biologically Effective Illumination for Ornamental Indoor Plants. Sustainability 2019, 11, 2642. [Google Scholar] [CrossRef]
- Fusaro, L.; Salvatori, E.; Mereu, S.; Marando, F.; Scassellati, E.; Abbate, G.; Manes, F. Urban and peri-urban forests in the metropolitan area of Rome: Ecophysiological response of Quercus ilex L. in two green infrastructures in an ecosystem services perspective. Urban For. Urban Green. 2015, 14, 1147–1156. [Google Scholar] [CrossRef]
- Sperlich, D.; Chang, C.T.; Peñuelas, J.; Gracia, C.; Sabaté, S. Seasonal variability of foliar photosynthetic and morphological traits and drought impacts in a Mediterranean mixed forest. Tree Physiol. 2015, 35, 501–520. [Google Scholar] [CrossRef]
- Quentin, A.G.; Crous, K.Y.; Barton, C.V.M.; Ellsworth, D.S. Photosynthetic enhancement by elevated CO2 depends on seasonal temperatures for warmed and non-warmed Eucalyptus globulus trees. Tree Physiol. 2015, 35, 1249–1263. [Google Scholar]
- Gubb, C.; Blanusa, T.; Griffiths, A.; Pfrang, C. Can houseplants improve indoor air quality by removing CO2 and increasing relative humidity? Air Qual. Atmos. Health 2018, 11, 1191–1201. [Google Scholar] [CrossRef]


© 2020 by the authors. Licensee MDPI, Basel, Switzerland. This article is an open access article distributed under the terms and conditions of the Creative Commons Attribution (CC BY) license (http://creativecommons.org/licenses/by/4.0/).