Article

Consistency in Vulnerability Assessments of Wheat to Climate Change—A District-Level Analysis in India

1
Department of Natural Resources, TERI School of Advanced Studies, New Delhi 110070, India
2
Potsdam Institute for Climate Impact Research (PIK), Member of the Leibniz Association, Telegrafenberg, 14473 Potsdam, Germany
3
School of Environmental Sciences, Jawaharlal Nehru University, New Delhi 110067, India
4
Special Centre for Disaster Research, Jawaharlal Nehru University, New Delhi 110067, India
*
Author to whom correspondence should be addressed.
Sustainability 2020, 12(19), 8256; https://doi.org/10.3390/su12198256
Submission received: 11 September 2020 / Revised: 2 October 2020 / Accepted: 4 October 2020 / Published: 7 October 2020

Abstract

:
In India, a reduction in wheat crop yield would lead to a widespread impact on food security. In particular, the most vulnerable people are severely exposed to food insecurity. This study estimates the climate change vulnerability of wheat crops with respect to heterogeneities in time, space, and weighting methods. The study uses the Intergovernmental Panel on Climate Change (IPCC) framework of vulnerability while using composite indices of 27 indicators to explain exposure, sensitivity, and adaptive capacity. We used climate projections under current (1975–2005) conditions and two future (2021–2050) Representation Concentration Pathways (RCPs), 4.5 and 8.5, to estimate exposure to climatic risks. Consistency across three weighting methods (Analytical Hierarchy Process (AHP), Principal Component Analysis (PCA), and Equal Weights (EWs)) was evaluated. Results of the vulnerability profile suggest high vulnerability of the wheat crop in northern and central India. In particular, the districts Unnao, Sirsa, Hardoi, and Bathinda show high vulnerability and high consistency across current and future climate scenarios. In total, 84% of the districts show more than 75% consistency in the current climate, and 83% and 68% of the districts show more than 75% consistency for RCP 4.5 and RCP 8.5 climate scenario for the three weighting methods, respectively. By using different weighting methods, it was possible to quantify “method uncertainty” in vulnerability assessment and enhance robustness in identifying most vulnerable regions. Finally, we emphasize the importance of communicating uncertainties, both in data and methods in vulnerability research, to effectively guide adaptation planning. The results of this study would serve as the basis for designing climate impacts adjusted adaptation measures for policy interventions.

1. Introduction

Globally, wheat is one of the top-three staple food crops together with rice and maize; it occupies around 217 million hectares (Mha) with an annual production around 713 million tons (Mt) [1,2]. Wheat is the second most important cereal crop of many developing countries, particularly in India, and plays a vital role in food and nutritional security of the country [3]. India is the second-largest producer of wheat with a production of around 100 Mt with a record average productivity of 3371 Kg/ha [4]. Until Indian’s independence in 1947, the production and productivity of wheat were quite low. The country had a capacity to produce approximately 6 Mt wheat during 1950–51, which was insufficient to meet the food demand of the population [5]. A green revolution in the 1950s–1960s helped overcome the years of stagnation in wheat production by introducing high-yielding variety programs in association with land reforms, better irrigation facilities, and use of fertilizers and pesticides [6]. Despite the remarkable growth in wheat production from 6 to 100 Mt in India, wheat production is at risk due to climate extremes, reduced water availability, and increasing temperature [7].
In India, wheat is mainly a winter (Rabi) crop that is normally sown in November and harvested between March and April [8,9]. The crop majorly relies on irrigation due to low precipitation in winters and is strongly sensitive to variation in climatic variables. The appropriate amount of rainfall during its vegetative stage enhances the yield [10], while high temperature threatens the yield [11,12,13]. In the face of climate change, the expected increase in temperature along with recurring hot and dry spells and heavy rainfall events will negatively affect wheat production [14]. In India, an increase of temperature by 1 °C can result in a loss of 4–5 Mt of wheat production [15,16,17]. Further, studies have projected a net reduction of 19–28 Mt of wheat yield for a 3–5 °C rise in temperature [18,19]. As the surface temperature is projected to rise to a range of 2.9 °C (under RCP 4.5, [20]) to 5 °C (under RCP 8.5, [21]) for India by 2100, wheat yield, production, and nutritional quality is likely to be impacted as higher temperature and drought stress increase grain protein concentration [22,23].
In India, wheat yield is expected to reduce under the influence of climate change [3]. Several studies have aimed to study the spatial and temporal dynamics of the impacts on wheat production [3,24]. The methods used to assess the risks and impacts are different and involve several methodological steps. The two most common approaches to assess the risks are using crop models (process-based or statistical models) and in more recent times, using indicator-based vulnerability methods (Table 1). The most common method for the assessment of impacts is through the usage of crop models to simulate changes in wheat yields [25]. Assessments through crop models mostly focus on biophysical parameters, and the extent to which socio-economic parameters are included is often limited. In contrast, an indicator-based vulnerability approach allows for the integration of socio-economic and biophysical elements at multiple scales [26,27].
Although several advantages of using an indicator-based approach have been documented [37,38], concerns to develop a robust method to quantify different approaches (weighting, aggregation), evaluation in time and space are high. Wirehn et al., in their study on the evaluation of composite index methods for agricultural vulnerability, demonstrated the importance of methodological choices of weighting while using indicator-based approaches [37]. Systematic differences can arise in vulnerability ranks based on the method used for weighting the indicator. Apart from this, there is a clear need for more transient assessments, i.e., assessments of the impact of changing rather than a changed or static climate, where future climate conditions are considered for vulnerability assessment [39].
In light of this background, the present study focuses on the assessment of vulnerability of wheat crops under current and future climate change scenarios based on two RCPs (RCP 4.5 and RCP 8.5). The two RCPs are different with respect to increasing green-house gas emissions as well as rates of population growth, GDP growth, and technological development. The objectives of the study are as follows: (i) to identify areas of high vulnerability of wheat crop for current and future climate scenarios; (ii) to examine the differences in vulnerability index produced using three weighting methods (Analytical Hierarchy Process (AHP), Principal Component Analysis (PCA), and Equal Weights (EWs)), which are common weighting methods; and (iii) to assign a degree of consistency to provide greater reliability in the vulnerability ranks. The novelty of our work lies in identifying areas of districts of high priority, where current and projected (RCP 4.5 and RCP 8.5) vulnerability of wheat is the highest, by reducing the bias due to weighting methods. The study used multiple weighting methods to consistently compute the vulnerability ranks of districts, thereby reducing the uncertainty in the vulnerability ranks. In addition, the study includes indicators like Growing Degree Days (GDD) and the Standard Precipitation Index (SPI) to characterize climate extremes, and the best available socio-economic indicators to effectively capture the characteristics of wheat agriculture systems. Our results provide information on systematic differences among different weighting approaches and help in the implementation of adaptation interventions.

2. Study Area

In India, wheat is sown on an area of 30 Mha with a production of 100 Mt and an average yield of 3.37 t/ha in 2017–2018 [4,8]. India ranks as the first in area coverage, while is the second largest wheat producing country in the world [8,40]. Mainly three main wheat varieties are grown in India, Triticum aestivum, T. durum, and T. diococcum, with a 95%, 4%, and 1% percent share of production, respectively. The crop is mainly grown between 3° N to 6° N and 4° S to 27° S in Rabi season; however, the sowing and harvesting time varies in different regions depending on the climatic conditions (detailed map provided in supplementary information 1).
Figure 1a shows the spatial distribution of the area of wheat crop production at district level across 29 states of India. The major wheat producing states are Uttar Pradesh, Punjab, Haryana, and Rajasthan. In Maharashtra, Jammu and Kashmir and Himachal Pradesh, mainly rain-fed wheat is grown. The states of Uttar Pradesh, Punjab, Haryana, Madhya Pradesh, Rajasthan, Bihar, Maharashtra, Gujarat, Karnataka, West Bengal, Uttarakhand, Himachal Pradesh and Jammu and Kashmir contribute to about 99.5% of wheat production in the country. The contribution of other states is minimal [41]. Despite the increase in wheat yield after 2010 (Figure 1b), about 20% of Indian population is still facing food security issues [42].

3. Data and Methodology

3.1. Vulnerability Components and Indicators

In the recent report by IPCC (AR 5), vulnerability is defined as the predisposition to being adversely affected [43]. The IPCC AR 5 definition of vulnerability originates from the preceding IPCC AR 4 vulnerability definition, where vulnerability is defined as “the extent to which a natural or social system is susceptible to sustaining damage from climate change impacts, and is a function of exposure, sensitivity and adaptive capacity” [44]. In this study, we use the base IPCC AR 4 definition of vulnerability to operationalize the assessment. Exposure refers to the degree or the magnitude of climate stress that a district experiences. Exposure in our study was captured using indicators of climate variability and extremes for the current (1975–2005) and two future climate scenarios (RCP 4.5, and RCP 8.5 for 2021–2050) (Table 2). For the selection of modeled climate projection data from General Circulation Model, we used Geophysical Fluid Dynamics Laboratory’s Earth System Model (GFDL-ESM2G). This model covers better total heat variability and explicitly and consistently carbon dynamics [45]. The spatial resolution of the dataset is 2 × 2.5 degree. Jena et al. in their study showed that GFDL-ESM2G is one of the best models for capturing the changes in the Indian summer monsoon over the historical period 1871–2005 [46]. Since values of exposure were normalized across districts to generate relative values, we did not use the bias-adjustment method. Details on calculation of GDD, SPI, and the coefficient of variation of rainfall are given in Supplementary Information 2.
Sensitivity captures characteristics of a district that determines the likelihood of experiencing harm under a given stressor scenario (in our case, climate variability and extremes). Sensitivity is determined by several different dimensions of sensitivity including physical, economic, social, environmental, and cultural dimensions [47]. In our study we estimate sensitivity using indicators for land suitability, agriculture area, biophysical characteristics, and agriculture dependence. Adaptive capacity determines the capacity of districts to anticipate, respond, and cope with climate impacts [48]. We access adaptive capacity through a combination of biophysical, human, infrastructural, and economic capacity. Table 2 lists the indicators selected under each component of vulnerability, which were identified after a review of existing literature on agriculture system vulnerability and with reference to the data availability at the district level. As only climate projections were available for the future time-step, we assumed the values of sensitivity and adaptive capacity indicators to be constant for the future.

3.2. Methodology

The study was carried out at district level for 537 wheat-growing districts as most strategic planning and implementation are done at district level in India. Figure 2 presents the overall framework of the study. Firstly, indicators were selected based on the conceptual framework of vulnerability (Figure 2a). Secondly, the data was collected and processed to compute a composite normalized vulnerability index (details of all the steps provided in Figure 2b). Finally, the data was analyzed as per the evaluation framework presented in Figure 2c to understand the heterogeneity across three weighting methods and time.
We employed three methods, Analytical Hierarchy Process (AHP), Principal Component Analysis (PCA), and Equal weights (EWs), to weigh each indicator and evaluate the degree of consistency of the vulnerability assessment by using different weighting methods. As pointed out by Tate, these weighting methods can be classified into two categories, i.e., the hierarchical (EW, AHP) and inductive approach (PCA) [49]. A detailed explanation of the methods is provided in Supplementary Information 3. EW is the most common approach to combine the indicators [37,50,51]. In vulnerability assessment studies, AHP was used by Brozova et al., Sehgal et al., and Siddayao et al. [52,53,54]. Moreover, the inductive method of PCA is used in a number of studies to assign weights [24,55]. Additionally, in order to validate the results and test for differences between weighting methods, a regression analysis was performed. Based on the results, we assessed vulnerability for current climate conditions and two future climate scenarios (RCP 4.5 and RCP 8.5).

3.2.1. Assessing Vulnerability

The indices of exposure, sensitivity, and adaptive capacity were computed by summation of the indicators multiplied by their respective weights using additive aggregation, as shown in Equation (1) [49].
C I = i = 1 I WiXij
where CI is the Exposure, Sensitivity, or Adaptive Capacity Index; Wi is the weight associated with the indicator; and Xij is the normalized value of the indicator i in district j.
As exposure and sensitivity of an area directly contribute to the vulnerability of an area, whereas adaptive capacity helps to combat the effect, the composite index of vulnerability was formulated using Equation (2) based on [56].
VI = ((EI + SI) − AcI)/3
where VI is the Vulnerability Index; EI is the Exposure Index, SI is the Sensitivity Index, and AcI is the Adaptive Capacity Index. In order to facilitate direct comparison across methods and scenarios, we normalized the vulnerability indices on a scale of 0 to 1 and communicated our findings through equal interval maps.

3.2.2. Analyzing Consistency of Vulnerability

Consistency between the indices computed using different weighting methods (AHP, PCA, and EWs) was estimated as a function of the Coefficient of Variation (CoV) of their respective normalized vulnerability scores for each district under study. CoV, a statistical measure, is computed by dividing the standard deviation divided by the mean; it determines dispersion or variability in the data [57]. A high CoV value reflects inconsistency among samples within the group. Consistency was computed separately across methods for the current (1975–2005) scenario as well as for RCP 4.5 and RCP 8.5 (2021–2050) scenarios and presented through consistency maps.
Consistency = (100 − (σ/µ 100))
where σ is the standard deviation of the normalized vulnerability indices (AHP, PCA, and EWs) for each district and µ is the mean of the normalized vulnerability index (AHP, PCA, and EWs) for each district. Furthermore, a simple linear regression analysis was conducted to test for consistency among vulnerability indices calculated by the three weighting methods. The regression analysis was conducted for all method combinations (MiMj) for current and future climate scenarios by using Equation (4).
Mi = β0 + β1 Mj + ε
where Mi (dependent) and Mj (independent) are the vulnerability indices calculated by two weighting methods (i, j) between which we want to test for the relationship; β0 is the intercept; β1 is the slope coefficient. The regression analysis was performed for 18 combinations of methods (9 pairs) as shown in Table 3. When β0 = 0 and β1 = 1, the methods produce the same result. In cases where β0 ≠ 0, the intercept differs, and slope differs when β1 ≠ 1. These determine a relationship with vulnerability, i.e., when the vulnerability according to one method increases, the vulnerability according to the other method increases (β1 > 1) or decreases (β1 < 0). Thereafter, different method pairs were classified in three categories of relationships: Strongly related (0.6 > β1 < 1.4), feebly related (0.2 > β1 < 0.6), and negatively related (β1 < 0).

4. Results

4.1. Spatial Distribution of Wheat Crop Vulnerability

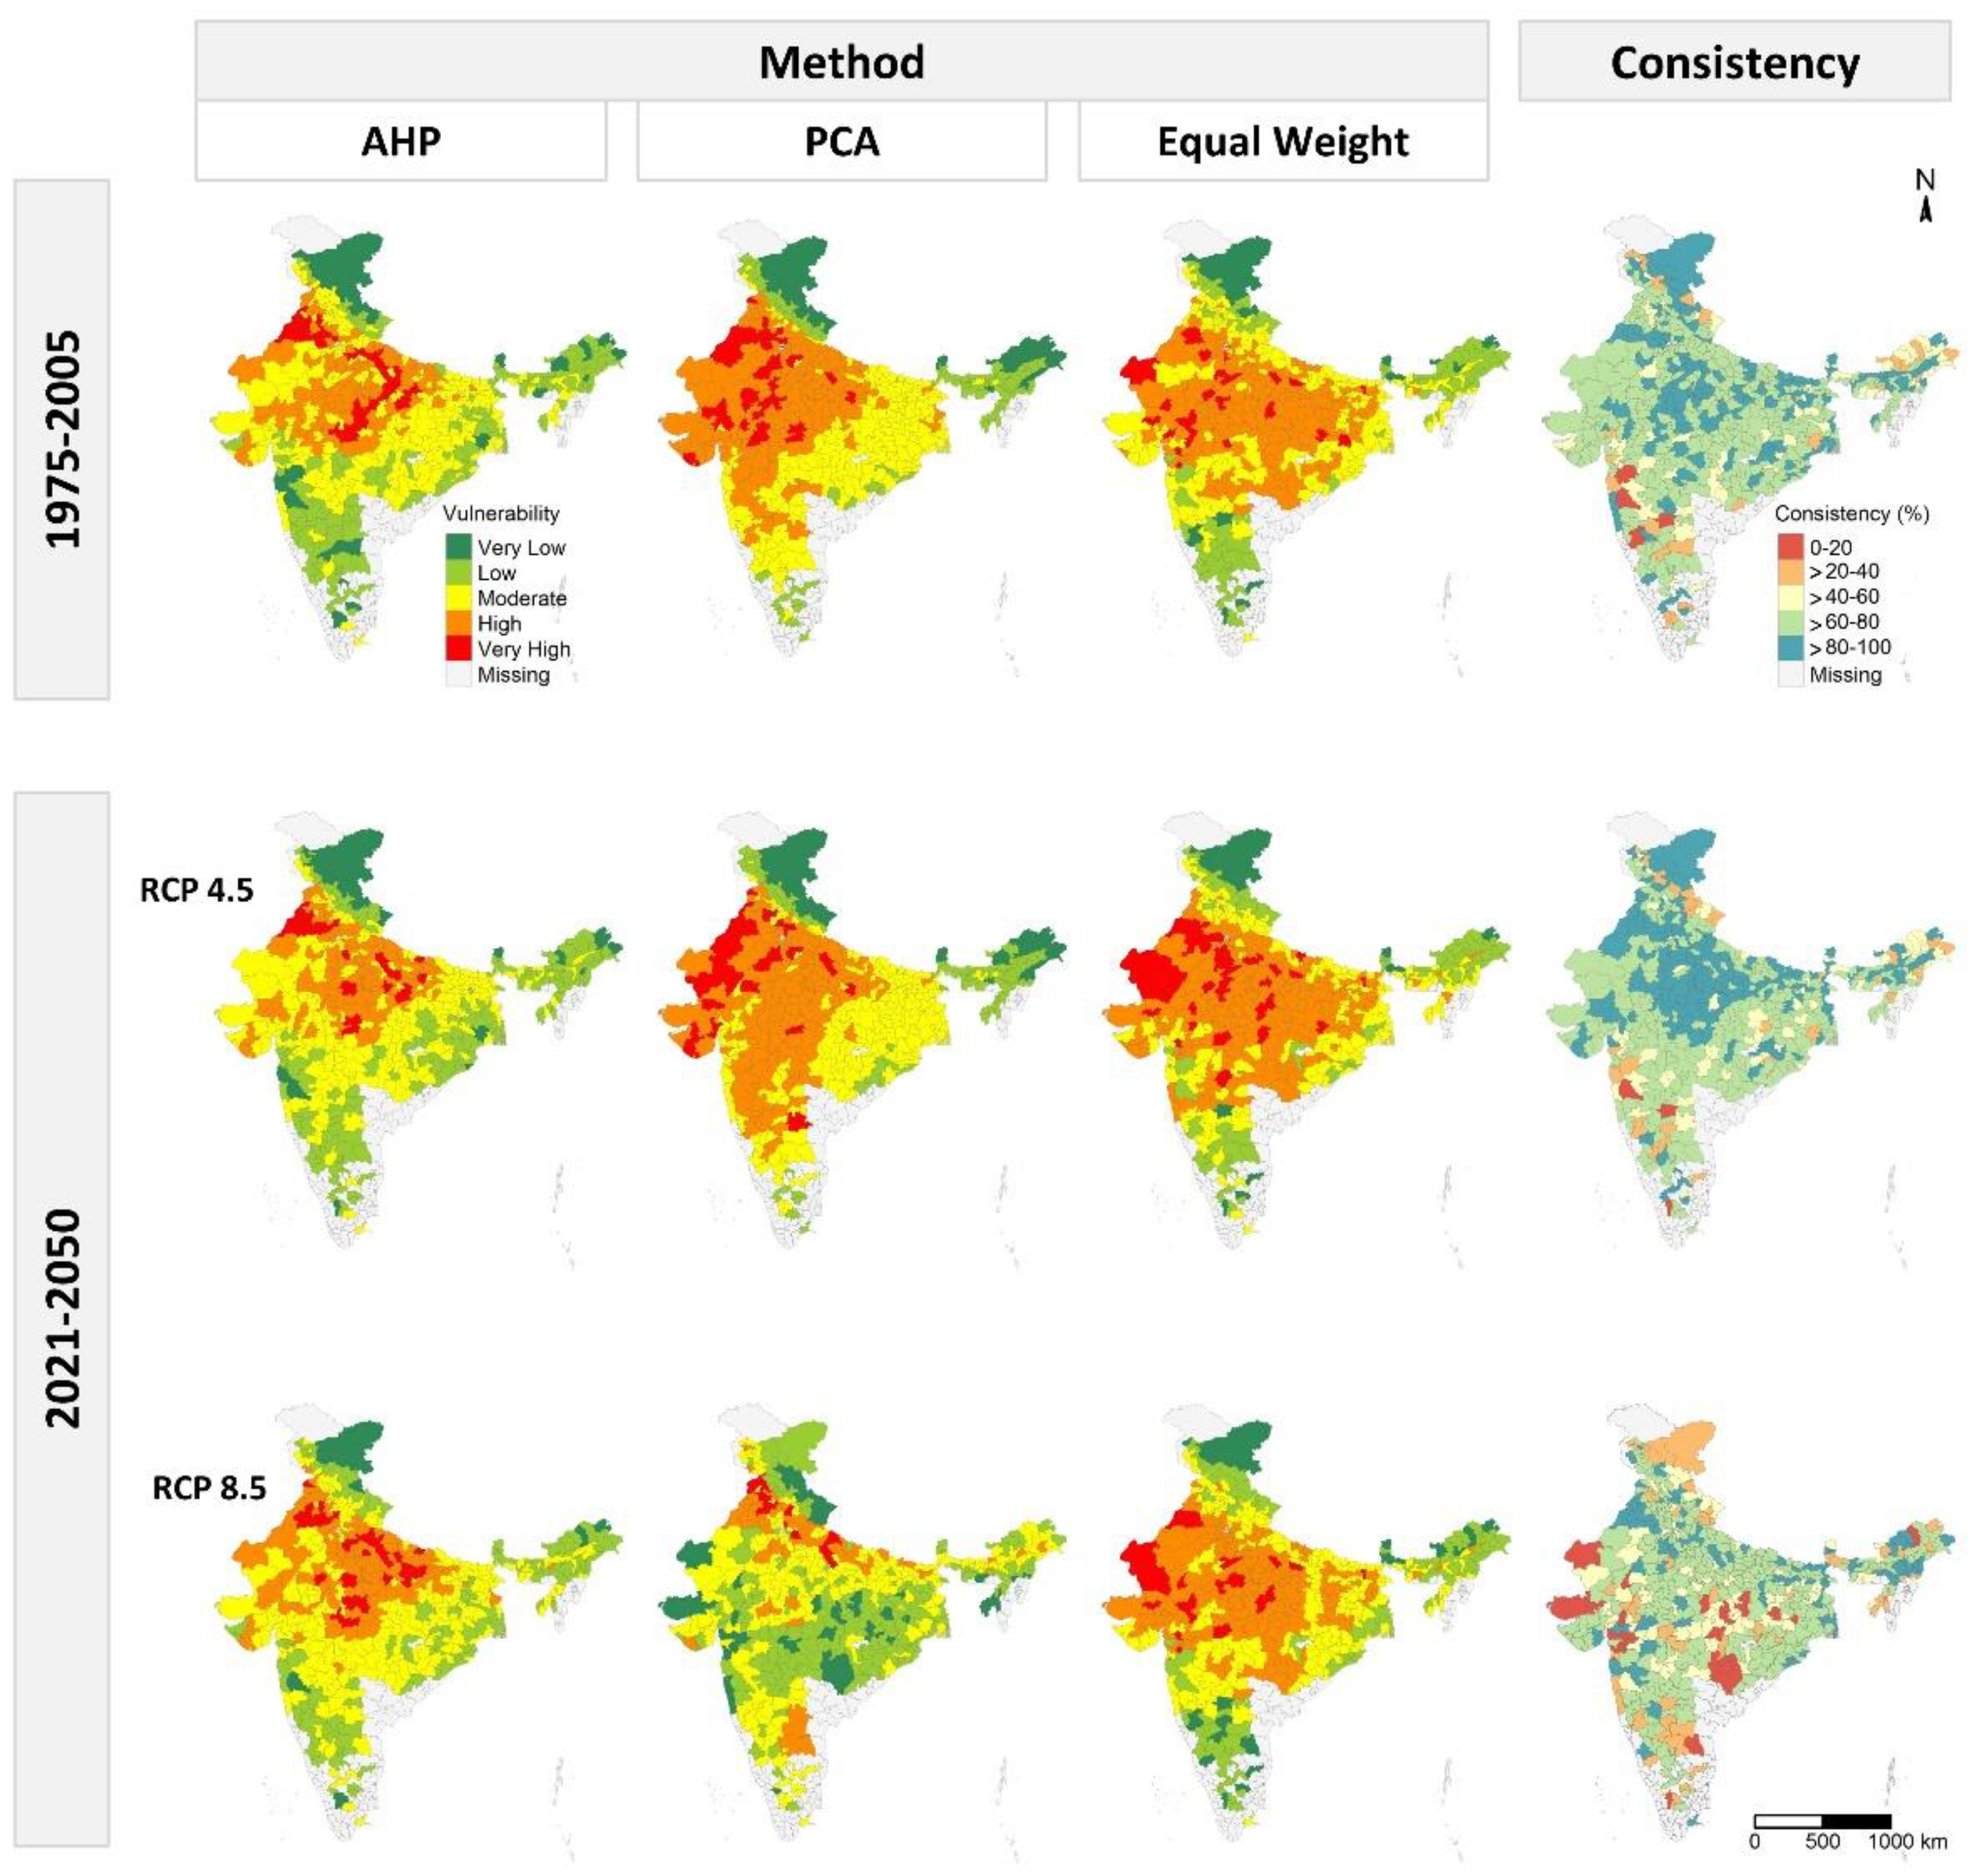
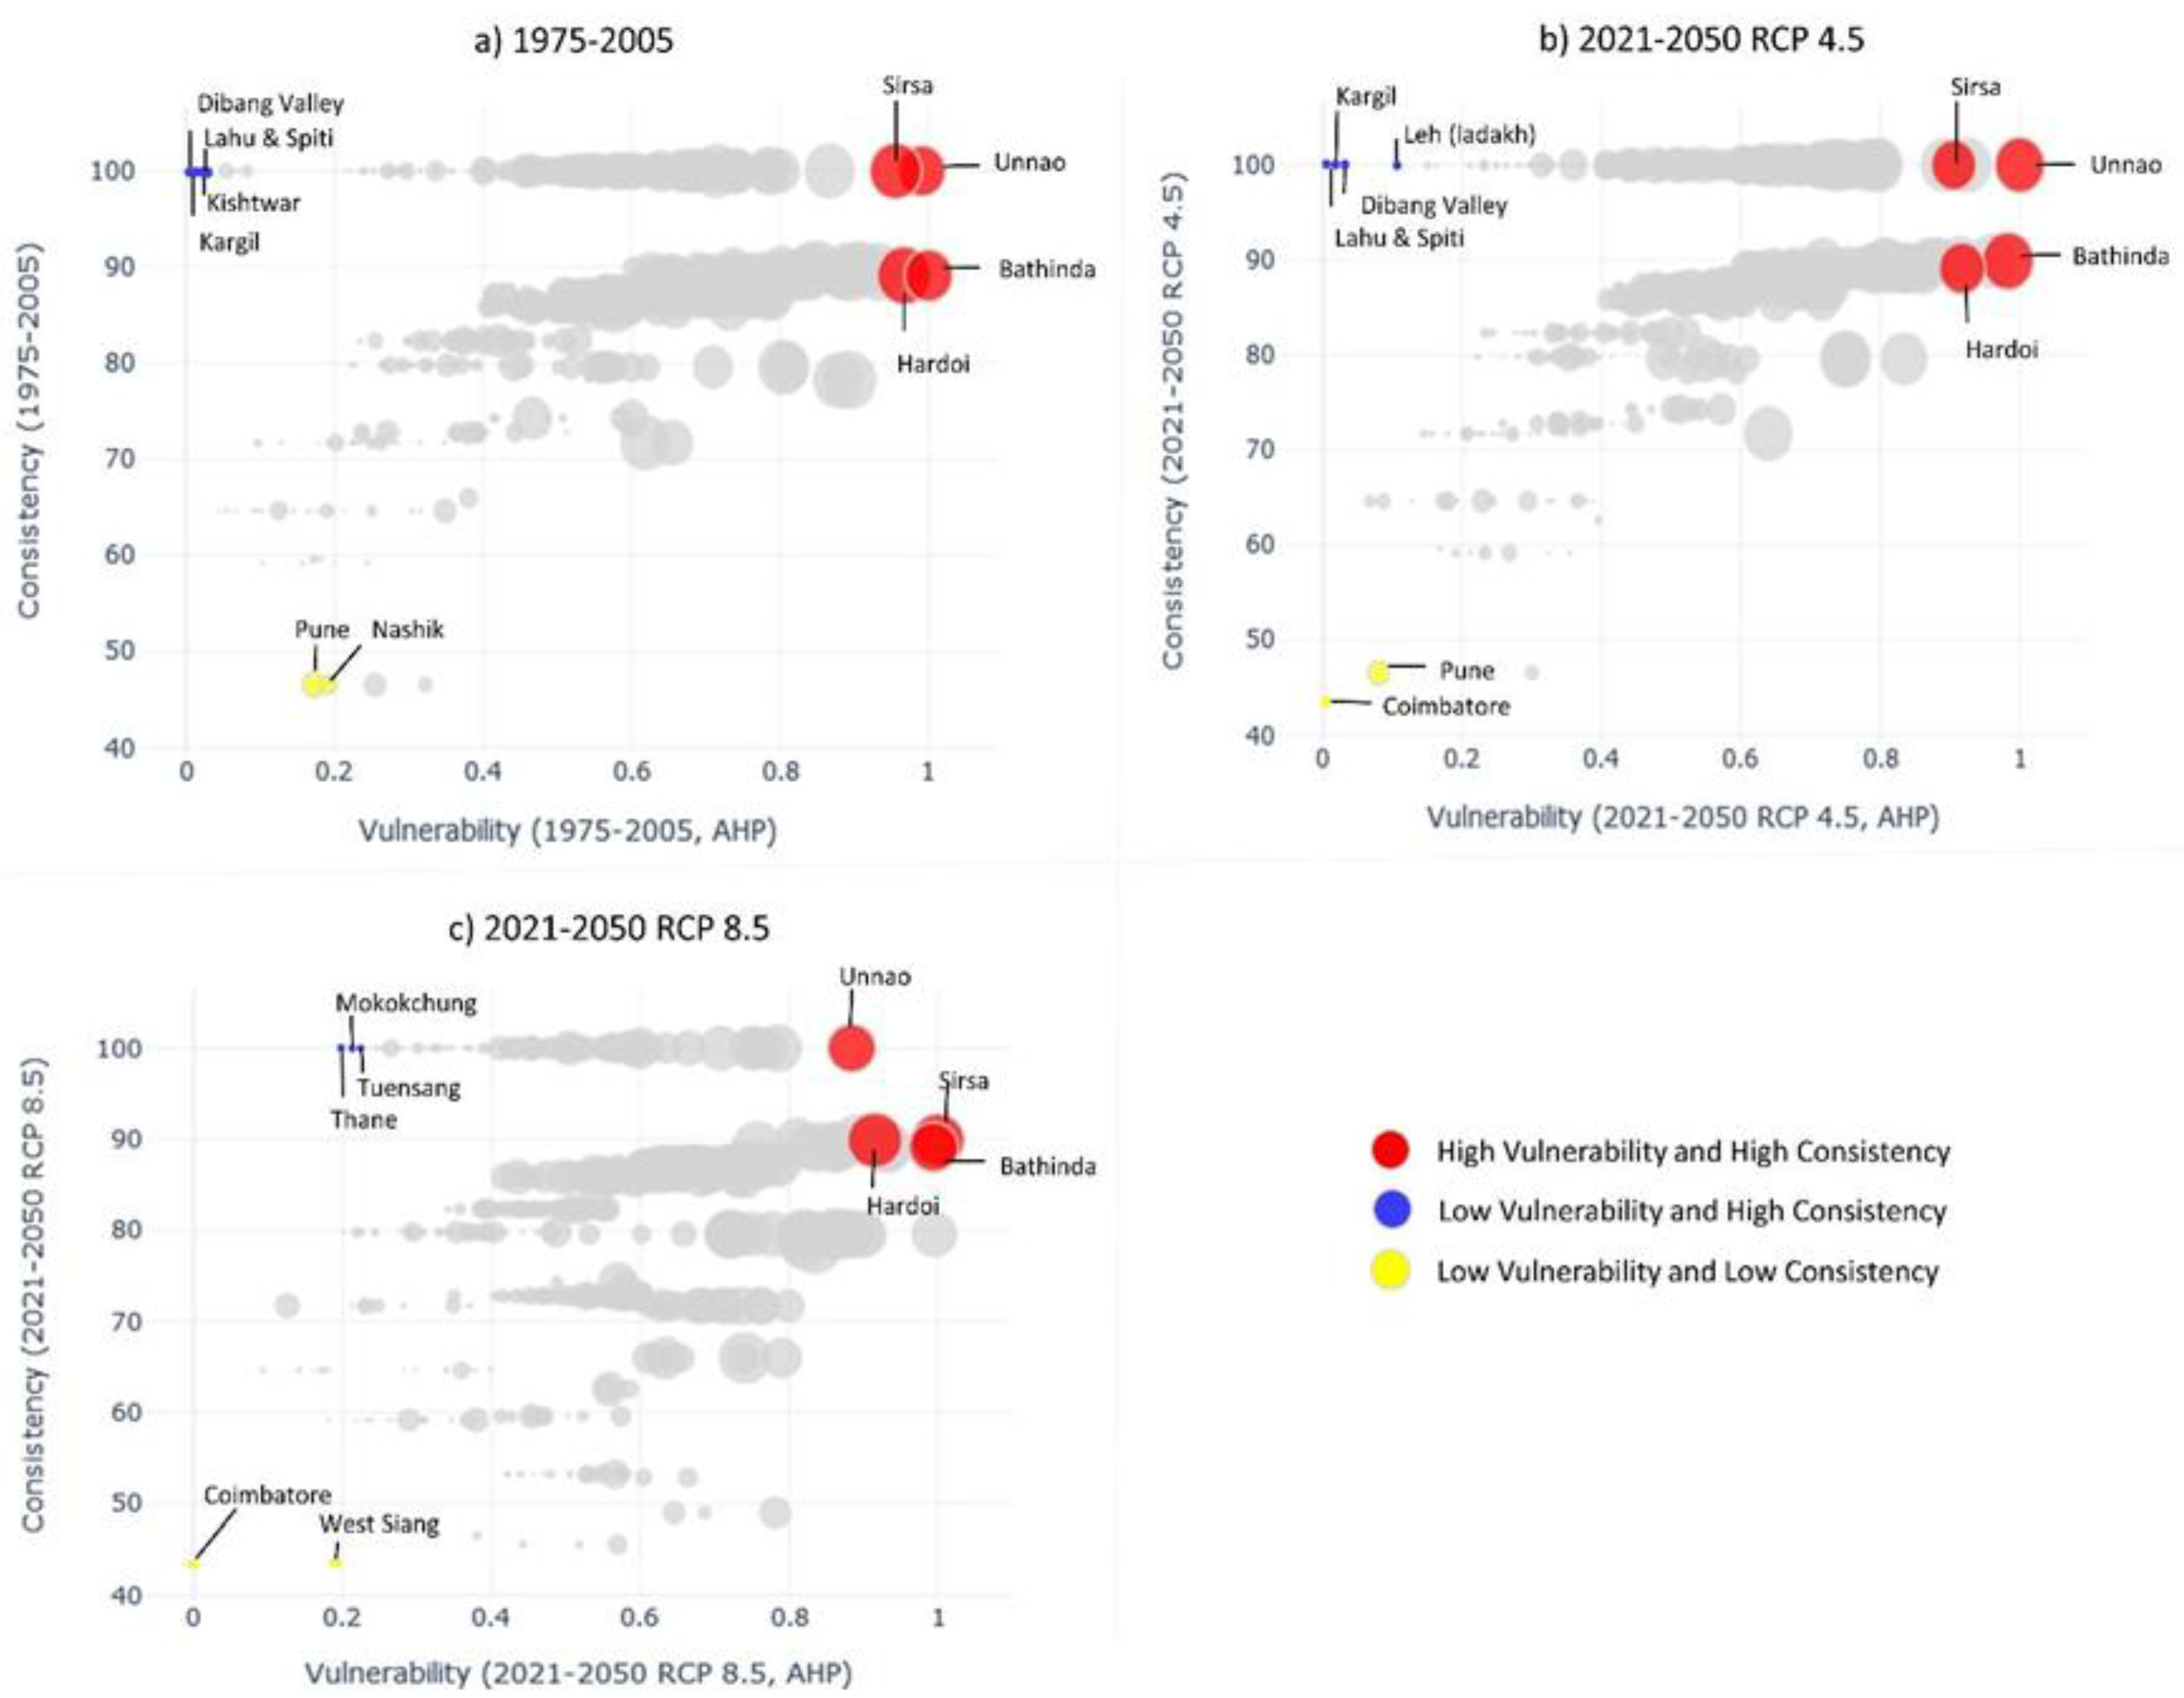
Vulnerability indices classified into vulnerability classes using equal intervals are presented in Figure 3, which shows vulnerability maps for the current climate (1975–2005) and future (2021–2050) RCP 4.5 and RCP 8.5 climate scenarios. It can be noted that although the indicators and classification method are the same, maps show differences based on the weighting method. However, the overall vulnerability pattern of the maps is similar across methods and climate scenarios. The highest vulnerability of wheat is identified in the northern and central parts of India. In the current climate, 84% of the districts observe above 75% consistency, and 83% and 68% of the districts show above 75% consistency for future (2021–2050) RCP 4.5 and RCP 8.5 climate scenarios, respectively. In Figure 4, it can be observed that most of the districts with higher consistency score across weighting methods record high vulnerability index values, and very low consistency districts record lower vulnerability index values.
At district level, four districts, namely Unnao, Sirsa, Hardoi, and Bathinda showed high vulnerability and high consistency across current (1975–2005) and future (2021–205) RCP 4.5 and RCP 8.5 climate scenarios. High vulnerability of wheat in these districts is mainly due to high frequency of moderate and severe droughts, high GDD, an abundant wheat sown area (high dependence), low agriculture and economic indices, and low fertilizer (NPK) consumption. Figure 4 shows the district profile contrasting the vulnerability index and consistency between methods. The size of the bubble indicates the wheat acreage per district. Dibang Valley, Lahu and Spiti, Kishtwar, Kargil, Leh (Ladakh), Mokokchung, Tuensang, and Thane have low vulnerability and high consistency between methods, as shown in Figure 4. Low vulnerability in these districts is primarily due to low GDD, low frequency of severe droughts, low dependence and high soil organic carbon. Moreover, Pune, Nashik, Coimbatore, and West Siang show low vulnerability using the AHP method due to low dependence and low frequency of severe and extreme droughts. Furthermore, Pune and Coimbatore have high economic indices, and West Siang has a low GDD. However, the consistency between methods is low for these districts, as displayed in Figure 4. Table S1 provided in Supplementary Information 4 classifies districts into five vulnerability classes based on the vulnerability indices (AHP, PCA, and EWs).
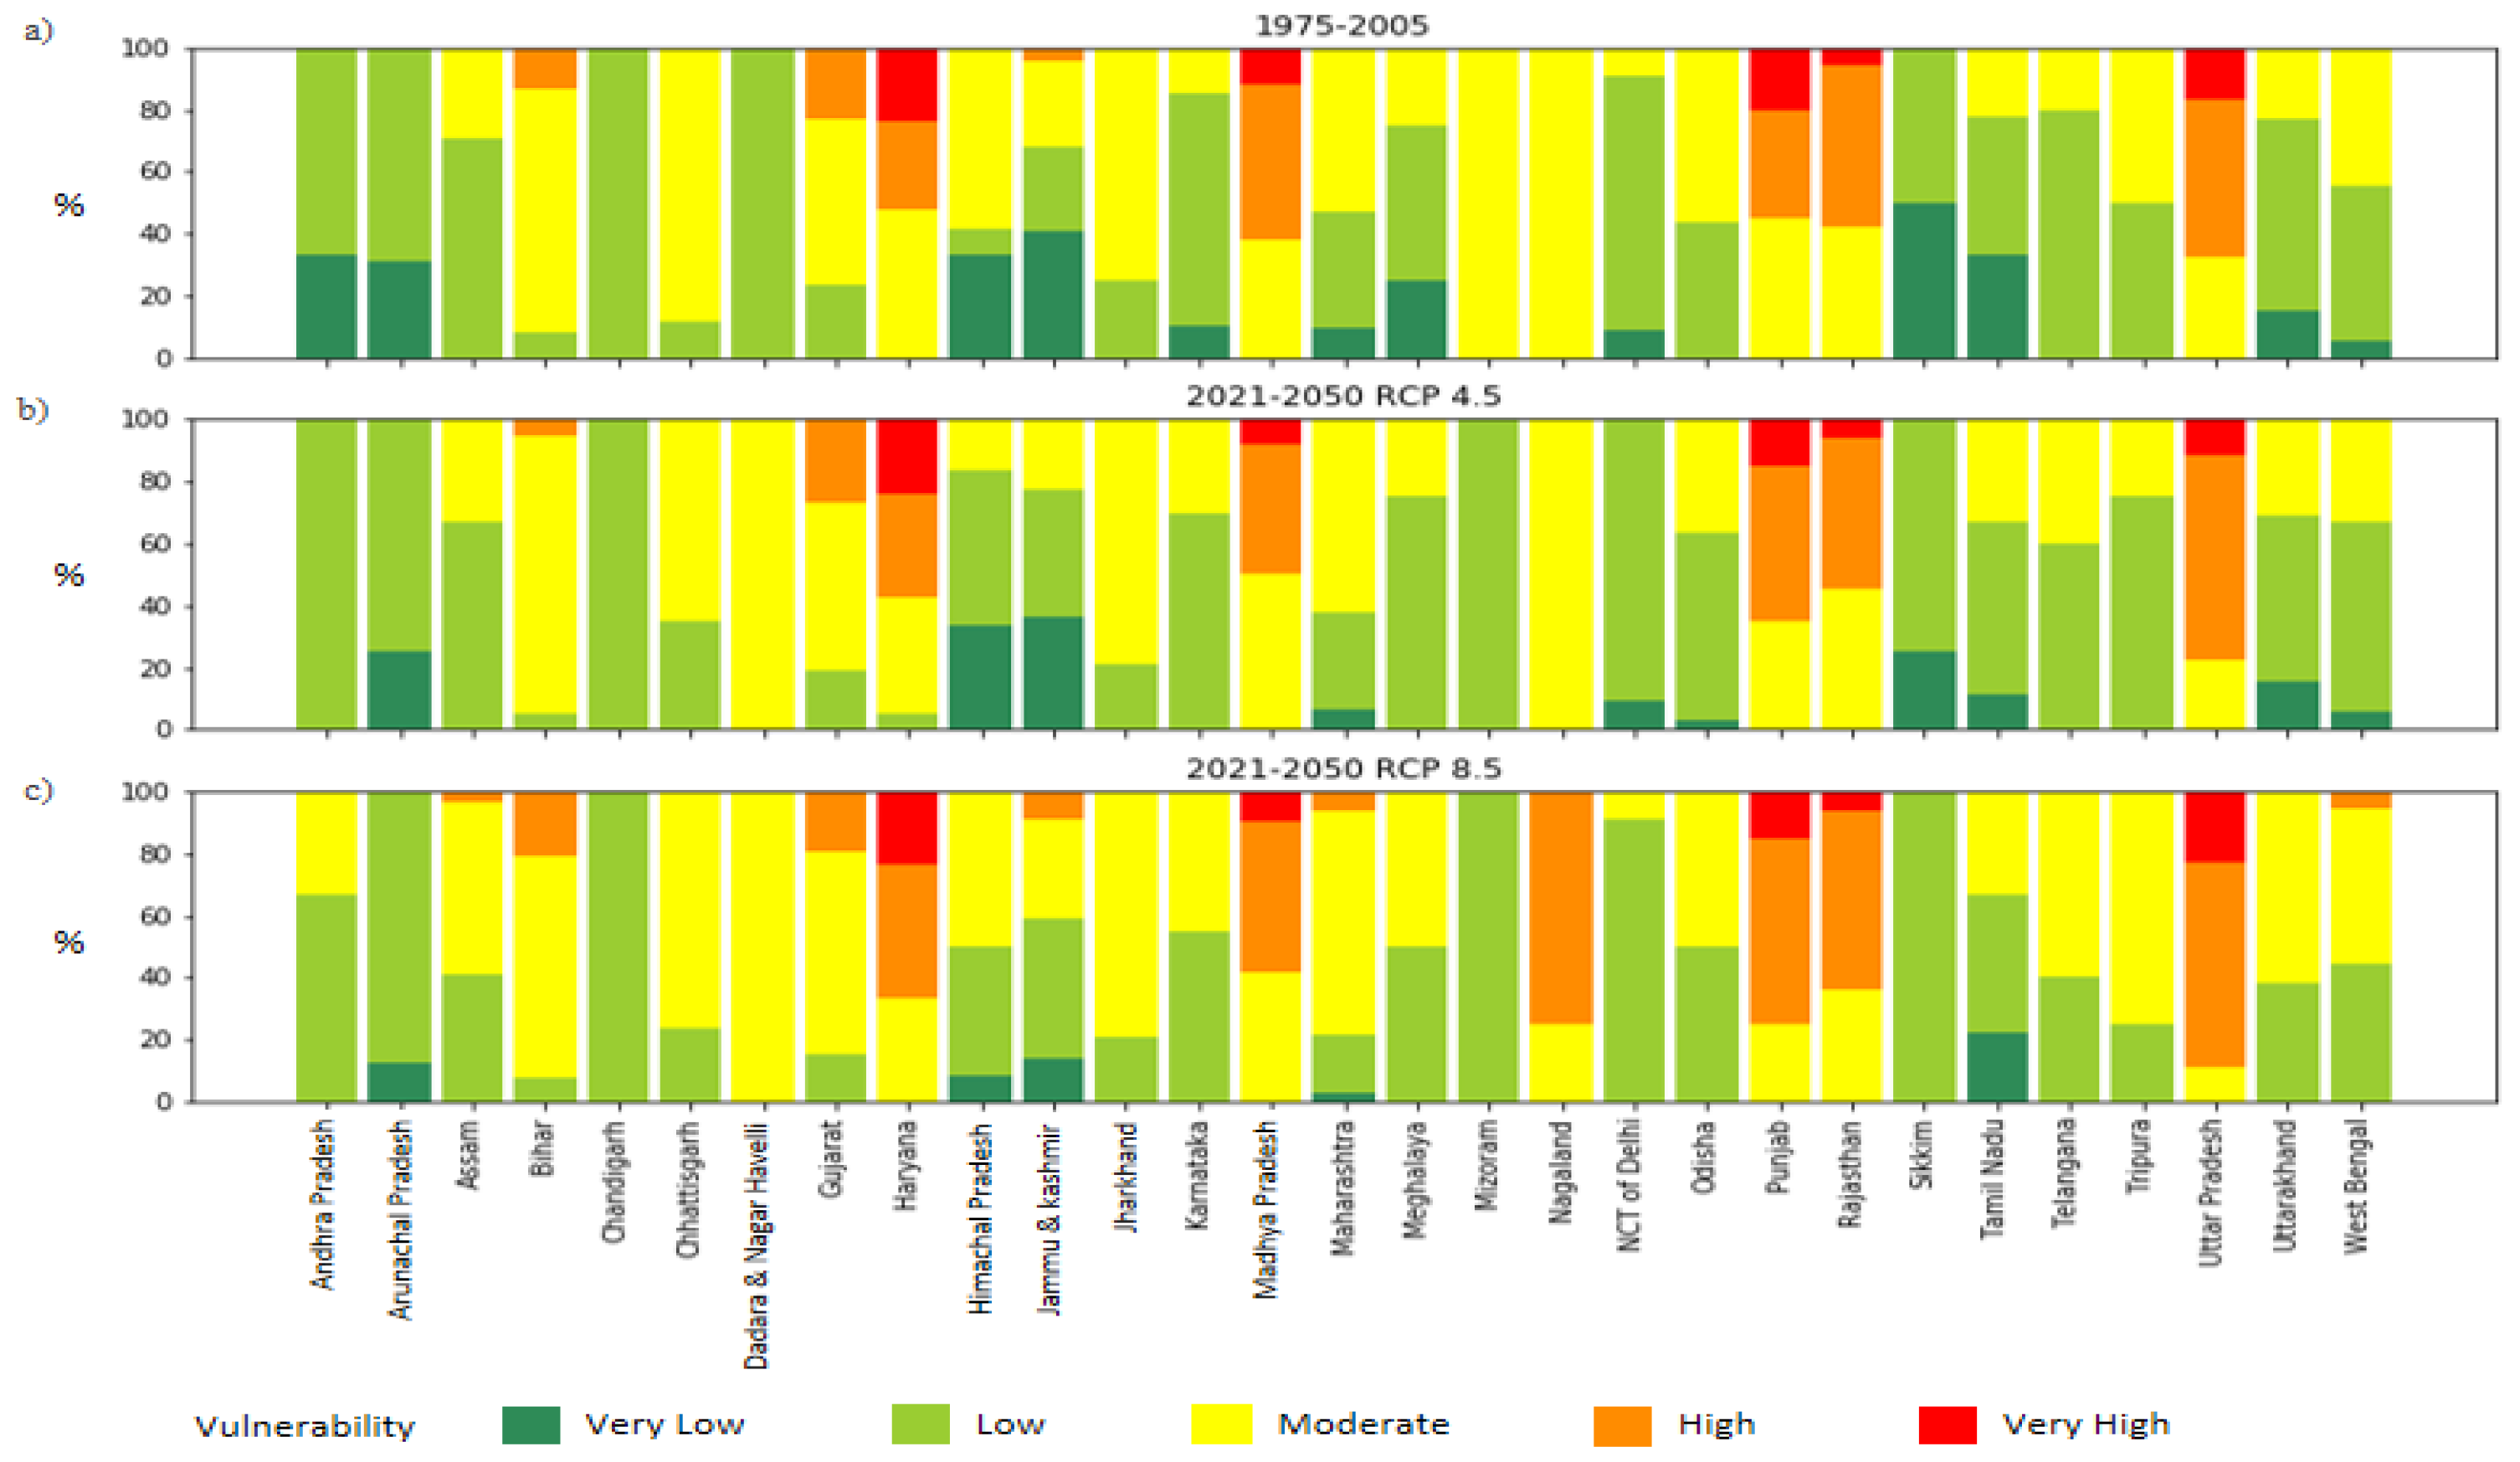
Figure 5 shows high vulnerability of wheat in the states of Uttar Pradesh, Punjab, Haryana, Madhya Pradesh, and Rajasthan. High vulnerability in these states can be ascribed to high climate variability, climate extremes, and high sensitivity due to large net sown areas of wheat and potential evapotranspiration in these regions.

4.2. Consistency across Weighting Methods in Assessing Wheat Crop Vulnerability

To evaluate the consistency across the different weighting methods, the different combinations of the three methods and three climate scenarios are compared through scatter plots and regression analysis. The scatter plots indicate that the similarity in results varied across methods and climate scenarios. Figure 6a,b display scatter plots between vulnerability values for RCP 8.5 (2021–2050) climate scenario computed using EWs and PCA (EWs-PCA) and EWs and AHP (EWs-AHP), respectively. As Figure 6b (rvalue = 0.736; slope = 0.8, based on regression) shows less spread as compared to Figure 6a (rvalue = −0.02; slope = −0.022), the vulnerability values computed using EWs and AHP are more comparable as compared to EWs and PCA for the RCP 8.5 (2021–2050) climate scenario. It can also be observed in Figure 6c (rvalue = 0.395; slope = 0.402) and Figure 6d (rvalue = 0.756; slope = 0.776) that the AHP and PCA methods combination shows greater spread in the RCP 8.5 climate scenario as compared to the current (1975–2021) climate scenario.
As the relationship between two methods is not quantifiable through scatter plots, we have conducted a regression analysis of the 18 combinations (shown in Table 3) to test for similarities and differences between the methods and to qualify the relationship between the methods in respective climate scenarios. The regression analysis indicates that 14 of 18 method combinations (7 pairs) are strongly related (0.6 > β1 < 1.4) (p-value < 0.05) and two (AHP–PCA; 2021–2050 RCP 8.5 and PCA–AHP; 2021–2050 RCP 8.5 combinations) of the method combinations show a feeble relationship (0.2 > β1 < 0.6) with p-value < 0.05. Moreover, two method combinations (EWs–PCA; 2021–2050 RCP 8.5 and PCA–EWs; 2021–2050 RCP 8.5 combinations) show a negative relationship (β1 < 0) with the p-value > 0.05. Table 3 gives the values for the regression coefficients for different weighting methods for the three climate scenarios under study.

5. Discussion

The identification and assessment of adaptation options for responding to impacts of climate change require an understanding of the underlying vulnerability. Therefore, the vulnerability concept has emerged as a central concept in climate change and environment research. Extensive literature is available on the vulnerability assessment of agricultural systems in response to climate change [28,49,58,59]. However, the existing literature makes use of different methodological approaches without an inter-comparison. Moreover, work specific to wheat crops is limited [18,24]. Wheat is the one of the staple food crops of India and contributes extensively to national food and to the livelihood security of small-scale farmers. Therefore, this study evaluates the vulnerability of wheat to climate change according to the IPCC framework based on a function of exposure, sensitivity, and adaptive capacity. While exposure and sensitivity are assumed to be directly proportional to vulnerability, adaptive capacity is inversely related. The resulting vulnerability is then computed as the net effect of exposure, sensitivity, and adaptive capacity [60,61].
The vulnerability indices are computed using three weighting methods (AHP, PCA, and EWs) and evaluated through consistency parameter, scatter plots, and regression analysis. It can be observed that the vulnerability indices computed using different weighting methods are comparable as more than 80% districts have above 75% consistency in the results for the current and future RCP 4.5 scenario, and more than 65% districts have greater than 75% consistency in the results for future RCP 8.5 scenario. Likewise, the results of regression analysis indicated that all the 12 method combinations (6 pairs) for current and future RCP 4.5 scenarios and two out of six method combinations for the future RCP 8.5 scenario show a strong relationship. Moreover, two method combinations in the case of a future RCP 8.5 scenario show a feeble relationship. Hence, the vulnerability indices computed using different weighting methods are comparable and thus can be used for vulnerability assessment. From the above-mentioned observations, it can also be concluded that the results are more comparable in the case of current and RCP 4.5 climate scenarios as compared to the RCP 8.5 climate scenario. Similar conclusions can be drawn from scatter plots as scatter plots for future RCP 8.5 scenario method combinations produce greater spread as compared to current and future RCP 4.5 scenarios. The greater variability in the results for the RCP 8.5 climate scenario can be attributed to the inherent uncertainty of the projected climate scenario data due to limited coverage of extreme events and the connection to the environmental or social system [62,63]. In their study, Wirehn et al. also evaluated the differences in agricultural vulnerability to climate change depending on the summarization and weighting methods through the coefficient of variation, scatter plots, and regression analysis [37]. The study reviewed EWs, PCA Type1 (first component), and PCA Type2 (components with eigenvalue > 1) methods; the coefficient of variation ranged from ~10–94% between methods, and 34 out of 36 method combinations produced notably different values for vulnerability, thereby supporting our findings.
Our study contributes to the existing literature on the vulnerability of wheat in India. For instance, Kumar et al. projected a decrease in wheat yield for the states of central and northern India by 8–22% in Punjab and Haryana, a reduction by ~24% in Uttar Pradesh and a reduction by ~25% in Rajasthan and Madhya Pradesh [3]. The results of our study indicate 15–24% districts in Punjab and Haryana, 11–23% districts in Uttar Pradesh, and 6–12% districts in Rajasthan and Madhya Pradesh show very high vulnerability in current and future climate scenario. However, the present study builds on the existing studies [3,24,34] by using a broader selection of indicators incorporating climatic, land, agricultural, biophysical, human, infrastructure, and economic dimensions to characterize vulnerability and understand the distribution of vulnerability for two probable future scenarios. Our selection of 27 indicators was based on a systematic understanding of India’s wheat production system. In addition to the coefficient of variation in rainfall used in previous studies, this study includes important indicators like GDD and SPI to account for exposure to climate change. Moreover, relevant supplementary indicators like the area under leguminous crops, consumption of NPK, farm harvest price, and amount of power-driven equipment for wheat are included in this study to characterize for sensitivity and adaptive capacity of a district, thereby strengthening our analysis. In addition to assessing the spatial heterogeneity of the vulnerability of wheat, this study also uses climate projects to analyze the exposure of wheat production in future periods.
Although the vulnerability indices are strongly related for the majority of the method combinations, few of the districts show variation in the vulnerability classes for different weighting methods. In general, our results are in line with the findings of Wirehn et al., who emphasize the importance of the methodological choices of weighting when using composite indices for agricultural vulnerability assessment [35]. Similarly, in our study, we do not affirm whether one method is preferable over the other; rather, we provide evidence on the differences across different weighting methods. Therefore, we advocate the importance of understanding the choice of weighting methods and caution in using one single method to assess agricultural vulnerability. We also re-iterate the need for communicating uncertainties, both induced by data and methods, when presenting the indicator-based vulnerability assessments to make the findings more reliable for policymakers.
Several uncertainty sources have to be acknowledged when interpreting the results of this study. The use of different climate models could provide better understanding of the sources of climate scenarios and assessment of uncertainty associated with projected climate scenarios. Therefore, one of the limitations of the study is the use of a single climate model to characterize climatic conditions in the current and future scenario. In addition, the future assessment of vulnerability is conditional on the assumption of no change in sensitivity and adaptation with respect to the current scenario, as projection for these indicators would add to uncertainty in the results. Therefore, future vulnerability assessment should not be interpreted as the correct magnitude of climate change impact. Rather, the results offer a temporal evolution of vulnerability under the changing climate.
The assessment of vulnerability can help policymakers identify hotspots and prioritize strategies for dealing with the adverse impact of climate change and for efficient allocation of resources. With the advent of climate change, food security is also becoming a major concern due to decreasing wheat production and thus potential losses of agricultural incomes and associated climate livelihoods. Therefore, it is important to address the challenge of climate change and choose efficient adaptation strategies. Adaptation to climate change can not only reduce the impact of climate change but can also provide co-benefits like increased crop yield. However, the effectiveness of the adaptive strategies applied at the regional level is often uncertain and depends on regional exposure, sensitivity, and adaptive capacity [61]. Thus, adaptation strategies should be based on scientific results, considering the specific impacts of climate change. Hence, apart from providing useful information to policymakers and stakeholders, this study can be further used as a baseline to design climate impacts’ adjusted adaptation measures.

6. Conclusions

This study has three main conclusions: First, wheat is vulnerable to climate change in northern and central India primarily due to high dependence characterized by net sown area, high GDD, and high frequency of severe and extreme droughts; second, the results of vulnerability analysis using three weighting methods (AHP, PCA, and EWs) are more consistent for current and future RCP 4.5 scenarios as compared to the future RCP 8.5 scenario; and third, the choice of weighting method used in a composite index (in this case, a vulnerability index) influence the vulnerability assessment as the majority of the method combinations tested in this study produce strongly related but slightly different vulnerability indices. There is a need to effectively communicate uncertainties, both with respect to data and methods, in indicator-based vulnerability assessments. In future, the use of different climate models could facilitate the assessment of uncertainty related to climate projections. The results of this study could serve as the basis for designing climate impacts adjusted adaptation measures by policymakers and for policy interventions. In particular, the results could help policymakers to prioritize regions and hotspots of high vulnerability (and high consistency) for implementing adaptation measures and reduce the bias in the selection of hotspot-region-based weighting methods. This could increase the effect of measures as it would help identify the most suitable regions for an efficient allocation of scarce resources.

Supplementary Materials

The following are available online at https://www.mdpi.com/2071-1050/12/19/8256/s1, Figure S1: Map showing wheat sowing and harvesting months for major wheat growing states of India (Source: Indian Council of Agricultural Research (Crop Science Division)), Calculations, Figure S2: Schematic representation of three weighing methods for constructing vulnerability index. (A) and (B) represent Hierarchical approach, whereas (C) represent an inductive approach to assign weights. A set of 27 indicators were selected and then treated differently across the three (A, B, C) approach, Table S1: Distribution of the wheat growing districts into 5 vulnerability classes. These findings are consistent across the three methods (AHP, equal weights and PCA).

Author Contributions

V.D. and P.J. conceptualized the work. P.J. provided overall guidance and continuous examination of the work. V.D. did primary data collection and took the lead in writing the main text. V.D and R.S. did data analysis and developed graphical inputs. C.G. provided intellectual content, extensive feedback on the initial draft, helped in interpretations of results, and provided relevant conclusions. All the authors read and gave input while revising and finalizing the manuscript. All authors have read and agreed to the published version of the manuscript.

Funding

We acknowledge the support of Deutsche Gesellschaft für Internationale Zusammenarbeit (GIZ) and the German Federal Ministry for Economic Cooperation and Development (BMZ) Open Access Publication Funds at PIK. The research was supported by the projects H2020_Insurance (EU H2020 program), AgRATI, funded by Climate-KIC (EIT) and EPICC, funded by IKI (BMU).

Conflicts of Interest

The authors declare no conflict of interest.

References

  1. USDA Foreign Agricultural Service. Available online: http://www.fas.usda.gov (accessed on 23 September 2020).
  2. Kennedy, D. The importance of rice. Science 2002, 296, 13. [Google Scholar] [CrossRef] [Green Version]
  3. Kumar, S.N.; Aggarwal, P.; Rani, D.S.; Saxena, R.; Chauhan, N.; Jain, S. Vulnerability of wheat production to climate change in India. Clim. Res. 2014, 59, 173–187. [Google Scholar] [CrossRef]
  4. Farmers’ Portal. Fourth Advance Estimates of Production of Foodgrains for 2017–18. Available online: https://eands.dacnet.nic.in/Advance_Estimate/4th_Adv_Estimates2017-18_Eng.pdf (accessed on 2 August 2020).
  5. Acharya, S. Food security and Indian agriculture: Policies, production performance and marketing environment. Agricultural economics research review. Agric. Econ. Res. Assoc. 2009, 22, 1–19. [Google Scholar]
  6. Parayil, G. The Green revolution in India: A case study of technological change. Technol. Cult. 1992, 33, 737. [Google Scholar] [CrossRef]
  7. Zaveri, E.; Lobell, D.B. The role of irrigation in changing wheat yields and heat sensitivity in India. Nat. Commun. 2019, 10, 1–7. [Google Scholar] [CrossRef]
  8. Ramadas, S.; Kumar, T.K.; Singh, G.P. Wheat production in India: Trends and prospects. Recent Adv. Grain Crop. Res. 2020. [Google Scholar] [CrossRef] [Green Version]
  9. Kumar, A.; Singh Poswal, R.; Singh, G.; Kumar Sharma, R.; Singh Saharan, M.; Singh Chhokar, R.; Tyagi, B.; Ramadas, S.; Chand, R.; Sharma, I. Wheat Cultivation in India; Directorate of Wheat Research: Karnal, India, 2020. [Google Scholar]
  10. Yu, Q.; Li, L.; Braunack, M.; Eamus, D.; Xu, S.; Chen, C.; Wang, E.; Liu, J.; Nielsen, D.C. Year patterns of climate impact on wheat yields. Int. J. Clim. 2013, 34, 518–528. [Google Scholar] [CrossRef]
  11. Lal, M.; Singh, K.; Rathore, L.; Srinivasan, G.; Saseendran, S. Vulnerability of rice and wheat yields in NW India to future changes in climate. Agric. For. Meteorol. 1998, 89, 101–114. [Google Scholar] [CrossRef]
  12. Kalra, N.; Chakraborty, D.; Sharma, A.; Rai, H.; Jolly, M.; Chander, S.; Kumar, P.; Bhadraray, S.; Barman, D.; Mittal, R.; et al. Effect of increasing temperature on yield of some winter crops in northwest India. Curr. Sci. 2008, 94, 82–88. [Google Scholar]
  13. Asseng, S.; Ewert, F.; Martre, P.; Rötter, R.P.; Lobell, D.B.; Cammarano, D.; Kimball, B.A.; Ottman, M.J.; Wall, G.W.; White, J.W.; et al. Rising temperatures reduce global wheat production. Nat. Clim. Chang. 2014, 5, 143–147. [Google Scholar] [CrossRef]
  14. IPCC. Summary for Policymakers. In Climate Change and Land: An IPCC Special Report on Climate Change, Desertification, Land Degradation, Sustainable Land Management, Food Security, and Greenhouse Gas Fluxes in Terrestrial Ecosystems; Shukla, J., Skea, E., Calvo Buendia, V., Masson-Delmotte, H.-O., Pörtner, D.C., Roberts, P., Zhai, R., Slade, S., Connors, R., Van Diemen, M., et al., Eds.; 2019; In press. [Google Scholar]
  15. Luo, Q. Temperature thresholds and crop production: A review. Clim. Chang. 2011, 109, 583–598. [Google Scholar] [CrossRef]
  16. Zhao, C.; Liu, B.; Piao, S.; Wang, X.; Lobell, D.B.; Huang, Y.; Huang, M.; Yao, Y.; Bassu, S.; Ciais, P.; et al. Temperature increase reduces global yields of major crops in four independent estimates. Proc. Natl. Acad. Sci. USA 2017, 114, 9326–9331. [Google Scholar] [CrossRef] [Green Version]
  17. Aggarwal, P.; Joshi, P.; Ingram, J.; Gupta, R. Adapting food systems of the Indo-Gangetic plains to global environmental change: Key information needs to improve policy formulation. Environ. Sci. Policy 2004, 7, 487–498. [Google Scholar] [CrossRef]
  18. Mall, R.K.; Singh, R.; Gupta, A.; Srinivasan, G.; Rathore, L.S. Impact of climate change on Indian agriculture: A review. Clim. Chang. 2007, 82, 225–231. [Google Scholar] [CrossRef] [Green Version]
  19. Boote, K.; Singh, A.K. Implications of global climatic change on water and food security. Water Sec. Clim. Chang. Sust. Dev. 2009, 49–63. [Google Scholar] [CrossRef]
  20. Rao, C.S.; Gopinath, K.; Prasad, J.; Prasannakumar; Singh, A. Climate resilient villages for sustainable food security in tropical India: Concept, process, technologies, institutions, and impacts. Adv. Agron. 2016, 140, 101–214. [Google Scholar] [CrossRef]
  21. Basha, S.G.; Kishore, P.; Ratnam, M.V.; Jayaraman, A.; Kouchak, A.A.; Ouarda, T.B.M.J.; Velicogna, I. Historical and projected surface temperature over India during the 20th and 21st century. Sci. Rep. 2017, 7, 2987. [Google Scholar] [CrossRef] [Green Version]
  22. Shewry, P.R.; Halford, N.G. Cereal seed storage proteins: Structures, properties and role in grain utilization. J. Exp. Bot. 2002, 53, 947–958. [Google Scholar] [CrossRef] [Green Version]
  23. Triboi, A.-M.; Martres, P.; Girousse, C.; Ravel, C.G.; Triboi-Blondel, A.-M. Unravelling environmental and genetic relationships between grain yield and nitrogen concentration for wheat. Eur. J. Agron. 2006, 25, 108–118. [Google Scholar] [CrossRef]
  24. Sharma, T.; Vittal, H.; Karmakar, S.; Ghosh, S. Increasing agricultural risk to hydro-climatic extremes in India. Environ. Res. Lett. 2020, 15, 034010. [Google Scholar] [CrossRef]
  25. Martres, P.; Wallach, D.; Asseng, S.; Ewert, F.; Jones, J.W.; Rötter, R.P.; Boote, K.J.; Ruane, A.C.; Thorburn, P.J.; Cammarano, D.; et al. Multimodel ensembles of wheat growth: Many models are better than one. Glob. Chang. Biol. 2014, 21, 911–925. [Google Scholar] [CrossRef] [PubMed]
  26. Füssel, H.-M.; Klein, R.J.T. Climate change vulnerability assessments: An evolution of conceptual thinking. Clim. Chang. 2006, 75, 301–329. [Google Scholar] [CrossRef]
  27. Huai, J. Integration and typologies of vulnerability to climate change: A case study from Australian wheat sheep zones. Sci. Rep. 2016, 6, 33744. [Google Scholar] [CrossRef] [PubMed]
  28. Attri, S.D.; Rathore, L.S. Simulation of impact of projected climate change on wheat in India. Int. J. Clim. 2003, 23, 693–705. [Google Scholar] [CrossRef]
  29. Pathak, H.; Wassmann, R. Quantitative evaluation of climatic variability and risks for wheat yield in India. Clim. Chang. 2008, 93, 157–175. [Google Scholar] [CrossRef]
  30. Aggarwal, P.; Kumar, S.; Pathak, H. Impacts of Climate Change on Growth and Yield of Rice and Wheat in the Upper Ganga Basin; WWF: New Delhi, India, 2010. [Google Scholar]
  31. Fraser, E.D.; Simelton, E.; Termansen, M.; Gosling, S.N.; South, A. Vulnerability hotspots: Integrating socio-economic and hydrological models to identify where cereal production may decline in the future due to climate change induced drought. Agric. For. Meteorol. 2013, 170, 195–205. [Google Scholar] [CrossRef]
  32. Moorthy, A.; Buermann, W.; Rajagopal, D. The Impact of Climate Change on Crop. Yields in India from 1961 to 2010; State Centre on Climate Change: Himachal Pradesh, India, 2012. [Google Scholar]
  33. Liu, B.; Asseng, S.; Müller, C.; Ewert, F.; Elliott, J.; Lobell, D.B.; Martres, P.; Ruane, A.C.; Wallach, D.; Jones, J.W.; et al. Similar estimates of temperature impacts on global wheat yield by three independent methods. Natl. Clim. Chang. 2016, 6, 1130–1136. [Google Scholar] [CrossRef]
  34. Sendhil, R.; Jha, A.; Kumar, A.; Singh, S. Extent of vulnerability in wheat producing agro-ecologies of India: Tracking from indicators of cross-section and multi-dimension data. Ecol. Indic. 2018, 89, 771–780. [Google Scholar] [CrossRef]
  35. Gupta, R.; Somanathan, E.; Dey, S. Global warming and local air pollution have reduced wheat yields in India. Clim. Chang. 2016, 140, 593–604. [Google Scholar] [CrossRef]
  36. Sonkar, G.; Mall, R.K.; Banerjee, T.; Singh, N.; Kumar, T.L.; Chand, R. Vulnerability of Indian wheat against rising temperature and aerosols. Environ. Pollut. 2019, 254, 112946. [Google Scholar] [CrossRef]
  37. Wiréhn, L.; Danielsson, Å.; Neset, T.-S.S. Assessment of composite index methods for agricultural vulnerability to climate change. J. Environ. Manag. 2015, 156, 70–80. [Google Scholar] [CrossRef] [PubMed]
  38. Parker, L.; Bourgoin, C.; Martinez-Valle, A.; Laderach, P. Vulnerability of the agricultural sector to climate change: The development of a pan-tropical climate risk vulnerability assessment to inform sub-national decision making. PLoS ONE 2019, 14, e0213641. [Google Scholar] [CrossRef] [PubMed] [Green Version]
  39. IPCC; Smith, J.; Schellnhuber, H.; Mirza, M. Vulnerability to Climate Change and Reasons for Concern: A Synthesis; Cambridge University Press: Cambridge, UK; New York, NY, USA, 2001. [Google Scholar]
  40. India at a Glance. FAO in India. Food and Agriculture Organization of the United Nations. Available online: http://www.fao.org/india/fao-in-india/india-at-a-glance/en/ (accessed on 24 September 2020).
  41. Directorate of Wheat Development Ministry of Agriculture. Status Paper on Wheat; Department of Agriculture and Cooperation: Ghaziabad, India, 2016. [Google Scholar]
  42. Wheeler, T.R.; Von Braun, J. Climate change impacts on global food security. Science 2013, 341, 508–513. [Google Scholar] [CrossRef] [PubMed]
  43. Allen, S.K.; Burton, I.; Campbell-Lendrum, D.; Cardona, O.D.; Cutter, S.L.; Dube, O.P.; Ebi, K.L.; Handmer, J.W.; Lal, P.N.; Lavell, A.; et al. Summary for policymakers. Manag. Risks Extrem. Events Disasters Adv. Clim. Chang. Adapt. 2012, 3–22. [Google Scholar] [CrossRef]
  44. IPCC; Parry, O.F.C.; Palutikof, J.P.; Van der Linden, P.J.; Hanson, C.E. (Eds.) Summary for Policymakers. Climate Change 2007: Impacts, Adaptation and Vulnerability. Contribution of Working Group II to the Fourth Assessment Report of the Intergovernmental Panel on Climate Change; Cambridge University Press: Cambridge, UK; New York, NY, USA, 2014; pp. 1–32. [Google Scholar]
  45. Dunne, J.P.; John, J.G.; Adcroft, A.J.; Griffies, S.M.; Hallberg, R.W.; Shevliakova, E.; Stouffer, R.J.; Cooke, W.; Dunne, K.A.; Harrison, M.J.; et al. GFDL’s ESM2 global coupled climate-carbon earth system models. Part I: Physical formulation and baseline simulation characteristics. J. Clim. 2012, 25, 6646–6665. [Google Scholar] [CrossRef] [Green Version]
  46. Jena, P.; Azad, S.; Rajeevan, M. Statistical selection of the optimum models in the CMIP5 dataset for climate change projections of Indian monsoon rainfall. Climate 2015, 3, 858–875. [Google Scholar] [CrossRef] [Green Version]
  47. Adger, W.N. Vulnerability. Glob. Environ. Chang. 2006, 16, 268–281. [Google Scholar] [CrossRef]
  48. Smit, B.; Wandel, J. Adaptation, adaptive capacity and vulnerability. Glob. Environ. Chang. 2006, 16, 282–292. [Google Scholar] [CrossRef]
  49. Tate, E. Social vulnerability indices: A comparative assessment using uncertainty and sensitivity analysis. Natl. Hazards 2012, 63, 325–347. [Google Scholar] [CrossRef]
  50. O’Brien, K.; Leichenko, R.; Kelkar, U.; Venema, H.; Aandahl, G.; Tompkins, H.; Javed, A.; Bhadwal, S.; Barg, S.; Nygaard, L.; et al. Mapping vulnerability to multiple stressors: Climate change and globalization in India. Glob. Environ. Chang. 2004, 14, 303–313. [Google Scholar] [CrossRef]
  51. Ding, G.K. Sustainable construction-The role of environmental assessment tools. J. Environ. Manag. 2008, 86, 451–464. [Google Scholar] [CrossRef] [PubMed] [Green Version]
  52. Brozova, H.; Rizicka, M. The AHP and ANP Models for Transport Environmental Impacts Assessment. Wseas Trans. Power Syst. 2010, 5, 233–242. [Google Scholar]
  53. Sehgal, V.K.; Singh, M.R.; Chaudahry, A.; Jain, N.; Pathak, S. Vulnerability of Agriculture to Climate Change, District level Assessment in the Indo-Gangetic Plains; Indian Agricultural Research Institute, Indian Council of Agricultural Research: New Delhi, India, 2013. [Google Scholar]
  54. Siddayao, G.P.; Valdez, S.E.; Fernandez, P.L. Analytic Hierarchy Process (AHP) in spatial modeling for floodplain risk assessment. Int. J. Mach. Learn. Comput. 2014, 4, 450–457. [Google Scholar] [CrossRef]
  55. Mazumdar, J.; Paul, S.K. Socioeconomic and infrastructural vulnerability indices for cyclones in the eastern coastal states of India. Nat. Hazards 2016, 82, 1621–1643. [Google Scholar] [CrossRef]
  56. Chakraborty, A.; Joshi, P. Mapping disaster vulnerability in India using analytical hierarchy process. Geomat. Nat. Hazards Risk 2014, 7, 308–325. [Google Scholar] [CrossRef]
  57. Bowman, D.T. Common use of the CV: A statistical aberration in crop performance trials (Contemporary Issue). J. Cotton Sci. 2001, 5, 137–141. [Google Scholar]
  58. Mall, R.; Lal, M.; Bhatia, V.; Rathore, L.; Singh, R. Mitigating climate change impact on soybean productivity in India: A simulation study. Agric. For. Meteorol. 2004, 121, 113–125. [Google Scholar] [CrossRef]
  59. Shukla, R.; Chakraborty, A.; Joshi, P.K. Vulnerability of agro-ecological zones in India under the earth system climate model scenarios. Mitig. Adapt. Strat. Glob. Chang. 2015, 22, 399–425. [Google Scholar] [CrossRef]
  60. Deressa, T.; Hassan, R.; Ringler, C. Measuring Ethiopian Farmers’ Vulnerability to CLIMATE Change across Regional States. Available online: https://cgspace.cgiar.org/handle/10568/21518 (accessed on 28 September 2020).
  61. Monterroso, A.; Conde, C.; Gay, C.; Gómez, D.; López, J. Two methods to assess vulnerability to climate change in the Mexican agricultural sector. Mitig. Adapt. Strat. Glob. Chang. 2012, 19, 445–461. [Google Scholar] [CrossRef]
  62. What Is Meant by Uncertainty?-Climate-ADAPT. Available online: https://climate-adapt.eea.europa.eu/knowledge/tools/uncertainty-guidance/topic1 (accessed on 28 September 2020).
  63. Hausfather, Z.; Peters, G. Emissions-the ‘business as usual’ story is misleading. Nature 2020, 577, 618–620. [Google Scholar] [CrossRef]
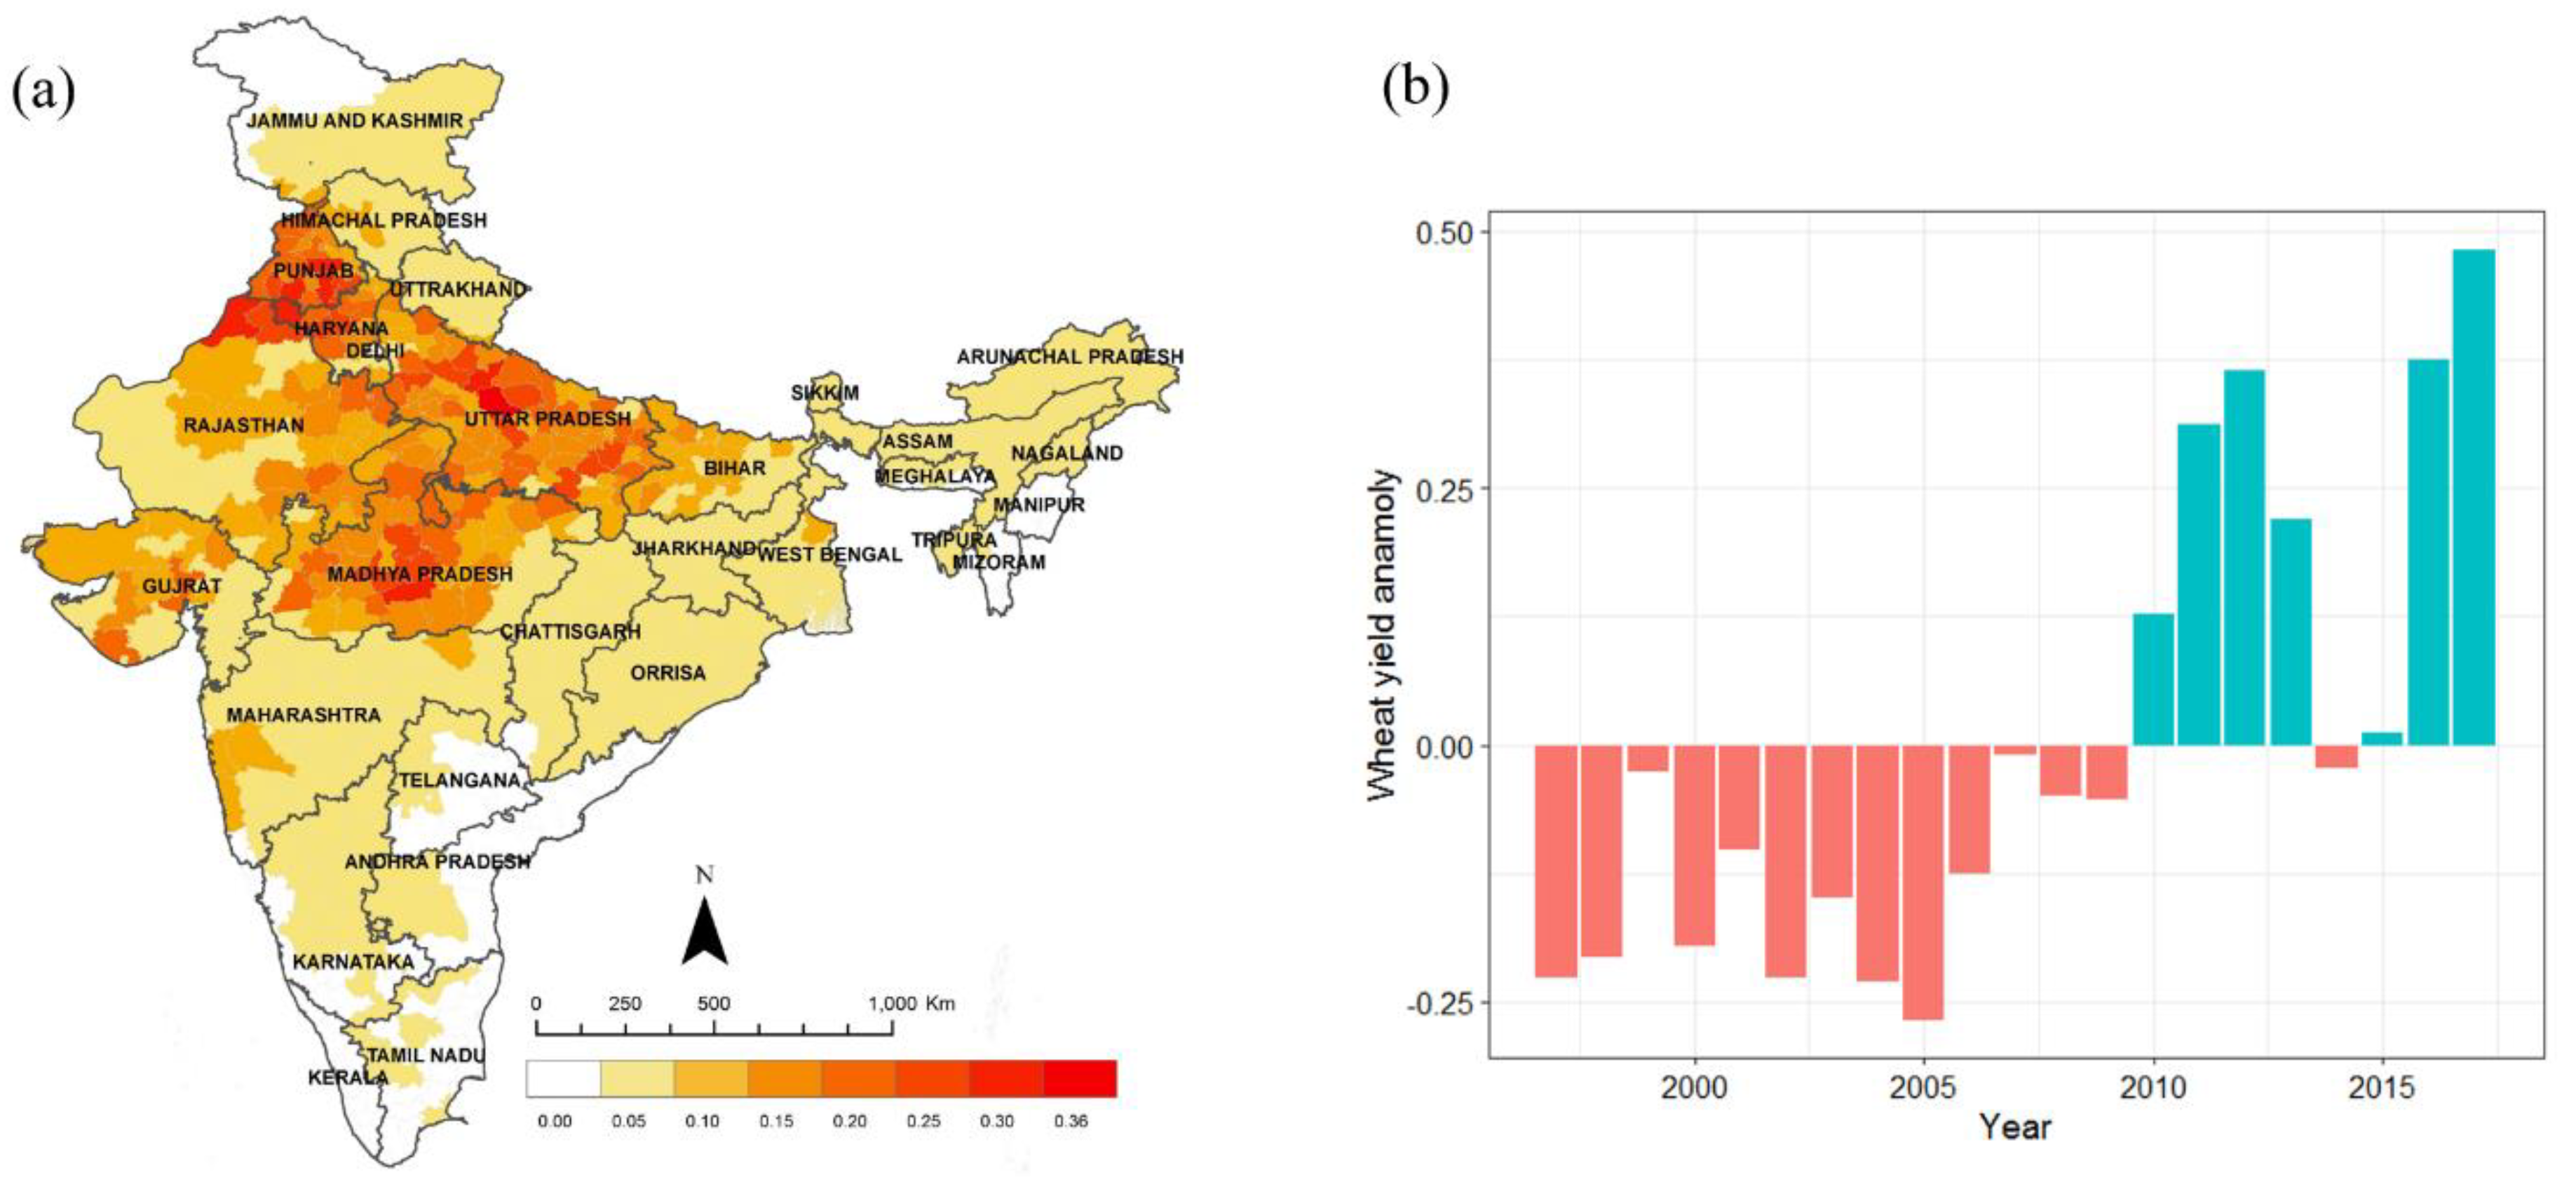
Figure 1. Map of study area. (a) Shows the area of production (million hectares) under wheat crop at district level in India, (b) bar graph depicts the anomaly in wheat yield (tons per hectare) in India for 20 years (1997–2017) (blue color represents positive anomaly and red color represent negative anomaly year). Data source: https://aps.dac.gov.in/APY/Public_Report1.aspx.
Sustainability 12 08256 g001
Figure 2. Framework of the study. (a) Presents the conceptual framework used to operationalize vulnerability; (b) presents the evaluation framework, in which heterogeneity in vulnerability is assessed across methods and time. Quantification of vulnerability is done using indicators under each component of exposure, sensitivity, and adaptive capacity. (c) lists the methodological steps followed in the study. In the figure, CoV = Coefficient of Variation, Z = Normalized Value, Prec = Precipitation, X = Original value of indicator, VI = Vulnerability Index, Wi = Weight of indicator i, E = Exposure Index, SI = Sensitivity Index, AC = Adaptive Capacity Index, μ = Mean of the indicator, σ = Standard Deviation of the indicator.
Sustainability 12 08256 g002
Figure 3. Spatial distribution of vulnerability of wheat in 1975–2005, RCP 4.5 scenario and RCP 8.5 scenario in 2021–2050 (computed using AHP, PCA, and EWs) and the consistency in the results.
Sustainability 12 08256 g003
Figure 4. District profile contrasting the vulnerability index and consistency among methods in (a) current scenario; (b) RCP 4.5 scenario; (c) RCP 8.5 scenarios. The size of a bubble is an indicator of the wheat acreage per district.
Sustainability 12 08256 g004
Figure 5. Percentage of districts in vulnerability class for 29 states of India in (a) current scenario; (b) RCP 4.5 scenario; (c) RCP 8.5 scenario. Values on y-axis represent the percentage of districts in a vulnerability class.
Sustainability 12 08256 g005
Figure 6. Scatter plots. (a) Vulnerability values for equal weights vs. PCA (2021–2050; RCP 8.5); (b) Vulnerability values for EWs vs. AHP (2021–2050; RCP 8.5); (c) Vulnerability values for AHP vs. PCA (2021–2050; RCP 8.5); (d) Vulnerability values for AHP vs. PCA (1975–2005).
Sustainability 12 08256 g006
Table 1. Studies on risks to wheat crop posed by climate-related stressors in India.
Study Area (Scale)ToolFindingsReferences
India (Station)CERES V 3.0Increase in wheat yield under elevated CO2 level. Wheat is sensitive to increase in maximum temperature.[11]
India (Station)CERES-Wheat V3.5Increase in wheat yield with 1 °C and 1.5 °C temperature and elevated CO2. Decrease in yield beyond 30 °C increase in temperature.[28]
India (Station)CERES-Wheat V3.5The low rainfall scenario entailed substantial yield losses that varied from 427–1236 kg ha−1 (Delhi) and 575–1636 kg ha−1 (Ludhiana).[29]
Upper-Ganga Basin –India
(District)
Info-cropIncrease in temperature greater in A2 scenario than in B2 scenario. Increase in temperature higher in Rabi rather than Kharif season.[30]
Global (Country-level)Modelled indicator-basedThe Northern India region shows the lowest overall adaptive capacity for wheat.[31]
India (State)Yield modelAt an average temperature of ~22.1 °C, yield increases for wheat.[32]
India (Pan-India)Info-cropDecrease in wheat yield in the range of 6–23% by 2050 and 15–25% by 2080.[3]
Global (Country-level)Multi-model ensemble8.0% yield declines per 1 °C global temperature increase.[33]
India (State)Indicator basedWheat production in Jharkhand is the most vulnerable and that in Punjab is the least vulnerable. Magnitude of vulnerability high in 5 regions contributing to 19% of total production[34]
India (Pan-India)Yield modelWith a 1 °C increase in daily minimum and maximum temperature, wheat yield decreased by 2–4%[35]
India (Regional)Yield modelAt national level, with 1 °C increase in mean temperature wheat yield decreased by 7%. At a regional level, Central India experienced maximum reduction[36]
India (District)Indicator basedAn alarming increase in wheat vulnerability[24]
Table 2. List of indicators under exposure, sensitivity, and adaptive capacity components, along with their respective significance and data sources.
Sub-ThemeDimensionIndicatorRationaleSourceYear
ExposureClimate variabilityGDD (Growing Degree Days)The GDD value is the crop-growth-relevant temperature range cumulated over the growing period (planting to harvesting). The amount of heat required for maturity varies with crop. Higher GDD value signifies early maturity and reduced crop yield (this assumes no adoption of other varieties).GFDLCurrent
(1975–2005)
Future
(2021–2050)
Coefficient of Variation (CoV) in rainfall (October–May)Wheat requires a temperate and moist climate during vegetative growth period.
Climate ExtremesSPI (Standardized Precipitation Index)
Frequency of
no, mild, moderate, severe, and extreme drought
Water demand for wheat crop in most of the districts is met by the South-West monsoon.
SensitivityLand SuitabilityPercentage of flood Prone AreasFloods damage agricultural lands and crops.NDMA2011
Value of Soil pHWheat is moderately tolerant to soil salinity.ISIRC2014
Percentage of water logging areaWheat crop is sensitive to water logging. It reduced crop yield.NBSS&LUP2011
Agricultural AreaPercentage of net sown areaVulnerability has a direct relationship with net sown area as expansions of sown area are often on less suitable land and large net sown area result in more dependence in terms of food security and livelihood.CoI2009–2014
BiophysicalMagnitude of evapotranspirationEvapotranspiration is an indicator of water availability and potential stress. Wheat crop is sensitive to evapotranspirationMODIS2000–2013
DependencePopulation DensityHigher population density leads to higher food demand and, thus, can amplify food insecurity.CoI2011
Working PopulationPercentage of Agricultural workersAgricultural workers and cultivators are a production factor required for wheat cultivation.
Percentage of Agricultural cultivators
Adaptive CapacityBiophysical CapacityPercentage of net Irrigated areaRain-fed wheat matures earlier and has lower yields. Therefore, farmers prefer irrigated wheat.CoI2004–14
Amount of soil organic carbonHigh soil organic content is positive for erosion reduction and soil nutrient content and thus can increase crop yields.ISIRC2014
Percentage area under Leguminous cropsIt is beneficial for the wheat crop if it is grown in rotation with leguminous, maize, and sunflower crops.CoI2013–14
Percentage area under Maize crop
Percentage area under sunflower
Total count of livestockLivestock helps in cultivation.CoI2012
Human CapacityLiteracy RateEducated population is well aware of new technology and can better adapt to changes.CoI2011
Infrastructure CapacityTotal amount of power-driven equipment for wheatMechanization eases the task and improves crop yield.CoI2012
Total number of tractors
Total number of equipment for pest controlPlant protection equipment is essential to prevent crop yield losses due to pests and diseases.
Consumption of NPK proportion to net sown areaSufficient supply of nutrients is important for wheat yields.CoI2013–2014
Density of Agricultural marketsHigh density of agricultural markets ensures better connectivity and supply of agricultural products.MoI2015
Economic CapacityEconomic IndexDefines the economic status of the district. Hence, determines the ability to adapt to climate change impacts.BEA2006
Agriculture IndexDefines the agricultural status of the district.
Count of rural families below poverty lineIn districts with high poverty, it is difficult to cope with climate variability and extremes.CoI2002
Farm harvest priceDistricts that get a better price for their products are more capable of adapting to climate change.MoI2014
CoI = Census of India; MoI = Ministry of agriculture; BUI = Bureau of Economic Analysis India; MODIS = Moderate Resolution Imaging Spectroradiometer; NDMA = National Disaster Management Authority; NBSS&LUP = National Bureau of Soil Survey and Land Use Planning; NPK = Nitrogen, Phosphorus and Potassium.
Table 3. Regression coefficients for method combinations.
Climate Scenario 1975–20052021–2050 (RCP 4.5)2021–2050 (RCP 8.5)
Dependent VariableCoef *Independent Variable
AHPPCAEWsAHPPCAEWsAHPPCAEWs
1975–2005AHPβ0 0.0890.072
β1 0.7350.742
PCAβ00.159 0.112
β10.776 0.762
EWsβ00.2220.196
β10.6840.666
2021–2050
(RCP 4.5)
AHPβ0 0.0840.053
β1 0.7490.731
PCAβ0 0.116 0.103
β1 0.855 0.726
EWsβ0 0.2140.23
β1 0.7650.666
2021–2050
(RCP 8.5)
AHPβ0 0.3550.154
β1 0.3870.678
PCAβ0 0.214 0.433
β1 0.402 -0.019
EWsβ0 0.1230.548
β1 0.800-0.022
* Strongly related (0.6 > β1 < 1.4): AHP-PCA (1975–2005; 2021–2050 RCP 4.5), AHP-EWs (1975–2005; 2021–2050 RCP 4.5; 2021–2050 RCP 8.5), PCA-EWs (1975–2005; 2021–2050 RCP 4.5); Feebly related (0.2 > β1 < 0.6): AHP-PCA (2021–2050 RCP 8.5); Negatively related (β1 < 0): PCA-EWs (2021–2050 RCP 8.5).