Article

The Perception and Knowledge of Financial Risk of the Portuguese

1
ISCET—Instituto Superior de Ciências Empresariais e do Turismo, 4050-180 Porto, Portugal
2
Escola Superior de Tecnologia e Gestão do Instituto Politécnico de Leiria, 2411-901 Leiria, Portugal
3
Departamento de Matemática, Faculdade de Ciências da Universidade do Porto, 4169-007 Porto, Portugal
4
Department of Management, Sport and Tourism, La Trobe University, Melbourne 3086, Australia
*
Author to whom correspondence should be addressed.
Sustainability 2020, 12(19), 8255; https://doi.org/10.3390/su12198255
Submission received: 16 September 2020 / Revised: 2 October 2020 / Accepted: 5 October 2020 / Published: 7 October 2020
(This article belongs to the Special Issue The Future and Sustainability of Financial Markets)

Abstract

:
This study will help academics, researchers, and professionals to better understand how the Portuguese population perceives financial risk. Thus, the main objective of this study is to analyse and compare the perception and knowledge of financial risk by the Portuguese. The methodology used is quantitative, and the measurement instrument consists of three parts: financial risk perception, financial risk knowledge and sociodemographic characterization of the participants. The sample is composed of 830 Portuguese individuals, over 18 years old. The results demonstrate that financial risk perception is a one-dimensional measurement and that there are low levels of both perception and knowledge of financial risk. It can also be concluded that the Portuguese individuals have a higher level of financial risk perception, when compared to financial risk knowledge, and it is men who have higher levels of perception and knowledge of financial risk. Thus, this study contributes to the literature on financial risk by presenting empirical evidence and relevant conclusions, and it is therefore expected that it will help to improve the perception and knowledge of the financial risk of the Portuguese and, consequently, their financial decisions and financial well-being. Therefore, the study fills a gap, since there are no studies in Portugal that assess the perception and knowledge of financial risk of the Portuguese.

1. Introduction

An individual’s life is impacted by their level of financial risk and willingness to engage in financial risk-taking activities. Perception of risk influences an individual‘s investment decision, even when decision makers present high levels of financial literacy and knowledge. Only investors with high levels of risk perception and tolerance and solid financial knowledge make good investment decisions. This means that, increasingly, the management of risk is becoming a necessity of a sustainable economy. This is due to sustainability issues related to economic and market environments being analysed from a risk perspective. This means more financial reporting regarding sustainability is incorporating financial risk analysis tools. In a report on the financial literacy of the Portuguese, the Bank of Portugal [1] refers that, about perception:
  • Knowledge of the securities market rises with the increase in education level;
  • Respondents do not always have a good perception of their financial knowledge, regarding banking products;
  • The respondents’ perception of the different financial applications’ risk suggests unfamiliarity with the operation and characteristics of these products;
  • The interviewees’ perception of their own financial knowledge does not match their results of the questions of the knowledge of investment products;
  • The interviewees’ perception of their own financial knowledge does not match their actual knowledge of the products;
  • Perception of the most common financial products is good (demand deposits and insurances), which reveals a greater involvement with the financial system.
Therefore, it is observed that, although the interviewees have a reasonable perception of financial products, the same cannot be said about the perception of risk. Furthermore, that reasonable perception of financial products does not match their effective knowledge. On the other hand, [2] concluded that financial literacy impacts financial behaviour and perception of financial knowledge. This means that learning about financial behaviour helps people to improve their financial condition.
According to the National Institute of Statistics [3], life expectancy at birth in Portugal, in the period 2016–2018, was estimated at 80.80 years, while it is 77.78 years for males and 83.43 years for females. In a single decade, an increase of 2.06 years was verified (2.29 years for males and 1.62 years for females). Portugal is one of the countries with projections of having an increase in female longevity: by 2030, the probability of average life expectancy reaching 90 years is greater than 50% [4]. This will have major implications on the areas of health, social aid and retirement, and will demand political measures to help healthy aging, as well as the reformulation of financial education policies.
The Bank of Portugal [1] presents a study where it is mentioned that a discrepancy between perception of financial knowledge and risks and effective knowledge on those items exists. Also, financial literacy impacts the financial behaviour [2]. The goal of this investigation was based on these studies. Accordingly, the objective is centered on analysing and comparing perception and knowledge of financial risk of the Portuguese. In order to achieve the proposed objective, in addition to the present introduction, this paper presents the literature review next. In the literature review, the focus is on studies on financial knowledge, perception and risk. The third point of this investigation presents the used methodology—a quantitative methodology, using a structured sample. The fourth point presents the results of the exploratory and confirmatory factor analysis, the descriptive analysis of risk perception and its discussion. Lastly, in the final point, conclusions are presented.

2. Literature Review

Risk may be categorized into two classes: objective and subjective [5]. Objective risk is associated with random physical systems (such as playing roulette, rolling a dice or flipping a coin). Subjective risk is different depending on the person’s past experience, attitude towards risk, knowledge and mastery of one’s own risk management factors. However, in [6], a theory was developed which states that, for a rational decision maker, an uncertain event has possible outcomes with different probabilities, while each one of those results has an utility associated with it. Choices can be characterized in three ways: according to what the individual believes to be a subjective probability, about each result and subjective level of the expected utility, or simply expected value, subjectively evaluating utility.
Some important subjective choices which decision makers must make are related to risk, according to [7]. For these authors, for instance, average life expectancy for males and females conveys factors of subjective analysis of health and retirement plans. In [8], it is stated that risk is a function of profits and losses and results from both. However, the human perception of risk is frequently associated with loss. Risk factor is associated with subjectivity, since [9] point out that it is influenced by many factors, including cognitive and emotional ones. There is an emotional dimension to risk perception. It is shown in [10] that single males take more risks than married males. On the testimony of the research from [11] about Australian college students, gender is not a significant factor in financial literacy and risk taking. Moreover, [12,13] affirm that there is no connection between gender and financial literacy. However, according to [14], females have lower financial knowledge than males. It was observed in [8] that there is no link between personality traits and the choice of investment; on the contrary, risk perception and the level of financial knowledge impact people’s investment preferences.
The effect of financial literacy, knowledge on financing decisions and the moderating role of risk perception was examined in [15]. In the words of the authors, the process of taking good investment decisions is good when investors are familiar with the various factors which may impact those investment decisions. They have concluded that investors with a high level of risk perception or risk tolerance and solid financial literacy and knowledge would make good investment decisions. Thus, in [15], it is recommended that investors make sure they possess solid knowledge about investment, financial literacy and the risk factors of the market and the economic system in which they are engaged. For [16], generally speaking, individuals who present better financial literacy exhibit greater concerns about long-term savings and financial planning and goals for 1–2 years.
A significant correlation between financial literacy, financial knowledge and investment decision was also found in [14]. Financial literacy affects one’s ability to use money or finances. For [14], the correlation between financial literacy and investment decisions is significant. In [14], a significant moderating effect on risk perception about the relations of financial literacy, financial knowledge and investment decisions was identified. Risk perception is a factor which may impact the whole investment decision, even when financial literacy and knowledge are present. This factor may affect low-income investors the most, since they will be more frightened to lose money.
For [14], the individual perception of risk is clearly related with the investment decision. Risk is the main financial factor, hence investors present different types of behaviour towards risk. Risk perception is different, which leads to some investors to take risky positions, even when they are risk averse. There is a gap in studies on gender in risk-taking, as it is referred in [17]. These authors observed that the gap is of great economic importance: if females are less willing to make risky financial investments, it is expected that they accumulate less wealth over time. Combining lower income from work and a longer working life, they are expected to be more vulnerable to poverty in their old age. In their study, [17] concluded that, in order to shorten the gender gap in investment patterns, it seems to be important to increase financial literacy and risk tolerance among females.
Furthermore, risk perception impacts risk tolerance [18]. This study examined tolerance and risk perception in the individual decision of allocating risky assets with other variables in the context of financial advisory. The authors concluded that both tolerance and risk perception must be considered during the advisory process, so that financial advisors may offer adequate advice to their clients. It is recommendable that financial advisors seek to understand if there are any misadjustments between tolerance and risk perception, which may lead to an inadequate investment decision.
Table 1 presents a summary of the most pertinent topics on perception and knowledge of financial risk.
Based on the defined objectives and the literature review carried out in the present study, the following investigation hypotheses have been formulated, which will be tested in the empirical part:
Hypothesis 1.
There are differences between the perception of financial risk and the knowledge of financial risk.
Hypothesis 2.
There are differences between males and females regarding the perception of financial risk and the knowledge of financial risk.

3. Methodology

3.1. Population and Sample

In this study, the target population is Portugal is over 18 years old. To collect data, the method of non-random sampling by convenience was utilized, due to the associated low sample cost and the ease of access to the sample elements. Table 2 demonstrates the socio-demographic characterization of the participants. The sample is composed of 830 individuals of ages between 18 and 71 years, with an average of 37 years (SD = 12.04). The individuals are predominantly males (59.3%) and the majority of the sample consists of individuals who are single, separated, divorced or widowed (50.4%). The bulk of the sample is composed of people who possess higher academic qualifications (75.4%), specifically in the areas of Economics, Management, Finance, Accounting or similar areas (56.7%), with annual gross income between 10,001.00€ and 20,000.00€ (29.9%).

3.2. Data Collecting Methods

The utilized methodology is quantitative, and it is based on a questionnaire survey which consists of three parts: the first one evaluates the perception of financial risk, the second one analyses the knowledge of financial risk and the third one characterizes the socio-demographic profile of the respondents (gender, marital status, age, education level, training area and annual gross income of the household).
The perception of financial risk of the individuals is evaluated using 5 items (Table 3). These items were adapted from the questionnaire, which was presented in the works [19] and [20]. The items that assess the perception of financial risk were measured on a 5-point Likert scale (1—Not willing to, to 5—Very willing to).
To assess the levels of knowledge of financial risk, according to the literature review, 4 multiple choice questions were utilized, where each question has a single correct option which can be found in bold. These questions are presented in Table 4.

3.3. Procedures

The questionnaires were applied to Portuguese people over 18 years of age, between March and April 2019. These were presented to the participants alongside a short introductory summary, which defined the objectives of the study and ensured the anonymity and confidentiality of the provided information. In order to carry out the data treatment, the software IBM SPSS Statistics 25 was utilized, as well as the techniques of descriptive statistics to describe the sample and to make the descriptive analysis of the variables that characterize the perception of financial risk and the knowledge of financial risk.
Following indications from [21] and [22], before performing the factorial validation of the model, the distribution of the items and missing cases must be verified, and outliers must be identified. The sensitivity of the items was evaluated using the skewness (|Sk| ≤ 3) and kurtosis (|Ku| ≤ 7) coefficients. The factorial validity of the model was assessed using the techniques of exploratory and confirmatory factor analyses. In order to verify the suitability of the application of the exploratory factor analysis (EFA) to the study sample, the sample suitability index of KMO (Kaiser–Meyer–Olkin) and the Bartlett’s test of sphericity (p < 0.05) [23] were utilized. KMO values greater than 0.9 reveal that the sample is very well suited.
In the exploratory factor analysis (EFA), in order to extract the values, the main components method was utilized (factor loads with values over 0.50 are considered to be satisfactory), followed by a varimax rotation. In order to measure the minimum number of factors to retain, the Kaiser criterion (eigenvalues greater than 1) was utilized.
In the confirmatory factor analysis (CFA), the suitability of the structure which emerged from the EFA was tested. In the CFA, the maximum similarity method of estimation was used, and for the sake of obtaining a good fit of the model, the following fit quality indices were applied: the quotient of Chi-Square Statistic and the degrees of freedom ( χ 2 / d f ) less than 3; GFI (Goodness of Fit Index) and CFI (Comparative Fit Index) greater than 0.9; RMSEA (Root Mean Square Error of Approximation) less than or equal to 0.05 [21,22]. The reliability was assessed with Cronbach’s alpha [24] and with composite reliability [25]. Both measurements must present values greater than 0.7 in order to be considered as acceptable.
Convergent validity was estimated by the value of AVE (Average Variance Extracted), which according to [26], must present values greater than 0.5 so that it indicates adequate convergent validity. With the objective of comparing perception and knowledge of financial risk, the paired samples Student’s t-test was used; additionally, to study the existence of differences between males and females regarding perception and knowledge of financial risk, the independent samples Student’s t-test was utilized [27]. In order to calculate the effect size of the groups averages’ difference, in the Student’s t-test, Cohen’s eta squared was used, which represents the proportion of the variation of the dependent variable that is explained by the independent variable. According to [28], Cohen’s eta squared values can be classified as 0.01 (small effect), 0.06 (moderate effect) and 0.14 (large effect). To assess the magnitude of the correlation, Cohen’s criteria [28] were chosen: low correlation when 0.10 ≤ |r| ≤ 0.29, moderate correlation when 0.30 ≤ |r| ≤ 0.49 and high correlation when|r| ≥ 0.50.

4. Results and Discussion

4.1. Exploratory Factor Analysis

The result of the study on the sensitivity of the 5 items related to the perception of financial risk showed that the skewness (|Sk| ≤ 3) and kurtosis (|Ku| ≤ 7) coefficients are within the adequate parameters to proceed with the application of the EFA. The Bartlett’s test of sphericity and the KMO index for the 5 items ( χ 2 10 = 1645.104, p < 0.001, KMO = 0.814) present a good suitability of the sample to apply the EFA.
Table 5 shows the matrix of the factor loads and commonalities of the financial risk perception scale. The commonality values are greater than 0.5, which means they explain at least 25% of the observed variance. According to Kaiser’s criterion, the 5 items form a one-dimensional measurement that explains 61.39% of the total variance.

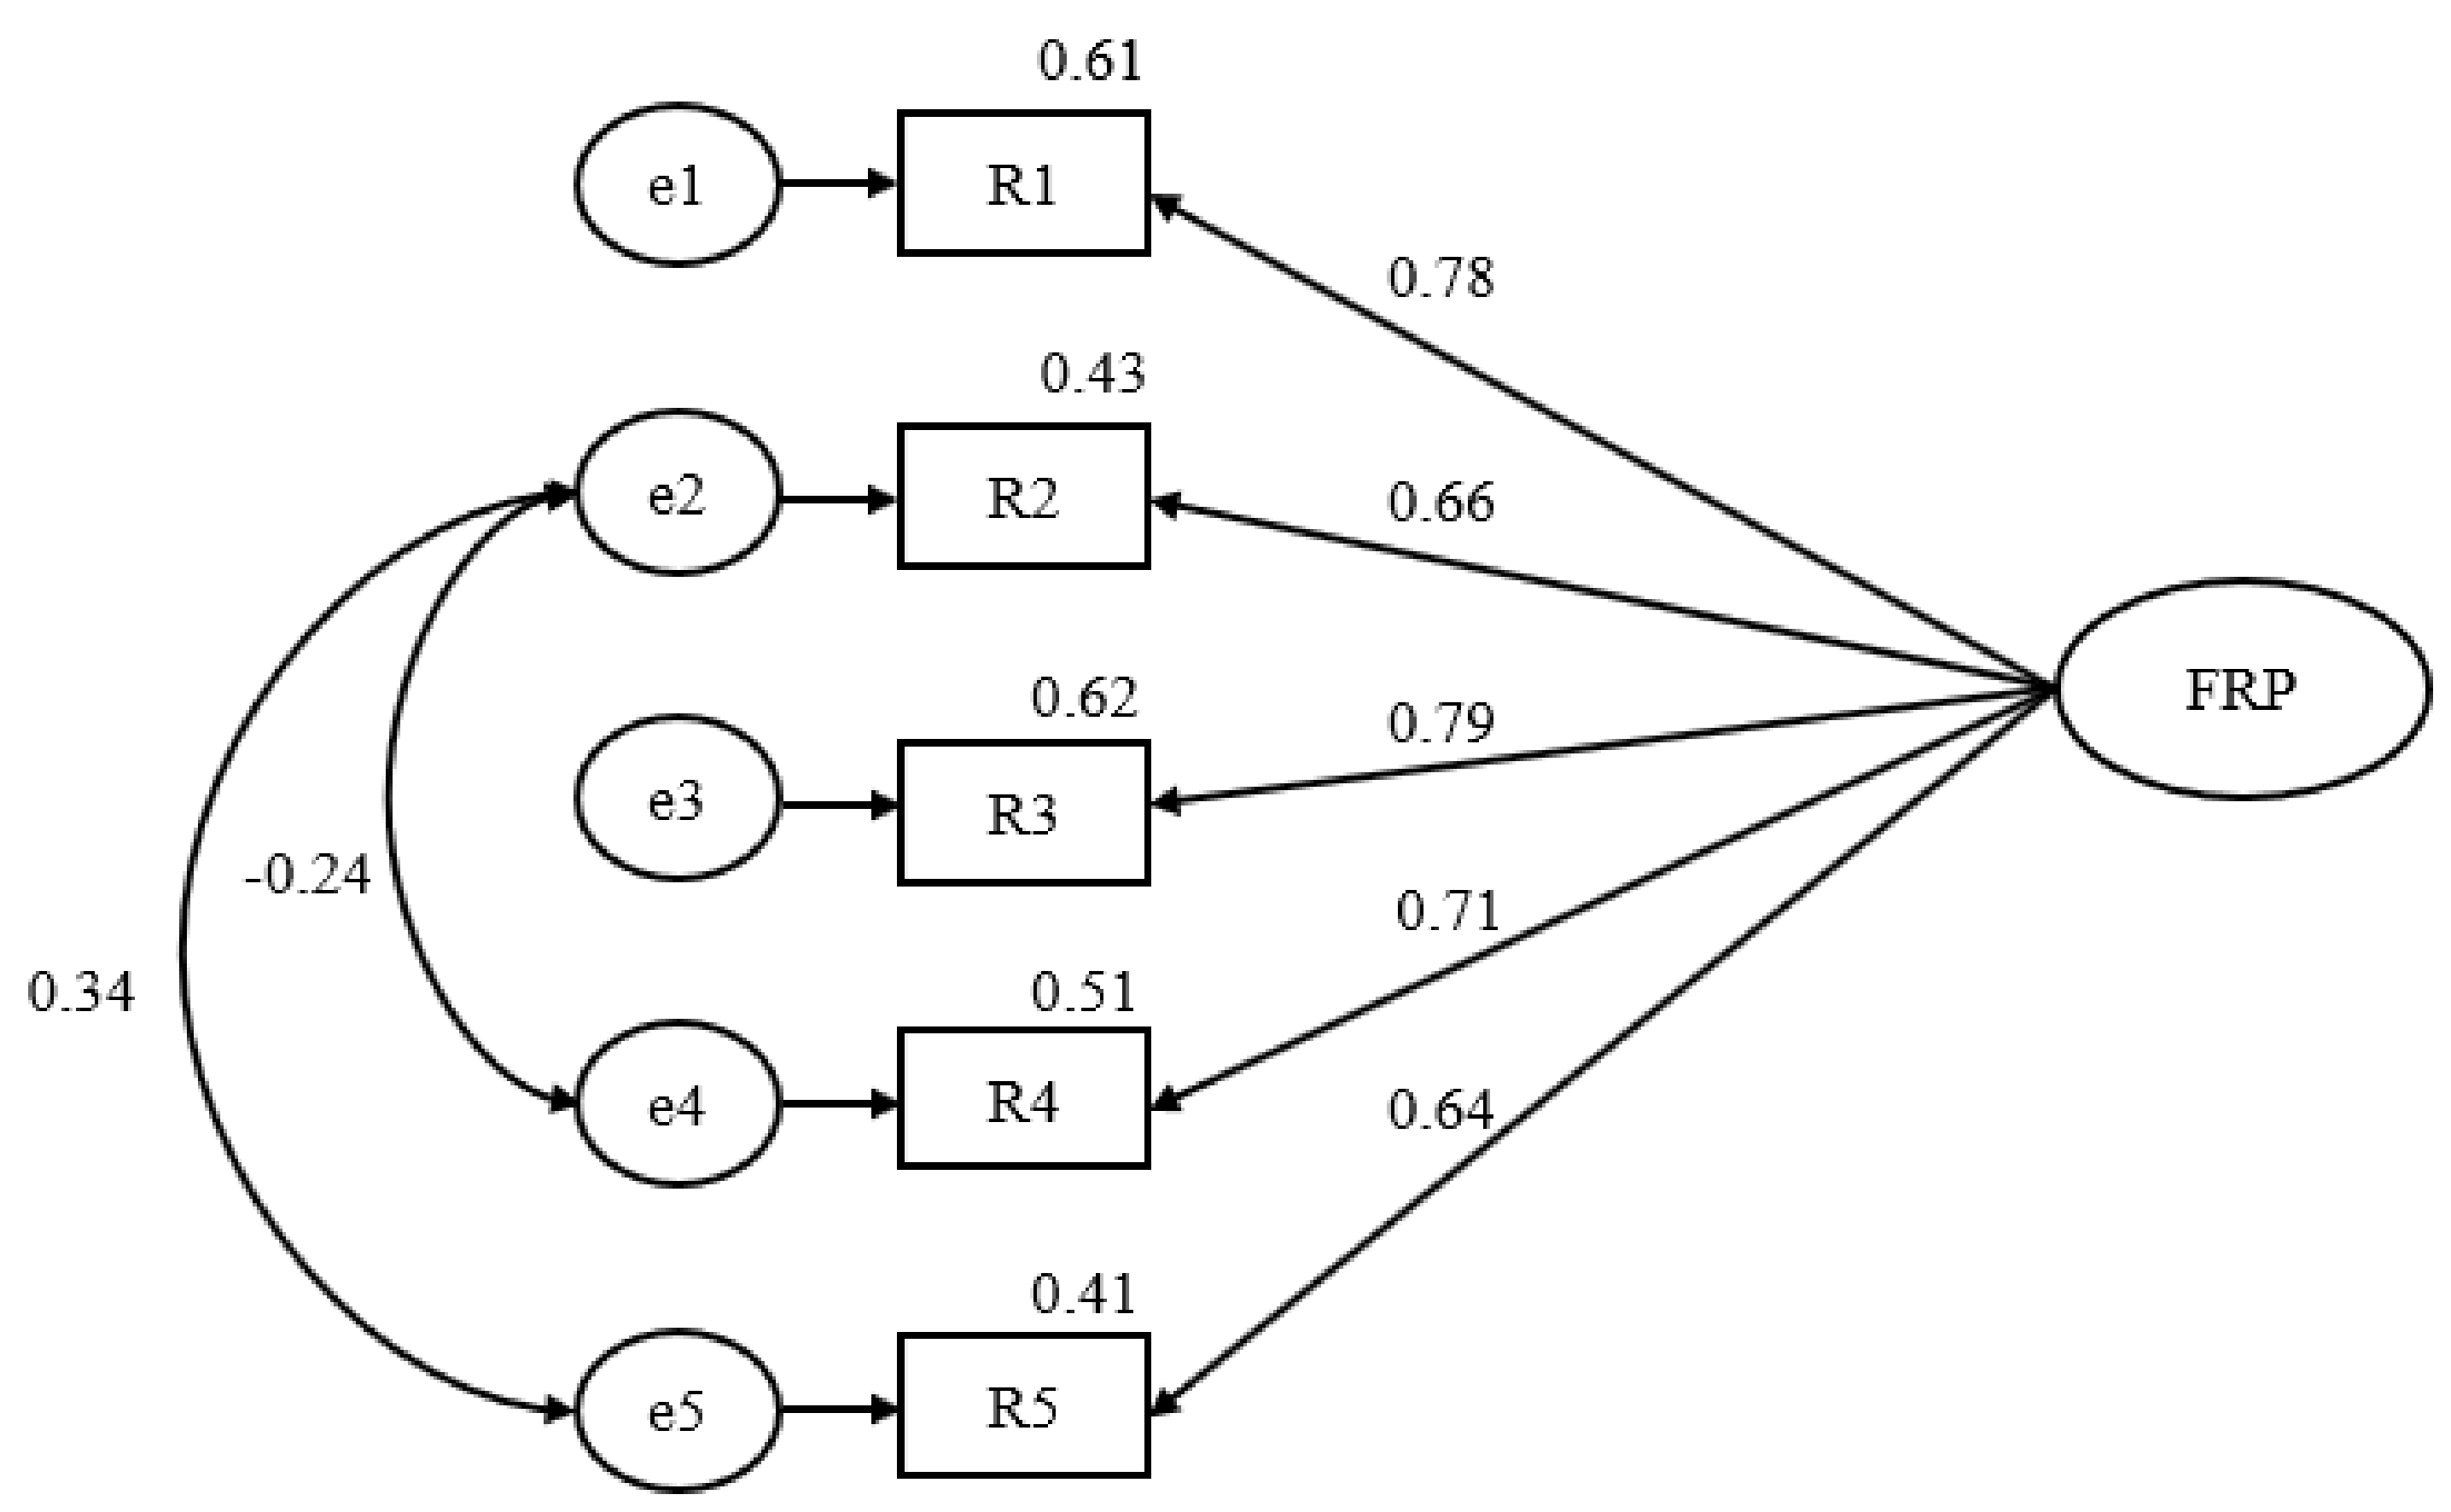
4.2. Confirmatory Factor Analysis

The confirmatory factor analysis was applied to the model that resulted from the application of the EFA. After analysing the modification indices, trajectories between residues were added because these were correlated, and the one-dimensional model presented in Figure 1 was obtained.
A moderate positive correlation between the residues of the items R2 (investing 5% of your annual gross income in highly speculative stocks) and R5 (how willing are you to take risks when you think about your financial investments?) is observable. This means that the greater the willingness of individuals to take risks, the greater the predisposition to invest in highly speculative stocks, which is compliant with the theory presented in [29]. The correlation between the residues of the items R2 (investing 5% of your annual gross income in highly speculative stocks) and R4 (investing 10% of your annual gross income in government bonds) is low and negative. However, it means that the more investments individuals make in government bonds (treasury bills), the fewer investments they make in highly speculative stocks.
Through Figure 1, one can verify that all standardized regression weights (0.64 < λ < 0.71) are greater than 0.5 and that all individual reliabilities (0.41 < R 2 < 0.62) are greater than 0.25. The indices of the fit of the model reveal a good fit quality ( χ 2 = 7.253, df = 3,   χ 2 d f = 2.418, p < 0.001, GFI = 0.997, CFI = 0.997, RMSEA = 0.041, PCLOSE = 0.578). It is emphasised that the items which contribute the most to the perception of financial risk are the items R1 and R3, that is, lower risk investments have a bigger impact on the perception of financial risk.
The value of Cronbach’s alpha and composite reliability (CR) of the scale of financial risk perception is 0.84, which indicates good reliability. Consequently, it is possible to affirm that the 5 items consistently and reproductively measure the interesting factors of the scale of financial risk perception. The AVE value is greater than 0.5 (AVE = 0.514), which according to [26], indicates adequate convergent validity.

4.3. Descriptive Analysis of Perception and Knowledge of Financial Risk

The representative variable of the perception of financial risk was obtained by performing an arithmetic average of the 5 items. The descriptive measurements of the 5 items and of the scale are presented in Table 6. It is verifiable that, generally speaking, individuals present low perceptions of financial risk, because the average values are less than 2.82 on a scale from 1 to 5 points.
Through the software IBM SPSS Statistics 25 and taking into consideration the answers the individuals gave to the questions that assess the knowledge of financial risk, 4 binary variables were obtained (the value 1 indicates if the individual got the question right and 0 indicates if the individual missed the question). Through this way, it was possible to determine the number and percentage of right answers to each one of the questions (Table 7). Note that the questions related to knowledge of financial risk or objective risk according to [5] present low percentages of right answers, and the question Q2 has the highest percentage of right answers (44.8%, n = 372). This low percentage of right answers to a relatively easy question reveals that people struggle with making basic mathematical calculations with percentages, as the case of calculating 1% of 1000 in the question, Q2.
In order to obtain the variable of knowledge of financial risk, the sum of the scores that were obtained in the 4 binary variables that indicated if the individual got the question right or wrong was carried out. Therefore, the variable knowledge of financial risk can take values on a scale from 0 (got all the questions wrong) to 4 (got all the questions right) points. Afterwards, with the purpose of comparing both variables, the variable knowledge of financial risk was converted to the same scale of the variable perception of financial risk (scale of 1 to 5 points).

4.4. Testing the Hypotheses

With the objective of testing Hypothesis 1, that is, the existence of differences between perception and knowledge of financial risk, the paired samples Student’s t-test was applied. As a result of that, the existence of statistically significant differences was observed (t(829) = 5.90, p < 0.001), as the levels of perception of financial risk (M = 2.60, SD = 0.90) are higher than the levels of knowledge of financial risk (M = 2.31, SD = 1.26). The magnitude of the average differences presents a small effect size (eta squared = 0.04), as stated in [28].
It is possible to analyse different subsamples of the initial sample, composed of 830 individuals, that is, analysing samples by gender (male and female), by age group (between 18 and 36 years and over 36 years) and by marital status (group of the single/divorced/separated/widows and group of the married or in a common-law marriage). Consequently, it is observed that there is sufficient statistical evidence to affirm that, with a 5% significance level, the levels of perception of financial risk are higher than the levels of knowledge of financial risk.
Regarding the division of the education level into subsamples (up to 9th grade, 12th grade, Bachelor’s degree and Masters/PhD), it is observable that in the subsamples of the individuals who studied up to 9th grade, 12th grade and to a Bachelor’s degree, there is statistical evidence to attest that, with a significance level of 5%, that the levels of perception of financial risk are higher than the levels of knowledge of financial risk. However, within the subsample of the people who have a Masters or a PhD, the existing differences are not significant, although in sample terms, the average value of the perception of financial risk is higher than the average value of knowledge of financial risk.
With respect to the division into two groups, the ones who are and are not trained in the area of Economics or similar, it is only in the group of people who have training in the referred area where the existence of significant differences (p < 0.001) is verified. Nonetheless, in sample terms, within the group of individuals who are not trained in the referred area, the average value of the perception of financial risk is higher than the average value of the knowledge of financial risk, but the difference is not significant.
When the sample is divided into subsamples by annual gross income of the household (up to 10,000.00€, from 10,001.00€ to 20,000.00€, from 20,001.00€ to 30,000.00€, from 30,001.00€ to 45,000.00€ and over 45,000.00€), it is observable that, with the exception of the groups of annual gross income of 30,001.00€ to 45,000.00€ and greater than 45,000.00€, there is statistical evidence to indicate that, with a significance level of 5%, the levels of perception of financial risk are higher than the levels of knowledge of financial risk. However, within the groups of annual gross income of 30,001.00€ to 45,000.00€ and greater than 45,000.00€, in sample terms, the average value of the perception of financial risk is higher than the levels of knowledge of financial risk, although it is not statistically significant. This way, Hypothesis 1 is empirically supported, which corroborates the study of the Bank of Portugal [1] about how the perception and knowledge of financial risk are unleveled, as well as how the perception of financial knowledge is frequently wrong.
In order to test Hypothesis 2, i.e., if there are differences between males and females regarding perception and knowledge of financial risk, the independent samples Student’s t-test was applied. The existence of statistically significant differences on perception of financial risk (t(828) = 5.91, p < 0.001) and knowledge of financial risk (t(781.65) = 7.42, p < 0.001) was documented, since males demonstrated higher levels of perception of financial risk (Males: M = 2.75, SD = 0.88; Females: M = 2.39, SD = 0.87) and higher levels of knowledge of financial risk (Males: M = 2.56, SD = 1.29; Females: M = 1.93, SD = 1.13). The extent of the average differences, according to, presents a small effect size on the perception of financial risk (eta squared = 0.04) and a moderate effect size on the knowledge of financial risk (eta squared = 0.06). Hence, Hypothesis 2 is empirically supported, which endorses [14], which also found out females possess lower financial knowledge than males. Consequently, increasing the perception and knowledge of financial risk in Portuguese females becomes important, since they have a bigger life expectancy at birth [30].

5. Conclusions

The utilized instrument showed to be satisfactory to measure risk perception of the Portuguese population, presenting a one-dimensional structure with adequate levels of validity and reliability.It is inferred there is statistical evidence to affirm that the Portuguese present higher levels of perception of financial risk, in comparison to the levels of knowledge of financial risk [31]. There is also evidence to state that males present higher levels of perception and knowledge of financial risk than females. This article has focused on understanding financial risk by analysing individuals perceptions [32]. This means there is a focus on percpetions that are difficult to analyse in an objective way. Therefore, more research is required on risk perception that complements the existing research in this study. For example, other ways to measure financial risk need to be studied in order to provide more evidence about the role of risk particularly that of a financial kind in individuals lives [33,34]. In addition, a one country setting being Portugal was analysed, which provides a comprehensive understanding of financial risk [35]. Although this means that other geographic contexts have not been studied, which opens up new research possibilities [36].
In the future, it is intended to study a conceptual model for the Portuguese population [37] which incorporates the variables risk perception, literature perception, literature knowledge, risk knowledge, confidence, attitude and financial stress [38].The study which was carried out in the present investigation may help academics, researchers and professionals to better understand the levels of perception and knowledge of financial risk of the Portuguese population [39]. Moreover, it may contribute to help the creators of financial education policies in the reformulation of their policies, and in the creation of tools to help in the improvement of financial risk perception [40]. If achieved correctly, this may help individuals to perceive which their own abilities and knowledge are, in an area that becomes so important in daily life decisions, as well as future decisions [41].

Author Contributions

Conceptualization, F.T., E.S. and V.T.; methodology, F.T., E.S., V.T.; software, F.T., E.S., V.T.; formal analysis, F.T., E.S., V.T.; investigation, F.T., E.S., V.T.; writing—original draft preparation, F.T., E.S., V.T.; V.R.; supervision, F.T., E.S., V.T.; project administration, F.T., E.S., V.T., V.R. All authors have read and agreed to the published version of the manuscript.

Funding

This research received no external funding.

Conflicts of Interest

The authors declare no conflict of interest.

References

  1. Anonymous. BdP, Relatório do Inquérito à Literacia Financeira dos Portugueses; Conselho Nacional de Supervisores Financeiros: Lisboa, Portugal, 2016; Available online: https://www.todoscontam.pt/sites/default/files/SiteCollectionDocuments/Relatorio2InqueritoLiteraciaFinanceira.pdf (accessed on 8 August 2020).
  2. Allgood, S.; Walstad, W.B. The Effects Of Perceived And Actual Financial Literacy On Financial Behaviors. Econ. Inq. 2016, 54, 675–697. [Google Scholar] [CrossRef]
  3. INE. Anuário Estatístico de Portugal—2018; INE, Instituto Nacional de Estatística: Lisboa, Portugal, 2019. [Google Scholar]
  4. Kontis, V.; Bennett, J.E.; Mathers, C.D.; Li, G.; Foreman, K.; Ezzati, M. Future life expectancy in 35 industrialised countries: Projections with a Bayesian model ensemble. Lancet 2017, 389, 1323–1335. [Google Scholar] [CrossRef] [Green Version]
  5. Schneider, M. Studies in Risk Perception and Financial Literacy: Applications Using Subjective Belief Elicitation. Ph.D. Thesis, Faculty of Commerce, School of Economics, University of Cape Town, Cape Town, South Africa, 2019. [Google Scholar]
  6. Savage, L.J. The Foundations of Statistics; Courier Corporation: New York, NY, USA, 1972. [Google Scholar]
  7. Smith, V.K.; Taylor, D.H.; Sloan, F.A. Longevity expectations and death: Can people predict their own demise? Am. Econ. Rev. 2001, 91, 1126–1134. [Google Scholar] [CrossRef] [Green Version]
  8. Aren, S.; Zengin, N. Influence of Financial Literacy and Risk Perception on Choice of Investment. Procedia-Soc. Behav. Sci. 2016, 235, 656–663. [Google Scholar] [CrossRef]
  9. Hillson, D.; Murray-Webster, R. Understanding and Managing Risk Attitude; Gower Publishing: Aldershot, UK, 2007. [Google Scholar]
  10. Barber, B.M.; Odean, T. Boys will be Boys: Gender, Overconfidence, and Common Stock Investment. Q. J. Econ. 2001, 116, 261–292. [Google Scholar] [CrossRef]
  11. Wagland, S.P.; Taylor, S. When it comes to financial literacy, is gender really an issue? Australas. Account. Bus. Financ. J. 2009, 3, 3. [Google Scholar]
  12. Kindle, P.A. Student Perceptions of Financial Literacy: Relevance to Practice. J. Soc. Serv. Res. 2010, 36, 470–481. [Google Scholar] [CrossRef]
  13. Joo, S.; Grable, J. An Exploratory Framework of the Determinants of Financial Satisfaction. J. Fam. Econ Issues 2004, 25, 25–50. [Google Scholar] [CrossRef]
  14. Khan, S. Impact of financial literacy, financial knowledge, moderating role of risk perception on investment decision. SSRN Electron. J. 2016, 20. [Google Scholar] [CrossRef]
  15. Ademola, S.A.; Musa, A.S.; Innocent, I.O. Moderating Effect of Risk Perception on Financial Knowledge, Literacy and Investment Decision. Am. Int. J. Econ. Financ. Res. 2019, 1, 34–44. [Google Scholar] [CrossRef]
  16. Tavares, F.; Santos, E. Financial Literacy Perception Scale for the Portuguese Population. Sci. Ann. Econ Bus. 2020, 67, 277–290. [Google Scholar]
  17. Bannier, C.; Neubert, M. Gender differences in financial risk taking: The role of financial literacy and risk tolerance. Econ. Lett. 2016, 145, 130–135. [Google Scholar] [CrossRef]
  18. Nguyen, L.; Gallery, G.; Newton, C. The joint influence of financial risk perception and risk tolerance on individual investment decision-making. Account. Financ. 2019, 59, 747–771. [Google Scholar] [CrossRef]
  19. Fernandes, D.; Lynch, J.G.; Netemeyer, R. Financial Literacy, Financial Education, and Downstream Financial Behaviors. Manag. Sci. 2014, 60, 1861–1883. [Google Scholar] [CrossRef]
  20. Ramalho, T. Modelo estrutural de Literácia Financeira: Um Estudo Sobre o Comportamento Financeiro de Brasileiros Considerando Grupos com Diferentes Níveis de Conhecimento Financeiro e Autoconfiança. Ph.D. Thesis, Universidade Presbiteriana Mackenzie, Sao Paolo, Brazil, 2017. [Google Scholar]
  21. Kline, R. Principles and Practice of Structural Equation Modeling; Guilford Publications: New York, NY, USA, 2015. [Google Scholar]
  22. Marôco, J. Análise de Equações Estruturais: Fundamentos Teóricos, Software & Aplicações; ReportNumber, Lda: Pêro Pinheiro, Portugal, 2010. [Google Scholar]
  23. Pestana, M.; Gageiro, N. Análise de Dados Para Ciências Sociais: A Complementaridade do SPSS; Sílabo: Lisboa, Portugal, 2008. [Google Scholar]
  24. Marôco, J.; Garcia-Marques, T. Qual a fiabilidade do alfa de Cronbach? Questões antigas e soluções modernas? Laboratório Psicol. 2006, 4, 65–90. [Google Scholar] [CrossRef] [Green Version]
  25. Fornell, C.; Larcker, D. Evaluating Structural Equation Models with Unobservable Variables and Measurement Error. J. Mark. Res. 1981, 18, 39–50. [Google Scholar] [CrossRef]
  26. Hair, J.F.; Black, W.C.; Babin, B.J.; Anderson, R.E.; Tatham, R.L. Multivariate Data Analysis; Prentice Hall: Upper Saddle River, NJ, USA, 1998; Volume 5. [Google Scholar]
  27. Marôco, J. Análise Estatística com o SPSS Statistics.: 7\textordfeminine edição; ReportNumber, Lda: Pêro Pinheiro, Portugal, 2018. [Google Scholar]
  28. Pallant, J. SPSS Survival Manual: A Step by Step Guide to Data Analysis Using IBM SPSS; Routledge: Abingdon, UK, 2020. [Google Scholar]
  29. Markowitz, H. Portfolio Selection. J. Financ. 1952, 7, 77–91. [Google Scholar]
  30. Pordata. Base de Dados de Portugal Contemporâneo. 2020. Available online: https://www.pordata.pt/Retratos/2020/Retrato+de+Portugal-85 (accessed on 8 August 2020).
  31. Arribas, I.; Espinós-Vañó, M.D.; García, F.; Tamošiūnienė, R. Negative screening and sustainable portfolio diversification. Entrep. Sustain. Issues 2019, 6, 1566–1586. [Google Scholar] [CrossRef]
  32. Arribas, I.; Espinós-Vañó, M.D.; García, F.; Oliver, J. Defining socially responsible companies according to retail investors’ preferences. Entrep. Sustain. Issues 2019, 7, 1641–1653. [Google Scholar] [CrossRef]
  33. Morgan, P.J.; Trinh, L.Q. Determinants and Impacts of Financial Literacy in Cambodia and Viet Nam. J. Risk Financ. Manag. 2019, 12, 19. [Google Scholar] [CrossRef] [Green Version]
  34. Santos, G.; Marques, C.S.; Ratten, V. Entrepreneurial women’s networks: The case of D’Uva–Portugal wine girls. Int. J. Entrep. Behav. Res. 2019, 25, 298–322. [Google Scholar] [CrossRef]
  35. Estevao, C.; Cruz, R.; Ferreira, J.; Ratten, V. Contemporary approaches to performance evaluation of international hotel groups in Portugal. J. Glob. Bus. Adv. 2017, 11, 173–192. [Google Scholar]
  36. Ferreira, J.J.; Fernandes, C.; Ratten, V. The effects of technology transfers and institutional factors on economic growth: Evidence from Europe and Oceania. J. Technol. Transf. 2019, 44, 1505–1528. [Google Scholar] [CrossRef]
  37. Miragaia, D.; Ferreira, J.; Ratten, V. Interactions between financial efficiency and sports performance: Strategic data for a sustainable entrepreneurial approach of European professional football clubs. J. Entrep. Public Policy 2019, 8, 84–102. [Google Scholar] [CrossRef]
  38. Jones, P.; Klapper, R.; Ratten, V.; Fayolle, A. Emerging themes in entrepreneurial behaviours, identities and contexts. Int. J. Entrep. Innov. 2018, 19, 233–236. [Google Scholar] [CrossRef]
  39. Ferreira, J.J.; Ratten, V. Competitiveness of locations: The effects of regional innovation and entrepreneurial practices. Compet. Rev. 2017, 28, 2–5. [Google Scholar]
  40. Ferreira, J.; Ratten, V.; Dana, L. Knowledge based spillovers and strategic entrepreneurship. Int. Entrep. Manag. J. 2017, 13, 161–167. [Google Scholar] [CrossRef]
  41. Ferreira, J.; Fernandes, C.; Ratten, V. International entrepreneurship research: Mapping and cognitive structures. Int. J. Entrep. Small Business 2015, 30, 545–566. [Google Scholar] [CrossRef]
Figure 1. Factor structure of the scale of financial risk perception (FRP). Source: Own elaboration.
Sustainability 12 08255 g001
Table 1. Studies about perception and knowledge of financial risk.
Conclusion/ThemeReference
Choices depend on what one believes to be a subjective probability, about each result and subjective level of the expected utility, or expected value, subjectively evaluating utility.[6]
Risk may be categorized into objective and subjective.[5]
Risk factor is associated with subjectivity, since it is influenced by many factors, including emotional and cognitive ones.[9]
Risk is a function of profits and losses and results from both. Risk perception and level of financial knowledge impact people’s investment preferences.[8]
Investors who possess a high level of perception or risk tolerance and solid financial literacy and knowledge make good financial decisions.[15]
Risk perception is a factor which may impact the whole investment decision, even when financial literacy and knowledge are present.[14]
Financial advisors must consider tolerance and perception in their advisory procedures, in order to give the most adequate advice to their clients.[18]
Single males take more risks than married males.[10]
In order to shorten the gender gap in investment patterns, it seems to be important to increase financial literacy and risk tolerance among females.[17]
Source: Elaborated by the authors.
Table 2. Socio-demographic characterization of the participants.
VariablesDescriptive Measurements
AgeMinimum: 18; Maximum: 71; Average: 37.43; Standard deviation: 12.04
GenderMalses: 492 (59.3%); Females: 338 (40.7%)
Marital StatusSingle, separated, divorced or widowed: 418 (50.4%); Married or in a common-law marriage: 412 (49.6%)
Education LevelUp to 9th grade: 16 (1.9%); 12th grade: 188 (22.7%); Bachelor’s degree: 415 (50.0%); Master’s degree or PhD: 211 (25.4%)
Training AreaEconomics, Management, Finances, Accounting or similar areas: 471 (56.7%); Other areas: 359 (43.3%)
Annual Gross Income of the HouseholdUp to 10,000.00€: 120 (14.5%); Between 10,001.00€ and 20,000.00€: 248 (29.9%); Between 20,001.00€ and 30,000.00€: 173 (20.8%); Between 30,001.00€ and 45,000.00€: 148 (17.8%); Over 45,000.00€: 141 (17.0%)
Source: Elaborated by the authors.
Table 3. Items which assess the perception of financial risk.
R1—Investing 10% of your annual gross income in a moderate growth mutual fund.
R2—Investing 5% of your annual gross income in highly speculative stocks.
R3—Investing 5% of your annual gross income in conservative stocks.
R4—Investing 10% of your annual gross income in government bonds (treasury bonds).
R5—How willing are you to take risks when you think about your financial investments?
Source: Elaborated by the authors.
Table 4. Questions which assess knowledge of financial risk.
Q1—Imagine that a six-sided die is rolled a thousand times. The times the die indicates an even number are counted. Of the values below, what is the most likely result?
(A) 157
(B) 298
(C) 512
(D) 754
(E) 919
(F) The answers above are all equally likely
(G) I do not know the answer
Q2—In the National Lottery, the odds of winning a prize of 10€ are 1%. How many people do you guess would win a prize of 10€ if 1000 people bought a single lottery ticket?
(A) 1
(B) 2
(C) 10
(D) 100
(E) 110
(F) The answers above are all equally likely
(G) I do not know the answer
Q3—If 5 machines take 5 min to make 5 toys, how long would 100 machines take to make 100 toys?
(A) 1 min
(B) 5 min
(C) 10 min
(D) 100 min
(E) 1000 min
(F) 1 day
(G) None of the options above
(H) I do not know the answer
Q4—There are water lilies in a lake. Each day, the number of water lilies in bloom doubles. If it takes 48 days for the whole lake to be in bloom, how long would the water lilies in bloom take to cover half of the lake’s area?
(A) 16 days
(B) 24 days
(C) 25 days
(D) 32 days
(E) 26 days
(F) 22 days
(G) 47 days
(H) I do not know the answer
Source: Elaborated by the authors. The options in bold are the correct ones.
Table 5. Matrix of the factor loads and commonality of the financial risk perception scale.
Factor 1 h 2
R1—Investing 10% of your annual gross income in a moderate growth mutual fund.0.8150.665
R2—Investing 5% of your annual gross income in highly speculative stocks.0.7610.579
R3—Investing 5% of your annual gross income in conservative stocks.0.8240.679
R4—Investing 10% of your annual gross income in government bonds (treasury bonds). 0.7300.533
R5—How willing are you to take risks when you think about your financial investments?0.7830.613
Eigenvalue3.069
% Explained Variance61.39%
Source: Elaborated by the authors.
Table 6. Descriptive statistics of the scale of financial risk.
AVSD
R1—Investing 10% of your annual gross income in a moderate growth mutual fund.2.821.15
R2—Investing 5% of your annual gross income in highly speculative stocks.2.121.10
R3—Investing 5% of your annual gross income in conservative stocks.2.641.15
R4—Investing 10% of your annual gross income in government bonds (treasury bonds).2.911.22
R5—How willing are you to take risks when you think about your financial investments?2.531.12
Scale of Perception of Financial Risk2.600.90
Source: Own elaboration.
Table 7. Number of right answers and corresponding percentage per question.
Questionsn%
Knowledge of Financial RiskQ126131.4
Q237244.8
Q326732.2
Q418422.2
Source: Elaborated by the authors.

