Article

Analysis of Changes in Soil Organic Carbon, Energy Consumption and Environmental Impact Using Bio-Products in the Production of Winter Wheat and Oilseed Rape

by
Darius Juknevičius
1,*,
Zita Kriaučiūnienė
2,
Algirdas Jasinskas
1 and
Egidijus Šarauskis
1
1
Institute of Agricultural Engineering and Safety, Agriculture Academy, Vytautas Magnus University, Studentu 15A, Akademija, LT-53362 Kaunas Distr., Lithuania
2
Institute of Agroecosystems and Soil Sciences, Agriculture Academy, Vytautas Magnus University, Studentu 11, Akademija, LT-53361 Kaunas Distr., Lithuania
*
Author to whom correspondence should be addressed.
Sustainability 2020, 12(19), 8246; https://doi.org/10.3390/su12198246
Submission received: 11 September 2020 / Revised: 2 October 2020 / Accepted: 4 October 2020 / Published: 7 October 2020

Abstract

:
Agricultural management, environmentally friendly technologies, chemical, organic and bio-based substances used, as well as meteorological factors, have a significant impact on the fluctuations of soil organic carbon (SOC). The aim of this research was to analyze the effect of different biopreparations on the changes of SOC content and the winter wheat and winter oilseed rape yields by assessing the energy consumption efficiency and the environmental impacts. The experimental research was conducted from 2017 to 2019 in three different treatments, in two of which were used either a molasses and magnesium sulphate based-biopreparation (T1) or a bacteria-based biopreparation (T2), while treatment T3 was applied as a control where no biopreparations were used. The dynamics of SOC content were analyzed at two depths: 0–10 and 10–20 cm. For the analysis of energy efficiency indicators and environmental impacts, the greenhouse gas (GHG) and energy consumption conversion equivalents were used. A summary of the results showed that both types of biopreparations had a positive effect on the changes of SOC content, which was especially evident in the deeper layers at 10–20 cm depth, where, irrespective of the crop type, a more significant increase of the SOC content was observed every year of the experiment compared to the control treatment. Biopreparations had a significant effect in increasing the winter wheat and winter oilseed rape yield. The best energy efficiency ratio was observed in winter wheat (4.84) and winter oilseed rape (5.11) in treatment T1. The results of the environmental impact assessment showed that the lowest GHG emissions were recorded in the winter wheat production in treatment T1 at 108.7–149.1 kg CO2eq Mg−1, while the highest were observed in oilseed rape production in the control treatment T3 at 343.4 kg CO2eq Mg−1.

1. Introduction

Soil organic carbon (SOC) is one of the crucial elements of the global carbon cycle. On a global level, the amount of carbon stored in soil at a depth of 1 m (1460 Gt) exceeds the amount of carbon found in atmosphere (800 Gt) and in vegetation (560 Gt) put together [1]. Organic carbon is extremely important in the global sense, as it helps to keep the concentration of CO2 gas in the atmosphere balanced [2]. SOC is also a key factor which indicates soil fertility and health, its structure and other physical properties [3,4,5,6,7]. The amount of SOC significantly depends on different environmental factors, such as fertilization, method of soil cultivation, soil moisture content and soil/ambient temperature [8,9].
The interaction between SOC and fertilizer (mineral and organic) in the soil can be twofold. On the one hand, a balanced use of fertilizer can increase the SOC content in the soil. In a study by Barlog et al. [10], the main factor determining SOC content in different soil depths was the year. According to the year, SOC values ranged from 14.8 (2016) to 15.6 g kg−1 (2013) in topsoil (0–0.3 m), and from 7.5 (2015) to 10.4 g kg−1 (2013) in subsoil (0.3–0.6 m).The multiannual research conducted by Yang et al. [11] indicated that the use of mineral fertilizer along with farmyard manure (FYM) results in a more significant increase in the amount of SOC than fertilization with mineral fertilizer only. They concluded that during 33 years of research, when FYM was used with mineral fertilizer, the amount of SOC increased by 38% whereas when other fertilizers were used—mineral NPK, N + Straw and N + Green manure—the change in SOC, compared to the data from the initial stages of research, was 14.2%, 12.9% and −1.1%, respectively [11]. The effect of FYM on the SOC content has been researched by many scientists. In their paper, Blair et al. [12] claim that over a period of more than 100 years, fertilization with 35 t ha−1 year−1 of FYM resulted in a 2.5-times increase of the total SOC content compared to the control results where no fertilizer was used. Through their 16-year-long research, Banger et al. [13] concluded that the exclusive use of mineral fertilizer (100% NPK: 100 kg N, 50 kg P and 50 kg K ha−1) resulted in a 16.3% increase, the use of 50% NPK + 50% FYM (5 t ha−1) in 25%, and the use of only FYM (10 t ha−1) in 36.1% SOC content increase at 0–15 cm depth when compared to the results from the soil without any fertilization. To sum up, it may be concluded that in most cases, the amount of SOC increases with the use of any mineral or organic fertilizer, and this change essentially depends on the properties of the soil, the crops grown therein and the type of fertilizer used, as well as its amount.
On the other hand, SOC has a significant impact on soil fertility, its water retention and availability of nutrients to plants [14]. It has been established that an additional 1.0 t of SOC ha−1 in topsoil at 0–15 cm depth may increase wheat yield by 15 to 40 kg ha−1 [3,6]. Qaswar et al. [15] found that SOC and soil pH are responsible for regulating the nutrient availability to crops. Liu et al. [16] report that fertilization with mineral fertilizer significantly lowered the bacterial richness in topsoil (0–10 cm), had little effect on the bacterial richness at 10–50 cm depth in midsoil and increased the bacterial richness at 50–100 cm depth in bottom soil. These researchers suggest that there exists a positive correlation between the SOC and the denitrification capacity of soil, which in turn means that an increase of SOC in the deeper layers of soil allows to reach a high potential in terms of mitigating nitrate leaching in agriculture and reducing negative environmental impacts [16].
SOC estimation is an extremely time-consuming process. There are numerous different methods to estimate the level of SOC which are divided into direct and indirect ones according to their principle of measurement [17]. Direct methods include two main techniques of sample processing. The first technique involves chemical oxidation of samples where the residue of the chemical element which reacted with SOC is measured in order to estimate the amount of SOC. The second technique involves removing the inorganic carbon from the sample by treating the sample with acid before measuring the total soil organic carbon [18]. Estimating the amount of SOC by mathematically deducting the inorganic carbon amount from the total carbon amount in soil is characteristic of indirect SOC estimation methods. Indirect methods may also employ sample oxidation, their combustion, calculation of t CO2 gas emissions by treating the samples with heat, as well as remote VIS-NIR (Visible–Near-Infrared) methods [19,20].
The most popular “classical” method is chemical oxidation, which is sufficiently quick and accurate due to its large sample size; however, its accuracy is limited by the fact that other elements are oxidized along with SOC, which can distort the results [18].
Not only do CO2 emissions account for the majority of global greenhouse gas (GHG) emissions, they are also the primary reason behind environmental pollution. In agriculture, however, the negative environmental impacts are largely caused by the N2O emissions from soil, which are generated by the use of nitrogen fertilizers [21]. Compared to CO2 emissions, these gases are significantly more harmful to the environment, as 1.0 kg of N2O emissions is equivalent to 298 kg of CO2 emissions [22]. N2O emissions may significantly increase if N fertilizer is used at too high a rate or the soil limit of fertilizer absorption is exceeded [21]. The key factors that impact N2O emissions from soil the most are SOC content, soil texture, its moisture content, acidity, crops planted, the amount of nitrogen fertilizer applied and its chemical composition [23,24]. According to Intergovernmental Panel on Climate Change (IPCC), the current global N2O emission factor is 1.0%, which indicates that 1.0 kg of N2O gas is emitted per every 100 kg of active N fertilizer substance used [22]. Pursuant to the research conducted by Perego et al. [25], this indicator equals 2.5–3.5%. Rowlings et al. [26] found that the environmental impact of fertilizer is based on the time when it is used. In the case when the fertilizer was applied in spring (5.0 kg N2O N kg−1), N2O emissions were two times higher than when the fertilizer was applied in the autumn (2.6 kg N2O N kg−1), accounting for 2.4 and 1.1% of the total fertilizer used, respectively.
The SOC level and fertilizer rate impact both GHG emissions and energy indicators of the cultivation technique. The 12-year-long multiannual scientific research demonstrated that when the same fertilization technology is used on soils with different SOC levels, better results in terms of energy are obtained from soils with higher SOC content [27]. The largest share of energy in cultivation technology is comprised of mineral fertilizer and according to the data presented by different authors, it may account for 34% in no tillage [28]; 45.0–49.3% [27]; approximately 50% [29]; or as much as 53.5% [30]. Thus, in order to reduce GHG emissions and energy consumption in agriculture, some of the key objectives are to improve the soil quality and increase its SOC level which would allow to reduce the mineral fertilizer rates used in cultivation technologies without decreasing the fertility of crops.
The analysis of scientific sources revealed that SOC is an essential factor in reducing mineral fertilizer consumption and mitigating the environmental impacts. The novelty of this research is largely related to the use of biopreparations and their effect on the dynamics of SOC, crop productivity and the efficiency of energy inputs, as well as GHG emissions. Although biopreparations are being included in crop cultivation technologies on an increasingly wide scale, there has been almost no research on their interaction with SOC or their effect on energy consumption and reduction of environmental impacts. The absence of this type of research indicates the novelty of the topic and the need for a more detailed analysis. The fundamental aim of the present research is to determine the effects of different biopreparations on the changes in SOC content and the productivity of winter wheat and winter oilseed rape, and to conduct an energy consumption and environmental impact analysis.

2. Materials and Methods

2.1. Site Description and Experiment Design

Experimental research was conducted in 2017–2019, in Pasvalys district, Lithuania, in an 8 ha plot, location coordinates—55.920437, 24.212736 (WGS). To measure the soil granulometric composition, laser diffraction analysis by wet method was carried out using the Mastersizer 2000 Hydro 2000MU (Malvern Panalytical Ltd., Malvern, UK) instrument. The granulometric analysis showed that the soil’s texture class was loamy sand. The soil group was Luvisol [31].
The experimental research field was divided into 9 equal plots; 3 plots for each of the 3 different treatments: T1 (spraying with Biopreparation I (Ploecher humus soil), T2 (spraying with Biopreparation II (Nando BioSpektrum)) and T3 (control without Biopreparation). A more detailed description of the biopreparations can be found below in Paragraph 2.2. Every plot was 500 m in length and 20 m in width. The samples to measure SOC content were taken from the same spots twice a year—the first time before the initial application of fertilizer and biopreparation in spring and the second time after harvesting the crops. One sample contained 3 soil specimens; 27 soil specimens were taken in total. The specimens were extracted from two depths: 0–10 and 10–20 cm and from spots located 100 m away from the edge of the plot and 1.0 m away from the tramlines.

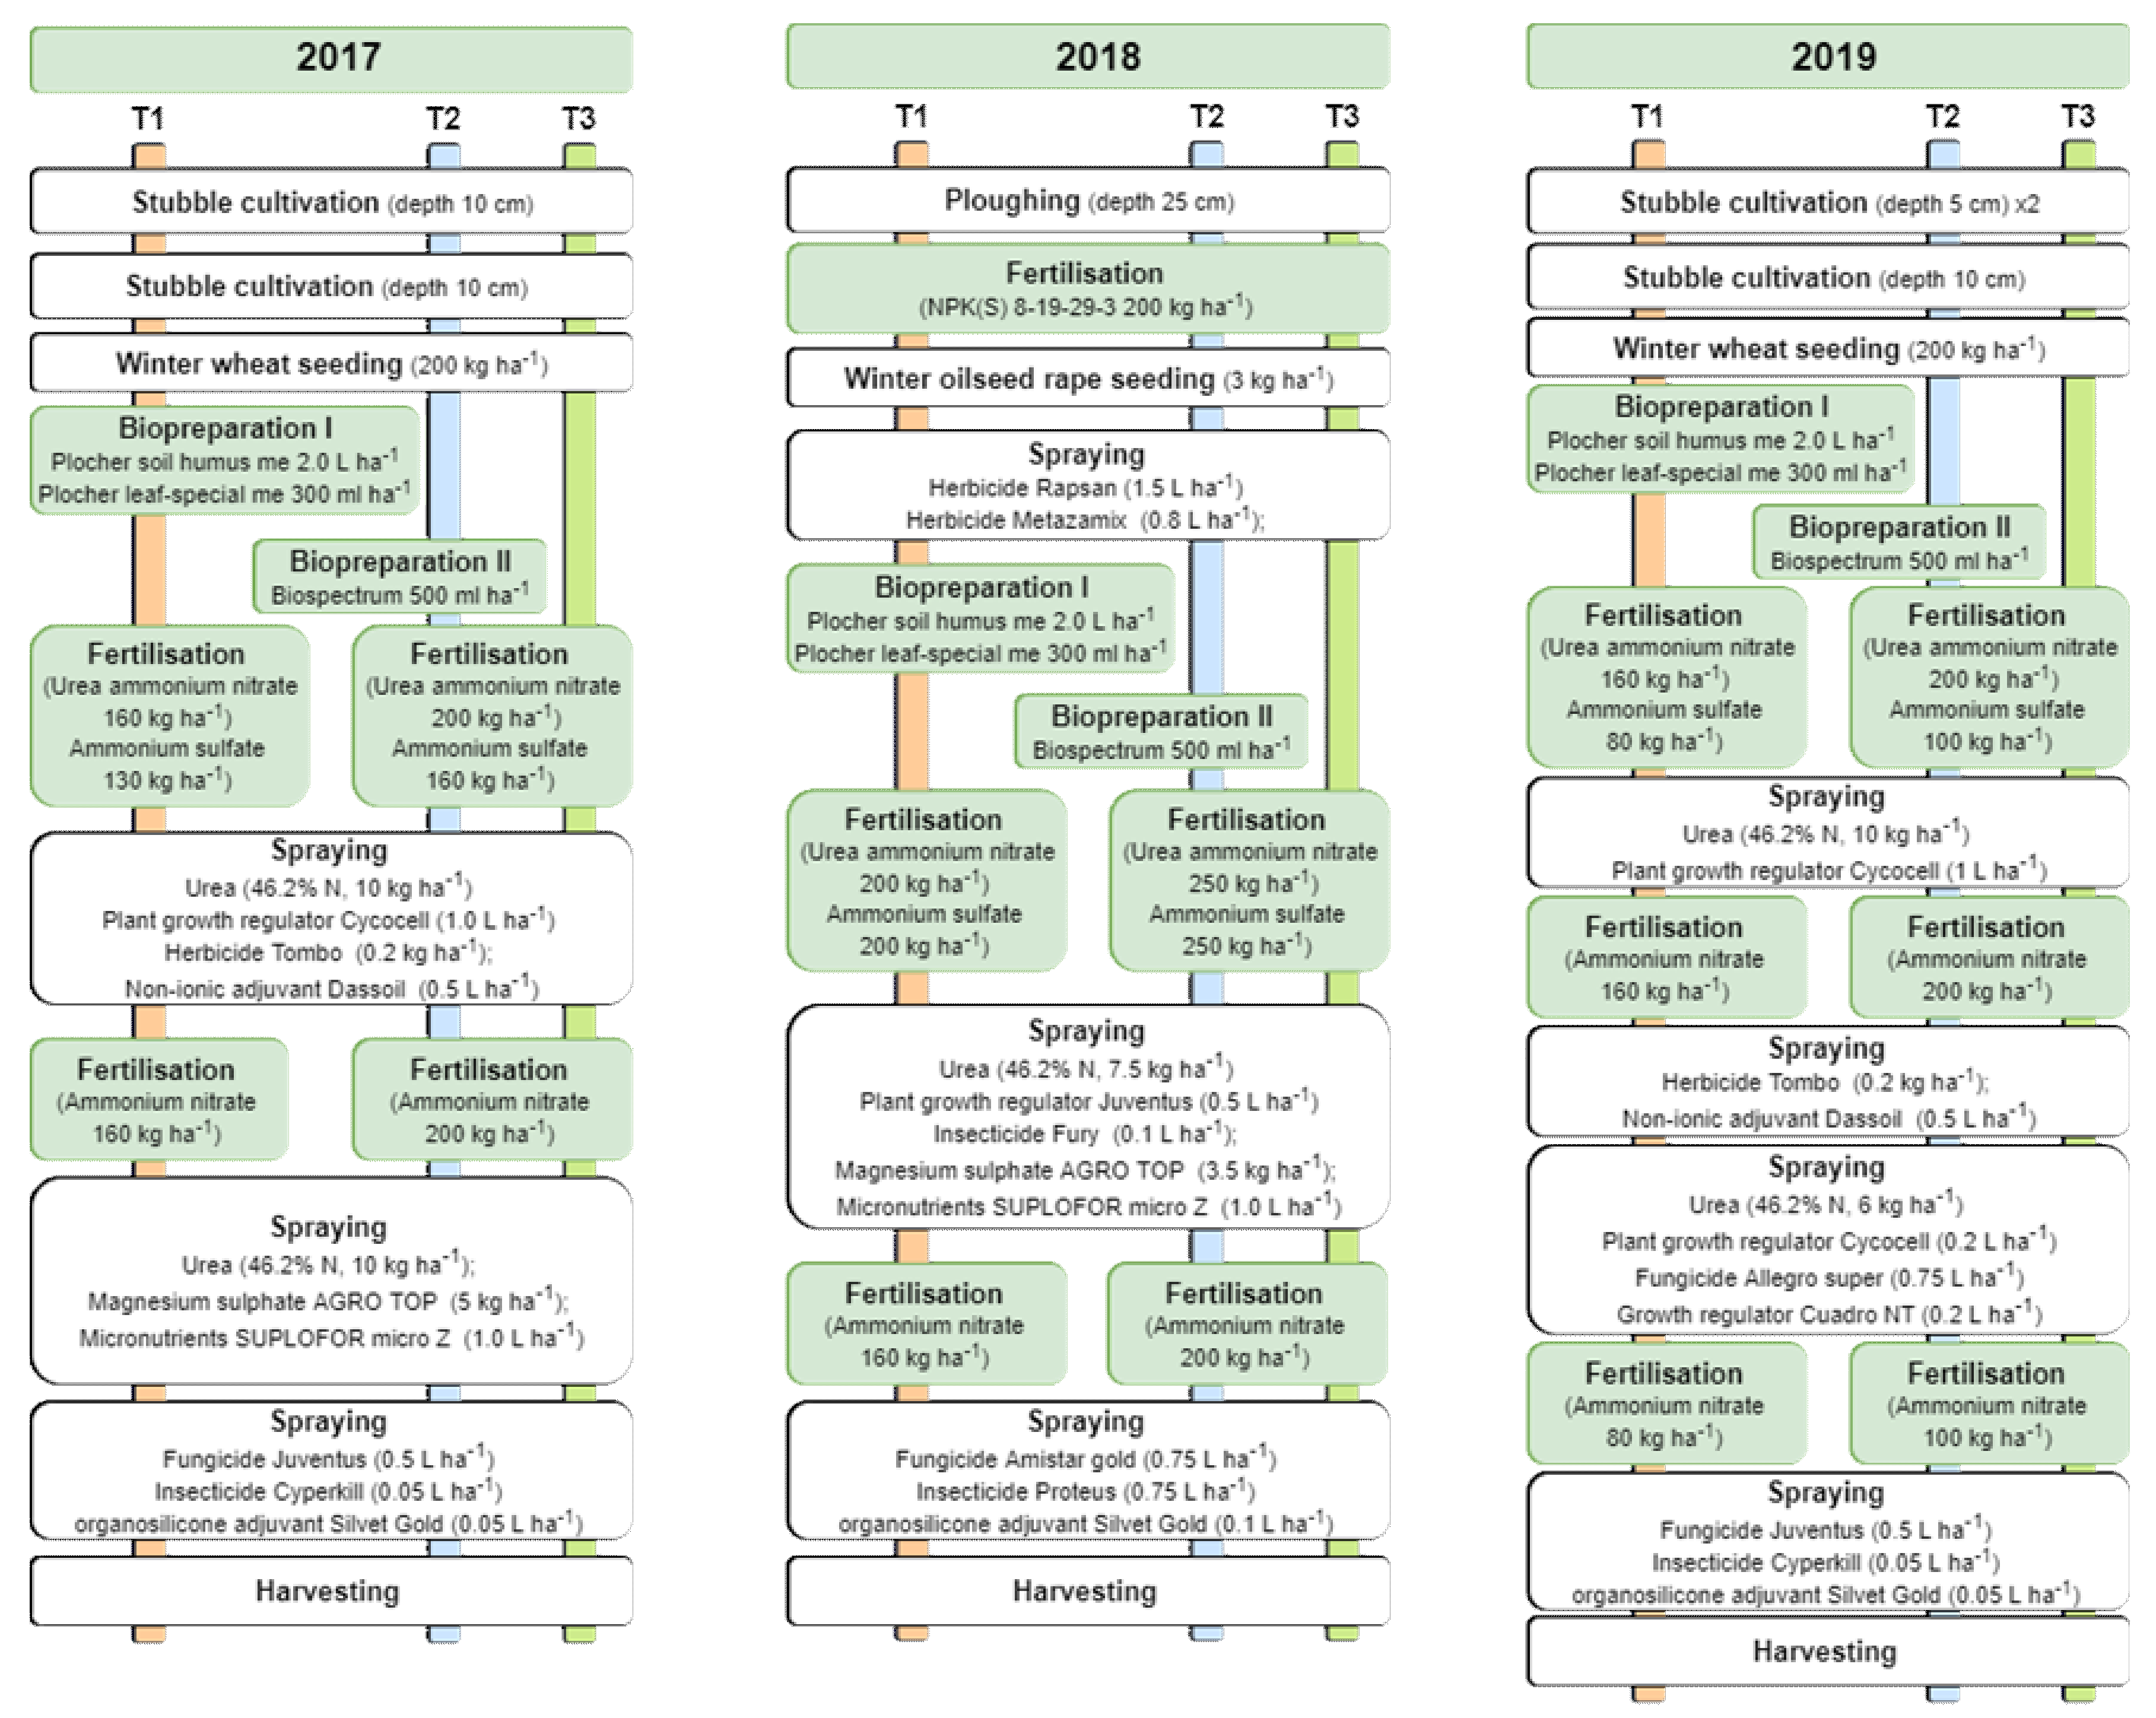
2.2. Biopreparations and Crop Production Technologies

Two different biopreparations with different properties were used in the experiment. Biopreparation I, which is a molasses and magnesium sulphate-based bio-product, was used in treatment T1, while treatment T2 used Biopreparation II, containing different materials, such as Bacillus spp., Thiobacillus spp., Azotobacter spp. and other plant-growth-promoting rhizobacteria (PGPR) spp., mycorrhizal fungi, Fe, Zn, S releasing bacteria (colony forming units min 109 CFU ml), seaweed extract and organic matter. The descriptions of experimental treatments of cultivating winter wheat and winter oilseed rape are presented in Figure 1.

2.3. Energy Assessment

Energy assessment was carried out in order to determine the effect of different biopreparations on the energy consumption of the used technologies. Energy input (MJ ha−1) is one of the key indicators in energy assessment because it shows the direct and indirect inputs in cultivation technology. For the purposes of this energy assessment, all of the following aspects were evaluated: hours of human labor, fuel used, costs of operating machinery, seeds, fertilizer and chemical preparations required in technological processes, as well as their energy equivalents (Table 1). Diesel fuel and human labor are direct energy inputs, while seeds, fertilizer, pesticides and machinery are considered to be indirect energy inputs [32].
Energy output is another essential indicator in energy assessment and it is calculated by multiplying the grain yield (kg ha−1) by its respective energy equivalent MJ kg−1.
In cultivation technology, energy efficiency is evaluated by the energy efficiency ratio (EER), which is the ratio between total energy output (MJ ha−1) and total energy input (MJ ha−1) [37].
For a more detailed assessment of energy data, additional criteria may be used, for example, energy productivity (EP), specific energy (SE), and net energy (NE). Energy productivity (kg MJ−1) indicates how much yield is received per single MJ of energy used [41]. Its reverse value is specific energy, which suggests how much energy (MJ) is required per one kilogram of yield. Energy balance (MJ ha−1) defines the general relationship between energy output (MJ ha−1) and energy input (MJ ha−1) [42].

2.4. GHG Assessment

The agricultural sector is one of a few industries that produce the largest amounts of GHG. The production and usage of mineral fertilizer account for the biggest share of these emissions. Fertilizer consumption rates can be lowered by using biopreparations and increasing the SOC content. To estimate the effect of biopreparation on winter wheat and winter oilseed rape cultivation, an environmental assessment was conducted. The environmental impact of every technological operation was considered in the assessment and calculated based on the GHG emission equivalents recommended by other researchers (Table 2). The evaluation of labor, diesel fuel, machinery, seed and biopreparation inputs allowed us to determine the most environmentally friendly variant of winter wheat and winter oilseed rape cultivation technology.

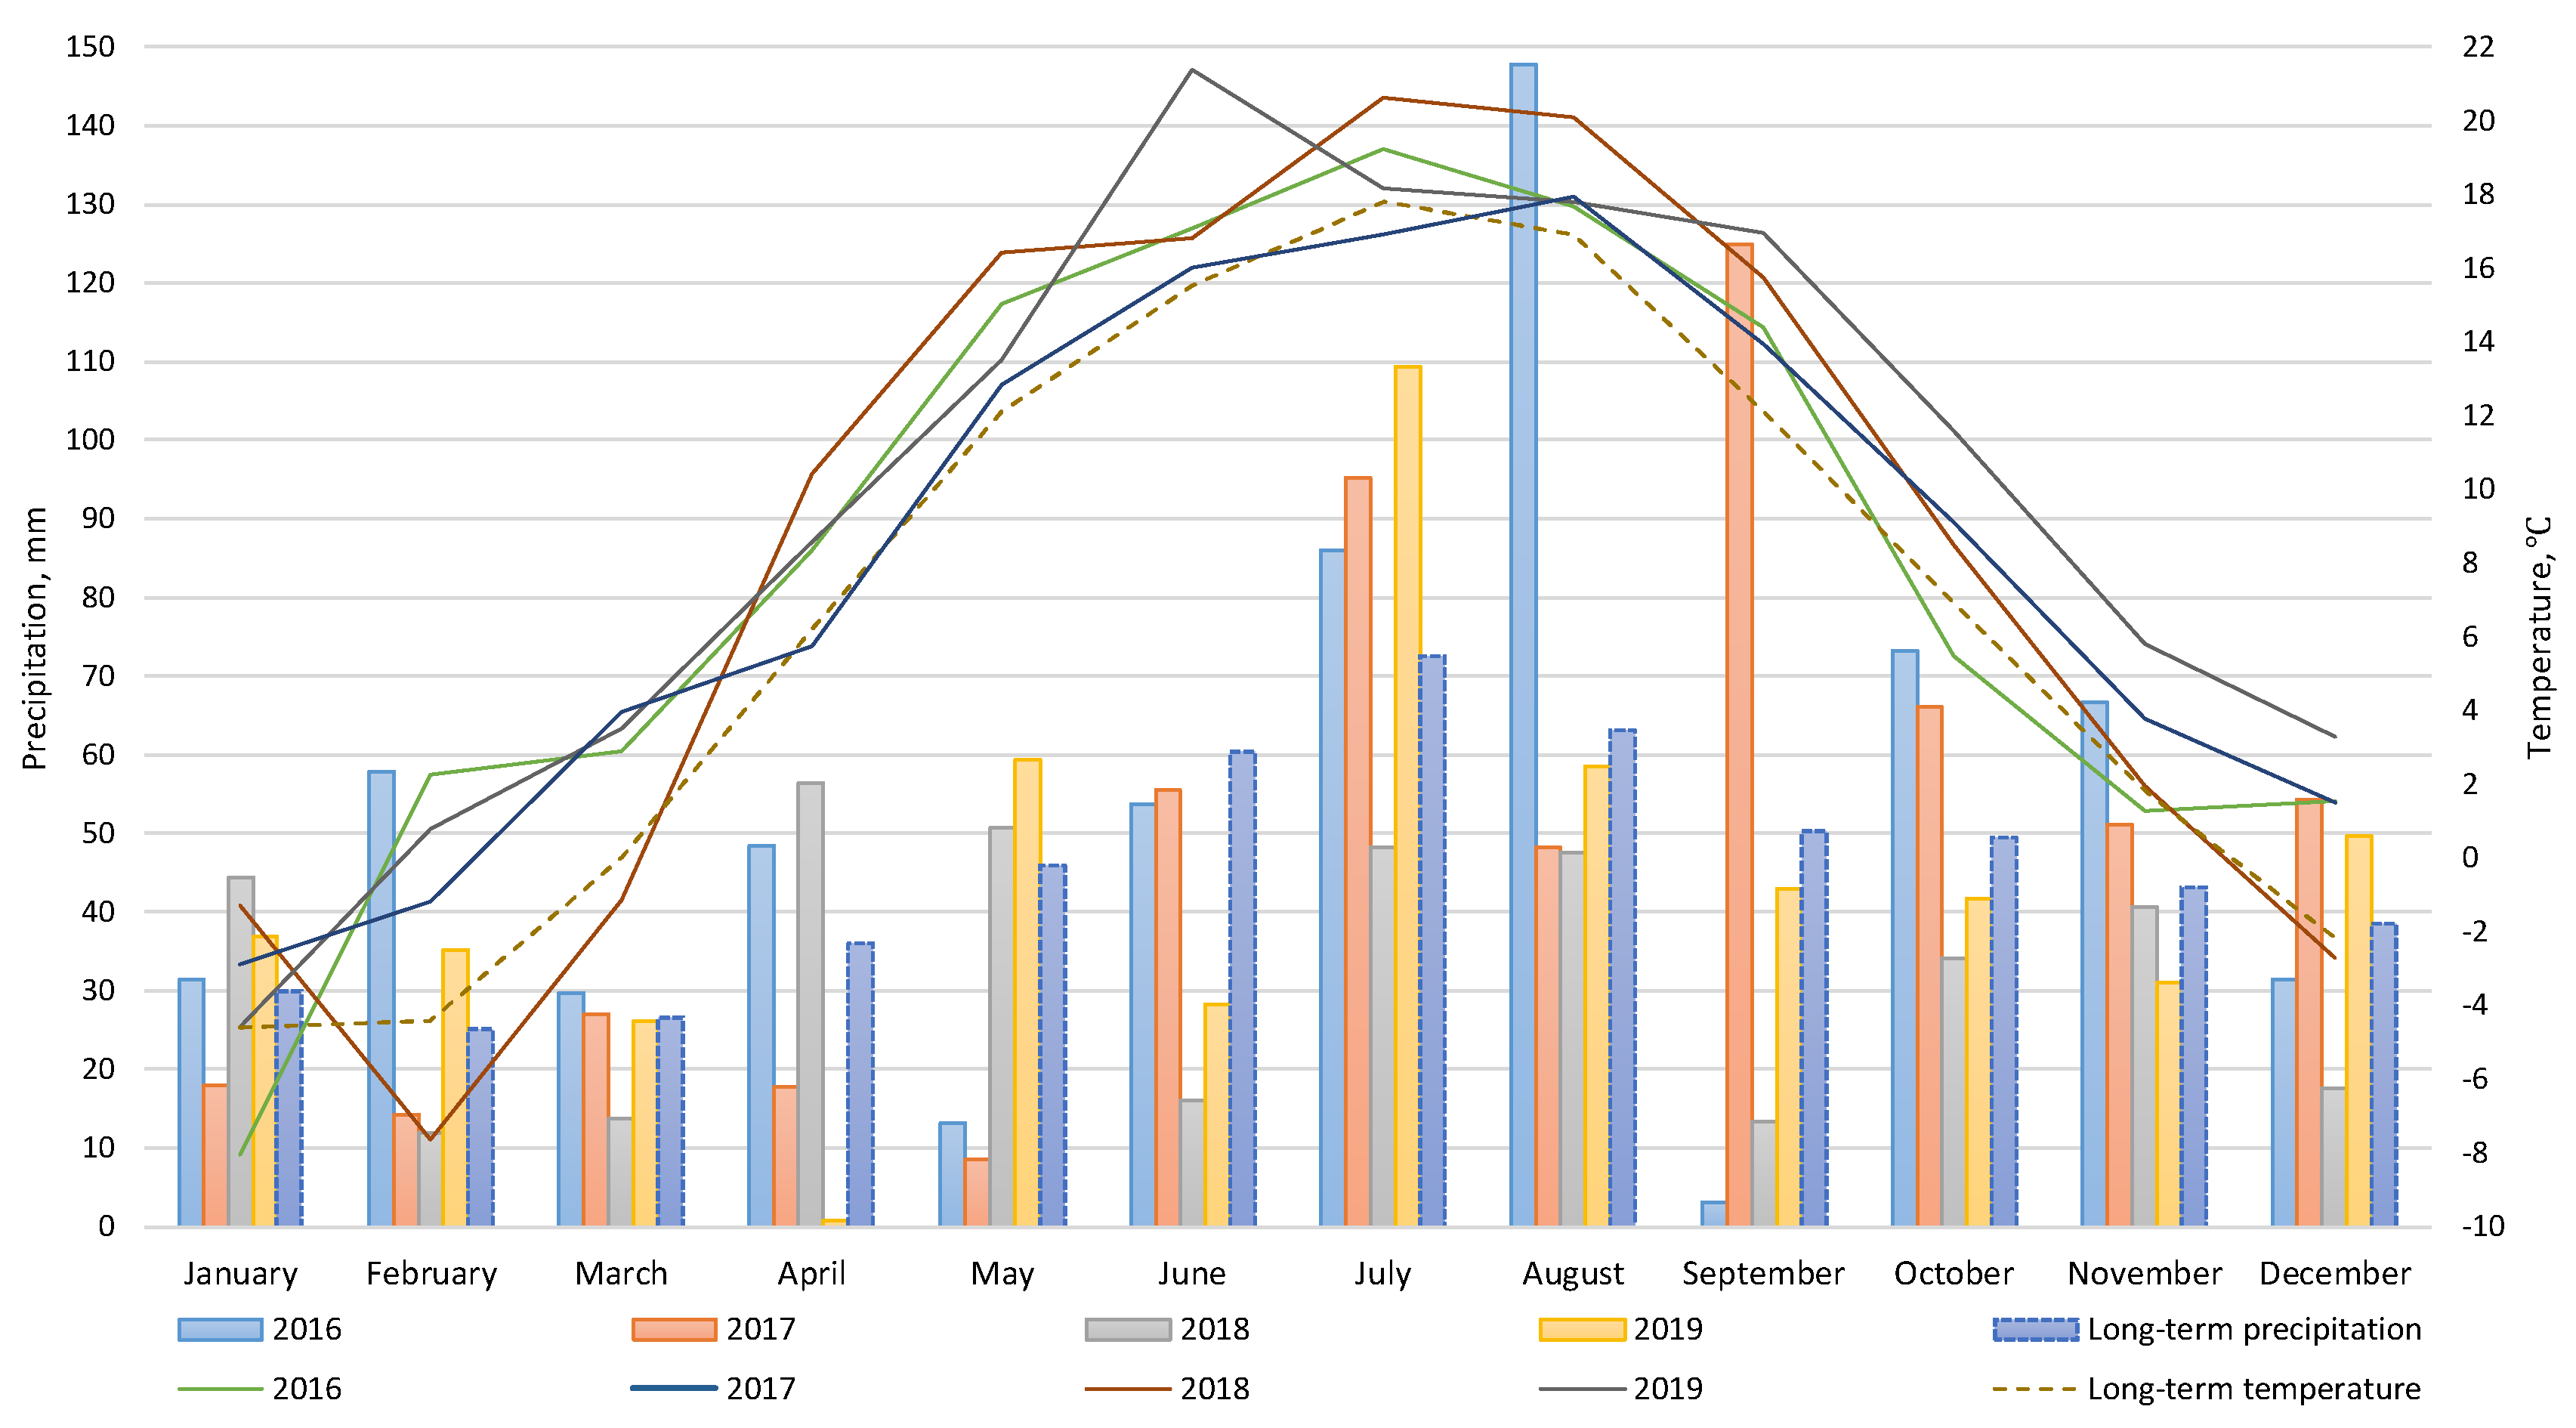
2.5. Meteorological Conditions

Data regarding the meteorological conditions during the period of experiment were obtained from the Panevėžys Meteorological Station and the Joniškėlis Experimental Station. They were then compared to the long-term average data of 50 years (Figure 2). During the years of the experiment, precipitation in the month of January was similar to the long-term average, except for the year 2017, when the conditions were dry. The same month was 1.7 times colder in 2016 and 3.5 times warmer in 2018. February was very wet in 2016 but dry in the two following years (2017–2018) with a 1.8–2.1 times lower precipitation rate. During the three years of the experiment (2016, 2017, 2019), the month of February was warm, but in 2018, the temperature dropped by 3.3 °C compared to the long-term average. March was distinguished by its close to the long-term average precipitation, with the exception of 2018, when it was dry and cold. During the other years, it was 2.9–4.0 °C warmer. Extreme differences were recorded every April during the experiment: in 2016 and 2018, it was 1.3–1.6 times wetter, and in 2017—2.0 times dryer than the long-term average. The April of 2019 was extremely dry with only 0.8 mm precipitation during the whole month. The temperature in April during all years of the experiment was 2.1–4.2 °C higher, except 2017, when it was slightly lower. During the first two years (2016–2017), May was extremely dry and in the following years (2018–2019) slightly exceeded the long-term average with temperatures close to normal. Opposite conditions regarding precipitation were recorded in June—the first two years of the experiment were close to the long-term average and the two following years were 2.1–3.8 times dryer. The temperature was typical for June, except for the final year (2019) when it exceeded the long-term average by 5.9 °C. The month of July was wet, except for 2018 when it was dry and warmer than usual.
Compared to the long-term average, precipitation in August was 2.3 times higher during the first year of the experiment (2016), and the temperature was close to the long-term average conditions in all years, with the exception of 2018, when temperatures higher by 3.9 °C were recorded. During September of the first (2016) and the third (2018) year, it was very dry, while in 2017, precipitation was 2.5 times higher than usual. During all years of the experiment, the temperatures in September were 1.9–4.9 °C higher than the long-term average. October and November of the first two years were wetter than the long-term average; meanwhile, during the final two years the same months were dryer. In October of 2016, the temperature was close to normal and in 2017–2019 it was higher. October of 2019 showed a 4.7 °C (1.7 times) higher than the long-term average temperature, while November of the same year—4.0 °C (3.2 times) higher. December had contrasting precipitation every second year. 2016 and 2018 were dryer, while 2017 and 2019 wetter than the long-term average. Compared to it, during the whole period of the experiment, the temperatures in December were higher, except 2018, which was 0.5 °C colder.

2.6. Statistical Analysis

Significant differences among the evaluated data were identified using one-way ANOVA, while Tukey’s Test was used for comparison of individual research factors (year, yield, biopreparation treatment) and their interactions. Their standard deviations were calculated by arithmetic means. Confidence intervals were established with a probability level of p < 0.05. Experimental data were processed using statistical software package SYSTAT 10 (SPSS Inc., USA).

3. Results and Discussion

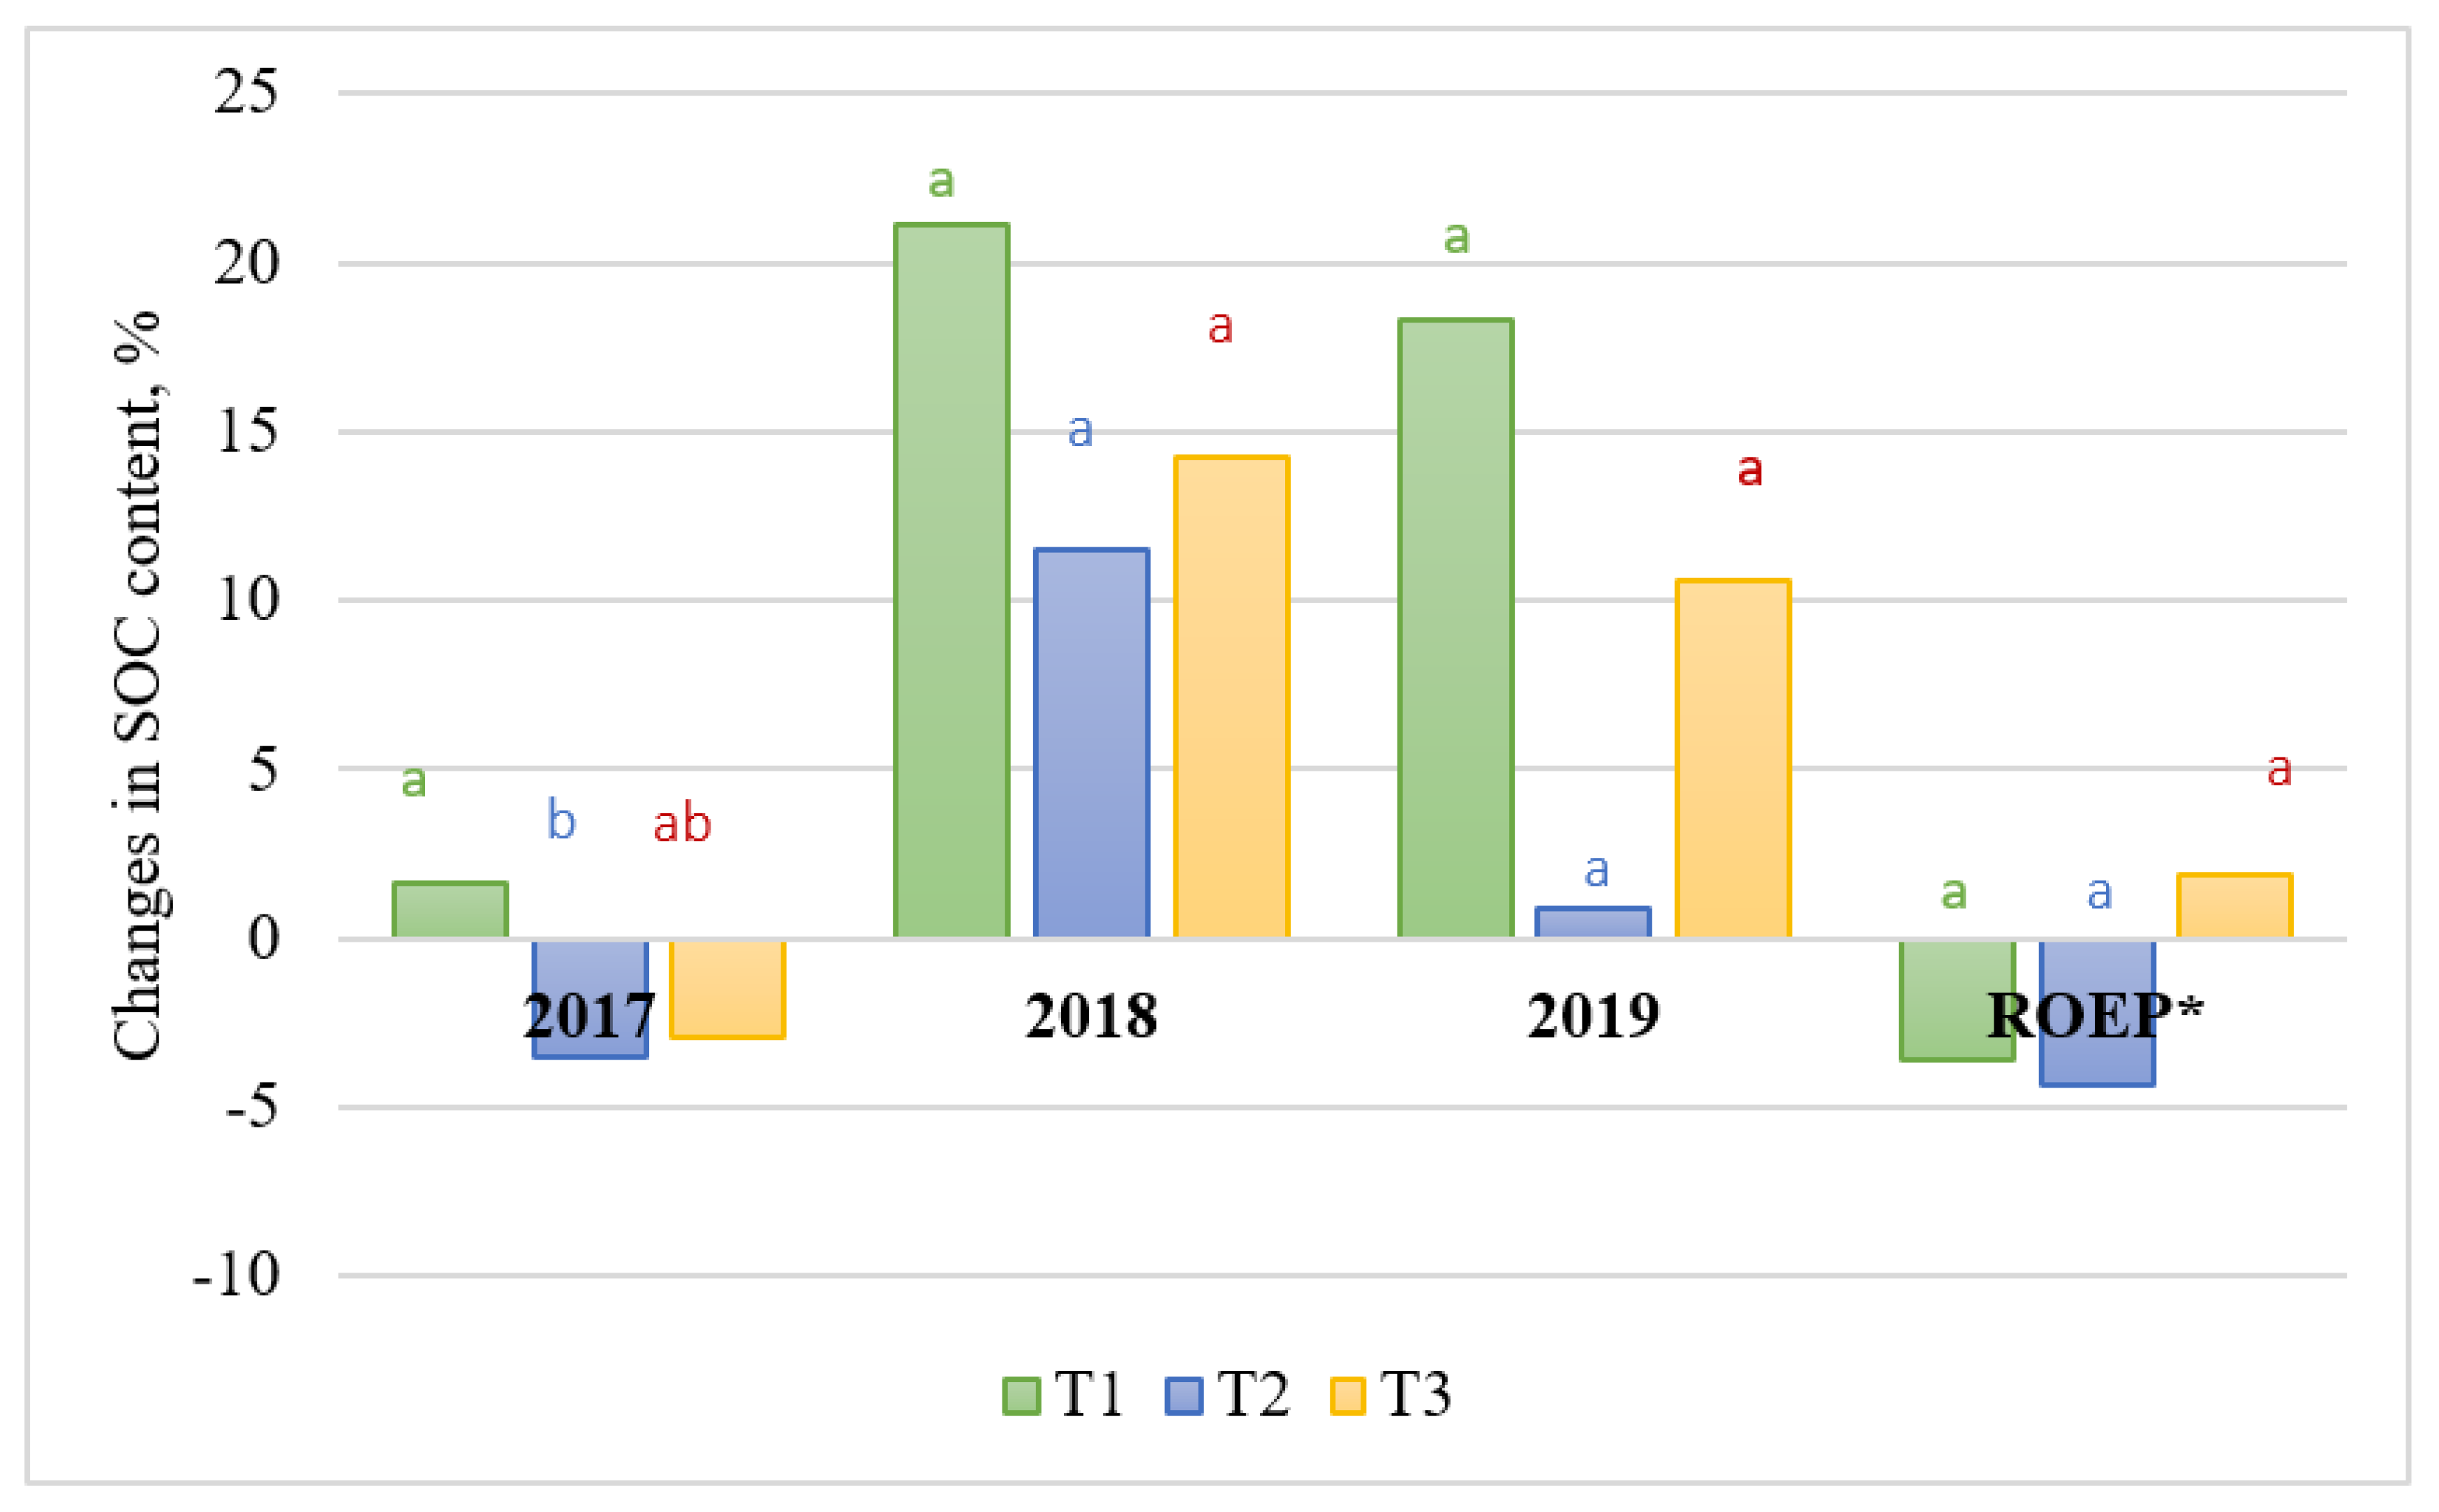
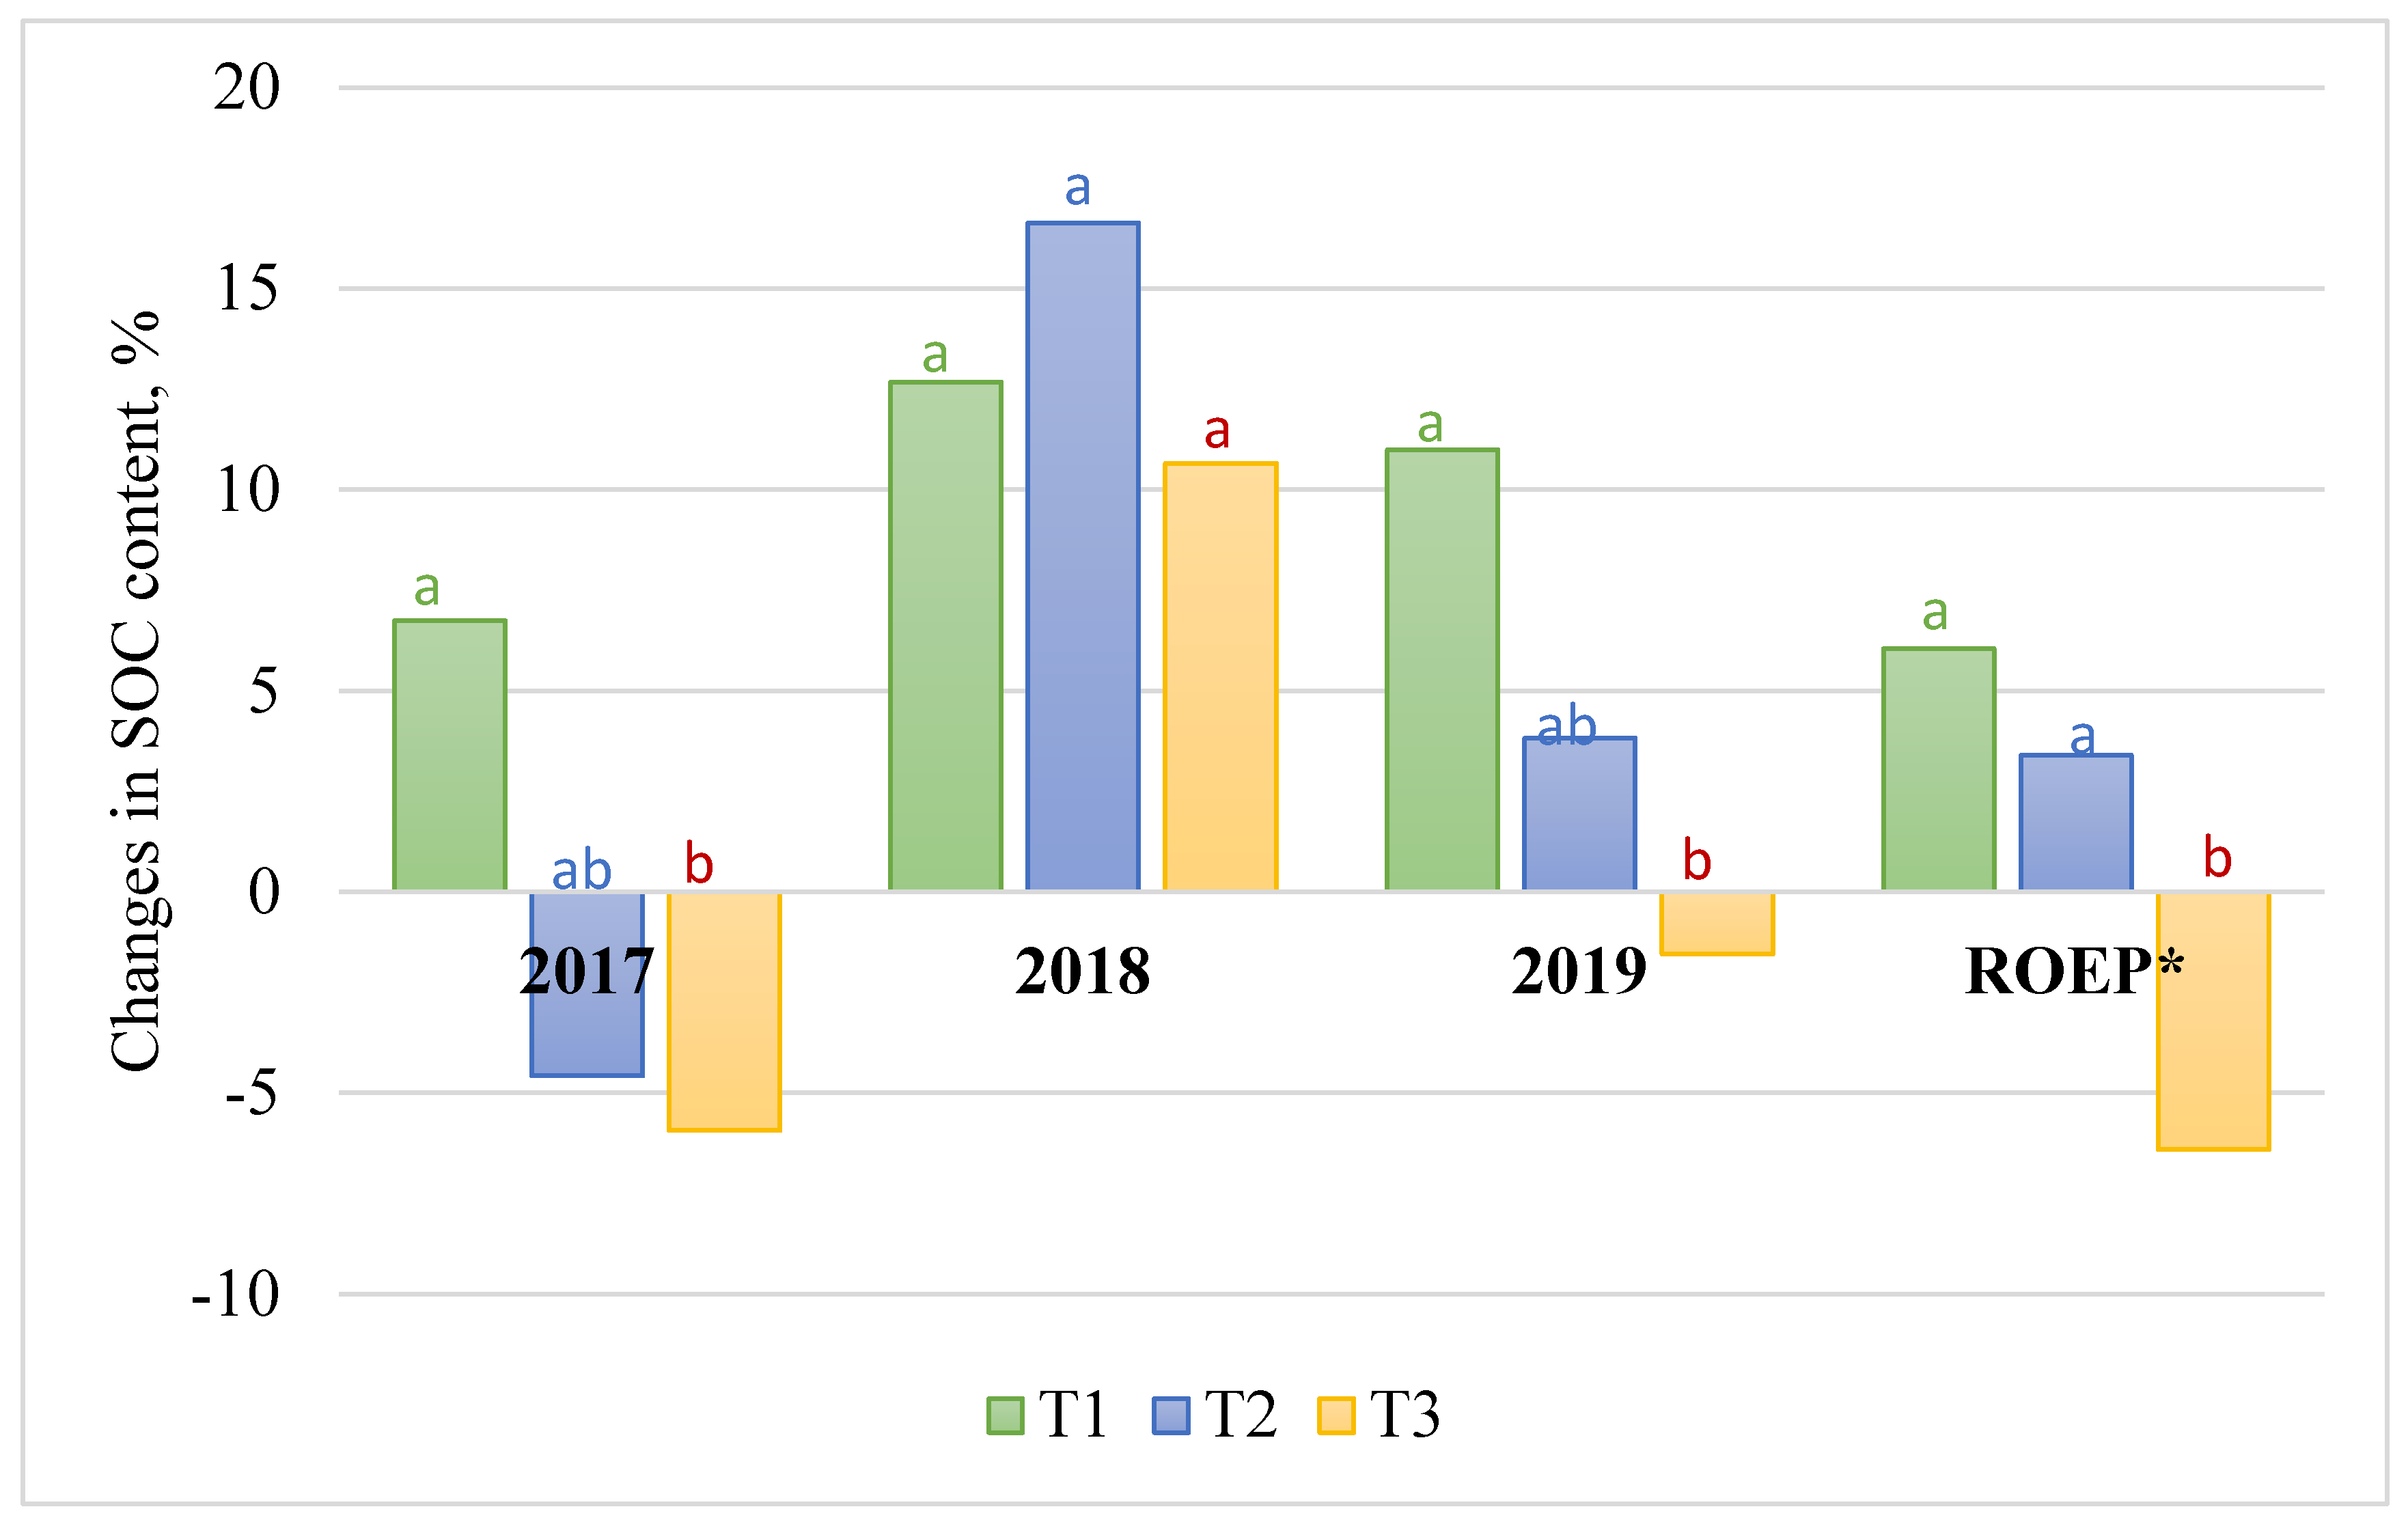
3.1. Soil Organic Carbon
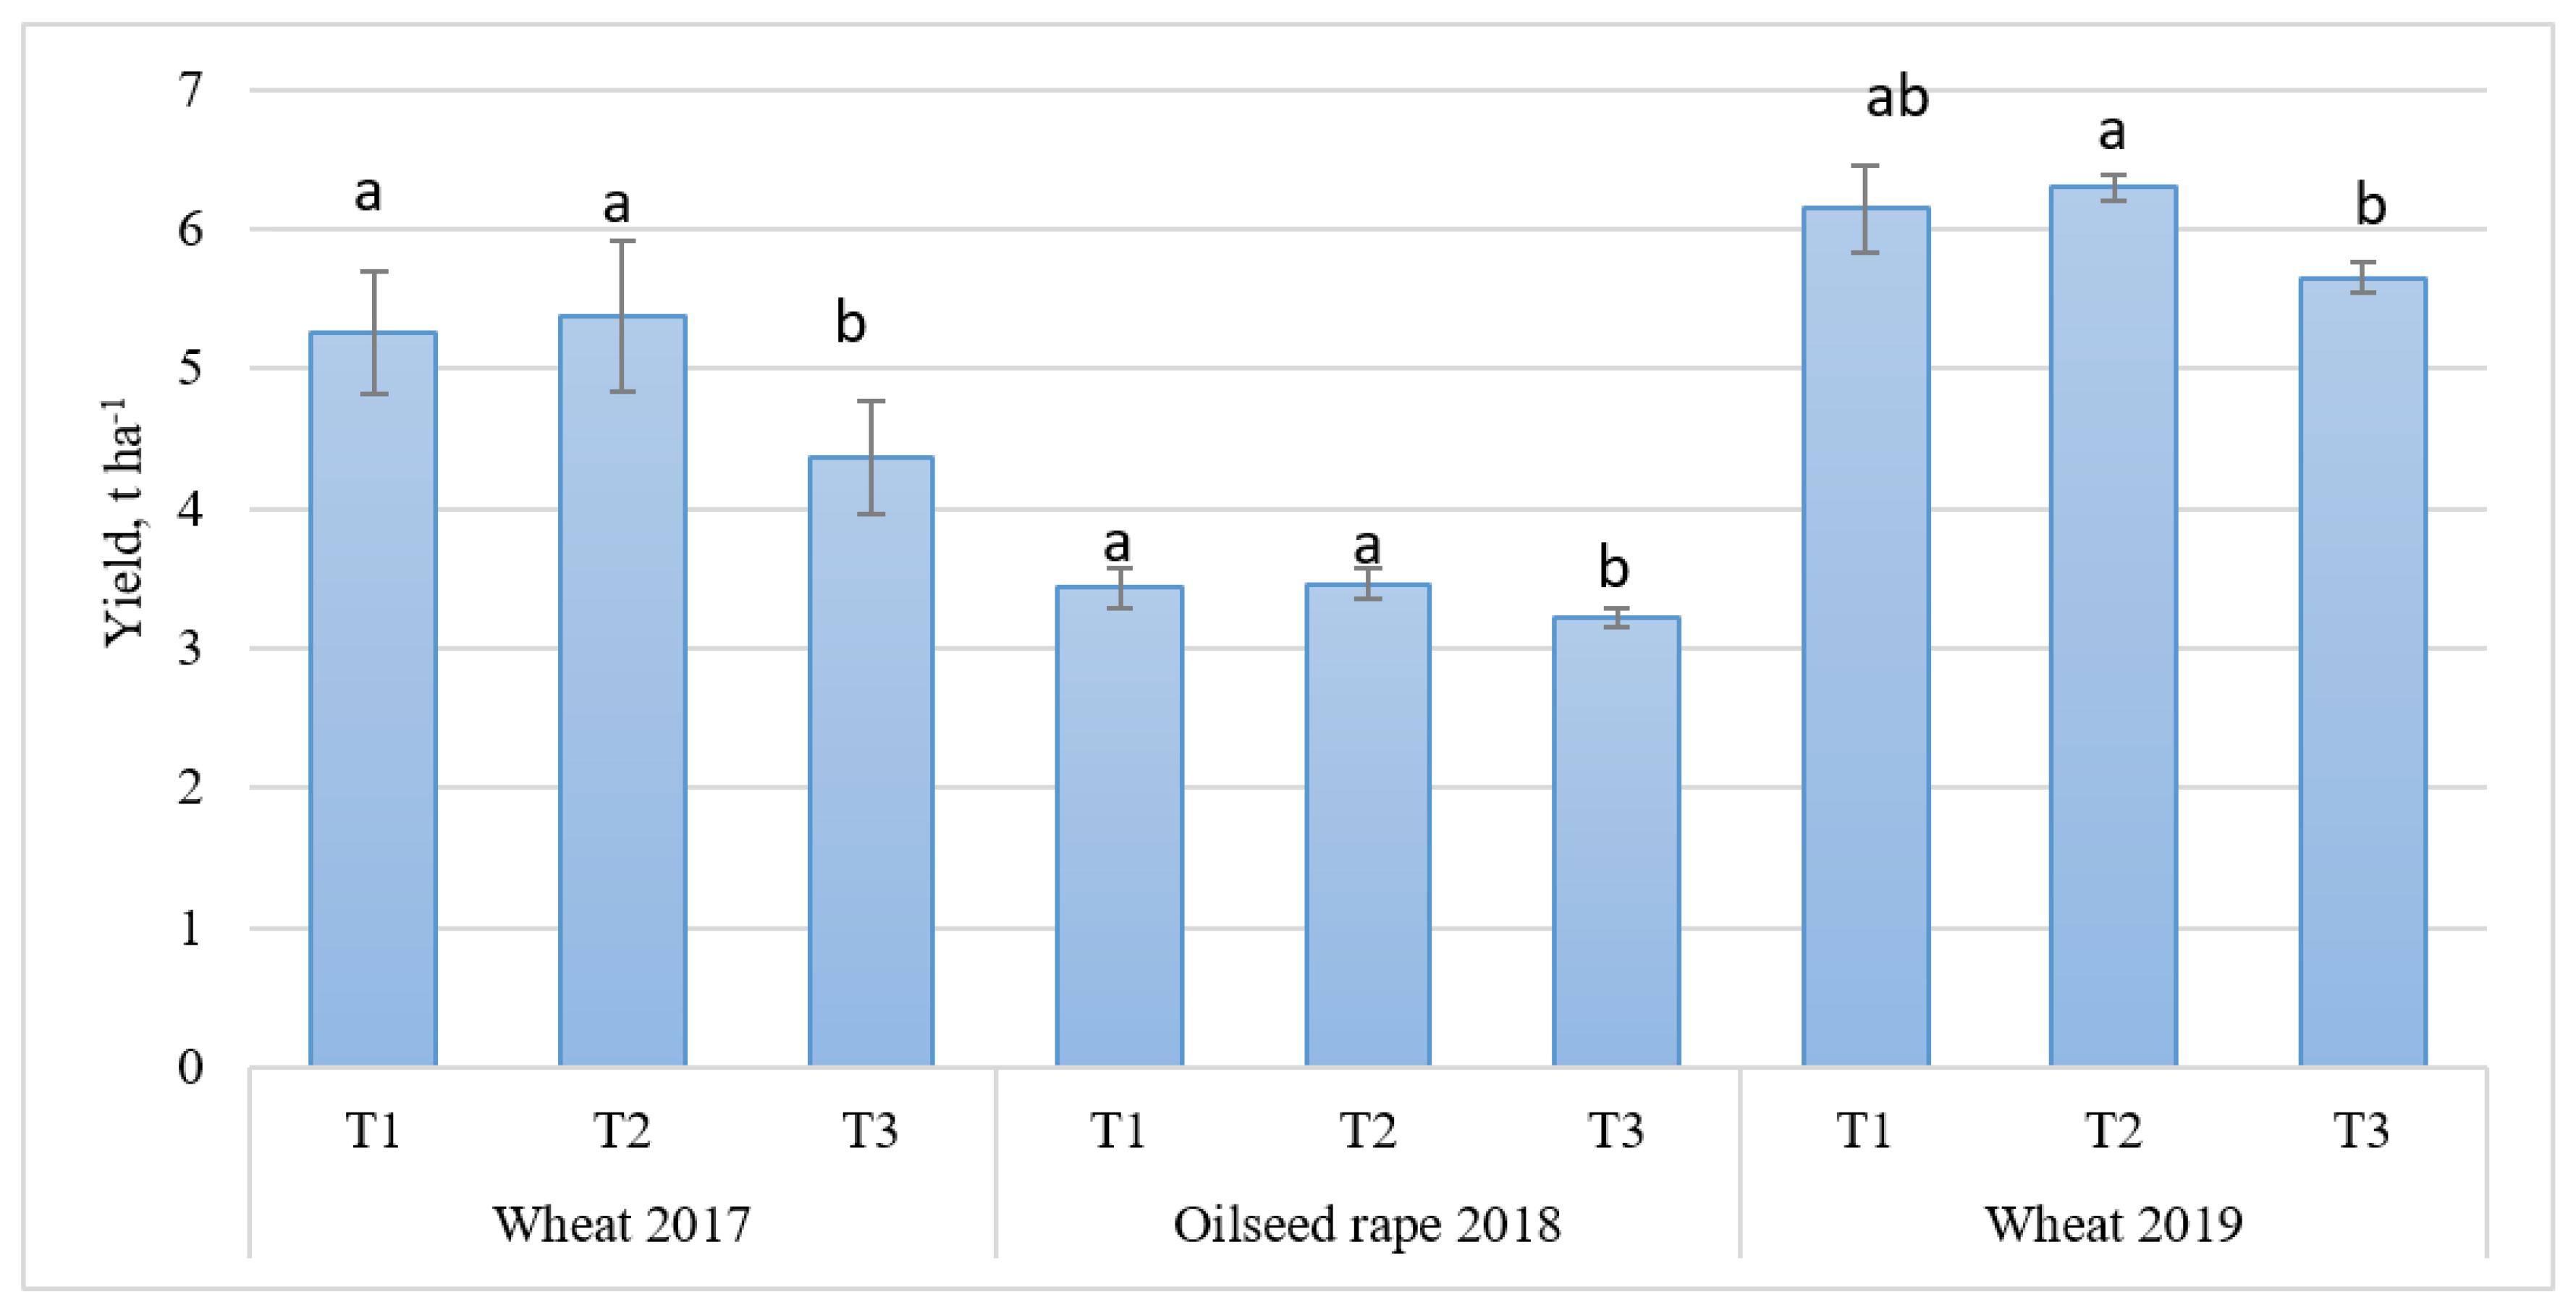
SOC content was measured twice a year, i.e., in the early spring when the winter plants begin vegetation and in the autumn after harvesting crops. The aim of this research was to determine the impact of the applied biopreparations on the changes of SOC content at different depths. The results of SOC analysis, presented in Table 3, indicate that in 2017, at the beginning of the experiment, the control treatment T3 had the largest amount of SOC—2.12% at 0–10 cm depth and 2.14% at 10–20 cm depth.
At the beginning of this research and in those treatments where biopreparations were used, the SOC content in the top layer of soil (0–10 cm) was recorded between 1.78 and 2.00% and between 1.78 and 1.84% in the deeper layer. A similar tendency was observed in the spring of every year—control treatment T3 consistently showed a larger concentration of SOC than T1 and T2 treatments. However, SOC analysis conducted in autumn revealed the effect of biopreparations on the changes of SOC content.
The analysis of the research results displayed a positive tendency regarding the SOC content in both the top and the deeper layers of the soil. In the top level of soil (0–10 cm), the molasses-based biopreparation (T1) delivered better results every year of research, in comparison to control treatment T3 (Figure 3). During the 2017 vegetation period, an increase in the SOC content was only recorded in T1 treatment, while all other treatments displayed its decrease. In 2018 and 2019, the SOC level grew in all treatments—in T1, an increase of 21.1% (2018) and 18.3% (2019) was recorded, while in T2 it was 11.5% and 0.9%, respectively. The evaluation of the soil organic carbon fluctuations between the spring of 2017 and the autumn of 2019 indicates a decrease in the SOC content in the top layer of soil in T1 and T2 treatments compared to the control treatment.
An even stronger positive effect on the changes in SOC content was observed at 10–20 cm depth in both treatments that used biopreparations as shown in Figure 4. During all years of the experiment, the changes in the level of SOC were more significant in treatments T1 and T2 than in the control treatment T3, where a decrease of SOC content was recorded in 2017 and 2019. The evaluation of the results obtained both in the initial and the final stages of the experiment revealed a 6.4% drop in SOC content in the control treatment. This decrease of SOC amounts may have been largely caused by the meteorological conditions during the final year of the experiment. The average precipitation in 2019 was 223.7 mm (only 0.8 mm precipitation was recorded in April), and the average temperature during the plant vegetation period was 13.3 °C, which, compared to the long-term average of 241.7 mm and 10.32 °C, respectively, indicates that the year was dry and warmer than usual. A natural drought was also declared nationwide. According to Mellilo et al. [47] and Qi et al. [8], an increase in the ambient and the soil temperatures may influence the reduction of SOC content due to the increase in the soil respiration intensity and the activity of the microorganisms in the soil [48,49].
To sum up the results of the SOC content analysis, it may be concluded that even in difficult meteorological conditions, biopreparations can aid in preserving the SOC content and even increasing it at 10–20 cm depth.

3.2. Crop Yield

In 2017, both T1 and T2 treatments, where biopreparations were used, demonstrated winter wheat yields as high as 5.26 ± 0.43 t ha−1 and 5.38 ± 0.54 t ha−1, respectively, which is a statistically significant (p < 0.05) difference (Figure 5) in comparison to the control treatment (T3 4.37 ± 0.39 t ha−1). The difference between the yields in different winter oilseed rape cultivation treatments decreased in 2018. However, the treatments in which biopreparations were used showed a significantly (p < 0.05) bigger yield than the control treatment. For the purposes of crop rotation, winter wheat was once again cultivated in 2019, which in all treatments demonstrated the same tendency as observed in the previous years. The maximum yield was recorded in T2 at 6.3 ± 0.09 t ha−1. A significant yield difference was observed between treatments T2 and T3. Similar results (14% yield increase in winter cereals) were reported by Artyszak and Gozdowski [50].

3.3. Energy Input/Output Analysis

The energy inputs assessment indicated that energy inputs in T1 were lower than in T2 and T3 (Table 4). This may be explained by the fact that the fertilizer rate was reduced by 20% per the biopreparation which was used in the T1 treatment manufacturer‘s recommendation. The fertilizer used accounted for the largest share of energy inputs in all treatments. In 2017 and 2019, mineral fertilizer was responsible for approximately 65% of total inputs. The results of Tang et al. [51] suggest that the bacterial treatments combination with fertilization could compensate at least half the N and P fertilizer amounts as compared to the conventional approach of using chemical fertilizers alone. In the oilseed rape production in 2018, fertilizer accounted for as much as 72% of total energy inputs. The results regarding energy consumption obtained in this study are very similar to the energy assessment results presented by other authors. Khoshnevisan et al. [52] claim that in wheat cultivation technology, mineral fertilizer represents approximately 68% of total energy inputs. Singh et al. [53] found through their research that the effect of mineral fertilizer on the total energy inputs may reach approximately 45%. Similar findings are reported by other authors: Canacki et al. [54]—approximately 54%, Unakitan and Aydin [30]—53.5%, Yuan et al. [55]—38.6 to 59.2%.
Due to the difference in the yield between separate treatments, there was a greater difference in energy outputs. Although there was only a small difference between the energy output in T1 and T2, in all years of the experiment, the latter had a larger energy output. In 2017, the difference between the treatments in question where biopreparations were used was 1790 MJ ha−1, in 2018—862 MJ ha−1, and in 2019—2198 MJ ha−1. In comparison to treatment T2, a 6.96% lower energy output was observed in control treatment T3 in the case of winter oilseed rape (2018) and 18.74% lower in the case of winter wheat (2017), and in comparison to treatment T1, it was between 6.11% (2018) and 16.96% (2017) lower, respectively.
The Energy Efficiency Ratio (EER) of winter wheat and winter oilseed rape production which was calculated suggests that the use of biopreparation resulted in higher efficiency in comparison to the control treatment where no biopreparations were used. The highest efficiency was reached in treatment T1, which yielded a little less than T2, but the reduction of mineral fertilizer rate by 20% allowed to achieve the highest EER—4.84 for winter wheat and 5.11 for winter oilseed rape. This energy indicator is not too far from the results reported by other researchers. In their findings, Yuan et al. [55] claim that EER in wheat cultivation fluctuated from 4.11 to 5.2, while the EER reported by Unakitan and Aydin [30] is 3.52.
The assessment of other energy productivity, specific energy and net energy indicators has revealed that treatments where biopreparations were used provided better results in comparison to the control treatment.

3.4. GHG Emissions

The assessment of the environmental impact of different treatments of cultivating winter wheat and winter oilseed rape required the calculation of greenhouse gas (GHG) emissions which were then expressed in the most commonly used unit of measurement—kg CO2eq ha−1. It was determined that the use of biopreparations in the production of winter wheat and winter oilseed rape has a positive environmental effect. In terms of winter wheat production, GHG emissions accounted for 784–892 (2017) and 669–751 kg CO2eq ha−1 (2019). These results correlate well with the emissions generated in the process of winter wheat production reported by other authors [56,57]. In the present study, and in comparison to winter wheat, the winter oilseed rape production generated higher GHG emissions, which reached as much as 960–1108 kg CO2eq ha−1. Through their environmental impact assessment, Mohammadi et al. [32] also determined that the emissions generated in the process of oilseed rape cultivation equaled 1063 kg CO2eq ha−1. Our research showed that in all years of the experiment, mineral fertilizer played a key role in GHG emissions both from winter wheat and winter oilseed rape production, which accounted for 65.6% (2017) to 61.4% (2019) of the total GHG emissions from winter wheat and 72.3% from winter oilseed rape. Other researchers [58] also identify mineral fertilizer as a major factor in GHG emissions and report 53.6–65.4% of total GHG emissions generated in the process of wheat production coming from mineral fertilizer. The evaluation conducted by Khoshnevisan et al. [57] demonstrates that in wheat production fertilizer accounts for 51.6% of total emissions.
Because of the differences between the crop cultivation treatments and the crop yield, it is extremely important to assess the GHG emissions generated per single ton (1.0 Mg) of produce. The results of the environmental impact analysis show that in all years of the experiment, GHG emissions followed the same trend, i.e., the lowest emissions were recorded in treatment T1, where, due to the lower rate of fertilizer applied to winter wheat, emissions ranged from 108.7 to 149.1 kg CO2eq Mg−1, while the highest emissions were recorded in T3—132.5–203.7 kg CO2eq Mg−1. In terms of winter oilseed rape, 280.0, 320.1 and 343.4 kg CO2eq Mg−1 were recorded in treatments T1, T2 and T3, respectively. The results of GHG emissions assessment according to the different agricultural inputs and treatments are presented in Table 5.

4. Conclusions

To summarize the results, it may be concluded that in winter wheat and winter oilseed rape cultivation, biopreparations help to preserve the SOC content or even increase it in deeper soil layers at 10–20 cm depth despite unfavorable meteorological conditions. The molasses-based biopreparation used in T1 exceeded the control treatment (T3) results in topsoil (0–10 cm) every year of the experiment. A statistically significant increase in winter wheat (8.9–23.2%) and winter oilseed rape (6.5–7.5%) yield was obtained when biopreparations were used.
The assessment of the energy efficiency indicators has shown that compared to the control treatment (T3), the use of biopreparations may increase the net energy, which was higher in the winter oilseed rape cultivation than in the winter wheat cultivation. The total energy output, energy productivity and energy efficiency ratio were also higher in the treatments where biopreparations were used (T1 and T2) in the winter wheat and winter oilseed rape production technologies.
In terms of greenhouse gas emissions (GHG), fertilizer use is the key factor which accounts for over 60% of total emissions. Compared to the control treatment (T3), with the use of biopreparations it is possible to decrease GHG emissions per one ton of winter wheat and winter oilseed rape yield produced by 10.3–27.7% and 7.0–19.3% respectively. Regardless of the crop type and the year, in treatment T1, where biopreparation was used, were the lowest GHG emissions per one hectare, 668.6–784.5 kg CO2eq and 960.3 kg CO2eq for winter wheat and winter oilseed rape, respectively.
To elaborate on the present topic, analytical modeling research should be carried out in the future regarding the impact of the changes of soil organic carbon content on fertilizer use, carbon footprint and economic benefits in order to reduce mineral fertilizer consumption without sacrificing crop yield.

Author Contributions

Conceptualization, D.J. and E.Š.; methodology, D.J., Z.K. and E.Š.; validation, D.J. and A.J.; investigation, D.J.; resources, E.Š. and A.J.; data curation, D.J. and Z.K.; writing—original draft preparation, D.J., Z.K. and E.Š.; writing—review and editing, Z.K., A.J. and E.Š.; visualization, D.J. and Z.K.; supervision, E.Š. All authors have read and agreed to the published version of the manuscript.

Funding

This research received no external funding.

Acknowledgments

To Vytautas Magnus University Agriculture Academy and World Federation of Scientists for support and scholarship. Special thanks to the representatives of Joniškėlis Experimental Station and Vereinigte Hagelversicherung VVaG branch VH Lietuva for providing data of meteorological conditions. Thanks to Grynas Baltija and Nando for supplying the biopreparations for research.

Conflicts of Interest

The authors declare no conflict of interest.

References

  1. Lal, R. Carbon sequestration. Philos. Trans. R. Soc. Lond. Ser. B Biol. Sci. 2008, 363, 815–830. [Google Scholar] [CrossRef] [PubMed]
  2. Briones, M.J.I.; Ostle, N.J.; Garnett, M.H. Invertebrates increase the sensitivity of non-labile soil carbon to climate change. Soil Biol. Biochem. 2007, 39, 816–818. [Google Scholar] [CrossRef]
  3. Benbi, D.K.; Chand, M. Quantifying the effect of soil organic matter on indigenous soil N supply and wheat productivity in semiarid sub-tropical India. Nutr. Cycl. Agroecosyst. 2007, 79, 103–112. [Google Scholar] [CrossRef]
  4. Shi, X.Z.; Yang, R.W.; Weindorf, D.C.; Wang, H.J.; Yu, D.S.; Huang, Y.; Pan, X.Z.; Sun, W.X.; Zhang, L.M. Simulation of organic carbon dynamics at regional scale for paddy soils in China. Clim. Chang. 2009, 102, 579–593. [Google Scholar] [CrossRef]
  5. Getahun, G.T.; Munkholm, L.J.; Schjønning, P. The influence of clay-to-carbon ratio on soil physical properties in a humid sandy loam soil with contrasting tillage and residue management. Geoderma 2016, 264, 94–102. [Google Scholar] [CrossRef]
  6. Lenka, N.K.; Jaiswal, S.P.; Thakur, J.K.; Lenka, S.; Mandal, A.; Dwivedi, A.K.; Yashona, D.S. Soil degradation effect on soil productivity, carbon pools and soil enzyme activity. Curr. Sci. 2017, 112, 2434–2439. [Google Scholar] [CrossRef]
  7. Bastioli, C.; Biro, B.; Bouma, J.; Cienciala, E.; Correia, T.P.; Emmett, B.; Filchev, L.H.; Frison, E.A.; Grand, A.; Veerman, C.; et al. Caring for Soil is Caring for Life: Ensure 75% of Soils Are Healthy by 2030 for Healthy Food, People, Nature and Climate: Interim Report of the Mission Board for Soil Health and Food: Study; Publications Office of the European Union: Luxembourg, 2020; p. 56. Available online: https://op.europa.eu/s/n8PT (accessed on 25 August 2020). [CrossRef]
  8. Qi, R.; Li, J.; Lin, Z.; Li, Z.; Li, Y.; Yang, X.; Zhao, B. Temperature effects on soil organic carbon, soil labile organic carbon fractions, and soil enzyme activities under long-term fertilization regimes. Appl. Soil Ecol. 2016, 102, 36–45. [Google Scholar] [CrossRef]
  9. Zhang, Y.; Cai, X.; Lv, J. Size and dynamics of soil organic carbon stock in cropland of the Eastern Qinghai-Tibetan Plateau. Agric. Ecosyst. Environ. 2016, 222, 125–132. [Google Scholar] [CrossRef]
  10. Barłóg, P.; Hlisnikovský, L.; Kunzová, E. Effect of digestate on soil organic carbon and plant-available nutrient content compared to cattle slurry and mineral fertilization. Agronomy 2020, 10, 379. [Google Scholar] [CrossRef] [Green Version]
  11. Yang, J.; Gao, W.; Ren, S. Long-term effects of combined application of chemical nitrogen with organic materials on crop yields, soil organic carbon and total nitrogen in fluvo-aquic soil. Soil Tillage Res. 2015, 151, 67–74. [Google Scholar] [CrossRef]
  12. Blair, N.; Faulkner, R.D.; Till, A.R.; Poulton, P.R. Long-term management impacts on soil C, N and physical fertility. Soil Tillage Res. 2006, 91, 30–38. [Google Scholar] [CrossRef]
  13. Banger, K.; Kukal, S.S.; Toor, G.; Sudhir, K.; Hanumanthraju, T.H. Impact of long-term additions of chemical fertilizers and farm yard manure on carbon and nitrogen sequestration under rice-cowpea cropping system in semi-arid tropics. Plant Soil 2009, 318, 27–35. [Google Scholar] [CrossRef]
  14. Jague, E.A.; Sommer, M.; Saby, N.P.; Cornelis, J.T.; van Wesemael, B.; van Oost, K. High resolution characterization of the soil organic carbon depth profile in a soil landscape affected by erosion. Soil Tillage Res. 2016, 156, 185–193. [Google Scholar] [CrossRef]
  15. Qaswar, M.; Jing, H.; Ahmed, W.; DongChu, L.; Shujun, L.; Lu, Z.; Huimin, Z. Yield sustainability, soil organic carbon sequestration and nutrients balance under long-term combined application of manure and inorganic fertilizers in acidic paddy soil. Soil Tillage Res. 2020, 198, 104569. [Google Scholar] [CrossRef]
  16. Liu, M.; Zhang, W.; Wang, X.; Wang, F.; Dong, W.; Hu, C.; Sun, R. Nitrogen leaching greatly impacts bacterial community and denitrifiers abundance in subsoil under long-term fertilization. Agric. Ecosyst. Environ. 2020, 294, 106885. [Google Scholar] [CrossRef]
  17. Johns, T.J.; Angove, M.J.; Wilkens, S. Measuring soil organic carbon: Which technique and where to from here? Soil Res. 2015, 53, 717–736. [Google Scholar] [CrossRef]
  18. Bisutti, I.; Hilke, I.; Raessler, M. Determination of total organic carbon—An overview of current methods. TrAC Trends Anal. Chem. 2004, 23, 716–726. [Google Scholar] [CrossRef]
  19. Ben-Dor, E.; Banin, A. Determination of organic matter content in arid-zone soils using a simple “loss-on-ignition” method. Commun. Soil Sci. Plant Anal. 1989, 20, 1675–1695. [Google Scholar] [CrossRef]
  20. Schwartz, V. Fractionated combustion analysis of carbon in forest soils—New possibilities for the analysis and characterization of different soils. Fresenius’ J. Anal. Chem. 1995, 351, 629–631. [Google Scholar] [CrossRef]
  21. Snyder, C.; Bruulsema, T.W.; Jensen, T.L.; Fixen, P.E. Review of greenhouse gas emissions from crop production systems and fertilizer management effects. Agric. Ecosyst. Environ. 2009, 133, 247–266. [Google Scholar] [CrossRef]
  22. N2O Emissions from Managed Soils, and CO2 Emissions from Lime and Urea Application. In Intergovernmental Panel on Climate Change Guidelines for National Greenhouse Gas Inventories; IPCC: Geneva, Switzerland, 2006; Volume 4, Available online: http://www.ipcc-nggip.iges.or.jp/public/2006gl/pdf/4_Volume4/V4_11_Ch11_N2O&CO2.pdf (accessed on 14 May 2020).
  23. International Fertilizer Industry Association and the Food and Agriculture Organization of the United Nations. Global Estimates of Gaseous Emissions of NH3, NO, and N2O from Agricultural Land; IFA/FAO: Rome, Italy, 2001; p. 106. Available online: http://www.fao.org/3/Y2780E/y2780e02.htm#P1_28 (accessed on 14 May 2020).
  24. Bouwman, A.F.; Boumans, L.J.M.; Batjes, N.H. Emissions of N2O and NO from fertilized fields: Summary of available measurement data. Glob. Biogeochem. Cycles 2002, 16, 1–6. [Google Scholar] [CrossRef]
  25. Perego, A.; Wu, L.; Gerosa, G.; Finco, A.; Chiazzese, M.; Amaducci, S. Field evaluation combined with modelling analysis to study fertilizer and tillage as factors affecting N2O emissions: A case study in the Po valley (Northern Italy). Agric. Ecosyst. Environ. 2016, 225, 72–85. [Google Scholar] [CrossRef]
  26. Rowlings, D.W.; Grace, P.R.; Scheer, C.; Kiese, R. Influence of nitrogen fertiliser application and timing on greenhouse gas emissions from a lychee (Litchi chinensis) orchard in humid subtropical Australia. Agric. Ecosyst. Environ. 2013, 179, 168–178. [Google Scholar] [CrossRef]
  27. Šarauskis, E.; Masilionytė, L.; Juknevičius, D.; Buragienė, S.; Kriaučiūnienė, Z. Energy use efficiency, GHG emissions, and cost-effectiveness of organic and sustainable fertilisation. Energy 2019, 172, 1151–1160. [Google Scholar] [CrossRef]
  28. Pratibha, G.; Srinivas, I.; Rao, K.V.; Raju, B.M.K.; Thyagaraj, C.R.; Korwar, G.R.; Srinivasarao, C. Impact of conservation agriculture practices on energy use efficiency and global warming potential in rainfed pigeonpea-castor systems. Eur. J. Agron. 2015, 66, 30–40. [Google Scholar] [CrossRef]
  29. Jat, H.S.; Jat, R.D.; Nanwal, R.K.; Lohan, S.K.; Yadav, A.K.; Poonia, T.; Jat, M.L. Energy use efficiency of crop residue management for sustainable energy and agriculture conservation in NW India. Renew. Energy 2020, 155, 1372–1382. [Google Scholar] [CrossRef]
  30. Unakıtan, G.; Aydın, B. A comparison of energy use efficiency and economic analysis of wheat and sunflower production in Turkey: A case study in Thrace Region. Energy 2018, 149, 279–285. [Google Scholar] [CrossRef]
  31. IUSS Working Group WRB. World Reference Base for Soil Resources 2014, Update 2015: International Soil Classification System for Naming Soils and Creating Legends for Soil Maps; World Soil Resources Reports FAO: Rome, Italy, 2015; Volume 106, p. 192. [Google Scholar]
  32. Mohammadi, A.; Rafiee, S.; Jafari, A.; Keyhani, A.; Mousavi-Avval, S.H.; Nonhebel, S. Energy use efficiency and greenhouse gas emissions of farming systems in north Iran. Renew. Sustain. Energy Rev. 2014, 30, 724–733. [Google Scholar] [CrossRef]
  33. Tabar, I.B.; Keyhani, A.; Rafiee, S. Energy balance in Iran’s agronomy (1990–2006). Renew. Sustain. Energy Rev. 2010, 14, 849–855. [Google Scholar] [CrossRef]
  34. Lin, H.C.; Huber, J.A.; Gerl, G.; Hülsbergen, K.J. Effects of changing farm management and farm structure on energy balance and energy-use efficiency—A case study of organic and conventional farming systems in southern Germany. Eur. J. Agron. 2017, 82, 242–253. [Google Scholar] [CrossRef]
  35. Tzilivakis, J.; Warner, D.J.; May, M.; Lewis, K.A.; Jaggard, K. An assessment of the energy inputs and greenhouse gas emissions in sugar beet (Beta vulgaris) production in the UK. Agric. Syst. 2005, 85, 101–119. [Google Scholar] [CrossRef] [Green Version]
  36. Tabatabaeefar, A.; Emamzadeh, H.; Varnamkhasti, M.G.; Rahimizadeh, R.; Karimi, M. Comparison of energy of tillage systems in wheat production. Energy 2009, 34, 41–45. [Google Scholar] [CrossRef]
  37. Ziaei, S.M.; Mazloumzadeh, S.M.; Jabbary, M. A comparison of energy use and productivity of wheat and barley (case study). J. Saudi Soc. Agric. Sci. 2015, 14, 19–25. [Google Scholar] [CrossRef] [Green Version]
  38. Reineke, H.; Stockfisch, N.; Märländer, B. Analysing the energy balances of sugar beet cultivation in commercial farms in Germany. Eur. J. Agron. 2013, 45, 27–38. [Google Scholar] [CrossRef]
  39. Kitani, O. Energy and biomass engineering. In CIGR Handbook of Agricultural Engineering Volume V; ASAE Publications: St. Joseph, MI, USA, 1999; p. 330. [Google Scholar]
  40. Ram, R.; Verma, A. Energy input, output and economic analysis in organic production of mango (Mangifera indica) cv. Dashehari. Indian J. Agric. Sci. 2015, 85, 827–832. [Google Scholar]
  41. Martin-Gorriz, B.; Soto-García, M.; Martínez-Alvarez, V. Energy and greenhouse-gas emissions in irrigated agriculture of SE (southeast) Spain. Effects of alternative water supply treatments. Energy 2014, 77, 478–488. [Google Scholar] [CrossRef]
  42. Pishgar-Komleh, S.H.; Omid, M.; Heidari, M.D. On the study of energy use and GHG (greenhouse gas) emissions in greenhouse cucumber production in Yazd province. Energy 2013, 59, 63–71. [Google Scholar] [CrossRef]
  43. Lal, R. Carbon emission from farm operations. Environ. Int. 2004, 30, 981–990. [Google Scholar] [CrossRef]
  44. Dyer, J.A.; Desjardins, R.L. Carbon dioxide emissions associated with the manufacturing of tractors and farm machinery in canada. Biosyst. Eng. 2006, 93, 107–118. [Google Scholar] [CrossRef]
  45. Gong, H.; Li, J.; Sun, M.; Xu, X.; Ouyang, Z. Lowering carbon footprint of wheat-maize cropping system in North China Plain: Through microbial fertilizer application with adaptive tillage. J. Clean. Prod. 2020, 268, 122255. [Google Scholar] [CrossRef]
  46. Biograce. Available online: https://www.biograce.net/content/ghgcalculationtools/standardvalues (accessed on 20 May 2020).
  47. Melillo, J.M.; Steudler, P.A.; Aber, J.D.; Newkirk, K.; Lux, H.; Bowles, F.P.; Morrisseau, S. Soil warming and carbon cycle feedbacks to the climate system. Science 2002, 298, 2173–2176. [Google Scholar] [CrossRef] [PubMed]
  48. Lefevre, R.; Barre, P.; Moyano, F.E.; Christensen, B.T.; Bardoux, G.; Eglin, T.; Chenu, C. Higher temperature sensitivity for stable than for labile soil organic carbon—Evidence from incubations of long-term bare fallow soils. Glob. Chang. Biol. 2014, 20, 633–640. [Google Scholar] [CrossRef] [PubMed]
  49. Hou, R.; Ouyang, Z.; Maxim, D.; Wilson, G.; Kuzyakov, Y. Lasting effect of soil warming on organic matter decomposition depends on tillage practices. Soil Biol. Biochem. 2016, 95, 243–249. [Google Scholar] [CrossRef]
  50. Artyszak, A.; Gozdowski, D. The effect of growth activators and plant growth-promoting rhizobacteria (PGPR) on the soil properties, root yield, and technological quality of sugar beet. Agronomy 2020, 10, 1262. [Google Scholar] [CrossRef]
  51. Tang, A.; Haruna, A.O.; Majid, N.M.A.; Jalloh, M.B. Effects of selected functional bacteria on maize growth and nutrient use efficiency. Microorganisms 2020, 8, 854. [Google Scholar] [CrossRef]
  52. Khoshnevisan, B.; Rafiee, S.; Omid, M.; Mousazadeh, H. Applying data envelopment analysis approach to improve energy efficiency and reduce GHG (greenhouse gas) emission of wheat production. Energy 2013, 58, 588–593. [Google Scholar] [CrossRef]
  53. Singh, P.; Singh, G.; Sodhi, G.P.S. Applying DEA optimization approach for energy auditing in wheat cultivation under rice-wheat and cotton-wheat cropping systems in north-western India. Energy 2019, 181, 18–28. [Google Scholar] [CrossRef]
  54. Canakci, M.; Topakci, M.; Akinci, I.; Özmerzi, A. Energy use pattern of some field crops and vegetable production: Case study for Antalya Region, Turkey. Energy Convers. Manag. 2005, 46, 655–666. [Google Scholar] [CrossRef]
  55. Yuan, S.; Peng, S.; Wang, D.; Man, J. Evaluation of the energy budget and energy use efficiency in wheat production under various crop management practices in China. Energy 2018, 160, 184–191. [Google Scholar] [CrossRef]
  56. Soni, P.; Taewichit, C.; Salokhe, V.M. Energy consumption and CO2 emissions in rainfed agricultural production systems of Northeast Thailand. Agric. Syst. 2013, 116, 25–36. [Google Scholar] [CrossRef]
  57. Khoshnevisan, B.; Rafiee, S.; Omid, M.; Yousefi, M.; Movahedi, M. Modeling of energy consumption and GHG (greenhouse gas) emissions in wheat production in Esfahan province of Iran using artificial neural networks. Energy 2013, 52, 333–338. [Google Scholar] [CrossRef]
  58. Singh, P.; Singh, G.; Sodhi, G.P.S. Energy and carbon footprints of wheat establishment following different rice residue management strategies vis-à-vis conventional tillage coupled with rice residue burning in north-western India. Energy 2020, 200, 117554. [Google Scholar] [CrossRef]
Figure 1. Schematic description of experimental treatments of cultivating winter wheat and winter oilseed rape in 2017–2019.
Sustainability 12 08246 g001
Figure 2. Meteorological conditions during the experiment (data from the Panevėžys Meteorological Station and the Joniškėlis Experimental Station. Long-term average of 50 years).
Sustainability 12 08246 g002
Figure 3. Changes in the SOC content at 0–10 cm depth between spring and autumn of every year. *ROEP—results over entire period (the change in the SOC content from the beginning to the end of the experimental period). The letters a and b indicate significant differences between the results of different treatments of same year results (p < 0.05).
Sustainability 12 08246 g003
Figure 4. Changes in the SOC content at 10–20 cm depth between spring and autumn of every year. *ROEP—results over entire period (the change in the SOC content from the beginning to the end of the experimental period). The letters a and b indicate significant differences between the results of different treatments of same year results (p < 0.05).
Sustainability 12 08246 g004
Figure 5. Winter wheat and winter oilseed rape yield in different treatments. The letters a and b indicate significant differences between the results of different treatments of same year results (p < 0.05).
Sustainability 12 08246 g005
Table 1. Energy equivalent of agricultural inputs and outputs.
Input/Output (Unit)Energy EquivalentReferences
Input
Human labor (MJ h−1)

1.96

[33]
Diesel fuel (MJ L−1)39.6[34,35]
Agricultural machinery (including self-propelled machines) (MJ h−1)357.2[36]
Wheat seed (MJ kg−1)14.7[37]
Oilseed rape (OSR) seed (MJ kg−1)20.1[36,37]
N fertilizer (MJ kg−1)40.0[38]
P fertilizer (MJ kg−1)15.8[38]
K fertilizer (MJ kg−1)9.3[38]
Herbicide (MJ kg−1)85.0[39]
Fungicide (MJ kg−1)295.0[39]
Insecticide (MJ kg−1)115.0[39]
Biopreparation (MJ kg−1)10.0[40]
Output
Wheat grain yield (MJ kg−1)
Oilseed rape yield (MJ kg−1)

14.48
14.70

[36]
[37]
Table 2. GHG emission equivalents of agricultural inputs.
Agricultural Input (Unit)Emission EquivalentReference
Machinery (kg CO2eq MJ−1)0.071[43,44]
Diesel fuel (kg CO2eq L−1)2.76[42]
N fertilizer (kg CO2eq kg−1)1.3[42,43]
P fertilizer (kg CO2eq kg−1)0.2[42,43]
K fertilizer (kg CO2eq kg−1)0.15[42,43]
S fertilizer (kg CO2eq kg−1)7.3[43]
Herbicide (kg CO2eq kg−1)6.3[32]
Fungicide (kg CO2eq kg−1)5.1[32]
Insecticide (kg CO2eq kg−1)3.9[32]
Biopreparation (kg CO2eq kg−1)4.3[45]
OSR seed (kg CO2eq kg−1)0.17[46]
Wheat seed (kg CO2eq kg−1)0.11[46]
Table 3. Changes in soil organic carbon (SOC) content in different treatments and at different depths.
TreatmentsDepth, cmSOC Content, %
201720182019
SpringAutumnSpringAutumnSpringAutumn
T10–102.002.031.782.161.641.93
10–201.841.931.892.121.731.92
T20–101.781.721.852.041.711.72
10–201.781.691.852.141.771.83
T3 (Control)0–102.122.062.032.312.032.15
10–202.142.002.042.251.981.99
Table 4. Energy efficiency indicators in different treatments.
YearTreatmentFertilizer MJ ha−1Total Energy Input MJ ha−1Total Energy Output MJ ha−1Energy Efficiency Ratio Energy Productivity kg MJ−1Specific Energy MJ kg−1Net Energy MJ ha−1
2017T110,50117,98377,2764.300.2923.4259,293
T213,12620,59179,0663.840.2613.8358,476
T313,12620,58664,1703.120.2124.7243,585
2018T112,36818,32593,7235.110.1875.3475,398
T215,46021,39994,5854.420.1626.1873,186
T315,46021,39488,0014.110.1516.6466,607
2019T111,25918,67190,4514.840.3303.0371,780
T214,07321,46892,6494.320.2943.4171,181
T314,07321,46383,0823.870.2633.8061,619
Table 5. GHG emissions in different winter wheat and winter oilseed rape cultivation treatments.
Greenhouse Gas Emissions kg CO2eq Mg−1
Year201720182019
TreatmentT1T2T3T1T2T3T1T2T3
Fuel 33.2232.4740.0059.3658.8263.2223.9223.3526.04
Agricultural machinery 13.4913.1816.2426.7226.4828.4612.9112.6014.06
Seed Wheat 10.6510.4112.83---9.108.899.91
Seed OSR ---0.640.630.68---
Herbicides 0.840.821.014.224.184.500.720.700.78
Insecticides 0.040.040.040.970.961.030.030.030.03
Fungicides 1.501.471.813.863.834.112.072.022.26
Biopreparations 1.880.400.002.880.620.001.610.340.00
Nitrogen 35.5343.4153.4964.9880.4886.5134.1441.6646.46
Phosphate 1.341.642.022.052.542.731.431.751.95
Potassium 1.321.621.992.032.512.700.000.000.00
Sulphur 49.3360.2674.25112.27139.06149.4722.7827.8031.00
Total fertilizers 89.40107.32131.74184.21225.22241.4059.9671.5579.41
Total input149.14165.71203.68279.98320.12343.40108.71119.14132.48

