Next Article in Journal
Interactive Game-Content-Based Storytelling for the Environment
Next Article in Special Issue
Correction: Prag, A.A.; Henriksen, C.B. Transition from Animal-Based to Plant-Based Food Production to Reduce Greenhouse Gas Emissions from Agriculture—The Case of Denmark. Sustainability 2020, 12, 8228
Previous Article in Journal
Efficient Structural Design of a Prefab Concrete Connection by Using Artificial Neural Networks
 
 
Correction published on 18 January 2021, see Sustainability 2021, 13(2), 944.
Article

Transition from Animal-Based to Plant-Based Food Production to Reduce Greenhouse Gas Emissions from Agriculture—The Case of Denmark

Department of Plant and Environmental Science, University of Copenhagen, Taastrup, 2630 Copenhagen, Denmark
*
Author to whom correspondence should be addressed.
Sustainability 2020, 12(19), 8228; https://doi.org/10.3390/su12198228
Submission received: 16 September 2020 / Revised: 1 October 2020 / Accepted: 4 October 2020 / Published: 6 October 2020
(This article belongs to the Special Issue Sustainable Food System Transition)

Abstract

:
Curbing emissions from agriculture, and especially from livestock production, is essential in order to fulfil the Paris Agreement. Shifting to a diet lower in meat consumption has been emphasized in several studies. Based on the Planetary Health Diet developed by the EAT-Lancet Commission, this study investigates the effect on agricultural greenhouse gas emissions of transitioning the Danish agricultural system, which currently relies mainly on meat and dairy production, towards increased focus on plant-based foods, combined with replacement or reduction of imported feed and carbon sequestration on previous agricultural land. The study finds a large potential for reducing emissions from Danish agriculture through implementation of the Planetary Health Diet, with reductions of up to 20.2 Mt CO2e (CO2 equivalents) (86.5%) under the most ambitious conditions. This demonstrates the potentially large benefits from transitioning towards a more plant-based European agricultural sector and underscores the need for European and national policies incentivizing this transition.

1. Introduction

Tackling the climate impact of agriculture is receiving increased attention, because achieving the goals of the Paris Agreement will not be possible without a substantial transformation of the global food system and the agricultural sector [1,2,3]. Currently, 21–37% of global greenhouse gas (GHG) emissions can be attributed to the food system [4]. Previous estimates have found that livestock alone accounts for about 14.5% of global GHG emissions when including emissions from ruminants, feed production, and land use change [5]. Numerous studies have argued for the need to reduce meat consumption and livestock production [2,6,7,8]. The European Green Deal, focusing on making the EU climate neutral by 2050 [9], features a Farm to Fork Strategy aimed at accelerating the transition to a sustainable food system and mitigating climate change [10]. In the communication and action plan for this strategy, a transition towards healthy, sustainable, and more plant-based diets is emphasized. Such a shift will require downscaling of livestock production, and there is a need for research to identify opportunities and barriers for the conversion of animal feed production to plant-based food production. In Denmark, the agricultural sector is responsible for about 23% of national emissions, with production of cattle and pigs being the dominant source [11]. The Danish government has pledged to reduce national emissions by 70% in 2030 relative to 1990 levels [12], corresponding to a reduction from the current 51.3 Mt CO2e (2018) [11] to 21.8 Mt CO2e. In a recent report the Danish Climate Partnership for the Food and Agriculture Sector suggests that a reduction of 5.1 Mt CO2e by 2030 is possible through already known measures, with an additional 2.5 Mt CO2e from forestry, food processing, and food waste, and 2.2 Mt CO2e through research and development of new technologies. These potential reductions come at an estimated cost of €3.43 billion [13]. Measures to facilitate a shift towards more plant-based food production are not included, but different options for promoting plant-based food are mentioned. The agricultural sector has expressed readiness to meet an increasing demand for more plant-based food [14,15], already evident in both Denmark and Europe [16,17,18,19]. Additionally, the National Danish Council on Climate Change advising the Danish Government considers a transition towards a more plant-based food production system vital for achieving the national climate target and achieving a sustainable Danish food system [20,21]. A starting point for such a transition could potentially be the Planetary Health Diet (PHD) suggested by the EAT-Lancet Commission [1]. The PHD is primarily plant-based and features dietary recommendations that contribute to keeping global warming below 2 °C and promote human health. It thereby exploits the significant health and climate co-benefits of plant-based food on human health and climate change mitigation documented in several studies [1,22,
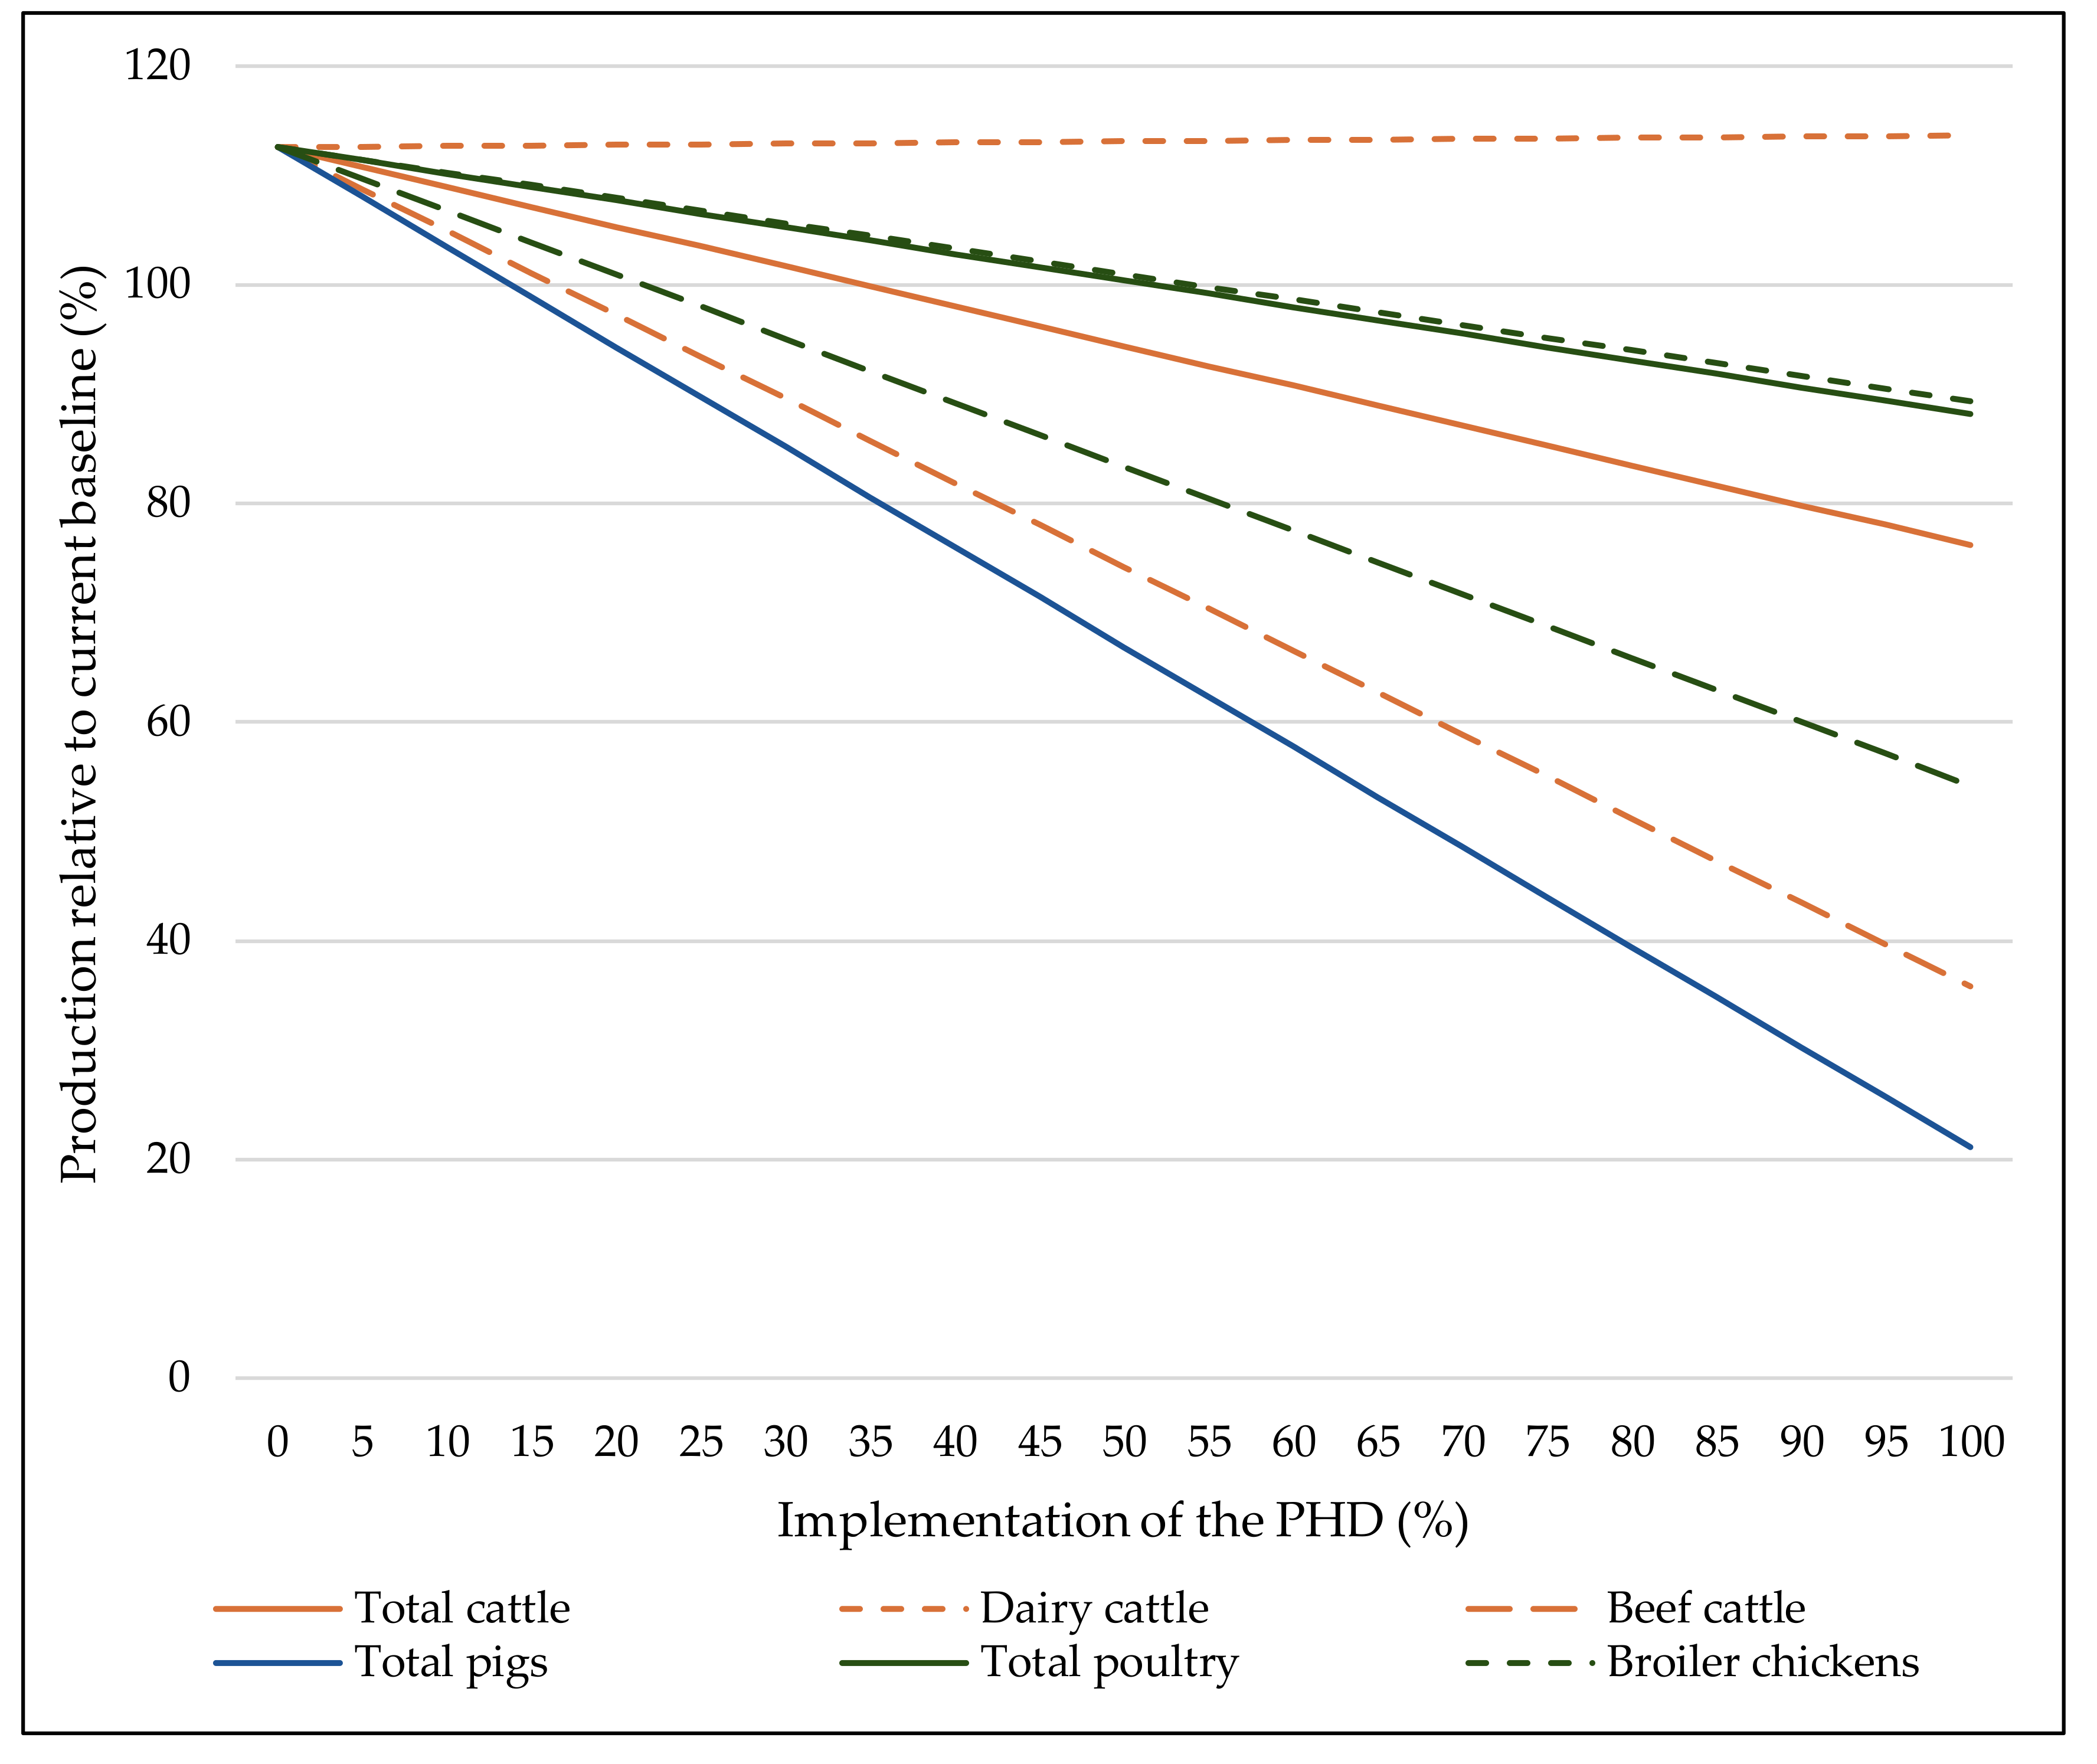
23]. Taking departure from the current baseline agricultural GHG emissions, the aim of this study is to analyze the potential for reducing the climate impact of Danish agriculture. The study develops transition scenarios for a sustainable conversion from animal-based to plant-based food production, associated with a projected increasing global implementation of the PHD. Based on this analysis it can be concluded that there is significant potential for reducing the GHG emissions from agriculture by transitioning from being primarily based on livestock and animal feed production, towards focusing on providing more plant-based food for human consumption. In the case of Denmark, emission reductions in the range of 13.6–20.2 Mt CO2e (58.2–86.5%) will be possible with full global implementation of the PHD in a scenario where domestic cattle, pig, and chicken production is downscaled to 76.2%, 21.1%, and 88.2% of current production.

2. Methods

2.1. Assessment of Baseline Agricultural GHG Emissions

Emission sources included in this study were: all direct agricultural emissions and indirect emissions from LULUCF (land use, land use change and forestry) (scope 1), emissions from energy use in the agricultural sector (scope 2), as well as LULUCF emissions from the production of imported soy (scope 3). Scope 3 emissions from the import of soy for feed have been included because they contribute significantly to the overall emissions from the agricultural sector. Scope 1 and scope 2 emissions were sourced from the most recent National Inventory report for Denmark [11]. Emissions from 2018 were used. Emissions from energy use in agriculture and forestry were grouped in the national inventory. The distribution calculated by the agricultural sector’s climate partnership [13] was used to exclude forestry-related emissions from the total. Data on scope 3 emissions from soy imported to Denmark as feed for livestock were sourced from a recent report estimating that total emissions amount to 6.18 Mt CO2e, based on imports of approximately 1.7 Mt soy (2018). This includes emissions due to land use change, mainly afforestation in South America, as well as emissions directly from production of the crop [24]. Total baseline emissions were thus estimated as 23.33 Mt CO2e, including scope 1 emissions from agricultural production (11.04 Mt CO2e), scope 1 LULUCF emissions from organic soils (5.10 Mt CO2e), scope 2 emissions from energy use in agriculture (1.01 Mt CO2e), and scope 3 LULUCF emissions from production of soy imported to Denmark (6.18 Mt CO2e).

2.2. Construction of Transition Scenarios

To determine the potential for reducing the GHG emissions from Danish agriculture by shifting towards more plant-based food production for human consumption, different transition scenarios have been constructed. The scenarios feature the following levels: (i) level of global implementation of the PHD recommended by the EAT-Lancet Commission (0–100%), (ii) level of imported soy replaced by locally produced protein crops (0%, 50%, or 100%), (iii) level of restoration of drained organic soils (0–100%), and iv) level and type of afforestation on surplus agricultural land (area and sequestration potential).

2.3. Implementation of the Planetary Health Diet

Since its publication in 2019 the EAT-Lancet report has already had a big impact on food policies, and is explicitly mentioned in the recent Good Food Cities declaration signed by 14 mayors [25]. In a Danish context, the diet has been found to be nutritionally sound, showing a potential direction for development of sustainable dietary guidelines [26]. The diet sets recommended boundaries for food groups important for human health and the level of sustainability of food systems. In this study the PHD is used as a blueprint. Production is adjusted based on average consumption levels of different food groups recommended in the PHD. It is assumed that the transition to the PHD will be global for two reasons: (i) The PHD is constructed as a global diet. If consumption of individual food groups is kept within the boundaries of the PHD, it is ensured that a healthy diet will be available to everyone without overstepping the planetary boundaries. If a large part of the global population maintains its current diet high in animal products, a sustainable level for animal production will not be reached [1]; (ii) It is necessary to assume a global transition in order to avoid leakage of production-related emissions. The risk of leakage in the Danish agricultural sector is considered high [27], meaning that there is significant risk that production will shift to other countries if a transition only occurs in Denmark. The effect on Danish agriculture and its emissions will be assessed for implementation levels of the PHD up to 100%. The average consumption levels of individual food groups presented in the diet will be used for calculations.

2.4. Assumptions and Calculations for Animal Commodities

Denmark’s annual livestock production was assessed using data on the number of slaughters per year for production animals with a lifespan shorter than one year (such as pigs), and statistics on the average population of animals with a lifespan longer than one year (such as dairy cows) (Table 1). Based on the necessary supply required to meet the demand by 2030, assuming a global shift in diets to adhere to the PHD, production of animal commodities and the resulting animal population were adjusted (Table 1). In order to include export in a way feasible within the scope of this study, the calculated future Danish animal production was based directly on its current size relative to global production. Denmark will continue to produce its current fraction of global supply, and production will therefore decrease with global adoption of the PHD. Production levels were calculated for implementation of the PHD between 0% and 100%, with a simple projection of current production as the lower boundary (0% implementation by 2030) (Table 2). The projection accounts for an expected increase in population [28].
Due to the expected increase in global population, this method for calculating Denmark’s future production will in some cases lead to an increase in production of commodities presently produced at levels close to the amounts needed for 100% implementation of the PHD. Larger amounts of dairy, in particular, will be needed with the increasing global population, even when implementing the PHD, because the current global production is lower than what will be needed if the entire global population by 2030 consumes the average amount of dairy recommended in the PHD (Table 2). It was assumed that the size of the animal population, and its feed consumption, is directly related to the level of production. The number of animals and the amount of feed consumed was thus adjusted with the same percentage as the production, expecting no changes in the animals themselves with regards to feed efficiency, size, or edible fraction of the animal. See supplementary Table S1 for a list of animal commodities included in the analysis.

2.5. Assumptions and Calculations for Production of Vegetable Commodities

Calculations of the impact on GHG emissions of an adjusted production of both vegetables for human consumption and animal feed essentially come down to changes in the total agricultural area and its use. The estimate used for the total area affected by implementation of the transition scenarios was 2,055,801 ha (Table 3).

2.5.1. Vegetable Production for Human Consumption

The necessary Danish supply of vegetable foods, assuming global adoption of the PHD, was calculated (Table 4). Calculations for vegetable production were based on other assumptions than animal production, due to the different roles these main food groups play in the Danish agricultural sector. A large proportion of animal production is exported, while the reverse is true for fruits and vegetables. For vegetable commodities the Danish expected population increase was used for the projections, rather than the global expected population increase. Additionally, starchy crops (potatoes) and grains are both grown for human consumption and to a large degree for animal feed. Therefore, separate methodological choices were made for the individual groups of vegetable commodities: (i) For grains and starchy vegetables the point of departure was the current Danish total consumption, based on a study of dietary habits [38]. It was assumed that the total consumption is or can be produced in Denmark; (ii) For fruits, vegetables, and nuts the basis was in current production plus import, as it was assumed that all produced and imported fruits, vegetables, and nuts are for human consumption; (iii) For legumes, the production data used included only peas for human consumption, as it was assumed that the modest Danish production of other legumes (such as broad beans) is for animal feed; iv) No changes were made regarding consumption (and therefore production, export, or import) of added fats and added sweeteners, as the current global consumption does not differ much from the total allowed amount in the PHD. Adjustments in production were assumed to translate directly into adjustments in land use, i.e., a reduction or increase in production of a crop directly affects the amount of land used. No changes in yield or production practices were assumed. See supplementary Table S2 for a list of vegetable products included in the analysis.

2.5.2. Vegetable Production for Animal Feed

Crops for animal feed included in this study were grains, pulses, root vegetables, and roughage (Table 5). Roughage includes grass, fresh and silage, as well as maize silage. Pulses, which are used in the form of oil cake and meal, are mainly imported soy. The available data on the distribution of feed between animal species do not specify other individual feed ingredients besides grain, roughage, and imported feed, which is mainly soy, so assumptions were made about root vegetables, rape seed, and pulses.
Animals were grouped into three main categories: cattle, pigs, and poultry. The study therefore did not take into account the different feed consumption of, e.g., dairy cows and beef cattle. This generalization was necessary due to the lack of detail in available data on feed consumption, which included the animal categories cattle, pigs, and poultry, along with the crop categories grains, roughage, other crops, and imported crops [44]. Sheep were grouped together with cattle based on the fact that beef and mutton are considered one single dietary component in the PHD. The following methods were used for calculating the effect on production and use of agricultural area of different crops for animal feed: (i) for grains, data were available on both production and consumption by individual animal species, making it possible to calculate the effect of a decrease in the number of different livestock species; (ii) for roughage, the entire harvest is used for cattle; (iii) for rape seed and root vegetables, it is known how large a fraction is used for animal feed but not on a species level, therefore the distribution between species for “other crops” was used; (iv) for pulses it was assumed that the small amount (other than peas for human consumption) is used for feed production. For pulses the distribution for “other crops” was used; v) for imported soy, the distribution between species in the “imported feed” category was used, since this category is also almost entirely soy [42]. It is theoretically possible to completely replace soy in the diet of both cattle and pigs with other pulses, such as broad beans or peas. In the following the possibility of replacing some or all imported soy with broad beans is described.

2.5.3. Replacing or Reducing Imported Soy in Animal Diets

The protein content of soy is significantly higher than that of broad beans and the carbohydrate content lower. Broad beans thus also replace some of the grain in the diet when they are substituted for soy. Various studies have found that broad beans can replace a substantial part of the soy in pig as well as cattle diets [45,46,47]. In this study, the calculation of substitution of soy with broad beans and its effect on grain use was based solely on a feeding plan for pigs, as they consume the majority of soy imported to Denmark. Calculation of replacement was based on the nutritional content of soy, broad beans, and wheat, combined with a standard Danish feeding plan for a finisher pig (Table 6).
The conditions used for further calculations were 0%, 50%, and 100% replacement of soy with broad beans. Danish yield averages specifically for broad beans were not available, as they are sorted within legumes in general in statistics. The average yield for 2017 of 5.5 t/ha [49] was used to estimate the necessary additional agricultural area for broad beans. Replacement of grain from the diet by the introduction of broad beans was based on the nutritional content of wheat. It is recognized that replacing all of imported soy with just one crop is not likely. In reality, if and when this replacement is undertaken, it will most likely be with a combination of multiple crops [50].

2.6. Options for Utilization of Surplus Agricultural Area

As the production of animal products and therefore the production of feed decreases, areas are freed up for other purposes. The size of the surplus area is affected by the implementation level of the PHD and of the level of replacement of imported soy. Increasing implementation of the PHD results in a decreasing area used for feed production, while replacing an increasing amount of imported soy with locally produced protein crops (broad beans) results in an increasing area used for feed production. Options included for utilization of the surplus area are restoration of drained organic soils and afforestation. See supplementary Table S3 for land use in all scenarios.

2.6.1. Restoration of Drained Organic Soils

Cultivation of the current 178,700 ha with organic soils is the source of 5.1 Mt CO2e according to the most recent National Inventory report for Denmark [11]. Ceasing cultivation of the areas will therefore contribute significantly to reducing emissions from Danish agriculture. The approach is included in the sector’s current strategy [13]. When cultivation is ceased and the drained areas are restored to wetlands, the emissions of methane increase, offsetting some of the reduction in CO2 emissions [51]. Based on calculations of the net effect on emissions of this land use change [51], it has been estimated that restoring the entire area of drained organic soils can result in net reductions of approximately 3.7 Mt CO2e in scope 1 LULUCF emissions (Table 7).

2.6.2. Afforestation of Surplus Agricultural Land

Forests can sequester large amounts of carbon in biomass and soil, making afforestation relevant as a land use option for mitigating climate change [52,53]. In this study it was assumed that drained organic soils will be restored before any land is afforested. Afforestation will begin when the total surplus area is larger than 178,700 ha. Three estimates for the mitigating effect of afforestation per ha in a 10-year period under Danish conditions were used, representing a high (11.0 t CO2e ha−1), medium (5.3 t CO2e ha−1), and low (2.5 t CO2e ha−1) sequestration forest. The low estimate represented the average effect of afforestation with various deciduous trees, the high estimate was an average of afforestation with fast-growing cultures, such as spruce or poplar, and the medium estimate was the average of both types of afforestation [54]. The effect of afforestation through natural succession was not included.

2.7. Calculation of Reduction in GHG Emissions from Agriculture

An estimated distribution of baseline agricultural emissions between individual animal species and emissions from arable land was used to assess the effect of a change in production (Table 8).
Baseline emissions were projected to 2030, taking into account effects of an increasing population. Reductions from implementing the transition to more plant-based food production for human consumption were calculated from the resulting 2030 baseline. Percent reductions were calculated relative to the current baseline. It was assumed that emissions from animals will be reduced with the same percentage as the reduction in the animal population. Emissions per individual animal are thus not expected to change. The data on which the baseline distribution was based included the animal groups “cattle”, “pigs”, and “other” [55], while the PHD diet includes “cattle”, “pig”, and “poultry” [1]. The overall group “other” was used for calculating the reduction related to the development in the poultry population. Emissions from fertilization of cropland were assumed to be reduced by the same percentage as the overall area of cropland. It was not possible to take into account that different types of vegetable production can give rise to different levels of emissions. Calculations of reductions were simply based on the reduction in total area cultivated. Possible changes in average emissions per ha due to changes in agricultural practices were not included in the scenarios.

2.8. Economic Implications of the Transition

The economic implications of implementing the transition scenarios were estimated by applying a simplified but rigorous and standardized approach, to be achievable within the scope of this study. Contribution margins for different sub-sectors within agriculture were used to assess the effect of decreasing some forms of production, while increasing others. The contribution margin used was defined as: production value subtracted variable expenses and semi-variable expenses but including non-variable expenses. It does not account for income from agricultural subsidies. For details on contribution margins used for individual commodities, see supplementary Table S4 [56,57]. Based on these data, a current total contribution margin for the selected sub-sectors was calculated and was adjusted to the change in production. There were significant uncertainties with regards to applying this method for calculating the economic effect of the transition. These were: (i) data from only one year were available for calculating yield and contribution margin of broad beans, and it conveniently appeared to be the absolute most profitable crop based on these margins. There is thus a risk that the revenue generated from the increased area with broad beans was overestimated; (ii) the scope of this study did not allow for accounting for other economic effects a transition to a reduction of soy import could cause, such as possible price and yield changes in crops; (iii) a number of additional expenses related to the transition itself can be imagined, such as expenses related to changes in buildings and machinery, additional education for farmers, and other single investments that have to be made in the transition period. These were not included. However, just as there are additional expenses, there is also potential for additional savings. The Danish import of soy is currently (2019) valued at €546.8 million [58], so replacing this with locally produced protein crops could result in significant savings for the sector. These were not included in the calculation.

3. Results

3.1. Downscaling of Livestock Production

The Danish production of livestock is downscaled corresponding to the reduced consumption of animal products from implementing the PHD (Figure 1). As previously mentioned, the total dairy allowance in the PHD is in fact larger than the current global per capita production, so 100% implementation of the PHD will result in a small increase in the dairy cattle population. The total cattle population will, however, be reduced (76.2% of current baseline) due to large reductions in the beef cattle population (35.8% of current baseline). Total poultry production will be reduced to 88.2% of current baseline, with broiler chicken production reduced to 89.4% and the egg-laying hen population reduced to 54.2% of current baseline. Correspondingly, pig production is reduced to 21.1% of current baseline production with 100% implementation of the PHD.

3.2. Reduction in GHG Emissions

The reduction in emissions possible through adoption of the transition scenarios depends to a large degree on four main parameters previously described: (i) level of implementation of the PHD, (ii) level of replacement of imported soy, (iii) restoration of drained organic soils, and (iv) estimate used for the carbon sequestration per ha of afforested area (Figure 2).
Figure 3 shows implementation of the PHD combined with different estimates of sequestration per ha afforested area and levels of soy replacement. Evidently the largest reduction is possible from a high level of implementation, combined with a high level of soy replacement (50% or 100%) and surplus agricultural areas afforested with fast-growing species (high estimate for afforestation). Under these very optimistic conditions, emissions can be as low as 3.16 Mt CO2e by 2030. However, at implementation levels of about 25–50% the picture less clear, showing how important it is to the total effect on emissions that surplus land becomes available for carbon sequestration. Potential agricultural emissions by 2030 are 3.16–9.75 Mt CO2e (13.5–41.8% of current baseline) at 100% implementation of the PHD, depending on assumptions used for soy replacement and afforestation.

3.2.1. Effect on Emissions of Replacing Imported Soy

In general, emissions appear higher than the current baseline of 23.33 Mt CO2e at low implementation levels with no soy replaced (Figure 3). At 0% PHD implementation, the setting where no soy is replaced, is a business-as-usual projection of the current baseline to 2030. It assumes that the expected increase in population will lead to a corresponding increase in animal production, if the PHD is not implemented. At lower levels of implementation (approximately 25–50%), emissions are reduced more per incremental increase in implementation of the diet under conditions where 0% or 50% of imported soy is replaced than when 100% of soy is replaced. This is caused by the significant drop in emissions occurring when surplus agricultural land becomes available for alternative uses that sequester carbon. Replacing imported soy with locally produced protein sources means that higher levels of implementation of the PHD, and the resulting larger reduction in animal production, are necessary to free up areas for other uses.

3.2.2. Effect on GHG Emissions of Types of Afforestation

Expected emissions at different implementation levels are also dependent on the estimate used for how much carbon can be sequestered per ha through afforestation. With 50% of imported soy replaced the high afforestation estimate leads to a reduction of 86.5%, whereas if assuming a low effect of afforestation the estimated reduction is 66.0% (Figure 3). Using different estimates for the sequestration potential of the afforested area is only significant at higher levels of implementation, as surplus area will first be used to restore drained organic agricultural soils. Thus, only when all 178,700 ha have been restored will afforestation begin (Figure 4). Afforestation starts contributing to reductions at 30–55% implementation of the PHD, depending on the level of replacement of imported soy. At 50% soy replacement, surplus land becomes available at about 35% implementation of the diet (Figure 4). Until then it appears that more land will be needed, due to the assumption in the scenarios that agricultural production will increase if the PHD is not implemented, corresponding to the increasing global and Danish populations.

3.3. Economic Implications

Economic impacts on the agricultural sector of implementing the PHD were calculated under all three levels of soy replacement (Figure 5). At low levels of implementation there is a net gain as vegetable production has been scaled up to fit the expected increase in population, and because revenue is generated from the local production of broad beans. At all levels of implementation of the PHD the highest contribution margin was found under the condition that soy is 100% replaced, due to the income from broad beans. There are important uncertainties with regards to this result, mainly due to the fact that the broad bean crop appears to be very profitable in the available statistical data on contribution margins, to which the crop has only recently been added. However, even if the profitability of broad beans is exaggerated due to the limitations of the data, import of soy is currently a significant expense for the sector, so replacing it with local protein sources is likely to result in savings. As the Danish import of soy is currently valued at €546.8 million [58], reductions in this import would mean significant savings for the sector. Even when considering the economic uncertainties with regards to this replacement and the overall implementation of the transition, it appears likely that some of the cost of a high implementation level of the PHD can be offset through savings on reduced import of soy.

4. Discussion

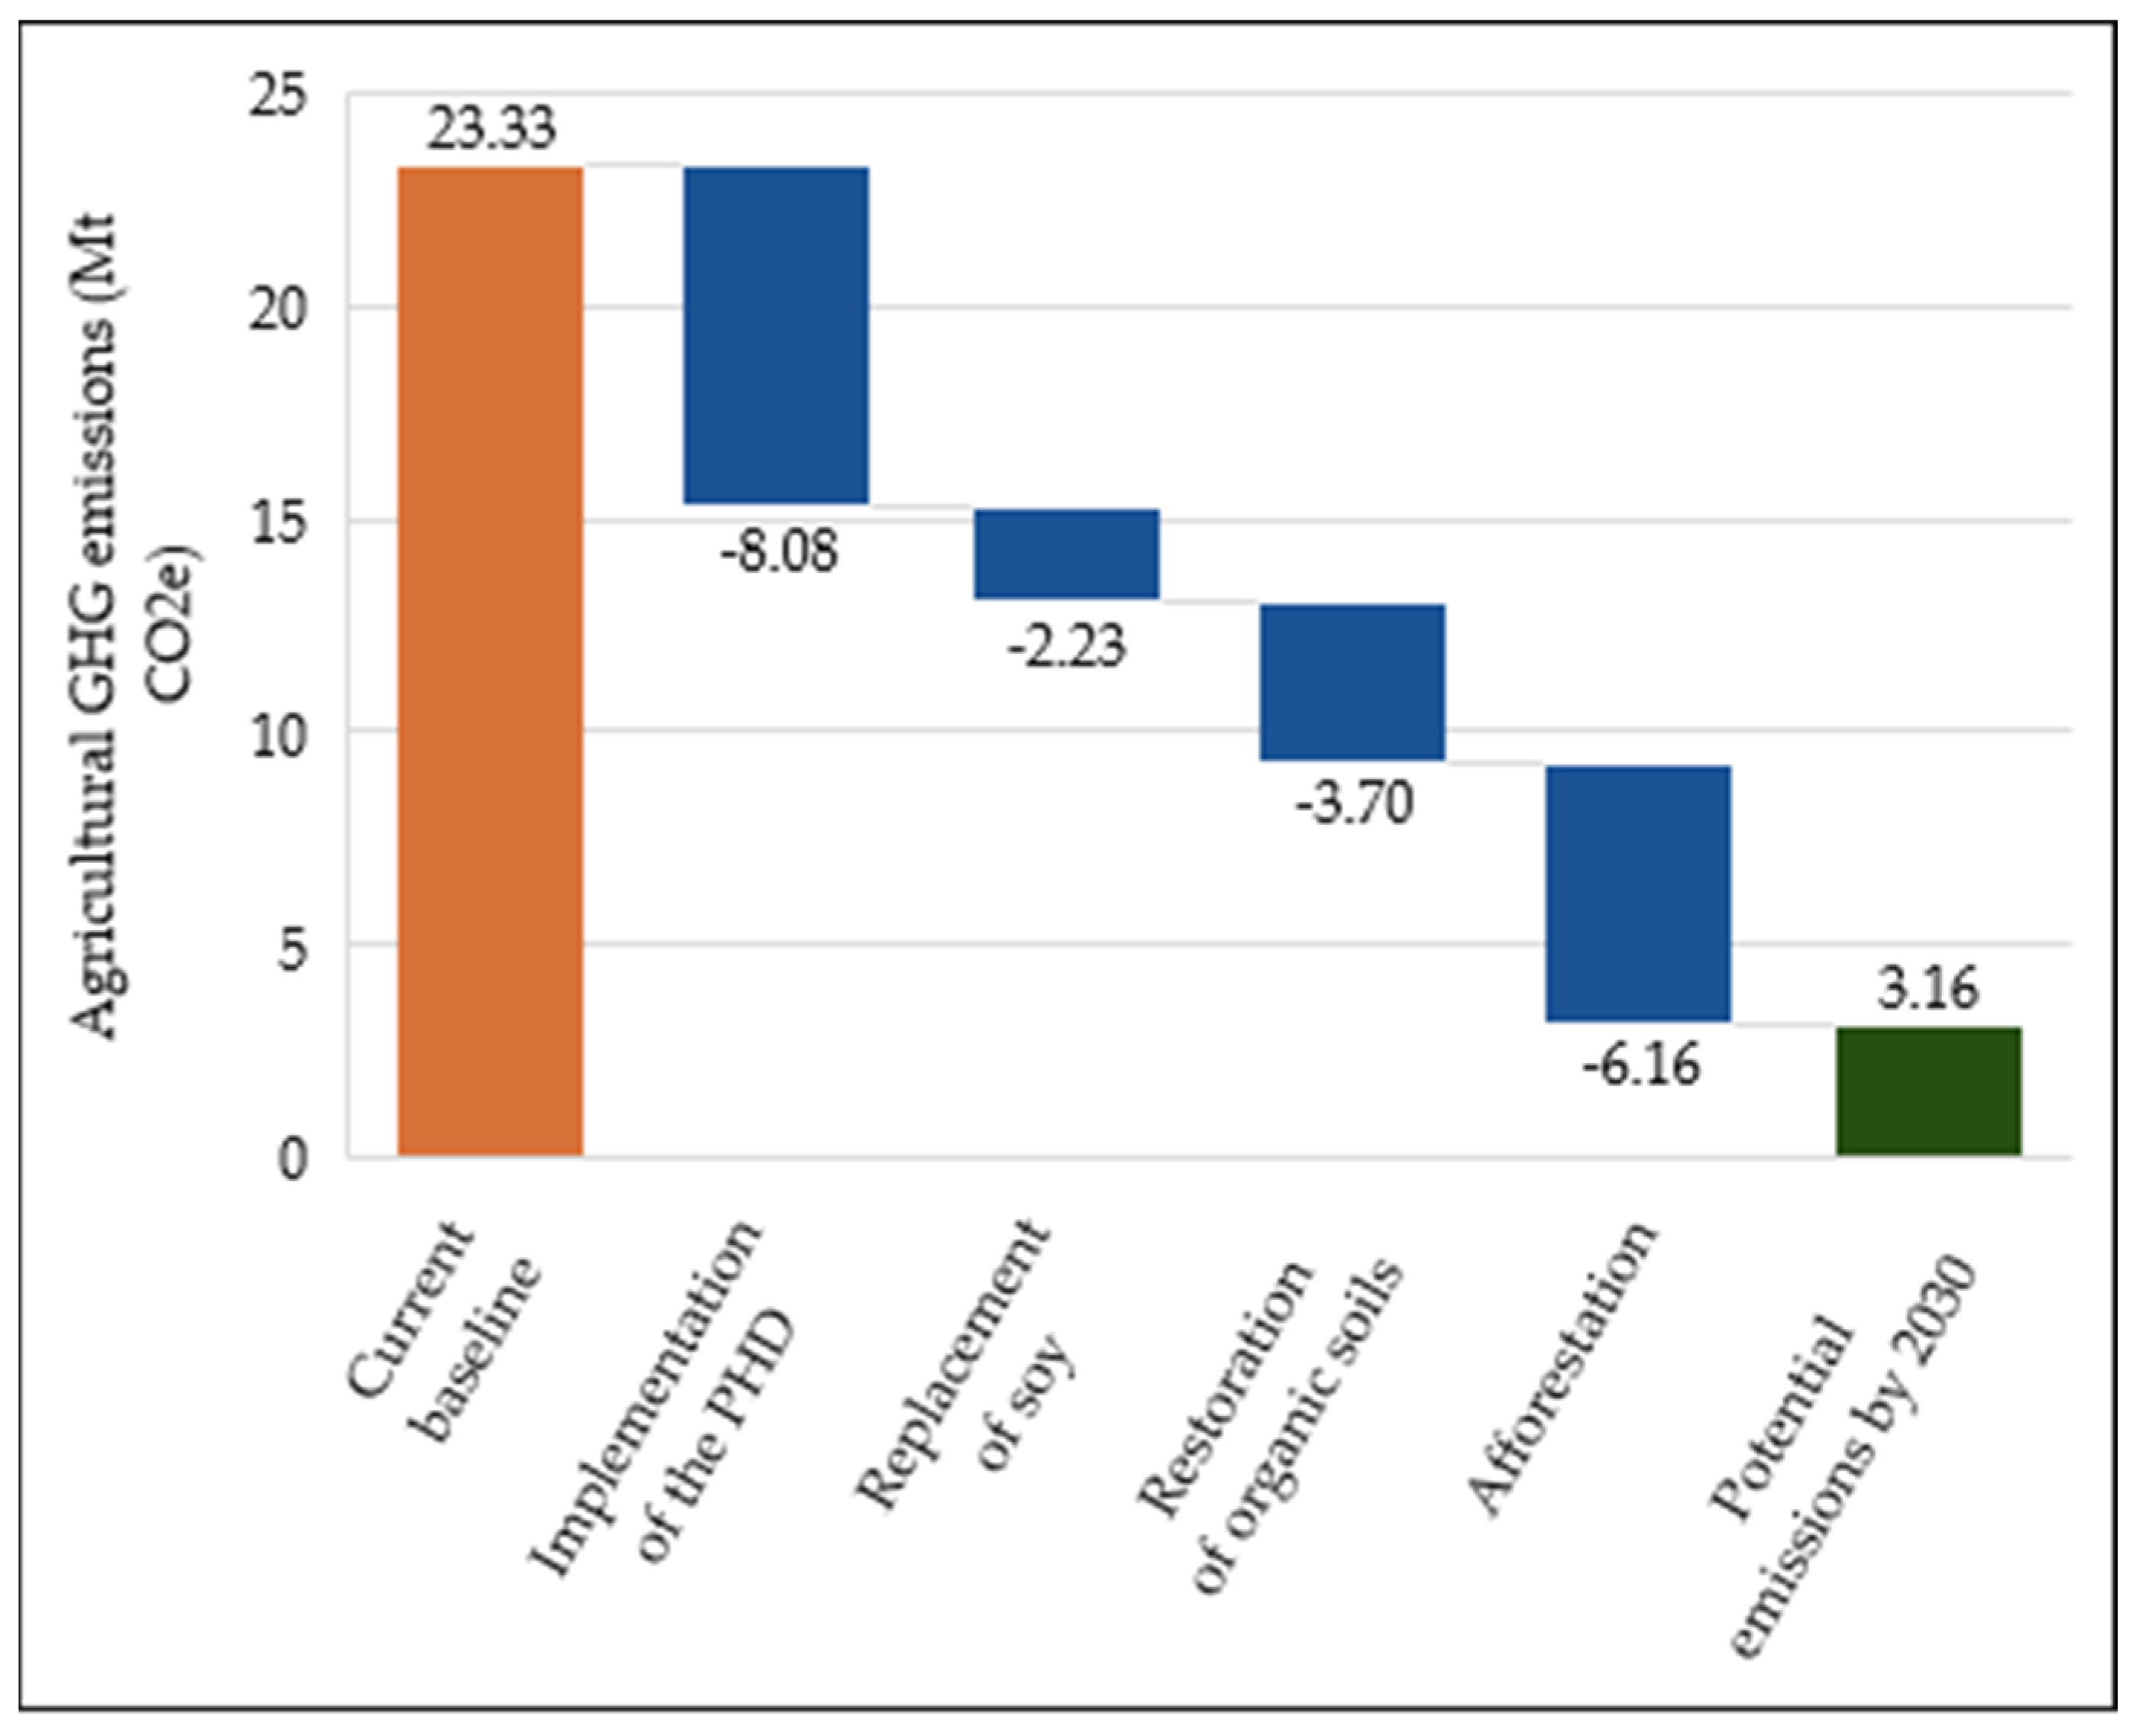
This study has shown that a 100% implementation of the PHD results in emissions reductions of 13.6–20.2 Mt CO2e for Danish agriculture, corresponding to 58.2–86.5%, depending on the assumptions made for replacement of imported soy, restoration of drained organic soils, and afforestation. Reductions on par with those currently pursued by the sector (9.8 Mt CO2e) are achievable through a 55% implementation of the PHD, assuming a 50% reduction in soy imports and a medium effect of afforestation. A PHD implementation level of 40% by 2030 has previously been presented as a realistic target [59]. In the present study this would result in reductions of 5.8–6.6 Mt CO2e depending on assumptions, which corresponds to 24.7–28.2% relative to the current baseline. Thus, it is evident that there is much to gain from being more ambitious. The importance of utilization of the surplus agricultural area is also apparent, especially at high implementation levels where more land is available. Afforestation of the total surplus area with fast growing spruce (high estimate for effect of afforestation) is perhaps not the most realistic outcome. Using a medium estimate for the effect of afforestation, baseline emissions can be halved through 65–70% implementation of the PHD and 50% reduction in import of soy. If no soy is assumed to be replaced and a low estimate for afforestation is used, baseline emissions are halved at 85% implementation of the PHD. Due to the specific factors included in this study with regard to land use change and soy imports, as well as the specific focus on Denmark as a case study, it is difficult to compare results directly to other studies. However, previous studies have found similar reductions in GHG emissions on a global scale from the implementation of various diets, including reduced meat consumption and lower livestock production. Findings from these studies include a reduction in emissions of 56% from shifting to a flexitarian diet [2], 49% from shifting to a vegetarian diet [7], and 29–70% from several different diet scenarios that include a reduced intake of meat [22]. One LCA study done in a Danish context found reductions of 14–44% from shifting to vegetarian and vegan diets [21]. These studies add to the results showing significant potential for lowering emissions through a reduction in meat production.
A transformation of the entire food production system of a country with a strong agricultural sector like Denmark could be viewed as a pipe dream, an unattainable and unrealistic goal for a country whose agricultural production is based on public demand for large amounts of animal products. However, there is no arguing with the fact that a change is necessary [1,2,3]. Consumers are already displaying an increasing interest in and demand for plant-based food commodities [17,18,19,59], and recently it has been suggested that research focusing on the transition to an increasingly plant-based agricultural sector should be prioritized over further research into improvements in animal agriculture [60]. Furthermore, the agricultural sector itself has expressed interest in moving towards more focus on plant-based foods to meet an increasing demand from consumers [14,15]. It can also be argued that a transition from animal-based to plant-based food production is actually not more complicated or inaccessible than the approaches currently planned by the sector. Reduction of 9.8 Mt CO2e across the entire agriculture and food sector is the current goal, to be achieved through various adjustments to practices and technologies [13]. These include an expected reduction of 2.2 Mt CO2e from future technologies, featuring a method for producing jet fuel and biochar from agricultural by-products, biorefinery of grass, biofilters, and methane-reducing feed additives for cattle. Aspects of the sector’s current recommendations for climate mitigation measures carry the risk of technological and financial lock-ins, resulting in less sustainable overall development. This phenomenon has previously been described for various agricultural development pathways, e.g., agricultural policies that hinder crop diversification and technologies that necessitate pesticide use by smallholder farmers [61,62,63,64]. In particular, the current recommendation for large investments in biorefinery of perennial grass to replace soy as feed for pigs coupled with investments in biogas plants requiring degassed pig slurry, should be critically reviewed. It may become a barrier for a more sustainable long-term solution featuring a transition to more plant-based food production for human consumption. The transition scenarios presented here require large-scale transformations at every level, from policymaking down to the individual farmer. However, at its core the transition is quite simple: reduce the animal population and replace some of the production of animal feed with production of food crops for human consumption. Additionally, it is possible to combine the measures in the present scenarios with some of the technological measures already planned by the sector, e.g., use of methane-reducing feed additives and nitrification inhibitors in fertilizer or changed slurry handling practices and technology [13]. Combining these measures would reduce emissions further and could potentially lead to net zero emissions, or even net negative emissions.
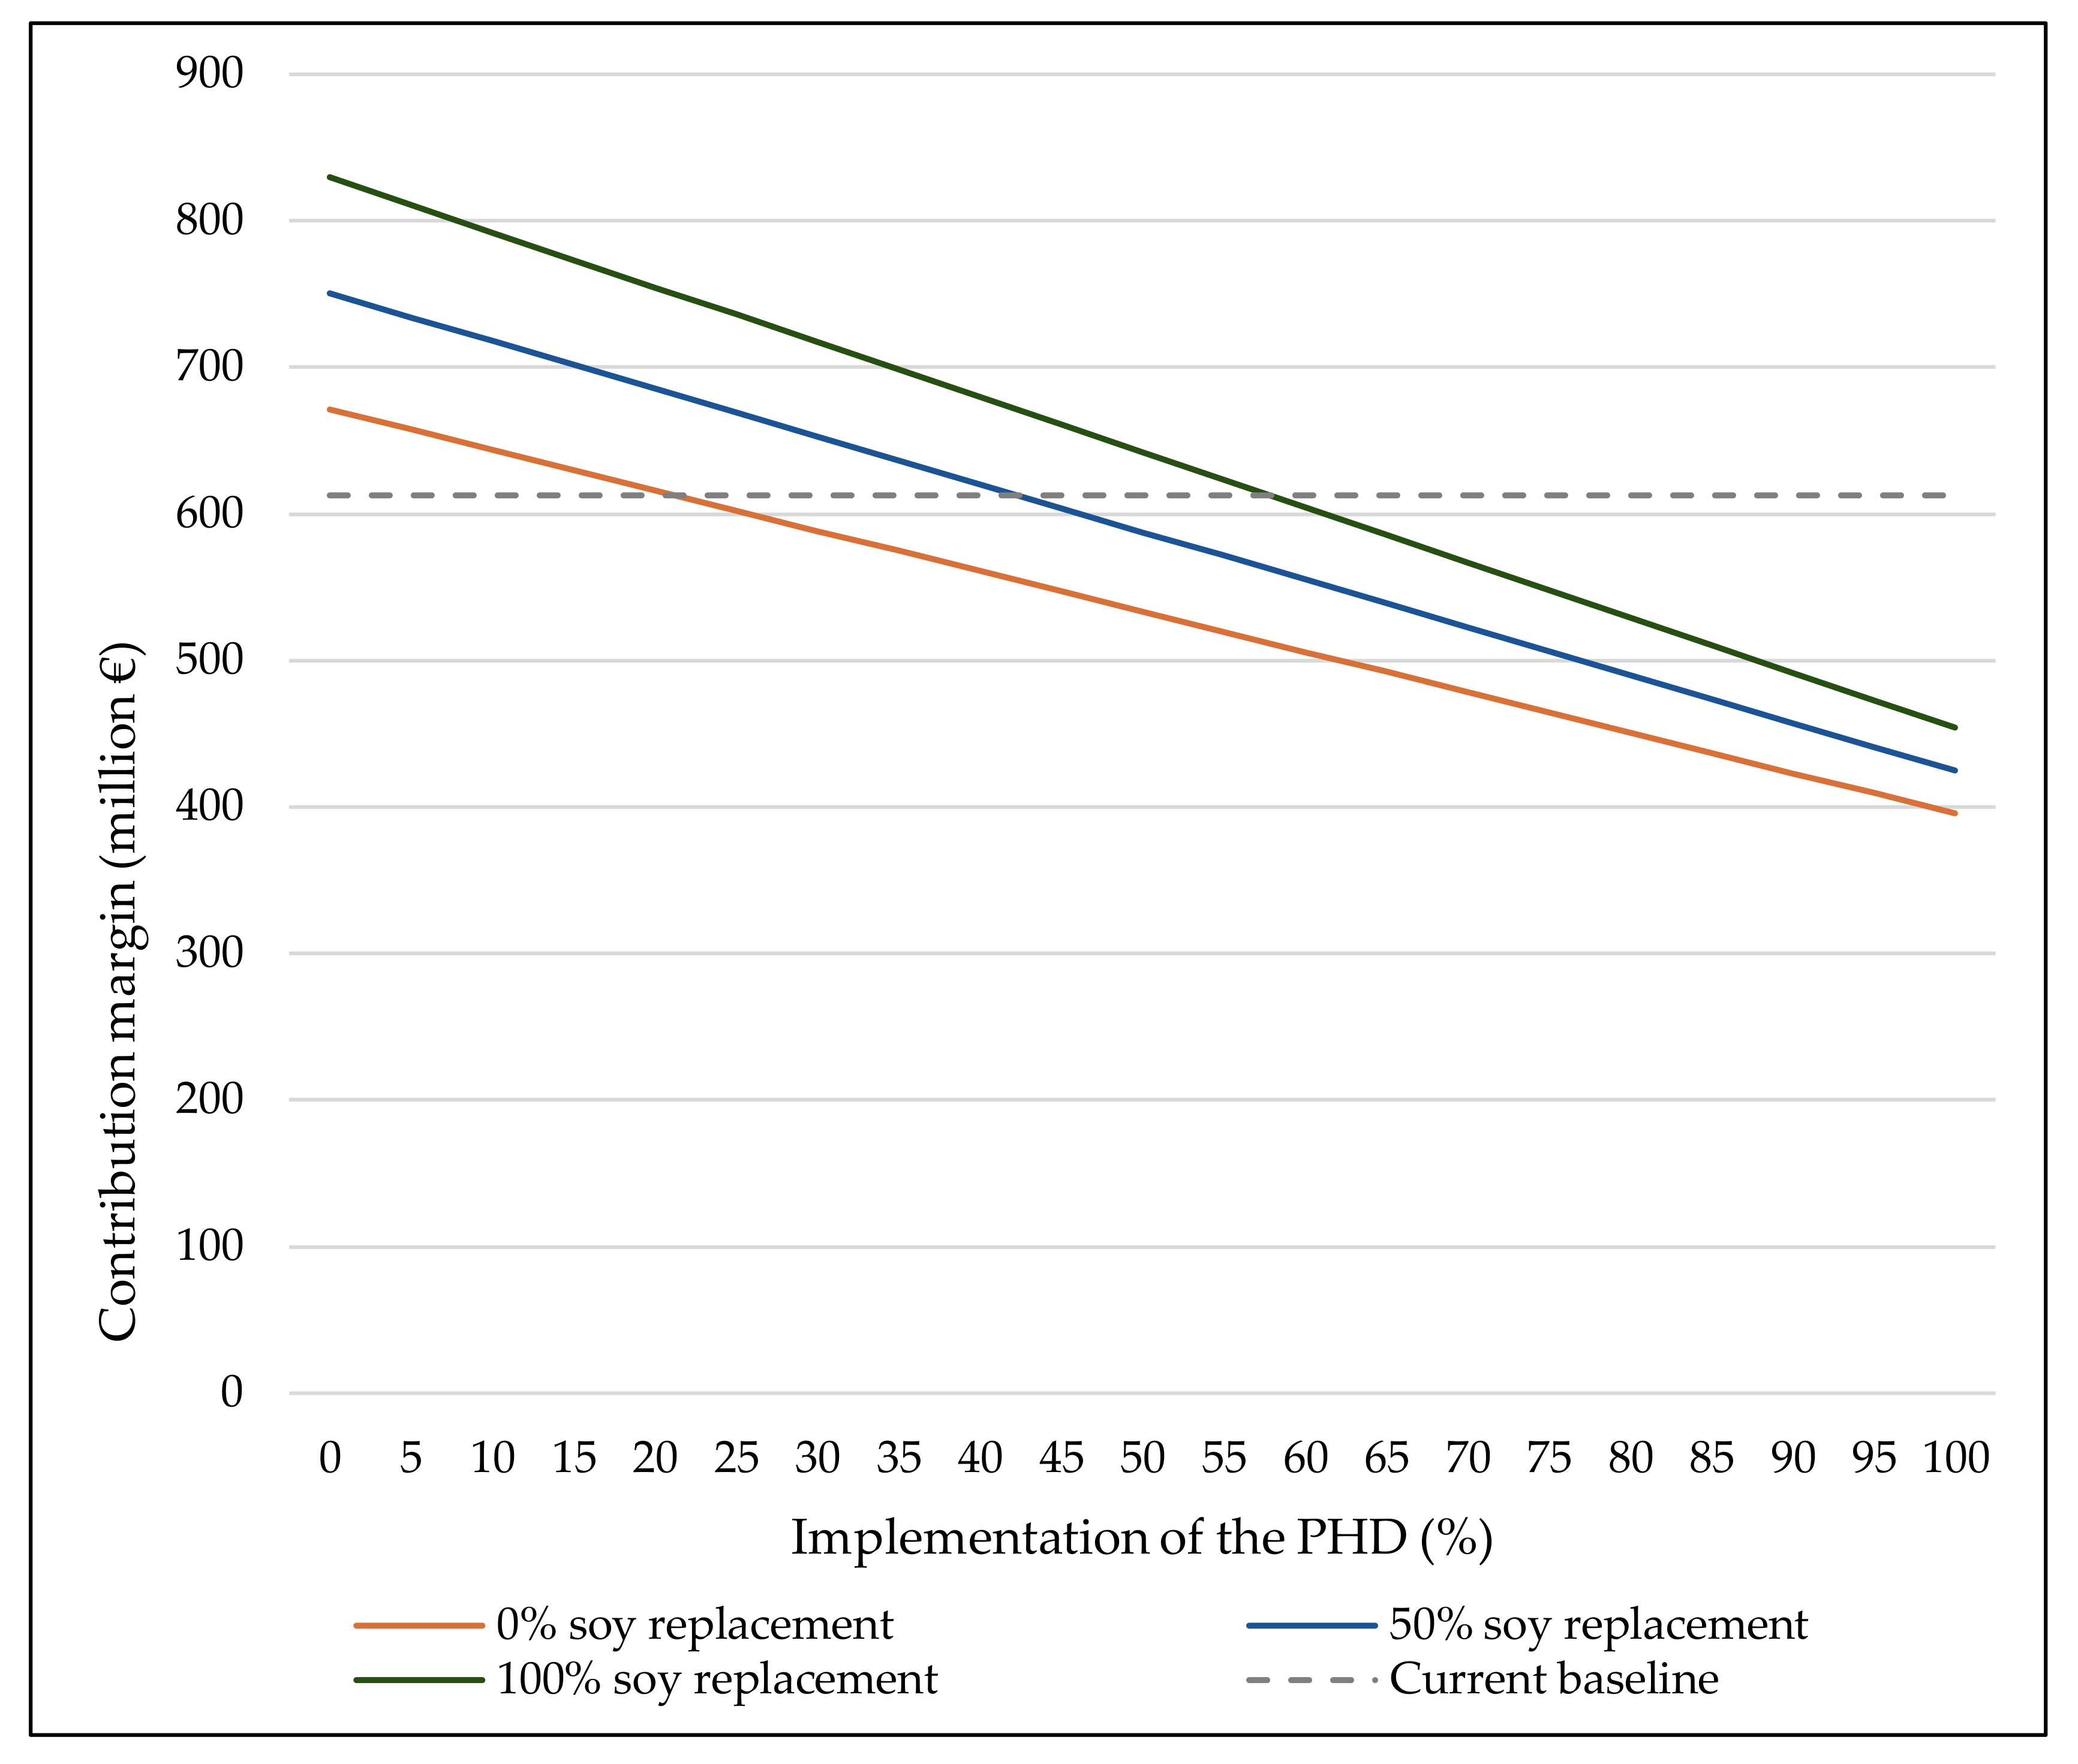
Implementation of the transition scenarios will of course result in costs for both the sector and the wider society. However, the estimates in this study suggest that they will be low compared to the costs of other suggested approaches. At 100% implementation of the PHD, the deficit relative to the sector’s current contribution margin is between €158.5 and €217.0 million, depending on assumptions for soy replacement. This does not include expenses related directly to the transition, such as replacement of machinery, but also does not include savings resulting from the replacement of imported soy. Further research into the economic aspects of this type of transition would yield a more precise estimate of the costs and benefits, making it more directly comparable with the economic impact of other mitigation strategies for the agricultural sector. Importantly, the costs of the transition should not rest on the sector alone. For society, there are potential co-benefits from facilitating a transition towards an agricultural sector that can supply the population with more plant-based foods. Besides obvious savings on climate change adaptation that will result from investing in mitigation, a healthier diet can also result in savings on healthcare. The PHD used in this study is a healthier diet than the one currently consumed in Denmark and in Europe in general [1,26,33], and is specifically designed to be optimal for both human and planetary health [1]. A recent report reviewed the potential economic benefits for the Danish society if the population followed the current dietary guidelines. It was found that if Danes reduced their intake of red and processed meat to 500 g per person per week, society would save €657.1–764.5 million, depending on the method of calculation [65]. The reduction in meat intake implicit in the PHD can thus in itself contribute significantly to offsetting societal expenses related to an ambitious transformation of the agricultural sector.
Since the publication of the PHD, it has been criticized by actors from the agricultural sector because of the significant and difficult changes implementation of the diet would necessitate in the sector [66,67], and has also been targeted by consumers in a social media campaign [68]. Another criticism has centered around the PHD being economically unattainable for a major part of the global population [69]. These are valid concerns which deserve to be addressed. Firstly, the PHD is a reference diet estimating the consumption of individual food groups averaged over the total global population, and it is one of the first attempts at quantifying a transition to a more climate-friendly diet. Local interpretations and adaptations of the diet will of course be necessary, to ensure that the diet is feasible and can be integrated into local food systems and cultures. Additionally, while the diet is global in its scope, there is no doubt that for the sake of planetary health, it is mainly diets high in animal products that need to be addressed [2,6,7,8]. One aspect of the PHD that mainly addresses developed countries’ consumption of animal products is the recommended intake of dairy in the diet. The recommended average intake in the PHD is on par with the current global per capita production [1,33], but significantly lower than, e.g., the Danish average consumption [38]. The EAT-Lancet Commission cites several studies in their report finding that the existing very low consumption of dairy in many cultures does not correlate with negative health effects [1]. Thus, it is possible to make locally adapted recommendations for, e.g., dairy. Populations with a lower average consumption of dairy than recommended in the PHD can be encouraged to maintain their low level, while populations that consume high amounts of dairy can be encouraged to reduce. This is the case for all the food groups presented in the PHD. In every case there is a recommended range, enabling the diet to be adapted both on a population and individual level. Regardless of how the diet is adapted, it stands to reason that there will be significant changes in the agricultural sector. These will have to be tackled politically to address farmers’ and consumers’ concerns for what this transition would mean for farmers’ livelihoods and consumers’ preferred eating habits. Incentives and support for farmers and workers in the meat industry transitioning to production of other crops and alternative employment would be necessary.
It has been argued that Danish animal production is so climate-friendly that no reduction is needed; for example, in a recent report comparing the climate impact of Danish pork and dairy production with other selected countries. This report found that Denmark’s production of those two commodities is among the most climate-friendly in the world [70]. However, it is important to note that emissions from animal production remain much higher than from plant production, and that experts agree that a global transition to a more plant-based diet is necessary for sufficiently ambitious climate-change mitigation [1,2,3]. Denmark is a relatively rich country in a relatively rich region, and consumers, both in Denmark and Europe, are currently displaying increasing interest in plant-based foods [16,17,18,19]. Beginning a transition towards a more plant-based agricultural production could make European farmers and companies important players in the market for plant-based foods, and would also set a good example for inspiring other regions towards beginning the process.
Political action and dedicated support for the agricultural sector are required in order to incentivize changes in both production and consumption. This should include: (i) providing guidelines and establishing pilots for efficient and sustainable conversion of livestock production to plant production in collaboration with the farmer advisory services, (ii) targeting subsidies towards production of plant-based food commodities [47], coupled with (iii) implementing measures for increasing the capability, opportunity, and motivation of consumers that will make it easier and more acceptable for them to make a primarily plant-based and healthy diet the preferred choice [71,72,73], and iv) considering adopting a carbon tax on food, as suggested by the Danish Council on Climate Change [20]. New actors in the market, such as producers of plant-based alternatives to meat and dairy, can potentially accelerate this transition because they are not invested in maintaining the status quo as more established actors are [74].
Most important in facilitating the transition within the European Union are the EU agricultural policies. These need to incentivize a shift towards increased production of plant-based foods to replace some of the animal production. The EU has recently presented its Farm to Fork Strategy as part of the new European Green Deal [10]. This strategy is committed to promoting more environmentally sustainable and healthy food consumption, specifically a more plant-based diet, and is also supporting more sustainable food production. However, the consumption and production goals in the strategy are not directly linked. None of the suggested measures for achieving a sustainable European food production system include facilitating a shift towards more plant-based food production, even though a downscaling of animal production and increase in plant production would fit well with the goal of reducing consumption of red meat and increasing consumption of plant-based foods. Therefore, it will be important to establish such a link in the proposal for a legislative framework for sustainable food systems announced in the Farm to Fork Strategy Draft Action Plan and due in 2023 [10]. Additionally, the upcoming revision of the EU Common Agricultural policy for 2021 to 2027 should provide economic incentives for promoting a transition to more plant-based agricultural production. Furthermore, it is necessary that all actors, from policymakers in the EU to national agricultural organizations, researchers, consumers, and individual farmers, work together towards the same goal and remain aware of the importance of making ambitious changes.

5. Conclusions

Based on the analysis in this study it can be concluded that there is significant potential for reducing the GHG emissions from agriculture by transitioning from being primarily based on livestock and animal feed production towards focusing on providing more plant-based food for human consumption. In the case of Denmark, emission reductions of up to 20.2 Mt CO2e (86.5%) will be possible with full global implementation of the EAT-Lancet Planetary Health Diet. This in a scenario where domestic cattle, pig, and chicken production is downscaled to 76.2%, 21.1%, and 88.2% of current production, coupled with replacement of imported soy, restoration of drained organic soils, and afforestation of surplus agricultural land using fast-growing tree species. An estimate of the economic implications of the transition scenarios suggests that the costs will be manageable (approximately €158.5 million for the most ambitious scenario). Furthermore, there are significant climate and health co-benefits from shifting to more plant-based production and consumption that may reduce societal healthcare costs. The full economic implications should be investigated thoroughly. Increasing consumer interest and demand for plant-based food commodities supports the feasibility of a food system transition, but there is a need for efficient support measures. Within the European Union, most importantly through the new legislative framework for sustainable food systems proposed in the draft action plan for the Farm to Fork Strategy, and through a revision of the Common Agricultural Policy. Political action and cross-sector collaboration at the national, supra-national, and global level are required in order to incentivize the necessary transformative changes in production and consumption. Transitioning to more plant-based food production is pivotal for making our food system more sustainable, and we should therefore discourage large investments in technologies aiming to maintain an inherently less sustainable animal-based food production system, that are resulting in technological and financial lock-ins, which will significantly delay such a transition.

Supplementary Materials

The following are available online at https://www.mdpi.com/2071-1050/12/19/8228/s1, Table S1: Animal commodities included in analysis, Table S2: Vegetable commodities included in analysis, Table S3: Contribution margins for sub-sectors within the agricultural sector, Table S4: Land use under all conditions used in scenarios.

Author Contributions

Conceptualization, C.B.H. and A.A.P.; methodology, C.B.H. and A.A.P.; formal analysis, A.A.P.; investigation, A.A.P.; resources, A.A.P.; data curation, A.A.P.; writing—original draft preparation, A.A.P.; writing—review and editing, C.B.H.; visualization, A.A.P.; supervision, C.B.H., Supplementary Materials, A.A.P. All authors have read and agreed to the published version of the manuscript.

Funding

This research received no external funding.

Acknowledgments

The authors would like to thank Jørgen Dejgård Jensen from the Department of Food and Resource Economics at the University of Copenhagen for advice on the method used for the economic calculations, and Hans Roust Thysen from SEGES at the Danish Agriculture & Food Council for providing access to an internal report behind the organization’s climate initiatives.

Conflicts of Interest

The authors declare no conflict of interest.

References

  1. Willett, W.; Rockström, J.; Loken, B.; Springmann, M.; Lang, T.; Vermeulen, S.; Garnett, T.; Tilman, D.; DeClerck, F.; Wood, A.; et al. Food in the Anthropocene: The EAT–Lancet Commission on healthy diets from sustainable food systems. Lancet 2019, 393, 447–492. [Google Scholar] [CrossRef]
  2. Springmann, M.; Clark, M.; Mason-D’Croz, D.; Wiebe, K.; Bodirsky, B.L.; Lassaletta, L.; de Vries, W.; Vermeulen, S.J.; Herrero, M.; Carlson, K.M.; et al. Options for keeping the food system within environmental limits. Nature 2018, 562, 519–525. [Google Scholar] [CrossRef]
  3. Rockström, J.; Edenhofer, O.; Gaertner, J.; DeClerck, F. Planet-proofing the global food system. Nat. Food 2020, 1, 3–5. [Google Scholar] [CrossRef] [Green Version]
  4. IPCC. Climate Change and Land: An IPCC Special Report on Climate Change, Desertification, Land Degradation, Sustainable Land Management, Food Security, and Greenhouse Gas Fluxes in Terrestrial Ecosystems; Shukla, P.R., Skea, J., Calvo Buendia, E., Masson-Delmotte, V., Pörtner, H.-O., Roberts, D.C., Zhai, P., Slade, R., Connors, S., van Diemen, R., et al., Eds.; United Nations: New York, NY, USA, 2019. [Google Scholar]
  5. Gerber, P.J.; Steinfeld, H.; Henderson, B.; Mottet, A.; Opio, C.; Dijkman, J.; Falcucci, A.; Tempio, G. Tackling Climate Change Through Livestock—A Global Assessment of Emissions and Mitigation Opportunities; Food and Agriculture Organization of the United Nations (FAO): Rome, Italy, 2013. [Google Scholar]
  6. Buckwell, A.; Nadeu, E. What is the Safe Operating Space for EU Livestock? RISE Foundation: Brussels, Belgium, 2018. [Google Scholar]
  7. Poore, J.; Nemecek, T. Reducing food’s environmental impacts through producers and consumers. Science 2018, 360, 987–992. [Google Scholar] [CrossRef] [Green Version]
  8. Hedenus, F.; Wirsenius, S.; Johansson, D.J.A. The importance of reduced meat and dairy consumption for meeting stringent climate change targets. Clim. Chang. 2018, 124, 79–91. [Google Scholar] [CrossRef] [Green Version]
  9. European Commission. Communication from the Commission to the European Parliament, the European Council, the Council, the European Economic and Social Committee and the Committee of the Regions. The European Green Deal; European Commission: Brussels, Belgium, 2019. [Google Scholar]
  10. European Commission. Farm to Fork Strategy. For a Fair, Healthy and Environmentally-Friendly Food System; European Commission: Brussels, Belgium, 2020; Available online: https://eur-lex.europa.eu/legal-content/EN/TXT/?uri=CELEX:52020DC0381 (accessed on 20 August 2020).
  11. Nielsen, O.-K.; Plejdrup, M.S.; Winther, M.; Nielsen, M.; Gyldenkærne, S.; Mikkelsen, M.H.; Albrektsen, R.; Thomsen, M.; Hjelgaard, K.; Fauser, P.; et al. Denmark’s National Inventory Report 2020. Emission Inventories 1990–2018—Submitted under the United Nations Framework Convention on Climate Change and the Kyoto Protocol; Scientific Report No. 372; Aarhus University, DCE—Danish Centre for Environment and Energy: Aarhus, Denmark, 2020. [Google Scholar]
  12. Danish Ministry of Climate, Energy and Utilities. Denmark’s Integrated National Energy and Climate Plan under the Regulation of the European Parliament and of the Council on the Governance of the Energy Union and Climate Action; Danish Ministry of Climate, Energy and Utilities: Copenhagen, Denmark, 2019. [Google Scholar]
  13. Klimapartnerskabet for Fødevare- og Landbrugssektoren; Report; Regeringens Klimapartnerskaber, Fødevare- og Landbrugssektoren: Copenhagen, Denmark, 2020.
  14. Toft, T. Omstilling fra produktion af foder til produktion af mad—Set fra primærproducenterne. SEGES, Danish Agriculture and Food Council. In Proceedings of the Sådan kan Plantebaseret Kost Bidrage til 70% CO2- Reduktion, Copenhagen, Denmark, 24 February 2020; Netværk for Fremtidens Planteproteiner i Danmark: Copenhagen, Denmark, 2020. [Google Scholar]
  15. SEGES. Future Farming. White Paper—Danskproduceret Planteprotein til Human Konsum; Danish Agriculture and Food Council: Copenhagen, Denmark, 2018. [Google Scholar]
  16. COOP Analyse. Danskernes Forbrug af Vegi-varer Tredoblet; COOP Denmark: Albertslund, Denmark, 2019; Available online: https://coopanalyse.dk/analyse/02_447-vegi-varer-salg/ (accessed on 20 August 2020).
  17. Vifu. Plantebaserede Fødevarer: Forbrugerinteresse og Fremtidige Udfordringer og Muligheder; Rapport Vedrørende Kortlægning af Markedstendenser for Netværk for Plantebaserede Fødevarer; Vifu—Videnscenter for Fødevarerudvikling: Holstebro, Denmark, 2020. [Google Scholar]
  18. ProVeg International. European Consumer Survey on Plant-based Foods—Describing the Product Landscape and Uncovering Priorities for Product Development and Improvement; Report; ProVeg International: Berlin, Germany, 2020. [Google Scholar]
  19. Froggatt, A.; Wellesley, L. Meat Analogues Considerations for the EU; Research Paper; Energy, Environment and Resources Department, Chatham House, the Royal Institute of International Affairs: London, UK, 2019. [Google Scholar]
  20. The Danish Council on Climate Change. Kendte Veje og Nye Spor til 70 Procents Reduktion—Retning og Tiltag for de Næste ti Års Klimaindsats i Danmark; The Danish Council on Climate Change: Copenhagen, Denmark, 2020. [Google Scholar]
  21. Bruno, M.; Thomsen, M.; Pulselli, F.M.; Patrizi, N.; Marini, M.L.; Caro, D. The carbon footprint of Danish diets. Clim. Chang. 2019, 156, 489–507. [Google Scholar] [CrossRef]
  22. Springmann, M.; Godfray, H.C.; Rayner, M.; Scarborough, P. Analysis and valuation of the health and climate change cobenefits of dietary change. Proc. Natl. Acad. Sci. USA 2016, 113, 4146–4151. [Google Scholar] [CrossRef] [Green Version]
  23. Tilman, D.; Clark, M. Global diets link environmental sustainability and human health. Nature 2014, 515, 518–522. [Google Scholar] [CrossRef]
  24. Bosselmann, A.S. Dansk Import af Afskovningsfri Soja fra Sydamerika, Note for the Ministry of Environment and Food; Institute for Food and Resource Economics (IFRO), University of Copenhagen: Copenhagen, Denmark, 2020. [Google Scholar]
  25. C40 Cities. The Good Food Cities Declaration. Good Food Cities: Achieving a Planetary Health Diet for All; C40 Cities: New York, NY, USA, 2019. [Google Scholar]
  26. Lassen, A.D.; Christensen, L.M.; Trolle, E. Development of a Danish Adapted Healthy Plant-Based Diet Based on the EAT-Lancet Reference Diet. Nutrients 2020, 12, 738. [Google Scholar] [CrossRef] [Green Version]
  27. Danish Economic Councils. Økonomi og Miljø 2019. Sammenfatning og Anbefalinger, Miljøpåvirkning og Fordeling, Lækage af Drivhusgasudledninger og Dansk Klimapolitik; Report from the Chairmanship; Svarer, M., Hansen, L.G., Dalgaard, C.-J., Tranæs, T., Eds.; Danish Economic Councils: Copenhagen, Denmark, 2019. [Google Scholar]
  28. United Nations. World Population Prospects 2019; Department of Economic and Social Affairs Population Dynamics, United Nations: New York, NY, USA, 2019. [Google Scholar]
  29. Danish Agriculture & Food Council. Statistics 2018 Beef; Danish Agriculture & Food Council, The Danish Livestock and Meat Board: Copenhagen, Denmark, 2019. [Google Scholar]
  30. Danish Agriculture & Food Council. Statistics 2018 Pigmeat; Danish Agriculture & Food Council, The Danish Livestock and Meat Board: Copenhagen, Denmark, 2019. [Google Scholar]
  31. Statistics Denmark. HDYR07: Husdyrbestanden Efter Område, Enhed og Art; Statistikbanken, Statistics Denmark: Copenhagen, Denmark, 2020; Available online: www.statistikbanken.dk/HDYR07 (accessed on 20 August 2020).
  32. Statistics Denmark. ANI6: Slagtninger og Produktion af Fjerkræ Fordelt Efter Kategori og Enhed (år); Statistikbanken, Statistics Denmark: Copenhagen, Denmark, 2020; Available online: www.statistikbanken.dk/ANI6 (accessed on 20 August 2020).
  33. FAO. Livestock Primary; FAOSTAT Statistical Database: Rome, Italy, 2019; Available online: http://www.fao.org/faostat/en/#data/QL (accessed on 20 August 2020).
  34. Lesschen, J.P.; van den Berg, M.; Westhoek, H.J.; Witzkec, H.P.; Oenemaa, O. Greenhouse gas emission profiles of European livestock sectors. Anim. Feed Sci. Technol. 2011, 166–167, 16–28. [Google Scholar] [CrossRef]
  35. Nijdam, D.; Rood, T.; Westhoek, H. The price of protein: Review of land use and carbon footprints from life cycle assessments of animal food products and their substitutes. Food Policy 2012, 37, 760–770. [Google Scholar] [CrossRef]
  36. Statistics Denmark. AFG5: Det Dyrkede Areal Efter Område, Enhed og Afgrøde; Statistikbanken, Statistics Denmark: Copenhagen, Denmark, 2020; Available online: www.statistikbanken.dk/AFG5 (accessed on 20 August 2020).
  37. FAO. Crops; FAOSTAT Statistical Database: Rome, Italy, 2019; Available online: http://www.fao.org/faostat/en/#data/QC (accessed on 20 August 2020).
  38. Pedersen, A.N.; Christensen, T.; Matthiessen, J.; Knudsen, V.K.; Rosenlund-Sørensen, M.; Biltoft-Jensen, A.; Hinsch, H.-J.; Ygil, K.H.; Kørup, K.; Saxholt, E.; et al. Danskernes Kostvaner 2011–2013—Hovedresultater; National Food Institute: Kongens Lyngby, Denmark, 2015. [Google Scholar]
  39. FAO. Crops and Livestock Products; FAOSTAT Statistical Database: Rome, Italy, 2019; Available online: http://www.fao.org/faostat/en/#data/TP (accessed on 20 August 2020).
  40. De Laurentiis, V.; Corrado, S.; Sala, S. Quantifying household waste of fresh fruit and vegetables in the EU. Waste Manag. 2018, 77, 238–251. [Google Scholar] [CrossRef]
  41. FAO. Nuts and Derived Products. In Definition and Classification of Commodities (Draft); FAO: Rome, Italy, 2019; Available online: http://www.fao.org/waicent/faoinfo/economic/faodef/fdef05e.htm#top (accessed on 20 August 2020).
  42. Statistics Denmark. HST77: Høstresultat efter Område, Afgrøde og Enhed; Statistikbanken, Statistics Denmark: Copenhagen, Denmark, 2020; Available online: www.statistikbanken.dk/HST77 (accessed on 20 August 2020).
  43. Hermansen, J.E.; Mogensen, L.; Knudsen, M.T.; Kristensen, T.; Gylling, M. Kortlægning af Proteinværdikæder; Note from DCA—Nationalt Center for Fødevarer og Jordbrug; Aarhus University: Aarhus, Denmark; Institute for Food and Resource Economics (IFRO), University of Copenhagen: Copenhagen, Denmark, 2017. [Google Scholar]
  44. Statistics Denmark. FODER2: Fordeling af Foder efter Fodermiddel og Anvendelse; Statistikbanken, Statistics Denmark: Copenhagen, Denmark, 2020; Available online: www.statistikbanken.dk/FODER2 (accessed on 20 August 2020).
  45. Sirtori, F.; Crovetti, A.; Acciaioli, A.; Bonelli, A.; Pugliese, C.; Bozzi, R.; Campodoni, G.; Franci, O. Effect of Replacing a Soy Diet with Vicia Faba and Pisum Sativum on Performance, Meat and Fat Traits of Cinta Senese Pigs. Ital. J. Anim. Sci. 2015, 14, 3659. [Google Scholar] [CrossRef] [Green Version]
  46. Comellini, M.; Volpelli, L.A.; Lo Fiego, D.P.; Scipioni, R. Faba bean in dairy cow diet: Effect on milk production and quality. Ital. J. Anim. Sci. 2009, 8, 396–398. [Google Scholar] [CrossRef] [Green Version]
  47. Vils, E. Ærter og Hestebønne i Stedet for Sojaskrå i Foderet til Danske Svin. De Nye Muligheder i Bælgsæd. 2011. Available online: https://fkb.dk/ting/object/870971-tsart%3A34541906 (accessed on 20 August 2020).
  48. SEGES. Fodring af Slagtesvin. 2020. Available online: https://svineproduktion.dk/Viden/I-stalden/Foder/Udfodring/Slagtesvin (accessed on 20 August 2020).
  49. SEGES. Store og Våde Udbytter i Hestebønner. 2018. Available online: https://www.landbrugsinfo.dk/kvaeg/foder/sider/kv-18-3884-store-og-vaade-udbytter-i-hestebonner.aspx (accessed on 20 August 2020).
  50. Dansk Protein Innovation. DPI’s Strategi. Available online: https://proteininnovation.dk/strategi/ (accessed on 20 August 2020).
  51. Olesen, J.E.; Petersen, S.O.; Lund, P.; Jørgensen, U.; Kristensen, T.; Elsgaard, L.; Sørensen, P.; Lassen, J. Virkemidler til Reduktion af Klimagasser i Landbruget; Scientific Report, No.130; DCA—Nationalt Center for Fødevarer og Jordbrug, Aarhus University: Aarhus, Denmark, 2018. [Google Scholar]
  52. Cunningham, S.C.; Cavagnaro, T.R.; MacNally, R.; Paul, K.I.; Baker, P.J.; Beringer, J.; Thomson, J.R.; Thompson, R.M. Reforestation with native mixed-species plantings in a temperate continental climate effectively sequesters and stabilizes carbon within decades. Glob. Chang. Biol. 2015, 21, 1552–1566. [Google Scholar] [CrossRef]
  53. Barcena, T.G.; Gundersen, P.; Vesterdal, L. Afforestation effects on SOC in former cropland: Oak and spruce chronosequences resampled after 13 years. Glob. Chang. Biol. 2014, 20, 2938–2952. [Google Scholar] [CrossRef]
  54. Johannsen, V.K.; Nord-Larsen, T.; Vesterdal, L.; Bentsen, N.S. Kulstofbinding ved Skovrejsning; Note for the Ministry of Environment and Food; Institute for Food and Resource Economics (IFRO), University of Copenhagen: Copenhagen, Denmark, 2019. [Google Scholar]
  55. SEGES. Visionen om et Klimaneutralt Landbrug i 2050; Internal Report, Unpublished; Danish Agriculture and Food Council: Copenhagen, Denmark, 2019. [Google Scholar]
  56. Statistics Denmark. REGNPRO1: Dækningsbidrag og Jordrente efter Regnskabsposter for Planter og Produktionsgren; Statistics Denmark: Copenhagen, Denmark, 2020; Available online: https://statistikbanken.dk/REGNPRO1 (accessed on 20 August 2020).
  57. Statistics Denmark. REGNPRO2: Dækningsbidrag og Nettooverskud efter Regnskabsposter for Husdyr og Produktionsgrene; Statistics Denmark: Copenhagen, Denmark, 2020; Available online: https://statistikbanken.dk/REGNPRO2 (accessed on 20 August 2020).
  58. Statistics Denmark. KN8Y: Im- og Eksport KN (EU Kombineret Nomenklatur) efter Im- og Eksport, Varer, Land og Enhed; Statistics Denmark: Copenhagen, Denmark, 2020; Available online: www.statistikbanken.dk/KN8Y (accessed on 20 August 2020).
  59. Falk, J.; Gaffney, O.; Bhowmik, A.K.; Bergmark, P.; Galaz, V.; Henningsson, S.; Höjer, M.; Jacobson, L.; Jónás, K.; Klingenfeld, D.; et al. Exponential Roadmap 1.5; Future Earth: Stockholm, Sweden, 2019. [Google Scholar]
  60. Felby, C. Beyond 70% GHG reduction—What should be the research & development priorities? In Proceedings of the CBIO Webinar, Aarhus, Denmark, 1 July 2020; Aarhus University Center for Circular Bioeconomy: Aarhus, Denmark, 2020. Available online: https://cbio.au.dk/en/webinar-presentations/ (accessed on 20 August 2020).
  61. Meynard, J.M.; Charrier, F.; Fares, M.; Le Bail, M.; Magrini, M.-B.; Charlier, A.; Messéan, A. Socio-technical lock-in hinders crop diversification in France. Agron. Sustain. Dev. 2018, 38, 54. [Google Scholar] [CrossRef] [Green Version]
  62. Magrini, M.-B.; Anton, M.; Cholez, C.; Corre-Hellou, G.; Duc, G.; Jeuffroy, M.-H.; Meynard, J.-M.; Pelzer, E.; Voisine, A.-S.; Walrand, S. Why are grain-legumes rarely present in cropping systems despite their environmental and nutritional benefits? Analyzing lock-in in the French agrifood system. Ecol. Econ. 2016, 126, 152–162. [Google Scholar] [CrossRef]
  63. Wagner, C.H.; Cox, M.; Robles, J.L.B. Pesticide lock-in in small scale Peruvian agriculture. Ecol. Econ. 2016, 129, 72–81. [Google Scholar] [CrossRef]
  64. IPES-Food. From Uniformity to Diversity: A Paradigm Shift from Industrial Agriculture to Diversified Agroecological Systems; IPES-Food—International Panel of Experts on Sustainable Food Systems: Brussels, Belgium, 2016. [Google Scholar]
  65. Jensen, J.D. Vurdering af Sundhedsøkonomiske Gevinster Ved Øget Overholdelse af Kostrådene; IFRO Report No. 2020/07; Institute for Food and Resource Economics (IFRO), University of Copenhagen: Copenhagen, Denmark, 2020. [Google Scholar]
  66. National Farmers Union. NFU Responds to the EAT Lancet Commission Report; National Farmers Union: Stoneleigh, UK, 2019; Available online: https://www.nfuonline.com/nfu-responds-to-the-eat-lancet-commission-report/ (accessed on 28 September 2020).
  67. Agriculture and Horticulture Development Board. AHDB Response to EAT Lancet Commission Report; Agriculture and Horticulture Development Board: Kenilworth, UK, 2019; Available online: https://ahdb.org.uk/news/ahdb-response-to-eat-lancet-commission-report (accessed on 28 September 2020).
  68. Garcia, D.; Galaz, V.; Daume, S. EAT-Lancet vs yes2meat: The digital backlash to the planetary health diet. Lancet 2019, 394, 2153–2154. [Google Scholar] [CrossRef] [Green Version]
  69. Hirvonen, K.; Bai, Y.; Headey, D.; Masters, W.A. Affordability of the EAT-Lancet reference diet: A global analysis. Lancet 2019, 8, 59–66. [Google Scholar] [CrossRef] [Green Version]
  70. Wirsenius, S.; Searchinger, T.; Zionts, J.; Peng, L.; Beringer, T.; Dumas, P. Comparing the Life Cycle Greenhouse Gas Emissions of Dairy and Pork Systems across Countries Using Land-Use Carbon Opportunity Costs; Working Paper; World Resources Institute: Washington DC, USA, 2020. [Google Scholar]
  71. Graça, J.; Godinho, C.A.; Truninger, M. Reducing meat consumption and following plant-based diets: Current evidence and future directions to inform integrated transitions. Trends Food Sci. Technol. 2019, 91, 380–390. [Google Scholar] [CrossRef] [Green Version]
  72. Ruben Sanchez-Sabate, R.; Badilla-Briones, Y.; Sabaté, J. Understanding Attitudes towards Reducing Meat Consumption for Environmental Reasons. A Qualitative Synthesis Review. Sustainability 2019, 11, 6295. [Google Scholar] [CrossRef] [Green Version]
  73. Manners, R.; Blanco-Gutiérrez, I.; Varela-Ortega, C.; Tarquis, A.M. Transitioning European Protein-Rich Food Consumption and Production towards More Sustainable Patterns—Strategies and Policy Suggestions. Sustainability 2020, 12, 1962. [Google Scholar] [CrossRef] [Green Version]
  74. Herrero, M.; Benton, T.G.; Nyborg, K.; Christensen, S.; Clark, M.; Cook, M.T.; de Boer, I.J.M.; Downs, C.; Dizyee, K.; Folberth, C.; et al. Innovation can accelerate the transition towards a sustainable food system. Nat. Food 2020, 1, 266–272. [Google Scholar] [CrossRef]
Figure 1. Size of the livestock production in % of current baseline production. See Table 1 for current baseline livestock production and adjusted production at 100% implementation of the PHD. At 0% implementation of the PHD, production represents current baseline production levels upscaled corresponding to expected global population increase.
Sustainability 12 08228 g001
Figure 2. Possible reduction from implementation of the elements in the scenarios. Maximum effect is reached at 100% implementation of the PHD, 100% replacement of imported soy, restoration of all drained organic soils, and afforestation of surplus land with fast-growing species. Potential emissions by 2030 refer to a scenario where all elements have been implemented in full.
Sustainability 12 08228 g002
Figure 3. Greenhouse gas (GHG) emissions at 0–100% implementation of the PHD with different levels of replacement of imported soy (0%, 50%, and 100% replacement) and estimates for the carbon sequestration of the afforested area (low, medium, and high).
Sustainability 12 08228 g003
Figure 4. The effect of implementation of the PHD (0–100%) on land use with 50% replacement of imported soy. When surplus land becomes available due to the reduction in animal production, and therefore production of animal feed, it is assumed that drained organic soils will be restored. When the total area of 178,700 ha has been restored, the additional surplus area will be afforested. See supplementary Table S3 for land use in all scenarios.
Sustainability 12 08228 g004
Figure 5. Contribution margin by 2030 relative to implementation of the PHD (0–100% implementation), under conditions where 0%, 50%, and 100% of imported soy is replaced with locally produced broad beans.
Sustainability 12 08228 g005
Table 1. Population or production of relevant domestic animals [29,30,31,32].
Animal SpeciesNumber of Animals (2018) (millions)Number of Animals (PHD implementation 100%) (millions)
Beef cattle *0.5340.190
Dairy cattle **0.5750.650
Pigs ***19.34.077
Broiler chickens *159.5141.71
Egg-laying hens **5.482.951
Notes: * Slaughtered in Denmark or exported for slaughter after rearing, during the year 2018. ** The average total population at any given time in 2018. *** Includes both slaughtered finishers and the average population of sows, excludes piglets exported for rearing.
Table 2. Necessary supply of animal products in live weight if the entire Danish and global population in 2030 eat according to the Planetary Health Diet (PHD), compared to the current production averaged over five years (2013–2017) [33].
ProductNecessary Supply by 2030Current ProductionDanish/Global (%)
Danish (t)Global (t)Danish (t)Global (t)
Beef, lamb32,49645,848,056219,263128,682,4160.17
Pork23,58533,276,8152,105,515157,513,3811.34
Poultry100,968142,456,458225,527160,339,8140.14
Fish58,49282,526,5002,355,150431,646,1850.55
Eggs28,58640,332,50084,45974,908,1480.11
Dairy527,525744,286,6165,332,842658,467,5480.81
Necessary supply by 2030 is based on the PHD recommendations. The recommended amounts in the PHD are valid for adults. Individuals over 15 years of age have been considered as adults, and it is assumed that they will comprise 80% of the population by 2030. It is assumed that 20% of the population will be below 15 years of age and will consume on average 75% of the amounts recommended in the PHD. Only animal products mentioned in the PHD have been included. Other types of meat comprise only about 5% of total global consumption [33]. Calculations between edible yield, live weight, and carcass weight of different animal species based on Lesschen et al. (2011) and Nijdam et al. (2012) [34,35].
Table 3. Areas seed as baseline for production of selected crops.
CropTotal Current Area (ha)
Vegetables9216
Fruits5758
Legumes for human consumption (peas)3197
Nuts **5
Grain1,432,923
Grass and roughage733,477
Legumes for animal feed *19,227
Root vegetables84,327
Rape seed169,154
Notes: Statistics Denmark (2020) average 2015-2019 [36], Except *: average 2017–2019, because the area was not included prior to 2017. **: Based on FAOstat (2020) [37]. Out of these, a total of 401,483 ha were not included in the baseline area affected by the transition scenario. The excluded area is comprised of: areas used for production of seeds, horticultural crops not for consumption, industry crops other than rape seed, and undefined crops, as well as the area out of rotation at any given time, and the area of grains and potatoes not used for either feed or food, e.g., the significant area of grains used in industry, especially beer production.
Table 4. Necessary supply of vegetable foods by 2030 if the PHD is completely implemented, and current supply based on data on production, import, and consumption [37,38,39].
ProductNecessary Supply (Mt)Current Supply (Mt)
ProductionConsumptionImport
Whole grains484.7-451.4-
Starchy vegetables124.3-209.6-
Vegetables794.3286.7-330.3
Fruits514.559.9-444.1
Legumes264.835.0-17.4
Nuts52.20.004-24.8
Added fats83.6-83.2-
Added sweeteners64.8-76.4-
Production and import were averaged over the years 2013–2017. Edible fraction of vegetable products was determined using De Laurentiis et al. (2018) [40] supplemented by FAO (1994) [41] for the assessment of the edible fraction of nuts.
Table 5. Total production of selected crops relevant with regards to animal feed and the amount of the crop used for feed in Denmark. Both averaged over the years 2015–2019 [42,43].
Crop Danish Production (Mt)Used for Feed (Mt)
Grain9.176.77
Grass and roughage24.1822.90
Pulses0.0740.047
Soy cake and meal-1.59
Rape seed0.660.46
Root vegetables4.232.62
Table 6. Composition of two pig diets where soy is replaced with broad beans or reduced, compared to a reference diet [48].
Content (%)Reference DietReplacement DietReduction Diet
Grain70.056.360.0
Soy17.007.5
Broad beans031.820.0
Protein16.615.916.7
Carbohydrate66.068.366.7
The diets have been constructed so as to come as close as possible (less than 5% divergence) to the macro nutrient composition of the reference diet. In the reduction diet it was taken into account that the maximum recommended percentage of broad beans in pig diets should be 20% [47]. The reduction diet results in a reduction in soy use of more than 50%. When soy is entirely replaced by broad beans, approximately 19.6% of the grain is also replaced.
Table 7. Calculation of possible reduction in net emissions from restoration of drained organic soils.
Calculation Element >12% OC6–12% OCTotal
RotationGrassRotationGrass
Reduction in CO2 (t ha−1) *42.1730.821.0815.4-
Increase in CH4 (t CO2e ha−1) *7.26.87.26.8-
Net reduction (t CO2e ha−1)34.9724.0013.888.60-
Area (ha) **50394278387700923493178734
Total reduction (Mt CO2e)1.7620.6681.0690.2023.701
Notes: * Olesen et al. (2018) [51]. ** Nielsen et al. (2020) [11].
Table 8. Estimated distribution of baseline scope 1 emissions from agricultural production. Developed from SEGES (2019) [55].
Emissions SourceCategoryFraction of Production Emissions (%)
Direct emissionsCattle32.4
Pigs3.3
Other1.2
Fertilizer handling and storageCattle9.4
Pigs13.4
Other0.7
Arable land 39.7

