Abstract
In this paper, a bibliometric analysis was performed in order to analyze the state of the art and publication trends on the topic of ISCC (Integrated Solar Combined Cycles) for the period covering 1990 to July 2020. The Web of Science (WOS) database was consulted, and 1277 publications from 3157 different authors and 1102 different institutions, distributed among 78 countries, were retrieved as the corpus of the study. The VOSViewer software tool was used for the post-processing of the WOS corpus, and for the network data mapping. Multiple bibliometric indicators, such as the number of citations, keyword occurrences, the authors’ affiliations, and the authors, among others, were analysed in this paper in order to find the main research trends on the ISCC topic. The analysis performed in this paper concluded that the main publication source for ISCC research was Energy Conversion and Management, in terms of the total number of publications (158), but Solar Energy had the highest number of citations on the ISCC topic (4438). It was also found that China was the most productive country in terms of ISCC publications (241), and the Chinese Academy of Sciences was the most productive institution (52). Nevertheless, the author with the most publications on ISCC was I. Dincer, from Ontario Tech University (24). Based on publication keywords, a series of recommendations for future developments in the ISCC topic were derived, as well as the ways in which those ideas are connected to the global state of solar energy research.
1. Introduction
Human development indicators and societal developments are tightly bounded to extensive energy consumption [1]. That trend is particularly sharpened for emerging economies, where the increase of middling social classes and the access to new technologies is increasing the energy demand. We as a society demand more commodities, and we do not want to give up to our high living standards [2]. On the contrary, keeping the traditional energy scenario that still relies on thermal energy conversion, and that is dependent on fossil fuels (coal, gas and oil) and nuclear energy, has shown a clear impact on global warming and climate change. Therefore, a change of the energy generation paradigm is required if we want to meet society, users and environmental demands. In that scenario, several agreements have been signed over the last few decades regarding climate protection and the reduction of greenhouse gases and pollutant emissions, from the earlier Kyoto protocol in 1997 [3], the Paris Climate Agreement in 2015 [4], and more recently the COP25 Climate Change Conference in 2019 [5] and the United Nations Sustainable Development Goals declaration [6]. Under those 17 UN Goals, three of them have a direct impact on our energy model. Those are; ‘Affordable and Clean Energy’ (goal 7); ‘Industry, Innovation and Infrastructure’ (goal 9) and ‘Climate Action’ (goal 13). On the same line, several countries are making a big effort in the energy transition with the support of programs such as the 2030 Climate and Energy framework, regarding its target to achieve a 32% share for renewable energy and 40% cuts in greenhouse gas emissions (from 1990) [7].
In this near-to-mid future scenario with a high penetration of renewable energy sources, new grid challenges and difficulties—such as curtailment, service disruptions or negative bid prices—may appear [8]. That is based on the extensive deployment of the so called non-dispatchable renewable energy resources, such as wind energy and solar photovoltaics. Despite the competitive cost of those technologies, they cannot meet users’ grid demands when they are not coupled to energy storage systems, which is translated into the aforementioned difficulties. Notwithstanding the latest advances and cost-reductions seen on electrochemical energy storage systems (batteries) for wind and PV plants [9], the storage of large amounts of electricity at a competitive price has not been solved yet. Recently, different alternatives (rather than electrochemical storage) for wind and photovoltaics have been discussed, such as Compressed Air Energy Storage (CAES) systems [10] or Thermal Energy Storage (TES) systems [11] based on liquid molten salts. Even the so-called ‘Carnot-Batteries proposal’ for the replacement of coal steam generators from conventional coal thermal power plants by molten salts electric heaters and TES tanks to use surplus renewable electricity have been proposed [12]. However, in those cases, exergy destruction appears, based on the multiple energy conversions involved (electrochemical, thermal, mechanical and electrical).
A simpler alternative with a proven track of record for commercial applications gained attention couple of decades ago. That technology is known as Concentrating Solar Thermal (CST) energy, which uses mirrors and optical devices to reflect and focus solar beams into a particular area where a device—a solar reactor or receiver, depending on the final application—is located [13]. In particular, a thermal fluid (water, air, or molten salts, typically) can be passed through that receiver in order to absorb solar radiation and convert it into high fluid enthalpy. Later, that hot fluid can be stored in TES devices and/or transferred to the working fluid (steam or air) to run the turbine of a power cycle in order to generate electricity. That series of transformations is known as Concentrating Solar Power (CSP), which still accounts for less than 1% of all electricity generation, with a total 6.45 GW of installed power, with Spain, the US, and recently China and MENA region countries being the main contributors [14]. Recently, great interest has been focused on CSP based on cost–production reductions, with bidding projects such as Cerro Dominador at 11.4 c$/kWh (2014), or the DEWA project (under construction) with a bid of a 7.3 c$/kWh combined solar tower and parabolic trough plant in Dubai. The cost reduction in the technology appears to be based on learning curve effects, scaling-up technologies and the larger number of players joining that technology.
Nowadays, new ideas and proposals are seen as the next development steps for CSP technology. Some of those ideas include hybrid concepts [15], whether they are applied together with conventional thermal power plants such as coal-hybridization [16] or hybrid CSP/PV plants configurations [17,18]. Also under investigation are the use of advances in working fluids, such as supercritical steam [19] or supercritical CO2 [20,21,22]; the use of high temperature heat transfer fluids [23]; high temperature TES [24] and high temperature receivers [25,26]; as well as the use of highly-efficient power cycles [27,28,29]. The latter is one of the main hot topics in thermal energy conversion technologies, and in CSP in particular. The main feature drawing the attention of CSP technologies is its ability to decouple energy harvesting and electricity generation when it is coupled to a TES system. Besides this, this TES system is inexpensive (compared to equivalent thermochemical energy storage solutions) and it allows large bulk storage.
Regarding the utilization of CO2 under supercritical conditions for electricity generation by means of a power cycle, it has gained incredible attention over the last couple of years, mainly for CSP and heat recovery applications. In fact, that technology is seen as the philosopher’s stone for electricity generation in the near future, with theoretical conversion efficiencies above 50% for the medium temperature range (550–650 °C), and which could exceed 60% for temperatures in the range of 900 °C [30]. There is a vast literature review in that topic that even lead to a bibliometric economic review [31]. Despite the great interest of researchers and scientists in that topic [32], several scholars listed out a number of challenges and difficulties that are limiting the deployment of that technology [33,34]. The main ones can be summarized as its corrosive and solvent nature at high temperature and pressure; and its very high handling pressures (around 300 bar), which make its direct storage more difficult. On the contrary, there is also a long enough list of benefits, such as its high density at the compressor inlet (close to a liquid, but with a viscosity and diffusion that is as high as a gas); its high energy density (that is related to the compactness of its designs); its suitable supercritical temperature, which is close to ambient conditions (31 °C); its stability; its non-flammable, non-toxic nature; and obviously the abovementioned very high efficiency for a moderate temperature range. Despite the high working pressures of sCO2 cycles, one needs to keep in mind that the power cycle operates at a moderated pressure ratio (around 3.0) compared to conventional Brayton cycles, which imply smaller and more compact turbines, and the fact that its critical point appears at a lower pressure than the supercritical conditions for water steam (220 bar), which results in fewer turbine stages and reduced pumping losses. Furthermore, the sCO2 cycle might operate at a temperature close to 1000 °C, due to fluid nature stability [35]. Despite the general interest in that technology, the abovementioned technical challenges are still conditioning its further realization.
On the contrary, it is widely known that existing Combined Cycle power technologies allow for very high electricity conversion efficiencies (above to 50%) based on their highly recuperative heat nature. This is achieved by combining high temperature energy conversion through gas Brayton cycles together with medium temperature two-phase Rankine power cycles. The first ones are characterized by their very high working temperatures (above 1000 °C), which is translated into high efficiency potential regarding the second law of thermodynamics. However, compressing a gas (typically air) is a highly energy demanding process, and the divergence appearing on the enthalpy-entropy diagram, together with the limited expansion ratios on the turbine side, results in the very high temperature of the exhaust gases, which compromises its high efficiency prospects. Nonetheless, modern gas turbine technologies allow for conversion efficiencies in the range of 35% to 45%, depending on the turbine power [36]. Rankine power cycles are characterized by their low energy consumption during the fluid compression process (a pump is required in order to increase the pressure of a liquid) compared to the very high energy that can be extracted from the steam phase in a turbine. However, the use of a two-phase working fluid requires a high latent energy consumption during the evaporation process inside the boiler, which reduces its high efficiency prospects. The newest advances on Rankine cycles include water chain preheating, steam reheating, and the use of supercritical one-through boilers, which lead to efficiencies close to 45% for typical water steam temperatures [37].
Despite both the maturity of CSP technology (with more than 20 years of commercial experience) and the maturity of Combined Cycles, the standard water–steam subcritical Rankine cycle has been imposed as the only commercial solution for large CSP installations (whether solar tower plants, parabolic through plants, or linear Fresnel plants). This is based on their suitability for being coupled with molten salts central receivers (that can be heated up to 565 °C) and parabolic trough collectors (up to 400 °C). However, the application of Combined Cycles for Concentrating Solar Power, also known as Integrated Solar Combined Cycle (ISCC), would meet both requirements regarding conversion efficiency improvement and cost generation reductions.
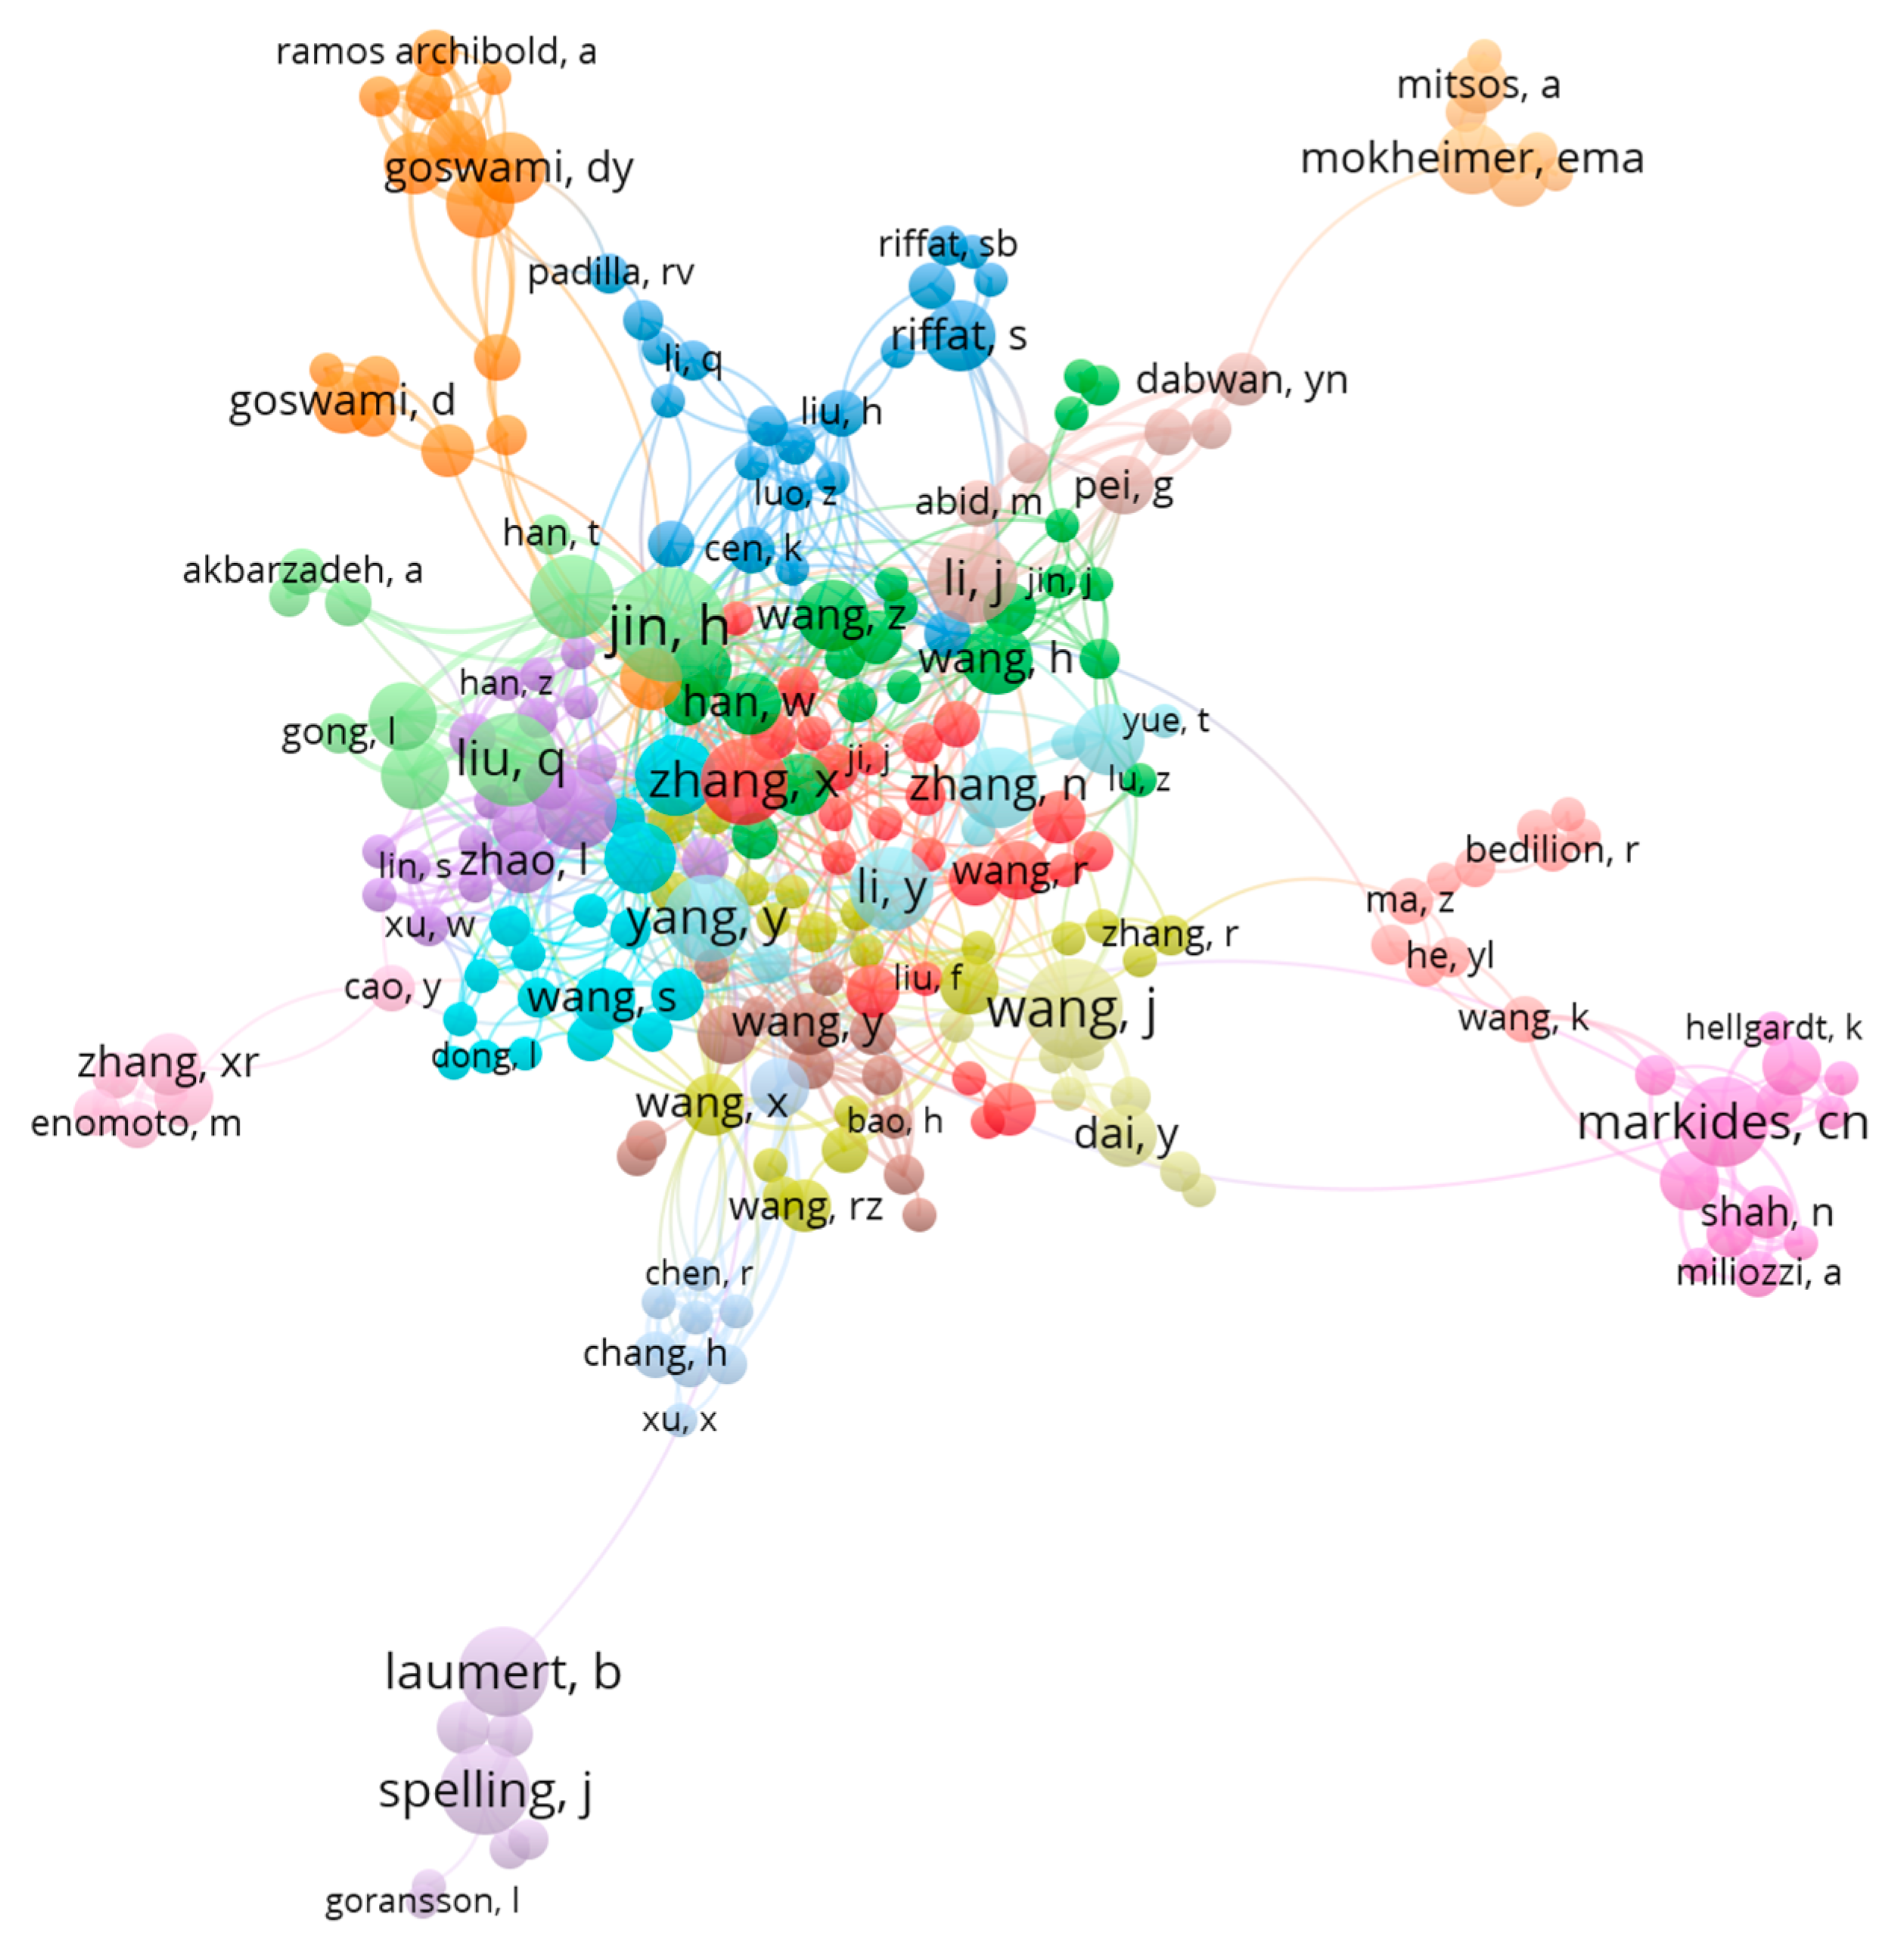
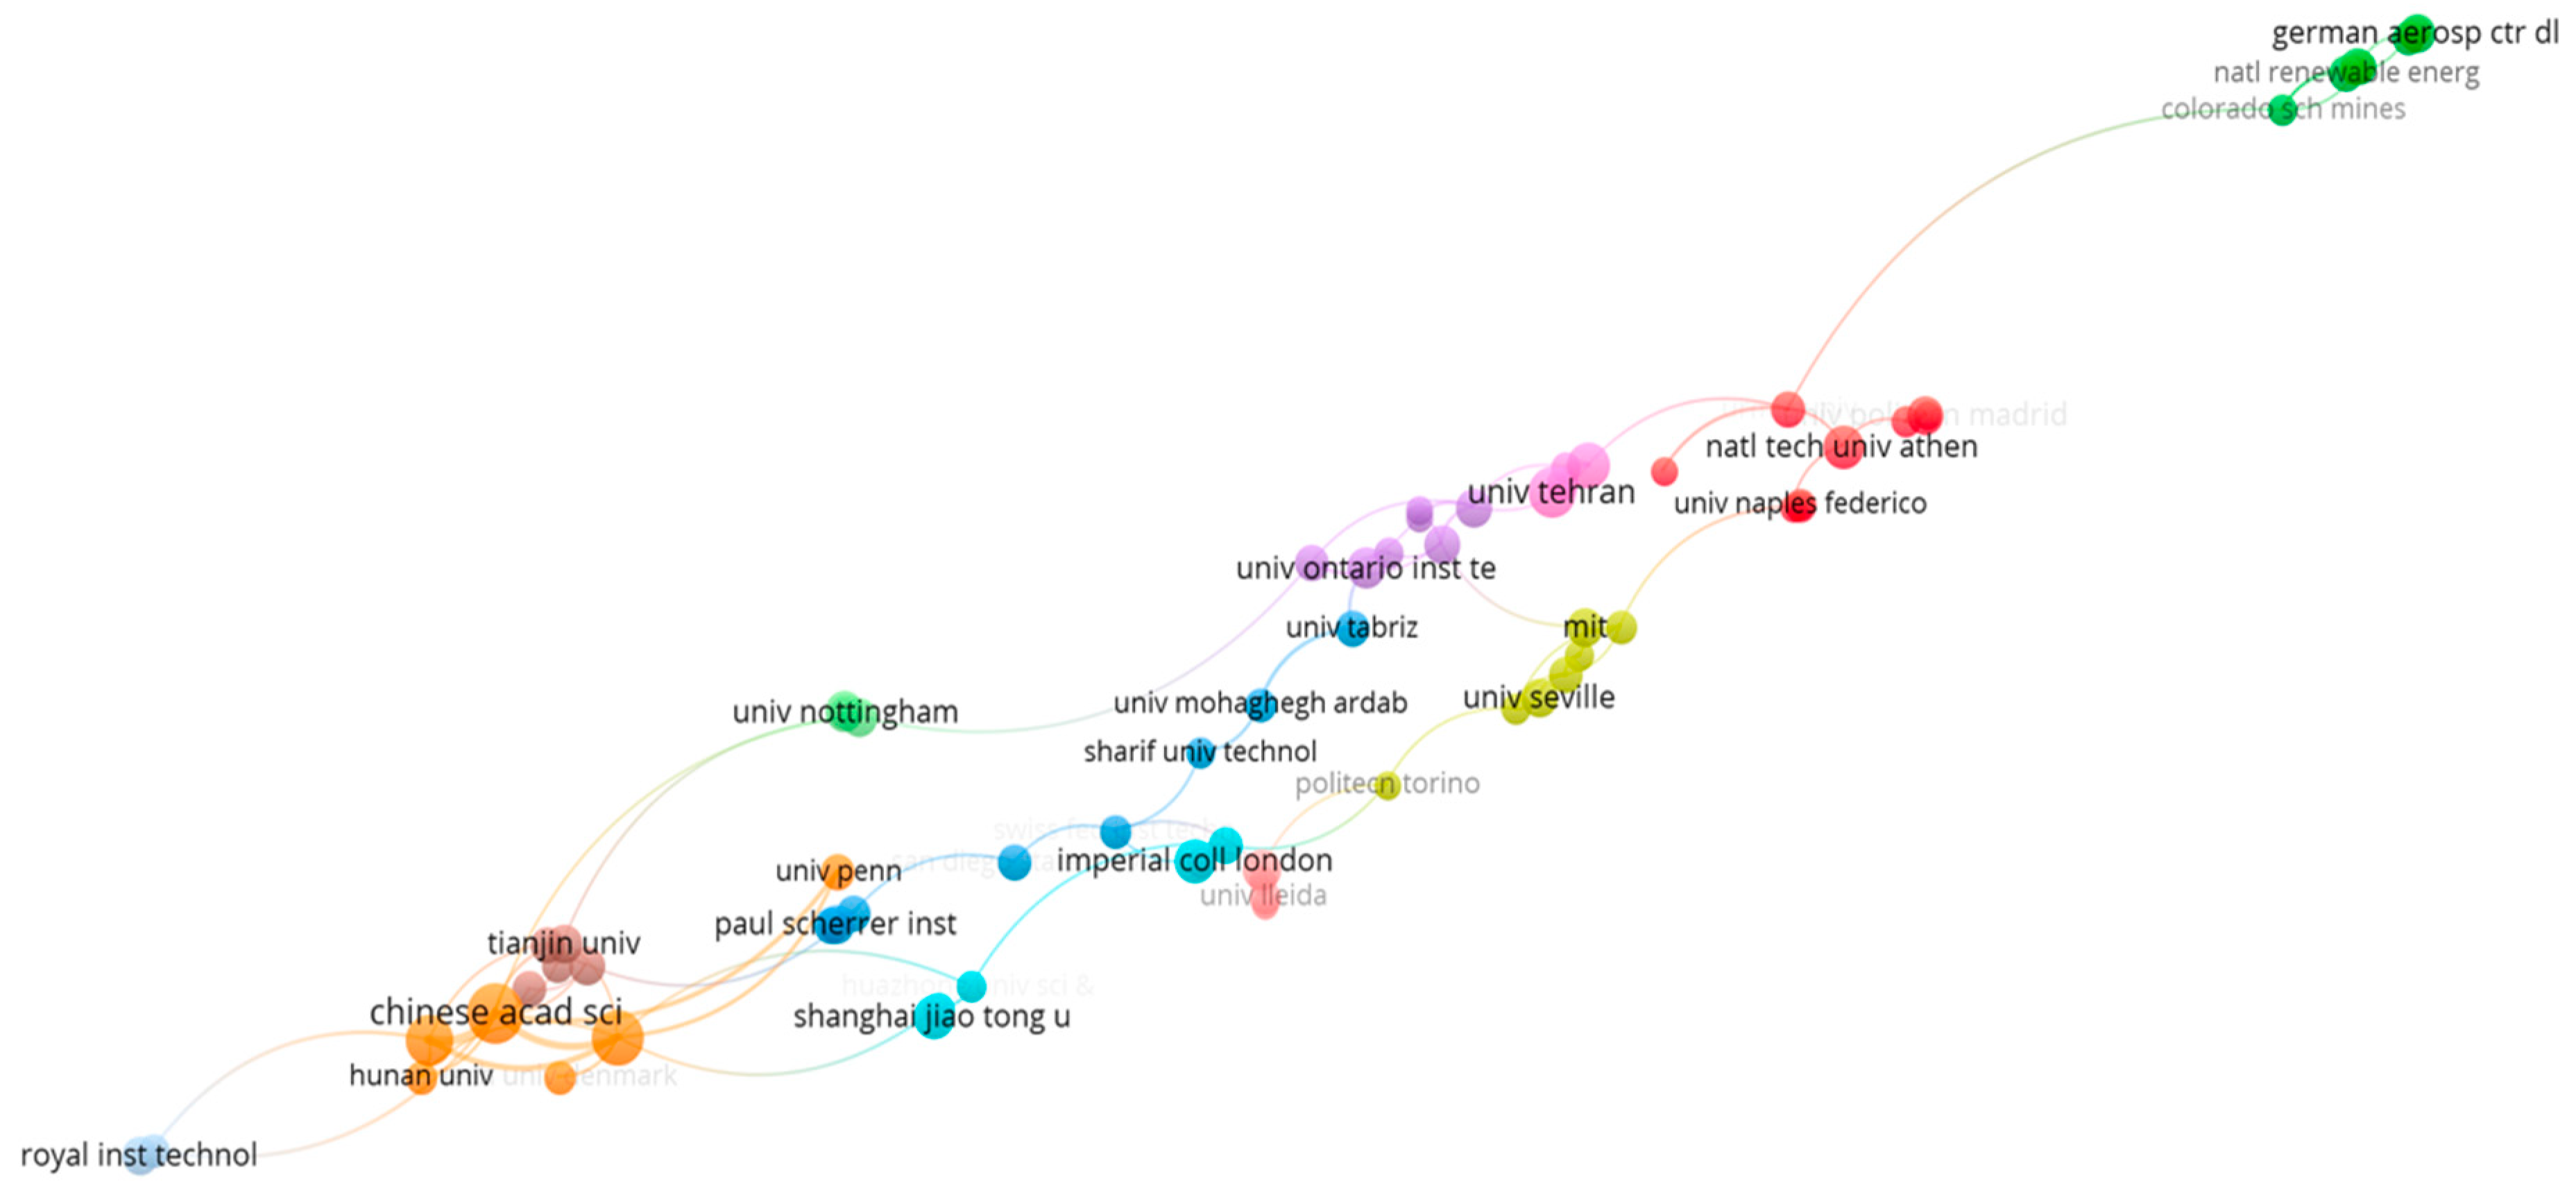
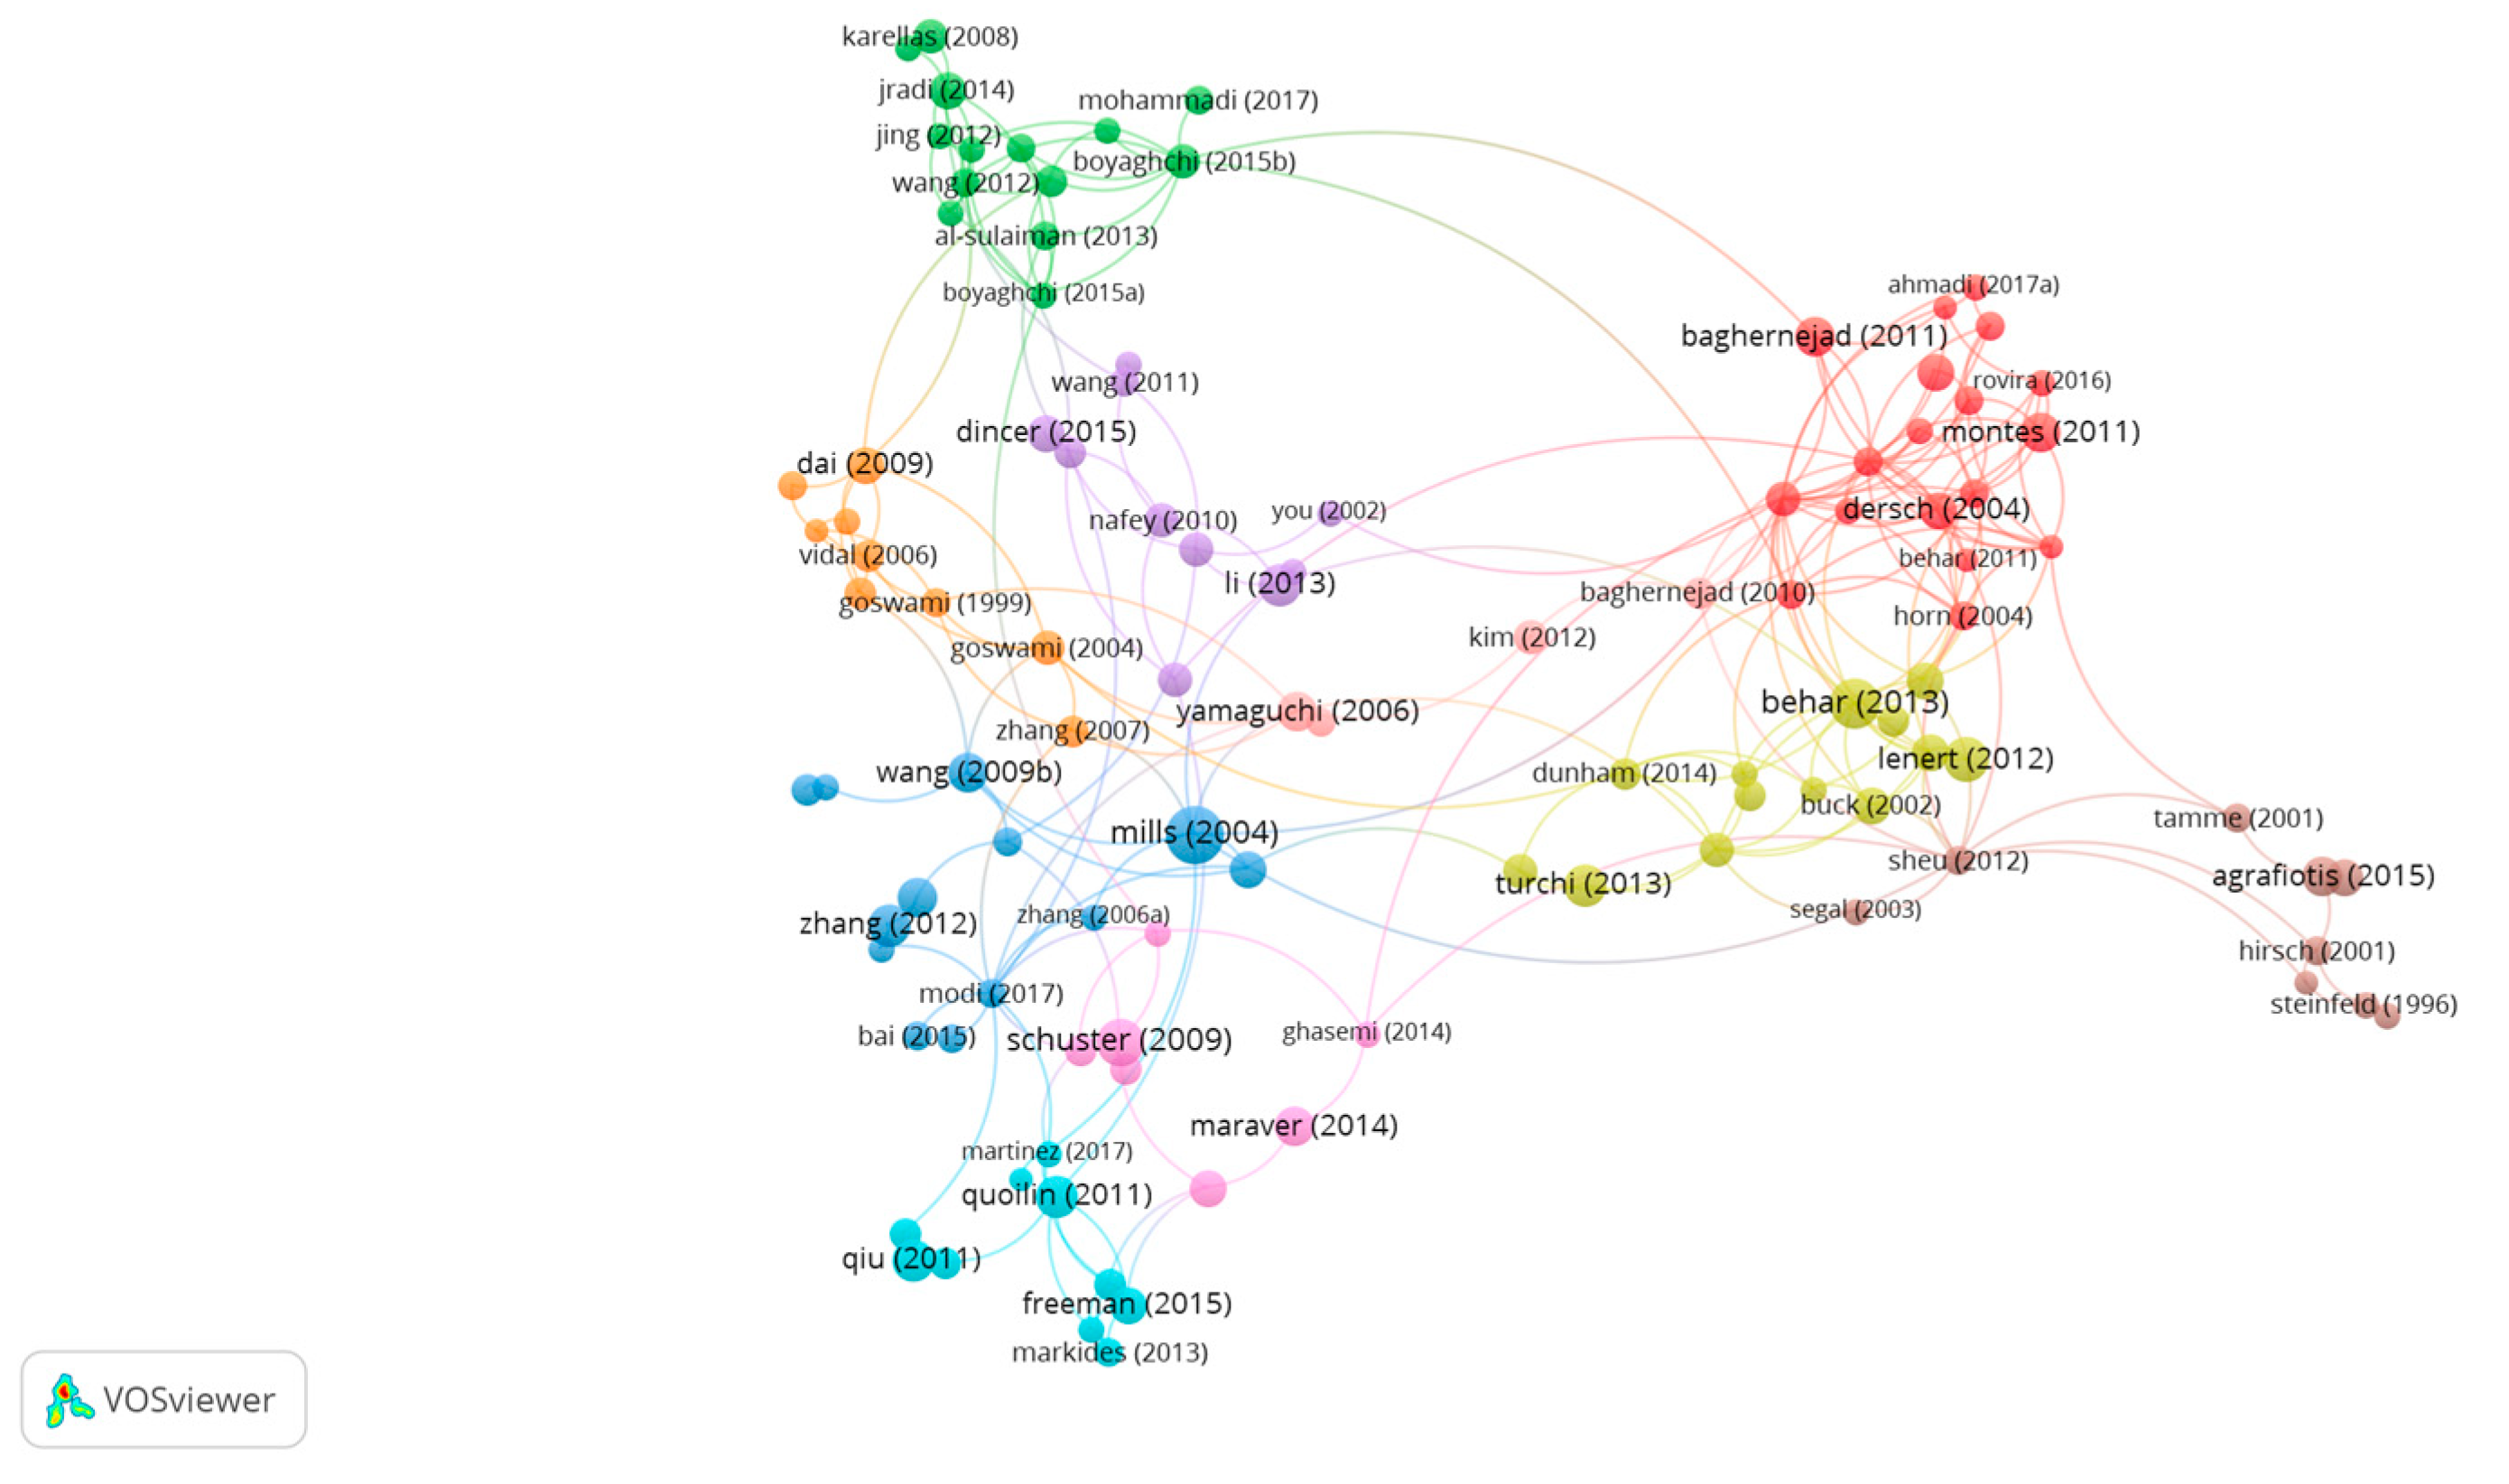
In that context, this paper aims to analyse the different approaches and the growing interest in the ISCC concept through a bibliometric study and the analysis of the publication trends in that topic. In order to do so, a data analytics study was performed, which provided some interesting facts related to which are the main working groups on ISCC topic, which are the most common keywords defining ISCC topics, or which are the main hubs, countries and connections among researchers. Those evidences will help to elucidate the research future of ISCC while helping scholars to focus their research in the CSP and renewable energy fields.
In that context, the bibliometric methodology that is described in this paper could serve as a tool for researchers to approach to any scientific topic from a Big data perspective. Indeed, during their whole scientific career, it is crucial for scholars to learn from relevant works from the same area of expertise, in order to discard, reject or support their assumptions based on similar research works. Usually, this stage is commonly known as the literature review, and it is the cornerstone of any research activity, from Masters theses, to PhD theses, to research papers, and it is even crucial for successful applications for project proposals and funding schemes. Despite the importance of that stage, the depth of that analysis depends in practice on previous expertise and personal experience, since it is typically addressed as a human-based activity that requires many years of experience. Nowadays, that exercise becomes even harder to attain, due to the increasing number of research papers being published, the appearance of new journals and platforms, and the infamous motto “publish or perish”. Fortunately, the developments on Big data, data mining and data analytics that have became popular in social networks analysis and in behavioural sciences [38] can be also applied to Energy research and other technical sciences. Big data treatment through nodes and networks analysis has great potential for engineering research applications, and in particular to the topic of ISCC, since it allows researchers and scholars to understand trends and topics related to ISCC technologies, nurture future collaborations among different research groups and researchers, and to increase their awareness on the topic’s importance. Last but not least, it establishes data analytics as one of the core activities of the scientific method by providing researchers a powerful, and yet unfamiliar, tool. Besides this, it is proposed as a methodology to thoroughly address a research topic that was rather manual, time consuming and biased, up until this time. The application of bibliometric studies for renewable energy topics is quite recent; some examples can be found, such as the use of community detection tools for scientific collaboration analysis [39], or keywords trend evolution for the study of interactions between the economy, energy and the environment [40]. Bibliometric studies have also shown their potential as a tool for the analysis of the research impact of a country [41], or to analyse the global transition to low-carbon electricity [42]. In particular, and related to solar energy, very few bibliometric studies could be found, with most of them having been published recently [43,44,45].
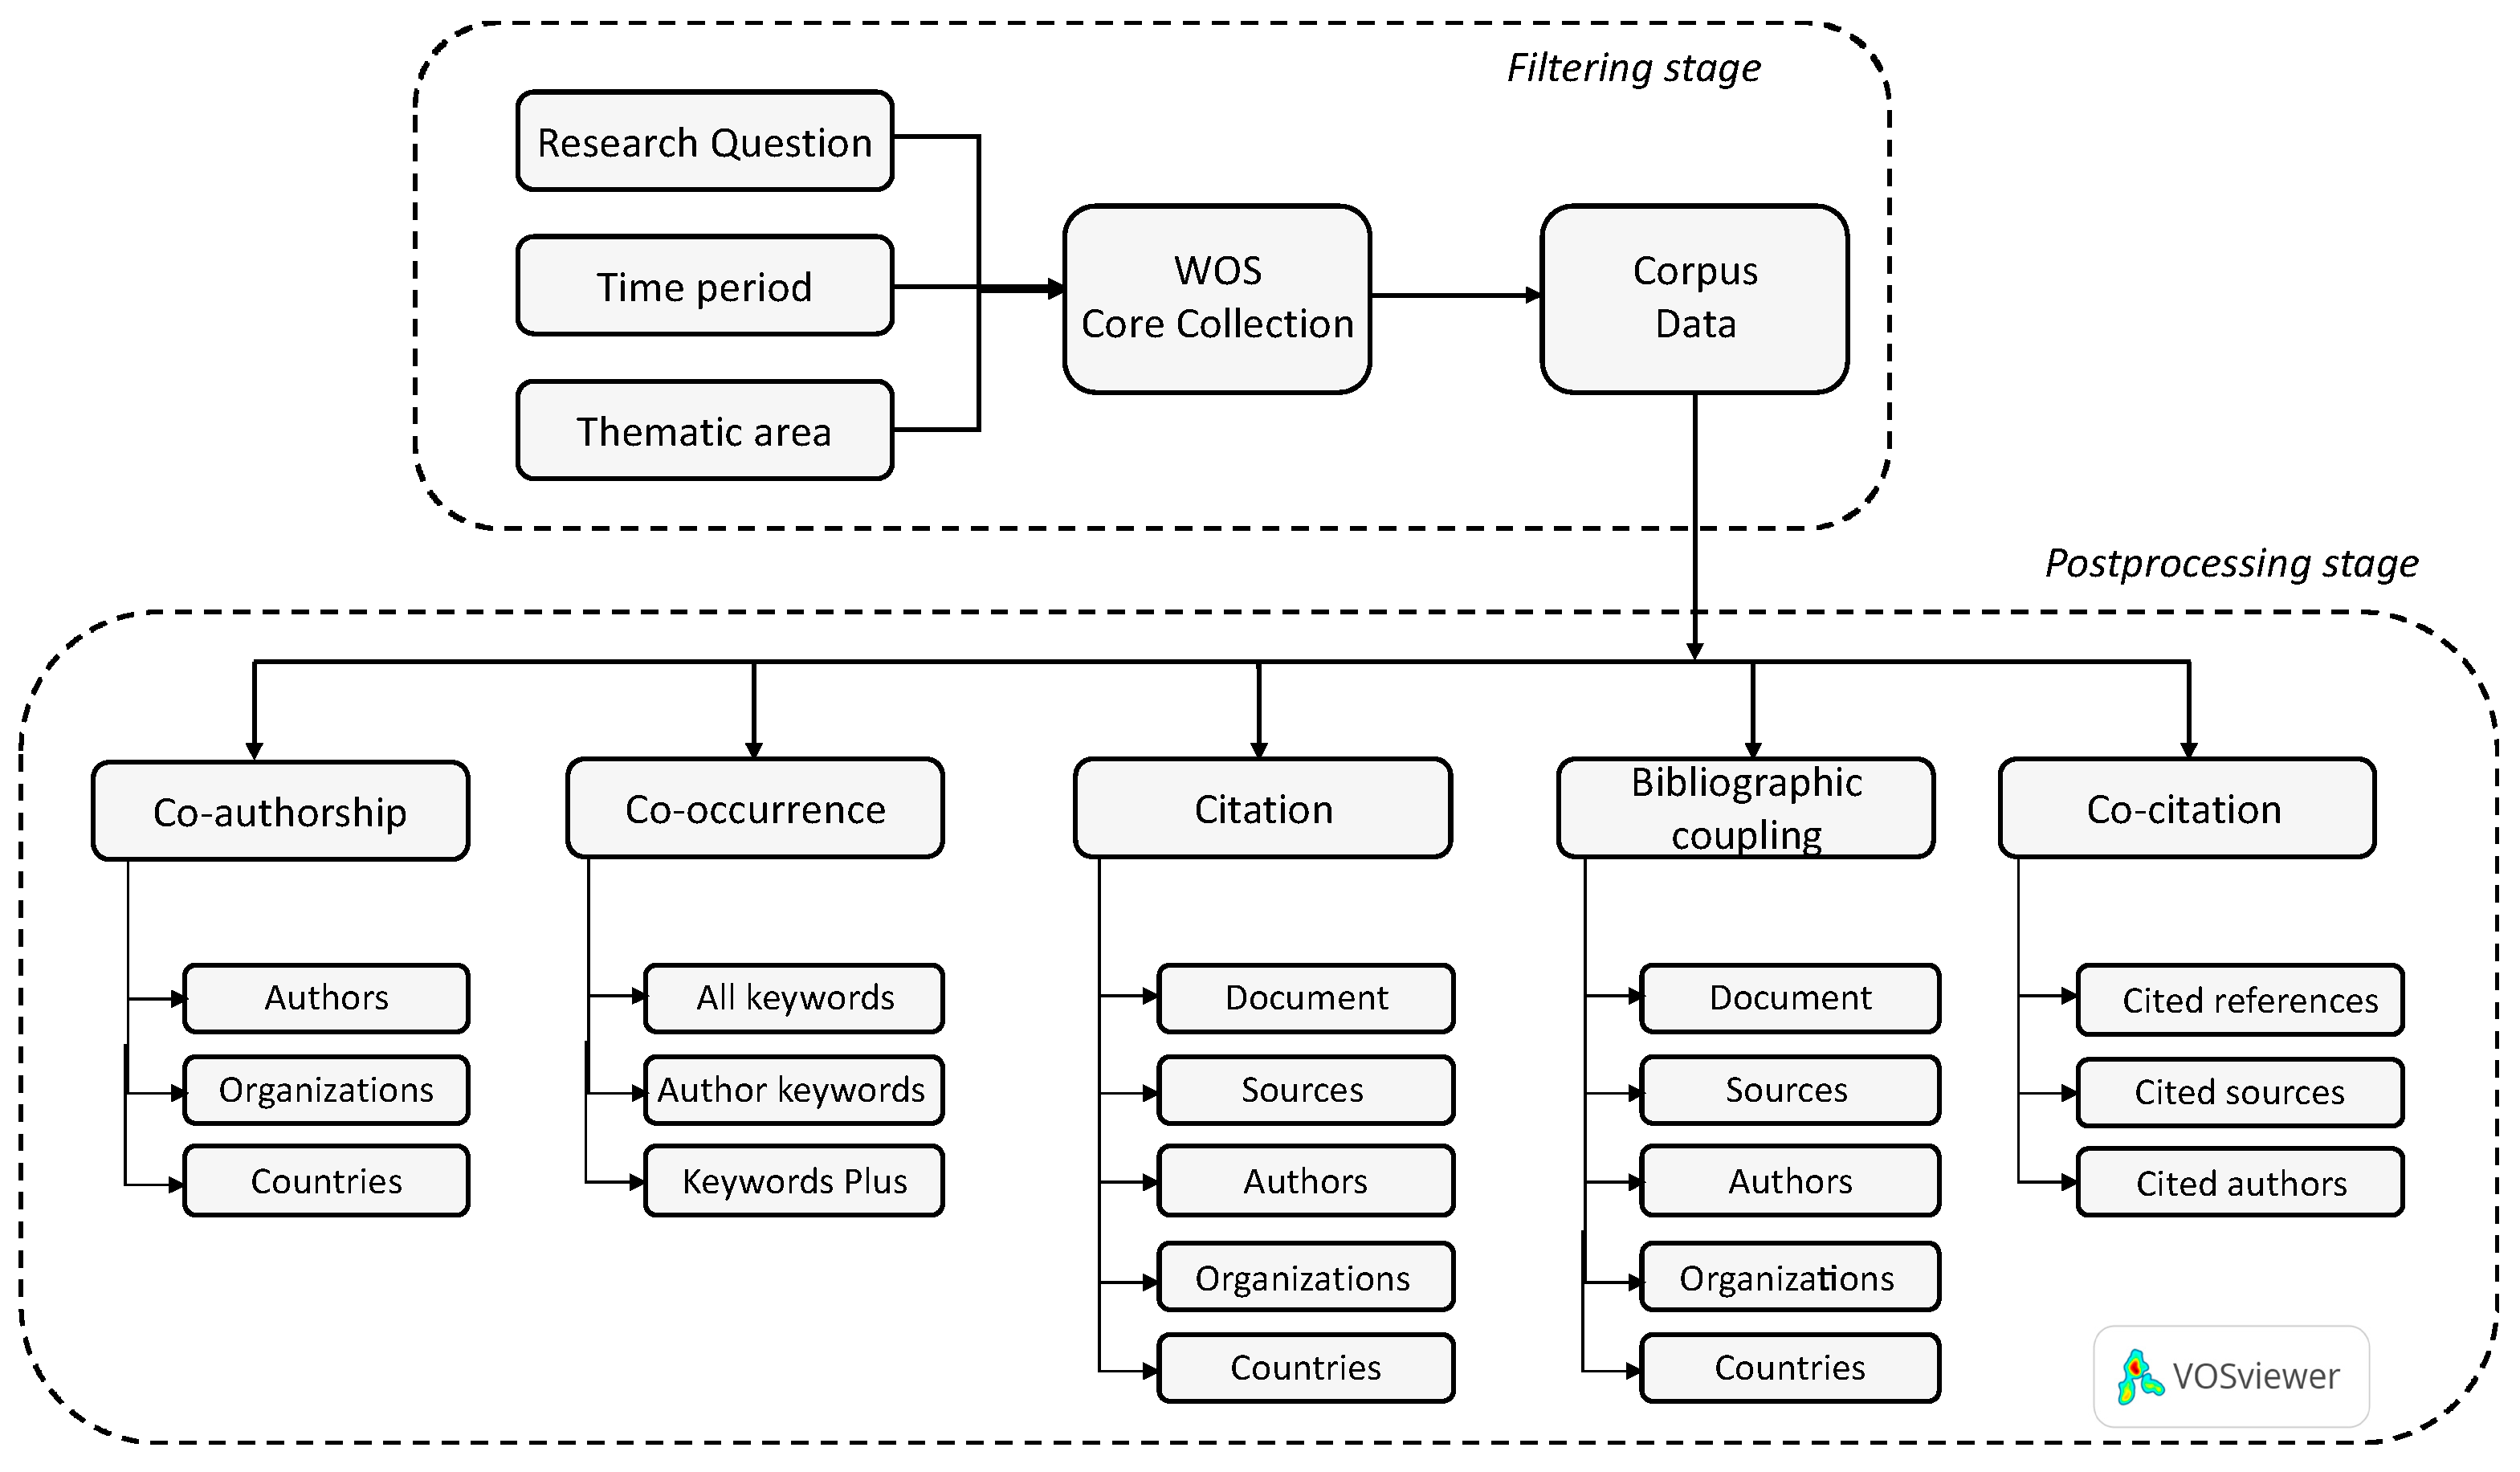
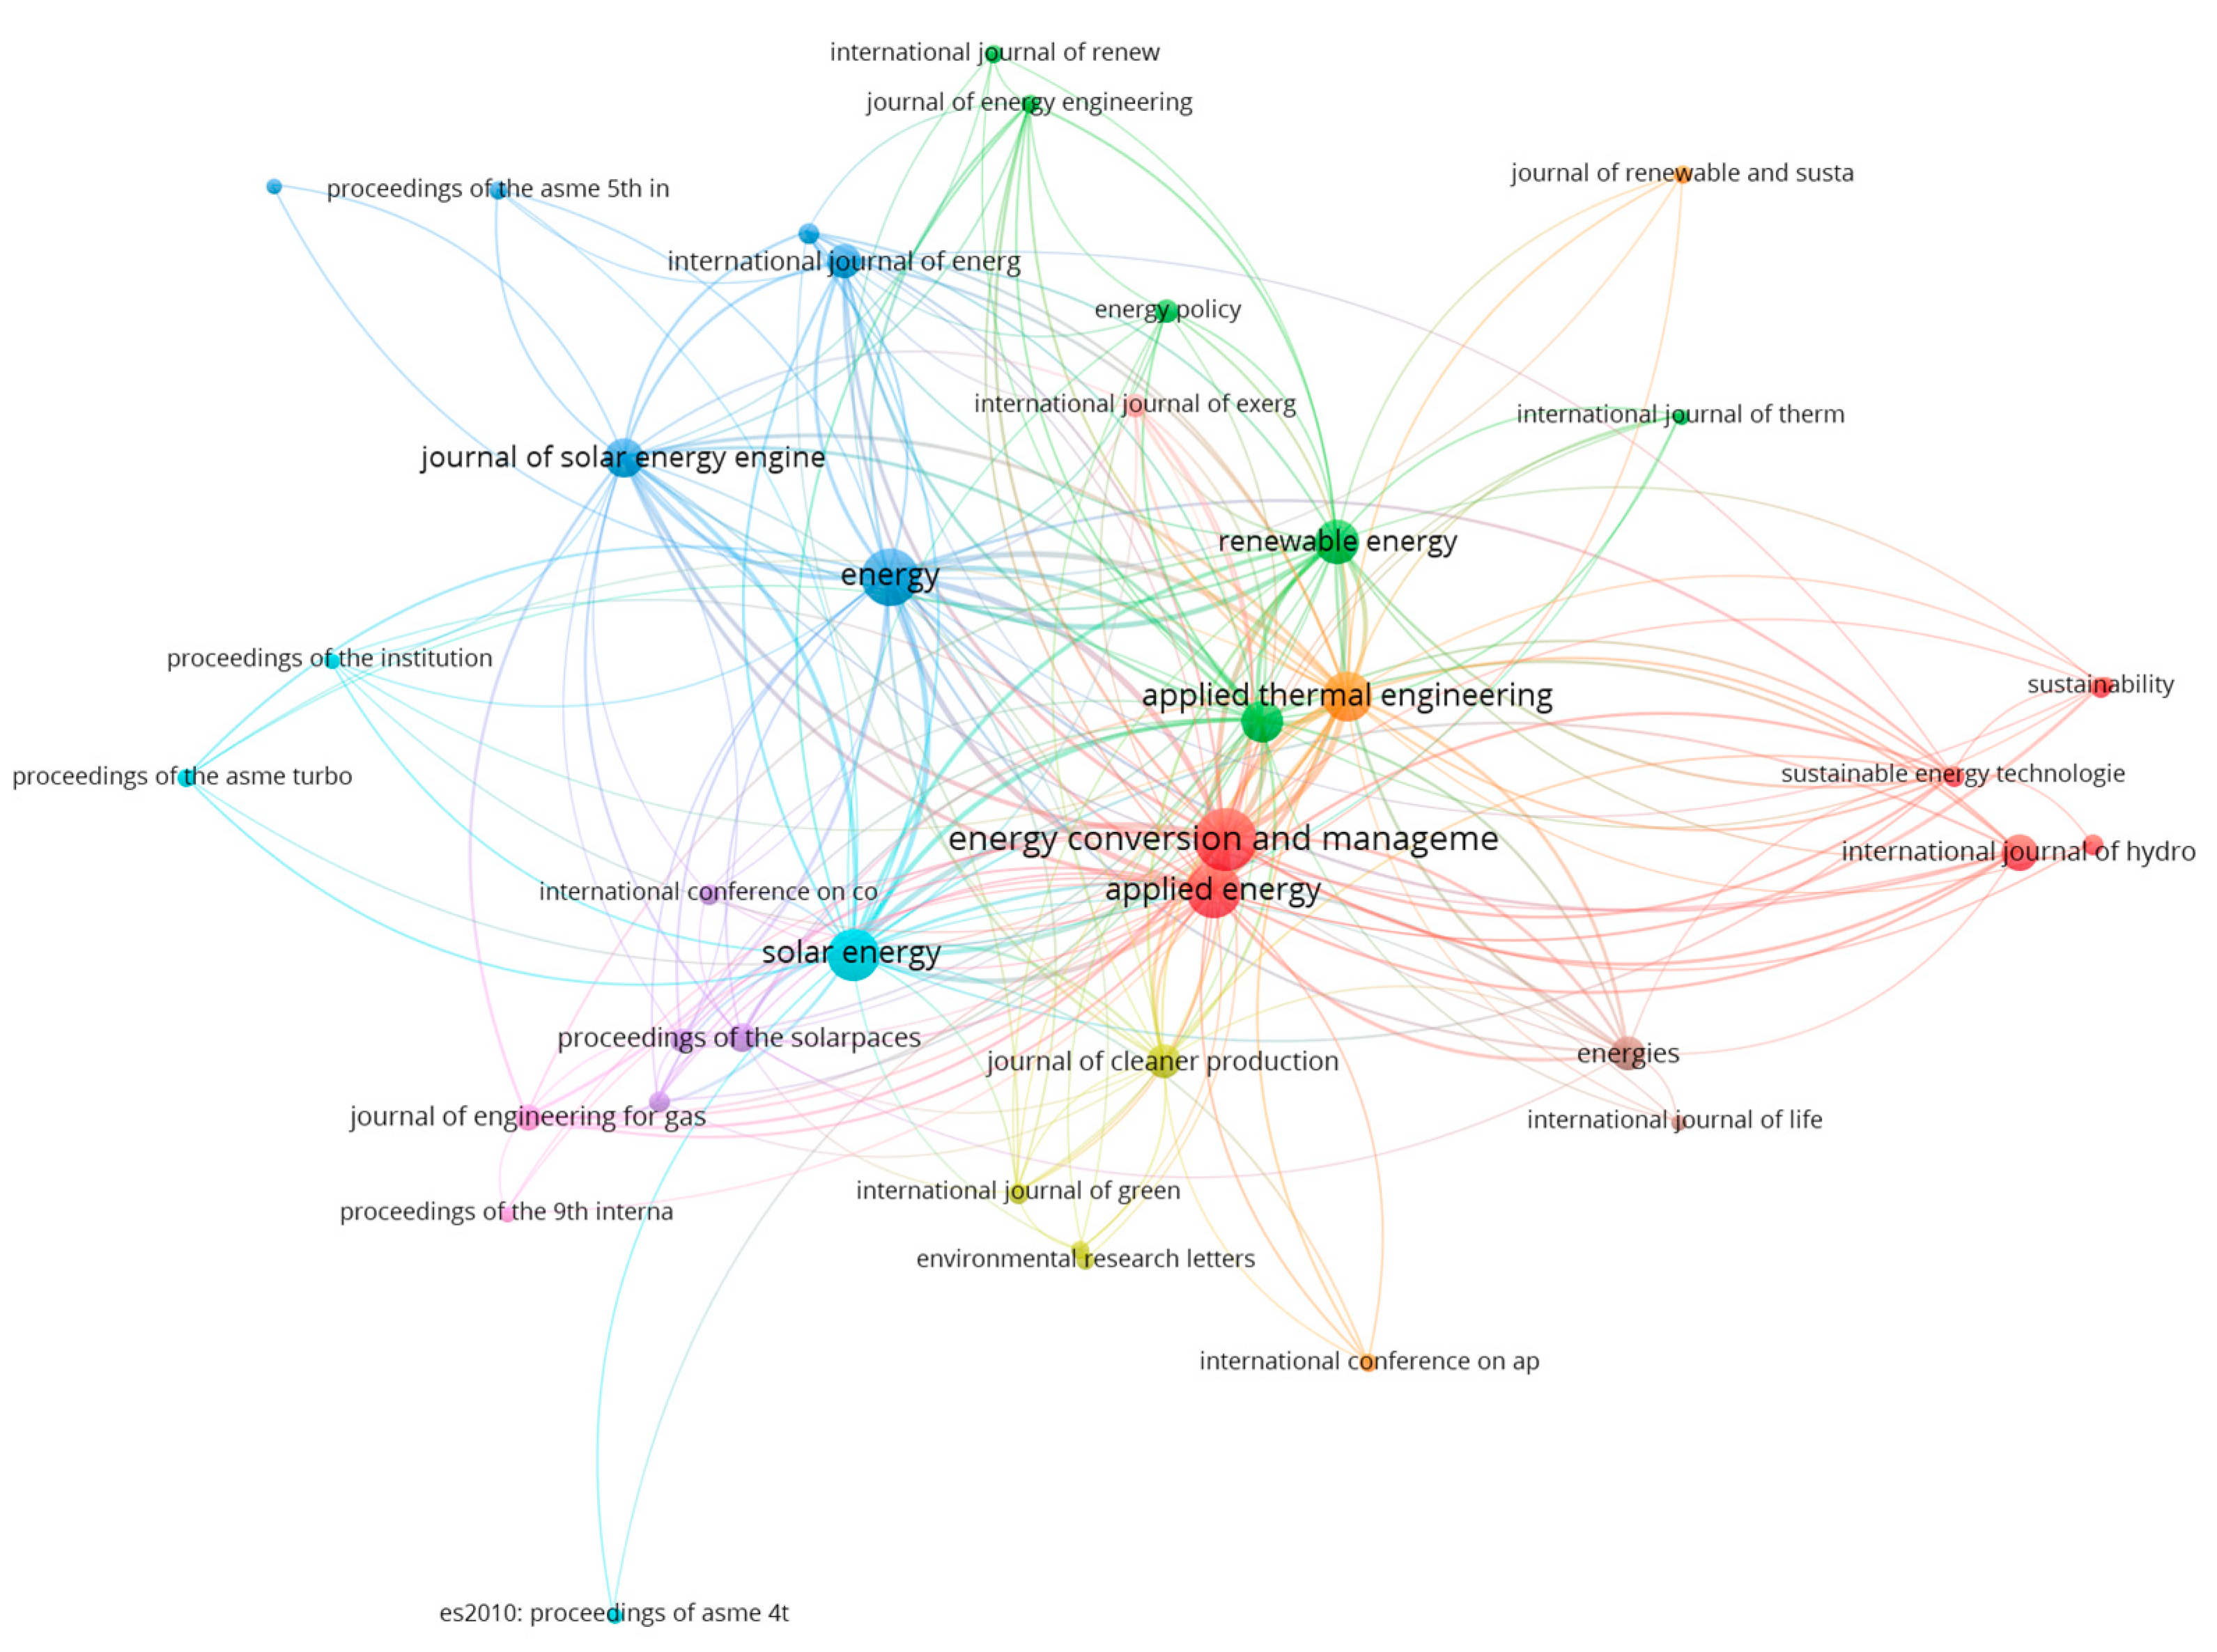
This paper has been organized according to the following structure; firstly, energy and technology contexts are presented. After that, the works’ relevance is discussed, together with the data mining source and the research method employed. Later, corpus data is analysed using VOSviewer software, which is a tool based on the use of network data for the creation of maps, and for visualizing and exploring them [46]. Finally, conclusions are drawn, and recommendations are compared to another hot topic in the CSP field.
2. Materials and Methods
2.1. Data Source
The data corpus used in this work was retrieved from the Web of Science (WOS) Core Collection using the search questions (keywords) “Integrated Solar Combined Cycle” and “Solar Combined Cycle” for the time period between 1990 and 2020 (only papers published before 14th of July were accounted for in the 2020 analytics). Both works published as journal articles and conference proceedings that can be retrieved from the WOS have been considered for the analysis. Figure 1 shows the distribution of the retrieved publications according to the WOS thematic areas, with the total number of publications for each category indicated between brackets. As it can be observed, the main topic area on ISCC publications refers to Energy Fuels (1161), followed by Thermodynamics (424), Mechanics (255), Engineering Mechanical (234), Green Sustainable Science Technology (228), Engineering Chemical (136), Environmental Sciences (81), Environmental Engineering (61), Chemistry Physical (47) and Electrochemistry (47).
Figure 1.
Corpus data according to the Web of Science thematic categories.
It must be pointed out that the number of publications indicated between brackets is not cumulative, since the same work might be classified under different categories in the WOS. Further refinement was applied in order to exclude the retrieved references that were related to different Integrated Solar Technologies, such as PV-only research. After that refinement, the total number of publications retrieved was 1277, which constitutes the data corpus for this study. Further insight into this search is shown in Figure 2, where it can be observed that 75.7% of the retrieved documents were journal articles, 18.9% were proceeding papers, and less than 5% were review papers. Editorial material, early access, corrections and notes accounted for less than 1% altogether.
Figure 2.
Distribution of the scientific production on ISCC, according to the type of document.
Figure 3 shows the publication and citation trends in Integrated Solar Combined Cycles (ISCC) over the last 30 years.
Figure 3.
Evolution in the number of publications related to the ISCC topic.
As it can be observed, the number of publications related to ISCC has significantly increased since 2011, and especially since 2016. In fact, a baseline of 100 publications per year was imposed from 2014 onwards, which gives an idea about the interest in that technology. In fact, this trend has already been kept in 2020, in which 100 ISCC publications were reported before 14th July. A similar trend can be found in the total number of citations, with more than 5500 in 2019. Both the increasing number of ISCC publications and citations agree with the trend observed in CSP’s installed capacity, which confirms the interest and deployment of the technology [47].
Figure 4 shows the summary report generated by the ISCC search on the WOS. As it can be observed, for the time period of the analysis, ISCC publications were cited 28,201 times in total in 17,768 different items indexed within the Web of Science Core Collection. Removing self-citation, that number was reduced to 24,934 citations in 17,010 different items. Dividing the sum of the times cited by the total number of publications results in an average of 22.08 citations per item, as can be observed in Figure 4.
Figure 4.
Citation report for 1277 results from the WOS Core Collection between 1990 and 2020, including the total number of publications, citations and average citations per item regarding the ISCC topic.
2.2. Analysis Methodology
For the data analytics, the data corpus retrieved from the WOS search was exported, including the full record and cited references to be analysed using the graphics analysis software. Save to other formats, the full record and cited references, and all of the data from those papers were exported, and were analysed using graphics analysis software. The VOSViewer [48] software tool was chosen, since it is a free software for constructing and visualizing bibliometric networks, and it also offers a text mining functionality that can be used to construct and visualize the co-occurrence networks of the relevant terms extracted from a body of scientific literature. These networks may for instance include journals, researchers, or individual publications, and they can be constructed based on citations, bibliographic coupling, co-citations, or co-authorship relations. A diagram of the methodology followed in this work can be found in Figure 5. As it can be seen, the first stage was comprised of filtering the data using the research question, time period and thematic areas applied to the WOS Core Collection. The result of that filtering stage is the corpus data of the ISCC topic. That corpus data was analysed applying different bibliometric indicators and using the VOSviewer tool for networking mapping.
Figure 5.
Methodology diagram.
3. Results
Several indicators were considered for the bibliometric network study, including co-authorship analysis, co-occurrence analysis and citation analysis, among others. Each study can be appointed by using different units of analysis, such as authors, sources, organizations, countries, documents or keywords.
3.1. Co-Authorship Analysis
For the analysis, papers with a large number of authors were ignored by applying a threshold of 25 maximum authors for a single publication. In addition, full counting criteria were applied in the analysis, which means that if an author co-authors a document with, for example, 10 other authors, each of the 10 co-authorship links has a weight of 1 instead of a 1/10. That has an impact in bibliometric network construction, since links’ thickness and node sizes depend on that counting. Applying that criterion, a total number of 3568 different authors have ever published at least one paper related to ISCC topic, as can be found in Table 1. Indeed, this table shows the number of different authors fulfilling a minimum publication criterion applied to the ISCC corpus data.
Table 1.
Authorship publications filtering criteria.
As it can be deduced, a total number of 3568 authors have one publication related to the ISCC topic, and this number is reduced down to 576 for authors with two publications, and to 71 authors with five publications. There were only eight authors with 10 publications published on the ISCC topic since 1990. Those numbers do not consider any other requirement regarding the minimum number of citations of an author. In order to account for the relevance of their works, a minimum criterion of at least 10 citations of an author’ documents (according to the WOS) was considered. As it can be observed, the impact of that filtering is only noticeable for those authors holding just one publication, which reduced author number by half.
For co-authorship networking mapping, a minimum number of two publications per author with 10 citations was chosen, which gives a significant number of nodes meeting the thresholds (460). For each of the 460 authors, the total strength of the co-authorship links with other authors was calculated. Some of the authors in the network are not connected to each other in the graph, since they may have cited different authors that did not meet the minimum number of publications and citations criteria. The largest set of connected items consists of 241 items that were finally represented in the network map on Figure 6. This graphical information is useful for ISCC researchers and scholars, since it provides a clear idea about who the main authors publishing in this topic are, and the connections (citations) among them. Furthermore, the size of each node is related to the number of publications. Table A1 from Appendix A contains detailed information about the clusters shown in Figure 6.
Figure 6.
Co-authorship network for those authors who had published more than two ISCC papers.
As it can be observed in Figure 6, some western authors appeared to be duplicated since they signed their documents using different initials, which is considered as two different authors by the software. The software allowed us to get rid of a researcher’s first name and replace it by its initial, which would lead to an incorrect analysis, mainly with regard to Asian researchers. In order to verify the quality of the results, the generated table of authors was analysed, and the duplicate cases were revised, such as the ones found corresponding to renowned authors I. Dincer, who also published as Ibrahim Dincer; A. Steinfeld, who published as A Steinfeld; or D. Yogi Goswami, who also appeared as Dy Goswami. Applying that filter to the co-authorship network, a version of Table 2 including the top authors in ISCC was created. Another interesting parameter that can be deduced from Table 2 is the average number of citations each ISCC paper from those renowned authors received. As it can be seen, the highest ratio corresponds to D. Goswami and A. Steinfeld, with more than 50 citations for each ISCC paper, while the lowest ratio for the top 10 author list is 6.7 for B. Laumert at The Royal Institute of Technology, KTH.
Table 2.
Top 10 authors on ISCC topics.
Regarding the co-authorship analysis by organizations (authors’ institutions), there were 1102 different institutions that had published at least one paper on the ISCC topic. However, only 85 of them published at least 5 publications, as can be observed from Table 3.
Table 3.
Institutions publishing on ISCC topic by filtering criteria.
A minimum number of 5 publications (and 10 citations) were chosen for the bibliometric analysis, which resulted in 85 nodes. Some of them were not connected in the network, since they did not meet the publication criteria or did not cite any of the other filtered groups. Therefore, the largest set of connected items (69) was represented instead in Figure 7. Based on that figure, the different collaborations among the institutions can be observed. This kind of analysis is relevant because it allows scholars to identify the main institutions publishing on ISCC (nodes size) and linking relations (citations) among them. For example, Universidad Politécnica de Madrid had joint publications in ISCC together with Universidad Carlos III and UNED. Meanwhile, North China Electric Power University had joint publications in ISCC together with Hunan University, the Chinese Academy of Sciences, Tianjin University, Nanyang Technology University, Huazhong University, the University of Pennsylvania and the Technical University of Denmark. Table A2 from Appendix A contains the detailed information about the clusters shown in Figure 7.
Figure 7.
Organization network for those groups which have published more than five ISCC papers.
Based on that analysis, it can be observed, in Table 4, that the Chinese Academy of Sciences is the main institution regarding ISCC publications, with 52 contributions in total (and another 28 under the University of Chinese Academy of Sciences affiliation). As it can be observed, five out of the first 10 institutions publishing about ISCC are from China. Another interesting parameter that can be deduced from Table 4 is the ratio between the number of total citations per institutions and the number of published papers. As it can be observed, institutions with fewer publications in Table 4 (National Technical University of Athens and Xi’an Jiao Tong University) exhibit the higher ratio, with almost 40 cites per document; on the contrary, the Chinese Academy of Sciences—which was the institution with more publications (52) and more citations (736)—got the lowest ratio, with around 14 cites per document.
Table 4.
List of top 10 institutions publishing about the ISCC topic, by filtering criteria.
Those numbers were also confirmed through a co-authorship analysis based on the different countries. As it can be observed from Table 5, the corpus publication on ISCC came from 78 different countries. That number was reduced to 43 countries with five publications on that topic, and to 31 countries with ten publications. There are seven countries with at least 50 publications, and only four countries published 100 or more papers on the ISCC topic.
Table 5.
Countries publishing on ISCC, by filtering criteria.
As it can be observed, when the criterion about having at least 10 citations by country is introduced, the number of countries meeting the requirement reduces to 68, and if the number of citations is increased to 100, the number is reduced to 38. As the number of publications increases, (above 10) the citation criteria show no effect. For networking mapping representation, a minimum number of five publications with 10 citations by country was chosen, which lead to 43 nodes. However, the largest set of connected items consists of 42 items (Morocco is the only country not meeting the criterion) that were chosen for the graphical representation in Figure 8. This kind of analysis is relevant because it allows an understanding of the main connections (citations) between different countries, and the identification of common collaborations among research institutions. Table A3 from Appendix A contains detailed information about the clusters shown in Figure 8.
Figure 8.
Co-authorship map regarding countries’ connections.
From Figure 8, the level of collaboration (nodes linking) among different countries in joint publications regarding the chosen criteria (at least five joint publications with a minimum number of 10 citations per country) can be deduced. In the case of Spain, its node is connected with another 19 nodes: France, Israel, India, Egypt, Canada, England, Sweden, Iran, China, the United States, Denmark, Norway, Belgium, Chile, Greece, Germany, Italy, the Netherlands, and Switzerland, which confirms a high level of collaboration with other countries in joint publications. On the contrary, Algeria only had joint publications with France (meeting the chosen criteria), and Jordan only had publications with Poland and United States.
Table 6 shows the top 10 countries publishing on the ISCC topic; as it can be observed, China is the main contributor in this topic, with 241 papers and 4108 citations in the last 30 years, followed by the United States (202), Spain (115) and Italy (102). Another interesting parameter that can be inferred from Table 6 is the ratio between the total number of citations and the number of documents. At one end, Germany is the 6th country in terms of ISCC research, with 83 publications (most of them from the DLR German Aerospace Centre). However, each of those publications was cited almost 30 times on average. On the contrary, Indian publications on ISCC were cited 12 times on average.
Table 6.
The main countries publishing on the ISCC topic.
3.2. Co-Occurrence Analysis
A co-occurrence analysis was performed based on all of the keywords, with a full counting method. Considering all of the appearing keywords, Table 7 shows the number of occurrences of a keyword. As it can be observed from the table, there are at least 4534 different keywords that appear at least once in the data corpus (1277 total publications). This results in an average number of 3.55 keywords per publication. In order to consider only the more relevant keywords, a minimum number of occurrences was considered. In doing, so it can be concluded that 394 different keywords appeared in at least in five different papers, 71 appeared in at least 25 papers, and six keywords appeared in 100 publications from the corpus.
Table 7.
Minimum number of occurrences of a keyword.
For the network graph representation, the 100 most common keywords were chosen, as can be seen in Figure 9. As it can be observed, most of the keywords are related to modelling topics based on keywords like ‘optimization’, ‘design’, ‘exergy analysis’, ‘thermodynamic analysis’, ‘multiobjective optimization’, ‘model’, or ‘simulation’. Apart from those common keywords, some others, such as thermoeconomic analysis, performance analysis, exoergonomic analysis or parametric analysis also appeared in Figure 9. Despite the abundance of keywords related to modelling and simulation, another series of keywords related to different technologies such as direct steam generation, CO2 capture, hybrid plants, biomass or desalination also appear which gives an idea of combined applications of ISCC with other technologies. This kind of analysis and graphical representation is relevant because it allows us an understanding of the connection (co-ocurrence of keywords) between the topics of ISCC research. As it can be observed, a clear interest for low and medium temperature applications of ISCC is also evident from the occurrence of keywords such as ‘parabolic trough’, ‘organic Rankine cycles’, ‘combined heat and power’ and ‘cooling and refrigeration’. Table A4 in Appendix A contains detailed information about the clusters shown in Figure 9.
Figure 9.
The 100 most common keywords used for ISCC topics.
Table 8 summarizes the list of the top 10 keywords and their frequency of occurrence. As was mentioned above, most keywords are related to simulations, such as ‘optimization’ (249 times), ‘performance’ (237), ‘design’ (175), ‘exergy analysis ‘(98) and ‘thermodynamics analysis’ (94). We can also observe the growing interest in low grade heat energy recovery at ISCC by the high occurrence of the ‘Organic Rankine Cycle’ keyword (94).
Table 8.
Top 10 list of keywords in ISCC topic publications.
3.3. Citation Analysis
Citation bibliometric mapping can be performed through different units of analysis: documents, sources, authors, organizations and countries. Based on the number of documents, it is clear that there are 1277 publications with a minimum number of citations of 0 (the total corpus); meanwhile, 833 publications were cited five times, 392 publications were cited 20 times, 152 publications were cited 50 times, and 52 documents accumulated 100 citations each, as can be observed in Table 9.
Table 9.
Citation analysis.
The publications with 50 or more citations were selected for the networking mapping; according to Table 9, there are 152 publications meeting that requirement. Furthermore, the tool suggests the representation of only the largest set of connected items, which numbers 107. In other words, 107 publications with 50 citations (or more) each out of the 152 publications cite at least to one of the other works from that list, so that a link between two nodes will exist, as can be observed in Figure 10. This kind of analysis and graphical representation is relevant because it allows us an understanding of how the most relevant publications (in terms of the total number of citations) are connected to each other. Table A5 in Appendix A contains detailed information about the clusters shown in Figure 10.
Figure 10.
Publications with more than 50 citations, and their connections.
As can be observed in Figure 10, there is a high interconnection among the nodes, which means that the most cited articles cited each other. Furthermore, each node contains full reference information and the hyperlink to the internet website hosting the article. The latter is very practical since one can quickly access to the full publication online. From the analysis, it can be concluded that the most cited articles are Mills (2004) [49], with 472 citations, and Behar (2013), with 335 [50]. The detailed list of the most cited articles retrieved from the WOS on the ISCC topic are gathered in Table 10.
Table 10.
Most cited articles retrieved from the WOS related to the ISCC topic.
Based on the sources—which means journals and indexed conference proceedings at the WOS—a total number of 129 different sources were retrieved for ISCC related publications. Figure 11 shows the network mapping for all of the sources with five or more publications in common (41). Nevertheless, the largest set of connected items that is represented in the network numbers 39. That map also contains information about the relevance of each node (publications of each source) and the connection between the journals. This refers to which journals were cited by each node; for example, publications from the Sustainability node cited publications from Renewable Energy, Energy, Applied Energy, Energy Conversion and Management, Sustainable Energy Technologies and Energy Technology, or vice-versa, which is translated as a link between those nodes. This kind of analysis and graphical representation is relevant because it allows us an understanding of which sources are the most cited, and how those sources are connected (citations) amongst themselves. Table A6 in Appendix A contains detailed information about the clusters shown in Figure 11.
Figure 11.
Most frequent sources of publications and their connections.
Based on the information provided in Figure 11, summary Table 11 is provided in order to analyze the most frequent sources for publications on the topic of ISCC. The information was sorted in terms of the total number of documents. As it can be observed, Energy Conversion and Management was the preferred platform for ISCC publications (158 documents) whereas Solar Energy was the source that received more citations (4438 citations). In order to normalize that information, the ratio of citations per document was introduced. As can be observed, papers published in Renewable and Sustainable Energy Reviews received the highest number of citations, with almost 54 cites per published document on average, followed by Solar Energy, with almost 44. On the other side, ‘Energies’ showed the lowest ratio, where each of their ISCC related publications (33 documents) received an average of four citations.
Table 11.
Most frequent sources for ISCC topic publications.
4. Discussion
The results presented in Section 3 (Results) and the tables gathered in 
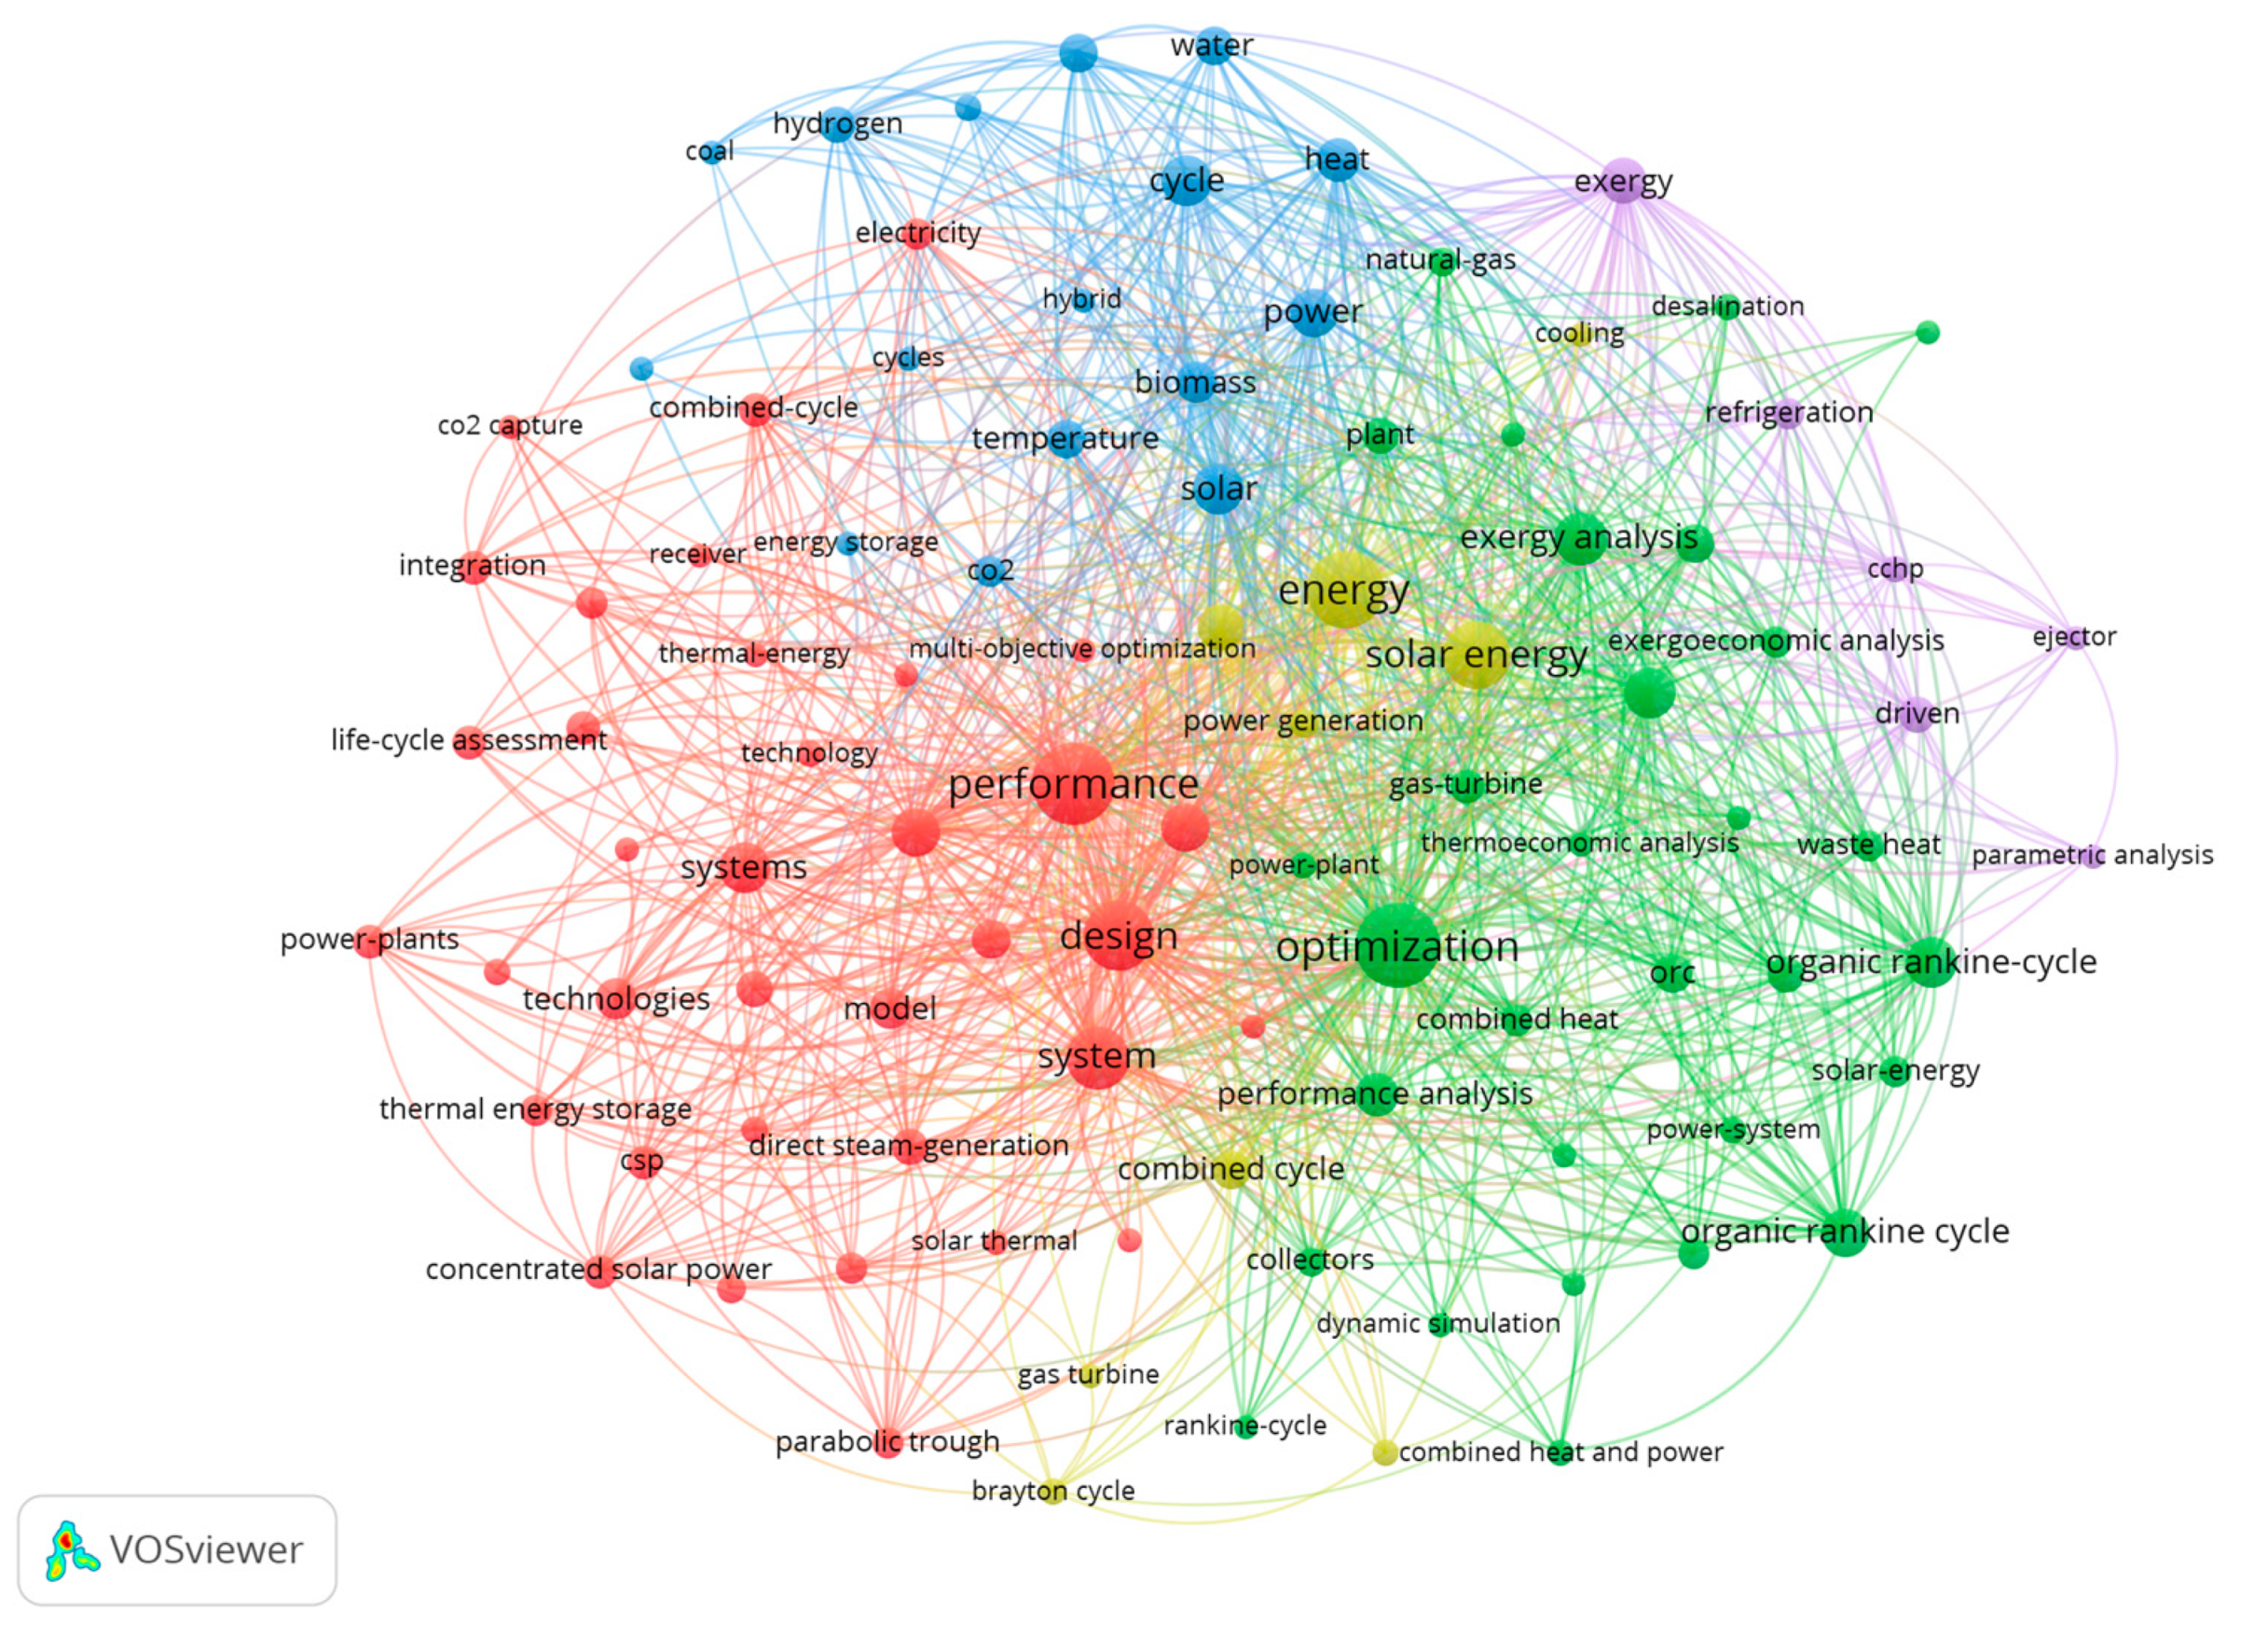
Appendix A are relevant for solar energy scholars because some trends and research topics can be derived from them. Based on the detailed keyword information presented in Table A4, it can be deduced that most publications addressed modelling and performance optimization, with 857 keyword appearances. In particular, medium and low temperature studies were performed, as is indicated by the 59 keyword appearances for ‘parabolic trough studies’ and 246 keyword appearances for ‘Organic Rankine Cycles’ (ORC). Furthermore, a great interest in ISCC applications for combined heat and power generation as related keywords appear in 217 publications. It is also relevant that thermal energy storage studies were applied to ISCC topics, with 165 publications including related TES keywords. Hydrogen production was also related to ISCC publications, with 99 keyword appearances. To a lesser extent, ‘life-cycle-analysis’ (LCA) was considered for ISCC studies, with 82 keyword appearances. The less studied topics related to ISCC were ‘desalination’ (26 keyword appearances), ‘phase-change material energy storage’ (24 keyword appearances), ‘CO2 capture’ (22 keyword appearances) and ‘hybrid plants’ (20 keyword appearances).
In this section, the ISCC topic is also compared to another hot energy topic: supercritical CO2 cycles (sCO2). As it was referred to in the introduction, sCO2 cycles for electricity production are one of the hottest research topics, with a clear interest for CSP application. Furthermore, both technologies are highly efficient and advanced solutions for electricity generation, both are of interest for CSP applications, and, in some cases, they were studied together. For this reason, the bibliometric study presented in this work was compared to recent bibliometric study for sCO2 [31].
For comparison purposes, bibliometric indicators such as the number of publications, the total number of citations, authors, institutions, countries, and the most relevant publications were compared and analyzed for both technologies, and are gathered in Table 12. The bibliometric parameters and indicators were normalized due to both studies covering a different period of time; for the case of this work, the ISCC publications were collected from 1990 to July 2020, while for the sCO2 bibliometric analysis, the timespan covered 2000 to 2019.
Table 12.
Comparison between ISCC and sCO2 topics in terms of publications and citations.
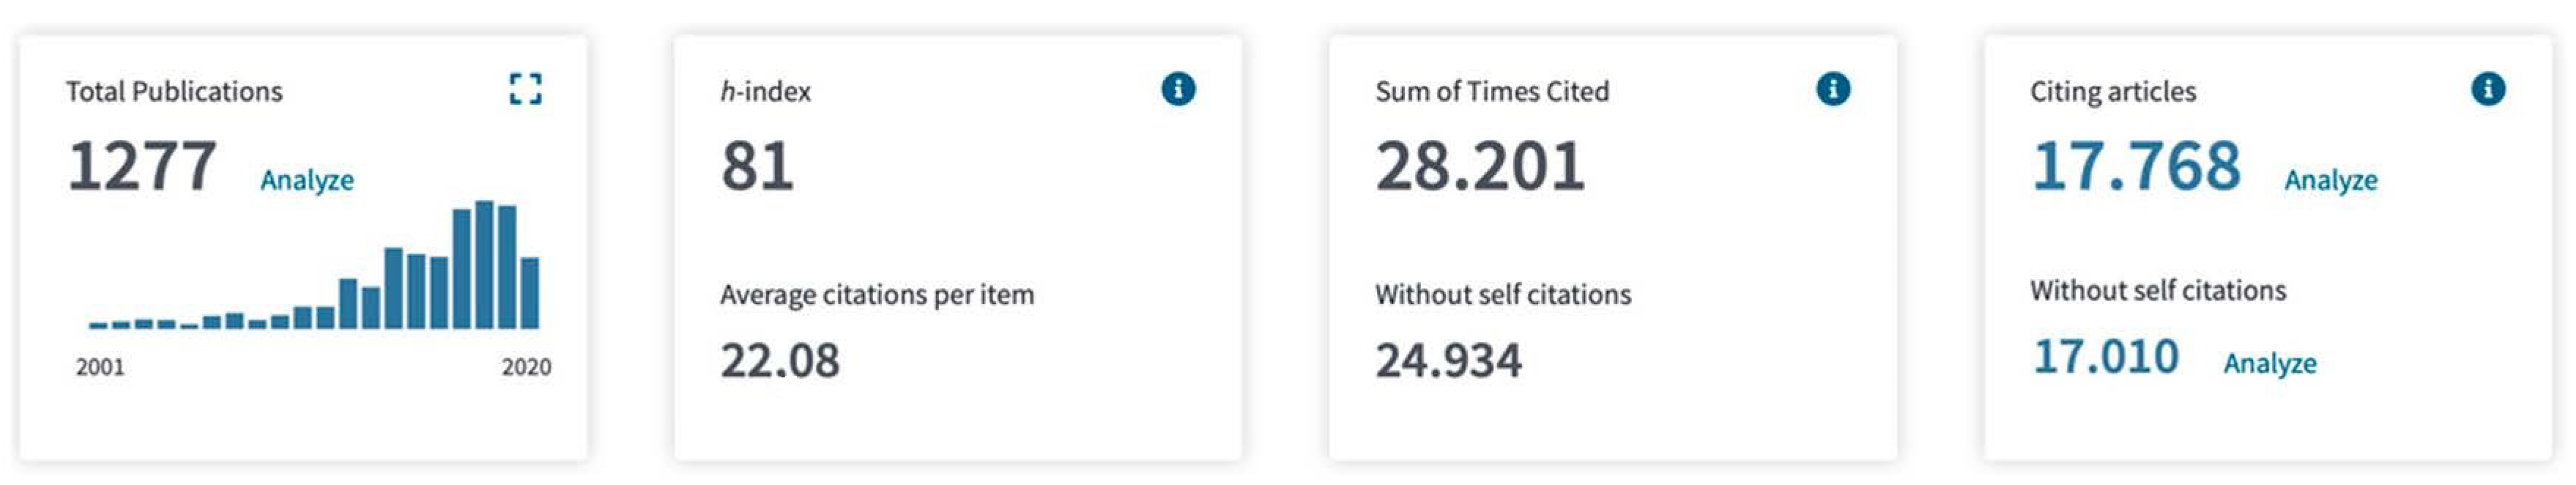
As it can be observed in the table, both technologies are hot topics for Energy research, with 1277 ISCC publications and 724 for sCO2. Furthermore, those topics have grabbed the attention of a large number of researchers and institutions from all over the world. In general, it could be said that the ISCC topic involved double the number of researchers and institutions compared to the sCO2 topic. However, if normalized indicators are compared, similar numbers can be observed, such as, for example, the case of average number of publications per year, which was 42.6 for the ISCC topic and to 38.1 for sCO2. For example, comparing the ratio between the total number of publications and the number of institutions, the average publishing ratio for sCO2 (1.33) is higher than that for ISCC (1.16). Comparing the total number of citations, the differences between the ISCC and sCO2 topics become more evident; for example, the number of citations per year for ISCC papers reaches 940, while for sCO2 it is 511. One of the reasons behind that trend could be the fact that the research interest for sCO2 cycles appeared later than for ISCC due to the technical difficulties discussed for supercritical CO2 compared to the mature technology of Combined Cycles, as was discussed at the introduction. That can be confirmed from both of the publishing evolutions shown in Table 13.
Table 13.
Comparison between the ISCC and sCO2 topics for the selected years of study.
As it can be observed, in the year 2010, there were 30 publications on ISCC, but only 11 publications for sCO2. Despite the rapid research deployment of sCO2 in recent years leading to 131 publications by 2019, still more papers were reported for the ISCC topic (174), which explains the lower citation ratio.
Comparing the most relevant countries in terms of publishing, it can be observed in Table 14 that, for both the ISCC and sCO2 topics, China and United States are the main publishing countries, while Spain is the third highest publishing country for ISCC, as is South Korea for sCO2.
Table 14.
Comparison between ISCC and sCO2 topics in terms of the most productive outputs.
It can also be observed in Table 14 that the average citation ratio (total number of citations divided by the number of publications) for those countries for the ISCC topic (around 22 citations per publication) is higher than for the sCO2 topic (around 15 citations per publication). Despite the high research output from those countries, some differences were found regarding the main publishing institutions. For the ISCC topic, two Chinese organisations and one Iranian organization were the most productive, while for the sCO2 topic, institutions from China, South Korea and United States were relevant. Regarding the most relevant authors, it is interesting that authors in sCO2 topics had more publications than the authors retrieved for the ISCC topic; however, the citation ratio (the number of citations divided by the total number of publications from an author) was higher for ISCC topics. The relevance of the conference proceedings for sCO2 topics can also be observed, where the Proceedings of the ASME Turbo Expo were the first publishing platform in terms of documents (113), while the ‘Energy’ journal was in second place for both ISCC and sCO2.
Table 15 compares the most cited publications for both the ISCC and sCO2 topics. As it can be observed, most of the relevant publications for ISCC had more total citations than for the sCO2 topic, but the ratio of citations/year was half of the ratio observed for the sCO2 topic. The publishing sources also differed, with the exception of Renewable and Sustainable Energy Reviews.
Table 15.
Comparison between ISCC and sCO2 topics in terms of the most cited publications.
Finally, it can be observed in Table 16 that the most frequent keywords for the ISCC topic were quite general (‘optimization’, ‘performance’, ‘energy’), while those for sCO2 were the name of the topic itself (‘supercritical carbon dioxide’, ‘Brayton cycle’, ‘supercritical CO2 Brayton cycle’). It was also observed in the detailed keywords information provided in Table A4 that the most common keywords for the ISCC topic were related to modelling and simulations.
Table 16.
Comparison between ISCC and sCO2 topics in terms of the most frequent keywords.
5. Conclusions
In recent years, the growing interest in higher conversion efficiencies for CSP applications has led to an increasing number of papers covering the topic of Integrated Solar Combined Cycle technologies. In particular, ISCC interest is based on its ability to increase the contribution of renewable energy sources into the global energy mix at a very high plant efficiency, whether in a pure solar configuration or in hybrid arrangements. Based on the presented bibliometric study, the following conclusions can be summarized:
- There is a growing interest in ISCC topics, as can be observed from the increasing number of publications and citations. This trend sharpened in 2011.
- The most productive countries in terms of the number of publications were China (241), the United States (202) and Spain (115), which has similar citation/publication ratios to the average (22.1 citations per work). A similar trend was observed regarding the most productive institutions, with two of them being from China (the Chinese Academy of Sciences and North China Electric Power University).
- However, the most renowned researcher on the ISCC topic was Ibrahim Dincer from Ontario Tech University (Canada), with 24 publications and 758 citations. The second and third most productive authors were from China (the Chinese Academy of Sciences) and the United States (the University of South Florida). Despite their large scientific production, the most cited papers were from Mills (published in Solar Energy), Behar (Renewable and Sustainable Energy Reviews) and Schuster (Applied Thermal Engineering).
- It was interesting that none of those most-cited articles were published at the main publishing sources: Energy Conversion and Management (with 158 publications), Energy (124) and Applied Energy (114).
- Regarding the most frequently appearing keywords, it was found that modelling terms such as ‘optimization’, ‘thermodynamics analysis’, ‘exergy analysis’ and ‘performance’ were preferred to more particular ones.
- Compared to other energy hot topics (sCO2), ISCC publications showed a higher value for bibliometric indicators such as the average number of publications per year (42.6), publications per country (16.4), and publications per source (9.9). Bigger differences were found in terms of the average number of citations per year (940), citations per author (7.9), citations per country (361.6), per institution (25.6), and per source (218.6).
Funding
This research received no external funding.
Conflicts of Interest
The author declare no conflict of interest.
Appendix A
Table A1.
Detailed cluster information for co-authorship analysis by the authors (detailed information for Figure 6).
Table A1.
Detailed cluster information for co-authorship analysis by the authors (detailed information for Figure 6).
| Author | Links | Total Link Strength | Documents | Author | Links | Total Link Strength | Documents |
|---|---|---|---|---|---|---|---|
| Cluster 1 | Cluster 2 | ||||||
| Bai, H. | 7 | 7 | 2 | Chen, Y. | 14 | 16 | 7 |
| Chen, H. | 6 | 6 | 4 | Gokon, N. | 2 | 3 | 2 |
| Chen, L. | 5 | 6 | 5 | Han, W. | 10 | 20 | 7 |
| Ji, J. | 9 | 9 | 2 | Hao, Y. | 10 | 14 | 5 |
| Li, G. | 11 | 11 | 3 | Jin, J. | 7 | 9 | 2 |
| Li, M. | 9 | 16 | 5 | Kang, YH. | 4 | 4 | 2 |
| Liu, F. | 6 | 6 | 2 | Kodama, T. | 2 | 3 | 3 |
| Liu, J. | 7 | 7 | 4 | Li, W. | 11 | 12 | 3 |
| Liu, M. | 7 | 7 | 3 | Ling, Y. | 7 | 9 | 2 |
| Shou, H. | 4 | 8 | 2 | Liu, C. | 9 | 9 | 5 |
| Sui, J. | 5 | 6 | 2 | Lu, Z. | 4 | 4 | 2 |
| Sun, F. | 2 | 3 | 2 | Meng, X. | 2 | 2 | 2 |
| Wang, R. | 9 | 16 | 6 | Qu, W. | 7 | 9 | 4 |
| Wu, C. | 4 | 4 | 2 | Ren, L. | 4 | 4 | 2 |
| Wu, J. | 4 | 11 | 3 | Su, B. | 11 | 19 | 6 |
| Xu, C. | 6 | 11 | 2 | Wang, H. | 13 | 14 | 9 |
| Xu, J. | 4 | 4 | 2 | Wang, Z. | 16 | 25 | 9 |
| Xu, Y. | 9 | 16 | 5 | Wei, X. | 9 | 9 | 2 |
| Yu, X. | 6 | 6 | 2 | Yang, X. | 8 | 8 | 4 |
| Zhang, T. | 13 | 13 | 5 | Zhang, J. | 5 | 5 | 3 |
| Zhang, X. | 29 | 34 | 13 | Zhang, S. | 5 | 5 | 3 |
| Zhao, X. | 10 | 12 | 4 | Zhang, Z. | 3 | 3 | 2 |
| Zhou, J. | 12 | 17 | 3 | ||||
| Zhu, J. | 7 | 7 | 2 | ||||
| Cluster 3 | Cluster 4 | ||||||
| Cen, K. | 14 | 20 | 4 | Ahouannou, C. | 5 | 7 | 2 |
| Doherty, P. | 3 | 3 | 2 | Gao, J. | 2 | 2 | 2 |
| Gu, X. | 7 | 7 | 2 | Han, D. | 4 | 4 | 2 |
| Jradi, M. | 4 | 6 | 4 | Huang, M. | 3 | 6 | 2 |
| Li, Q. | 6 | 6 | 3 | Huang, X. | 9 | 9 | 2 |
| Liu, H. | 17 | 18 | 4 | Li, B. | 7 | 7 | 2 |
| Liu, X. | 8 | 8 | 4 | Lin, Y. | 3 | 3 | 2 |
| Luo, Z. | 9 | 12 | 2 | Lougou, BG. | 5 | 7 | 2 |
| Nguyen, M. | 2 | 3 | 2 | Ma, X. | 11 | 15 | 6 |
| Ni, D. | 10 | 12 | 2 | Shuai, Y. | 10 | 13 | 3 |
| Ni, M. | 10 | 15 | 3 | Tan, H. | 8 | 9 | 2 |
| Padilla, RV. | 3 | 3 | 3 | Wang, LW. | 2 | 3 | 3 |
| Qiu, G. | 2 | 2 | 2 | Wang, N. | 8 | 9 | 3 |
| Riffat, S. | 9 | 15 | 9 | Wang, RZ. | 2 | 3 | 5 |
| Riffat, SB. | 2 | 2 | 3 | Wang, X. | 19 | 22 | 7 |
| Rosengarten, G. | 3 | 3 | 2 | Yang, C. | 4 | 8 | 4 |
| Sultan, U. | 9 | 12 | 2 | Yang, D. | 2 | 2 | 2 |
| Taylor, RA. | 4 | 4 | 3 | Yang, Z. | 8 | 8 | 2 |
| Xiao, G. | 10 | 15 | 3 | Zhang, H. | 12 | 12 | 4 |
| Yang, T. | 11 | 11 | 2 | Zhang, R. | 5 | 5 | 3 |
| Zhou, X. | 15 | 15 | 4 | Zhu, C. | 2 | 2 | 2 |
| Cluster 5 | Cluster 6 | ||||||
| Deng, S. | 12 | 22 | 5 | Chen, J. | 28 | 38 | 11 |
| Guo, S. | 7 | 8 | 3 | Dong, L. | 4 | 4 | 2 |
| Han, Z. | 7 | 9 | 2 | E, J. | 7 | 9 | 2 |
| Li, P. | 11 | 11 | 4 | Fu, Z. | 3 | 6 | 3 |
| Lin, S. | 7 | 13 | 2 | Gao, W. | 6 | 7 | 4 |
| Liu, Y. | 5 | 5 | 2 | Li, H. | 25 | 33 | 9 |
| Liu, Z. | 8 | 10 | 3 | Liu, L. | 9 | 9 | 3 |
| Ma, M. | 7 | 13 | 2 | Ren, J. | 3 | 3 | 2 |
| Ni, J. | 7 | 13 | 2 | Wang, S. | 8 | 12 | 7 |
| Tan, Y. | 4 | 4 | 2 | Wang, T. | 6 | 6 | 2 |
| Wang, Q. | 7 | 7 | 2 | Wu, H. | 7 | 8 | 3 |
| Wang, W. | 9 | 9 | 4 | Wu, X. | 7 | 7 | 2 |
| Wu, D. | 7 | 9 | 2 | Xu, D. | 7 | 7 | 3 |
| Xu, W. | 12 | 18 | 3 | Zhang, F. | 9 | 11 | 3 |
| Yan, J. | 4 | 4 | 5 | Zhang, G. | 10 | 13 | 5 |
| Yu, Z. | 9 | 11 | 2 | Zheng, D. | 2 | 2 | 2 |
| Zhang, Y. | 24 | 38 | 11 | Zhu, H. | 6 | 7 | 2 |
| Zhao, L. | 12 | 22 | 7 | ||||
| Zuo, J. | 8 | 8 | 2 | ||||
| Cluster 7 | Cluster 8 | ||||||
| Besarati, S. | 6 | 18 | 3 | Bao, H. | 5 | 10 | 2 |
| Besarati, SM. | 6 | 7 | 2 | Chang, C. | 4 | 4 | 2 |
| Demirkaya, G. | 10 | 36 | 8 | Chang, Z. | 7 | 7 | 2 |
| Goswami, D. | 4 | 12 | 7 | Dai, S. | 8 | 8 | 2 |
| Goswami, DY. | 10 | 37 | 9 | Hellweg, S. | 1 | 1 | 3 |
| Goswami, Y. | 3 | 4 | 3 | Jiang, L. | 1 | 1 | 2 |
| Hasan, A. | 6 | 9 | 5 | Li, X. | 12 | 13 | 6 |
| Li, C. | 14 | 15 | 7 | Lu, Y. | 7 | 12 | 3 |
| Lu, S. | 4 | 10 | 4 | Roskilly, AP. | 6 | 11 | 3 |
| Rahman, MM. | 8 | 32 | 6 | Wang, L. | 11 | 17 | 4 |
| Ramos Archibold, A. | 7 | 24 | 4 | Wang, Y. | 13 | 20 | 7 |
| Stefanakos, E. | 6 | 11 | 4 | Wu, W. | 2 | 2 | 3 |
| Stefanakos, EL. | 7 | 24 | 4 | Yuan, Y. | 13 | 19 | 4 |
| Tamm, G. | 4 | 10 | 4 | ||||
| Vasquez Padilla, R. | 8 | 32 | 7 | ||||
| Vijayaraghavan, S. | 3 | 4 | 2 | ||||
| Cluster 9 | Cluster 10 | ||||||
| Camporeale, SM. | 6 | 20 | 4 | Bedilion, R. | 4 | 6 | 3 |
| Freeman, J. | 6 | 16 | 6 | He, YL. | 4 | 5 | 3 |
| Guarracino, I. | 4 | 7 | 2 | Li, MJ. | 4 | 6 | 3 |
| Hellgardt, K. | 2 | 4 | 2 | Libby, C. | 4 | 5 | 3 |
| Herrando, M. | 5 | 9 | 3 | Ma, Z. | 5 | 6 | 4 |
| Kalogirou, SA. | 4 | 7 | 2 | Qiu, Y. | 4 | 5 | 3 |
| Markides, CN. | 15 | 44 | 14 | Turchi, C. | 3 | 4 | 2 |
| Milozzi, A. | 6 | 20 | 4 | Turchi, CS. | 4 | 5 | 3 |
| Pantaleo, AM. | 8 | 26 | 6 | Wagner, MJ. | 2 | 2 | 2 |
| Ramos, A. | 5 | 9 | 4 | Wang, K. | 6 | 9 | 4 |
| Russo, V. | 5 | 10 | 2 | Zhu, G. | 3 | 3 | 2 |
| Sha, N. | 6 | 20 | 5 | ||||
| Sorrentino, A. | 5 | 10 | 2 | ||||
| Cluster 11 | Cluster 12 | ||||||
| Akbarzadeh, A. | 2 | 5 | 4 | Chan, SH. | 8 | 14 | 2 |
| Andrews, J. | 2 | 5 | 3 | Chang, H. | 9 | 17 | 4 |
| Bai, Z. | 7 | 27 | 8 | Chen, R. | 8 | 8 | 2 |
| Gong, L. | 3 | 9 | 3 | Chen, X. | 21 | 27 | 6 |
| Han, T. | 2 | 6 | 3 | Shu, S. | 9 | 17 | 3 |
| Hong, H. | 13 | 30 | 12 | Tu, Z. | 9 | 17 | 3 |
| Jin, H. | 29 | 66 | 22 | Wan, Z. | 8 | 14 | 2 |
| Lei, J. | 9 | 27 | 8 | Xu, X. | 3 | 3 | 2 |
| Liu, Q. | 18 | 46 | 15 | Zheng, Y. | 8 | 14 | 2 |
| Zhao, Y. | 6 | 10 | 4 | ||||
| Cluster 13 | Cluster 14 | ||||||
| Dai, Y. | 5 | 13 | 7 | Aichmayer, L. | 3 | 10 | 4 |
| Gao, L. | 3 | 5 | 3 | Favrat, D. | 2 | 2 | 3 |
| Huang, S. | 6 | 6 | 2 | Fransson, T. | 3 | 12 | 5 |
| Hwang, Y. | 1 | 1 | 2 | Goransson, L. | 1 | 1 | 2 |
| Sun, Y. | 2 | 2 | 2 | Johnsson, F. | 2 | 2 | 2 |
| Wang, J. | 19 | 30 | 17 | Laumert, B. | 4 | 22 | 14 |
| Wang, M. | 5 | 5 | 2 | Martin, A. | 2 | 2 | 3 |
| Zhang, W. | 4 | 4 | 2 | Spelling, J. | 6 | 24 | 14 |
| Zhao, P. | 3 | 7 | 3 | ||||
| Cluster 15 | Cluster 16 | ||||||
| Cai, R. | 2 | 4 | 2 | Agrawal, SK. | 2 | 4 | 2 |
| Li, Y. | 12 | 20 | 12 | Ghasemi, H. | 1 | 2 | 2 |
| Lior, N. | 11 | 18 | 9 | Khaliq, A. | 3 | 7 | 6 |
| Tarlecki, J. | 2 | 4 | 2 | Kumar, R. | 3 | 6 | 3 |
| Yang, Y. | 21 | 28 | 13 | Mitsos, A. | 3 | 6 | 6 |
| Yuan, J. | 4 | 6 | 3 | Mokheimer, EMA. | 5 | 6 | 9 |
| Yue, T. | 1 | 2 | 2 | Sheu, EJ. | 2 | 4 | 3 |
| Zhang, MN | 11 | 22 | 11 | ||||
| Cluster 17 | Cluster 18 | ||||||
| Abid, M. | 1 | 1 | 4 | Cao, Y. | 5 | 5 | 4 |
| Dabwan, YN. | 5 | 13 | 5 | Enomoto, M. | 4 | 16 | 4 |
| Feng, J. | 4 | 11 | 3 | Fujima, K. | 4 | 16 | 4 |
| Gao, G. | 5 | 14 | 4 | Sawada, N. | 4 | 16 | 4 |
| Li, J. | 29 | 42 | 14 | Yamaguchi, H. | 5 | 18 | 6 |
| Pei, G. | 13 | 22 | 6 | Zhang, XR. | 5 | 18 | 7 |
| Su, Y. | 5 | 8 | 3 | ||||
Table A2.
Detailed cluster information for co-authorship analysis by organizations (detailed information for Figure 7).
Table A2.
Detailed cluster information for co-authorship analysis by organizations (detailed information for Figure 7).
| Institution | Links | Total Link Strength | Documents | Institution | Links | Total Link Strength | Documents |
|---|---|---|---|---|---|---|---|
| Cluster 1 | Cluster 2 | ||||||
| CNR | 4 | 4 | 5 | CIEMAT | 1 | 1 | 5 |
| Natl Tech Univ Athens | 3 | 3 | 17 | Colorado Sch Mines | 4 | 5 | 6 |
| UNED | 2 | 3 | 5 | DLR | 4 | 4 | 7 |
| Univ Carlos III Madrid | 3 | 4 | 6 | German Aerospace CTR DLR | 1 | 1 | 12 |
| Univ Ferrara | 1 | 1 | 5 | Natl Renewable Energy Lab | 3 | 4 | 9 |
| Univ Naples Federico II | 1 | 1 | 7 | Sandia Natl Labs | 4 | 4 | 7 |
| Univ Politecn Madrid | 2 | 4 | 11 | Stanford Univ | 3 | 3 | 5 |
| Urmia Univ | 5 | 6 | 9 | Univ Calif Berkeley | 1 | 1 | 9 |
| Urmia Univ Technology | 2 | 3 | 5 | ||||
| Cluster 3 | Cluster 4 | ||||||
| ETH | 4 | 7 | 10 | Delft Univ Technol | 4 | 4 | 6 |
| Paul Scherrer Inst | 2 | 6 | 12 | MIT | 3 | 5 | 11 |
| San Diego State Univ | 2 | 2 | 10 | Politecn Milan | 4 | 6 | 9 |
| Sharif Univ Technol | 2 | 3 | 6 | Politecn Torino | 3 | 3 | 5 |
| Swiss Fed Inst Technol | 4 | 4 | 7 | Rhein Westfal Th Aachen | 4 | 5 | 8 |
| Univ Mohaghegh Ardab | 2 | 5 | 7 | Univ Brescia | 2 | 5 | 6 |
| Univ Tabriz | 4 | 7 | 10 | Univ Seville | 2 | 2 | 11 |
| Weizmann Inst Sci | 2 | 3 | 9 | ||||
| Cluster 5 | Cluster 6 | ||||||
| KFUPM | 5 | 5 | 9 | Huazhong Univ Sci & Tech | 3 | 4 | 6 |
| King Fahd Univ Petr Min | 5 | 8 | 11 | Imperial Coll London | 4 | 11 | 17 |
| Univ Ontario | 7 | 11 | 11 | Nanyang Technol Univ | 3 | 4 | 7 |
| Univ Ontario Inst Technol | 3 | 8 | 15 | Shanghai Jiao Tong Univ | 1 | 1 | 18 |
| Univ Teknol Malaysia | 1 | 1 | 5 | Univ Bari | 2 | 8 | 6 |
| Univ Waterloo | 4 | 7 | 5 | Univ Zaragoza | 5 | 8 | 9 |
| Yidiz Tech Univ | 3 | 7 | 6 | ||||
| Cluster 7 | Cluster 8 | ||||||
| Chinese Academ Sciences | 10 | 58 | 52 | Georgia Inst Technol | 5 | 5 | 11 |
| Hunan Univ | 3 | 4 | 7 | KTH Royal Inst Technol | 1 | 1 | 10 |
| North China Elect Power | 8 | 32 | 41 | Tianjin Univ | 7 | 8 | 12 |
| Tech Univ Denmark | 1 | 2 | 7 | Univ Adelaide | 3 | 3 | 7 |
| Univ Chinese Acad Sci | 8 | 44 | 28 | Zhejiang Univ | 3 | 4 | 9 |
| Univ Penn | 4 | 10 | 10 | ||||
| Cluster 9 | Cluster 10 | ||||||
| Iran Univ Sci & Technol | 3 | 7 | 6 | Anna Univ | 1 | 2 | 5 |
| Islamic Azad Univ | 4 | 14 | 20 | Univ Lleida | 2 | 5 | 7 |
| RMIT Univ | 1 | 1 | 8 | Univ Rovira & Virgili | 5 | 9 | 14 |
| Univ Tehran | 4 | 12 | 30 | Univ Telemat Ecampus | 1 | 1 | 5 |
| Cluster 11 | Cluster 12 | ||||||
| Arizona State Univ | 1 | 1 | 8 | Chongqing Univ | 3 | 5 | 8 |
| Univ Nottingham | 1 | 4 | 15 | Royal Inst Technol | 1 | 1 | 12 |
| Univ Sci & Technol China | 6 | 9 | 12 | ||||
Table A3.
Detailed cluster information for co-authorship analysis by countries (detailed information for Figure 8).
Table A3.
Detailed cluster information for co-authorship analysis by countries (detailed information for Figure 8).
| Country | Links | Total Link Strength | Documents | Country | Links | Total Link Strength | Documents |
|---|---|---|---|---|---|---|---|
| Cluster 1 | Cluster 2 | ||||||
| Belgium | 7 | 10 | 14 | Canada | 11 | 31 | 44 |
| Brazil | 5 | 8 | 17 | Cyprus | 5 | 6 | 6 |
| Chile | 5 | 9 | 7 | Egypt | 4 | 6 | 22 |
| Finland | 4 | 4 | 7 | England | 19 | 54 | 77 |
| Norway | 8 | 9 | 11 | Pakistan | 7 | 10 | 7 |
| Portugal | 5 | 5 | 11 | Saudi Arabia | 10 | 25 | 31 |
| Spain | 19 | 59 | 115 | Turkey | 8 | 15 | 29 |
| Sweden | 16 | 25 | 41 | United Arab Emirates | 6 | 6 | 13 |
| Cluster 3 | Cluster 4 | ||||||
| Australia | 14 | 24 | 44 | Germany | 16 | 45 | 83 |
| Colombia | 3 | 8 | 6 | Greece | 5 | 13 | 33 |
| Iran | 19 | 38 | 97 | Italy | 13 | 45 | 102 |
| Peoples Republic of China | 23 | 80 | 241 | Jordan | 2 | 4 | 7 |
| Taiwan | 2 | 2 | 7 | Poland | 4 | 5 | 6 |
| United States | 28 | 92 | 202 | ||||
| Vietnam | 4 | 8 | 5 | ||||
| Cluster 5 | Cluster 6 | ||||||
| Denmark | 9 | 13 | 13 | Austria | 3 | 3 | 6 |
| Japan | 8 | 14 | 30 | Netherlands | 9 | 13 | 10 |
| Malaysia | 6 | 8 | 13 | South Africa | 3 | 3 | 21 |
| Singapore | 6 | 11 | 11 | Switzerland | 12 | 21 | 39 |
| South Korea | 5 | 5 | 12 | ||||
| Cluster 7 | Cluster 8 | ||||||
| Algeria | 1 | 2 | 12 | India | 6 | 10 | 48 |
| France | 7 | 12 | 29 | Israel | 6 | 14 | 20 |
| Thailand | 5 | 5 | 5 | ||||
Table A4.
Detailed cluster information for the co-occurrence analysis of keywords (detailed information for Figure 9).
Table A4.
Detailed cluster information for the co-occurrence analysis of keywords (detailed information for Figure 9).
| Keyword | Links | Total Link Strength | Documents | Keyword | Links | Total Link Strength | Documents |
|---|---|---|---|---|---|---|---|
| Cluster 1 | Cluster 2 | ||||||
| CO2 Capture | 50 | 104 | 22 | Absorption Chiller | 56 | 127 | 22 |
| Combined-Cycle | 67 | 205 | 40 | CHP | 51 | 108 | 20 |
| Concentrated Solar Power | 66 | 197 | 43 | Cogeneration | 78 | 277 | 46 |
| Concentrating Solar Power | 56 | 139 | 36 | Collectors | 70 | 193 | 33 |
| Cost | 59 | 114 | 25 | Combined Heat | 74 | 221 | 37 |
| CSP | 63 | 175 | 41 | Combined Heat and Power | 52 | 135 | 28 |
| Design | 95 | 848 | 175 | Desalination | 56 | 137 | 26 |
| Direct Steam Generation | 70 | 217 | 45 | Dynamic Simulation | 56 | 120 | 22 |
| Electricity | 64 | 176 | 39 | Exergoeconomic Analysis | 70 | 213 | 36 |
| Energy Storage | 67 | 135 | 27 | Exergy Analysis | 87 | 597 | 98 |
| Generation | 87 | 484 | 87 | Gas-Turbine | 80 | 263 | 44 |
| Integration | 68 | 186 | 40 | Multiobjective Optimization | 74 | 283 | 53 |
| Life Cycle Assessment | 58 | 149 | 40 | Natural-Gas | 63 | 174 | 31 |
| Life-Cycle-Assessment | 53 | 140 | 42 | Optimization | 96 | 1358 | 249 |
| Model | 81 | 266 | 61 | ORC | 79 | 315 | 52 |
| Multi-Objective-Optimization | 55 | 97 | 20 | Organic Rankine Cycle | 79 | 431 | 80 |
| Parabolic Trough | 64 | 193 | 37 | Organic Rankine Cycle (ORC) | 40 | 83 | 20 |
| Parabolic Trough Collector | 65 | 148 | 22 | Organic Rankine-Cycle | 85 | 554 | 94 |
| Performance | 95 | 1119 | 237 | Performance Analysis | 90 | 349 | 71 |
| Phase-change materials | 49 | 98 | 24 | Plant | 74 | 240 | 48 |
| Plants | 76 | 219 | 46 | Power-Generation | 60 | 143 | 24 |
| Power-plants | 53 | 168 | 40 | Power-Plant | 62 | 147 | 28 |
| Receiver | 57 | 109 | 24 | Power-System | 53 | 141 | 25 |
| Renewable Energy | 66 | 172 | 56 | Rankine-Cycle | 55 | 137 | 23 |
| Simulation | 90 | 417 | 84 | Solar-Energy | 61 | 193 | 38 |
| Solar Power | 58 | 127 | 29 | Thermodynamic Analysis | 84 | 511 | 94 |
| Solar Thermal | 55 | 116 | 24 | Thermoeconomic Analysis | 64 | 143 | 24 |
| Storage | 69 | 169 | 37 | Trigeneration | 59 | 133 | 23 |
| System | 90 | 639 | 136 | Waste Heat | 69 | 208 | 36 |
| Systems | 86 | 389 | 96 | Working Fluids | 63 | 214 | 39 |
| Technologies | 78 | 295 | 58 | ||||
| Technology | 54 | 109 | 25 | ||||
| Thermal Energy Storage | 62 | 159 | 34 | ||||
| Thermal Performance | 44 | 83 | 20 | ||||
| Thermal-Energy | 56 | 114 | 22 | ||||
| Thermal-Energy Storage | 57 | 122 | 22 | ||||
| Cluster 3 | Cluster 4 | ||||||
| Biomass | 79 | 340 | 63 | Brayton Cycle | 53 | 125 | 25 |
| CO2 | 67 | 171 | 37 | Combined Cycle | 75 | 264 | 56 |
| Coal | 52 | 108 | 21 | Cooling | 52 | 119 | 23 |
| Cycle | 81 | 414 | 91 | Efficiency | 85 | 351 | 72 |
| Cycles | 40 | 82 | 23 | Energy | 94 | 1072 | 205 |
| Energy Storage | 54 | 93 | 23 | Gas Turbine | 43 | 76 | 22 |
| Gasification | 63 | 155 | 28 | Power Generation | 63 | 142 | 29 |
| Heat | 84 | 384 | 69 | Rankine Cycle | 51 | 118 | 25 |
| Hybrid | 48 | 90 | 20 | Solar Energy | 94 | 748 | 159 |
| Hydrogen | 64 | 225 | 45 | ||||
| Hydrogen-Production | 69 | 234 | 54 | ||||
| Power | 85 | 431 | 86 | ||||
| Solar | 88 | 437 | 88 | ||||
| Temperature | 79 | 231 | 53 | ||||
| Water | 68 | 235 | 57 | ||||
| Wind | 55 | 106 | 24 | ||||
| Cluster 5 | |||||||
| CCHP | 57 | 170 | 27 | ||||
| Driven | 74 | 296 | 48 | ||||
| Ejector | 46 | 127 | 22 | ||||
| Exergy | 88 | 469 | 78 | ||||
| Parametric Analysis | 49 | 141 | 20 | ||||
| Refrigeration | 57 | 189 | 38 | ||||
Table A5.
Detailed cluster information for the most cited publications (detailed information for Figure 10).
Table A5.
Detailed cluster information for the most cited publications (detailed information for Figure 10).
| Publication | Links | Citations | Publication | Links | Citations |
|---|---|---|---|---|---|
| Cluster 1 | Cluster 2 | ||||
| Ahmadi (2017a) | 3 | 57 | Al-Sulaiman (2011) | 1 | 51 |
| Ahmadi (2017b) | 5 | 50 | Al-Sulaiman (2013) | 4 | 70 |
| Baghernejad (2011) | 6 | 181 | Boyaghchi (2015a) | 7 | 57 |
| Behar (2011) | 3 | 50 | Boyaghchi (2015b) | 10 | 120 |
| Behar (2014) | 17 | 74 | Jing (2012) | 5 | 62 |
| Dersch (2004) | 9 | 153 | Jradi (2014) | 7 | 129 |
| Eck (2003) | 2 | 130 | Karellas (2008) | 1 | 111 |
| Franchini (2013) | 5 | 62 | Meng (2010) | 6 | 54 |
| Horn (2004) | 7 | 69 | Mohammadi (2017) | 1 | 83 |
| Hosseini (2005) | 5 | 68 | Shirazi (2017) | 2 | 60 |
| Jamel (2013) | 20 | 111 | Wang (2009a) | 5 | 67 |
| Li (2014) | 11 | 50 | Wang (2012) | 9 | 78 |
| Montes (2011) | 7 | 161 | Wang (2015a) | 4 | 65 |
| Mezammahalleh (2010) | 8 | 76 | Wang (2015b) | 6 | 96 |
| Reddy (2012) | 3 | 51 | |||
| Rovira (2013) | 14 | 75 | |||
| Rovira (2016) | 5 | 52 | |||
| Spelling (2012) | 9 | 81 | |||
| Cluster 3 | Cluster 4 | ||||
| Bai (2015) | 1 | 66 | Al-Attab (2015) | 5 | 61 |
| Good (2016) | 2 | 54 | Behar (2013) | 13 | 335 |
| Kalogirou (2001) | 2 | 176 | Boerema (2012) | 1 | 98 |
| Khalid (2015) | 1 | 76 | Buck (2002) | 6 | 144 |
| Kosmadakis (2011) | 4 | 70 | Chacartegui (2011) | 10 | 127 |
| Mills (2004) | 9 | 472 | Crespi (2017) | 4 | 124 |
| Modi (2017) | 12 | 80 | Dunham (2014) | 7 | 92 |
| Rao (2013) | 2 | 58 | Kribus (1998) | 8 | 138 |
| Romero Gomez (2014) | 1 | 101 | Lenert (2012) | 2 | 255 |
| Wang (2009b) | 6 | 174 | Schmitz (2006) | 1 | 102 |
| Zhang (2006a) | 2 | 56 | Schwarzboezl (2006) | 8 | 156 |
| Zhang (2006b) | 4 | 130 | Turchi (2013) | 2 | 198 |
| Zhang (2012) | 2 | 212 | Zare (2016) | 5 | 51 |
| Cluster 5 | Cluster 6 | ||||
| Al-Sulaiman (2012) | 7 | 100 | Balcombe (2015) | 1 | 50 |
| Al-Sulaiman (2014) | 4 | 107 | Freeman (2015) | 5 | 149 |
| Dincer (2015) | 1 | 156 | Freeman (2017a) | 4 | 61 |
| Kim (2009) | 1 | 63 | Freeman (2017b) | 6 | 88 |
| Li (2013) | 5 | 206 | Karellas (2016) | 2 | 102 |
| Nafey (2010) | 4 | 109 | Markides (2013) | 3 | 82 |
| Palenzuela (2011) | 1 | 65 | Martinez (2017) | 6 | 51 |
| Tchanche (2010) | 5 | 116 | Qiu (2011) | 2 | 192 |
| Wang (2011) | 4 | 68 | Qiu (2012) | 2 | 91 |
| You (2002) | 2 | 52 | Quoilin (2011) | 6 | 214 |
| Cluster 7 | Cluster 8 | ||||
| Dai (2009) | 7 | 150 | Agrafiotis (2015) | 3 | 180 |
| Goswami (1999) | 6 | 82 | Hirsch (2001) | 4 | 74 |
| Goswami (2004) | 7 | 112 | Michalsky (2012) | 1 | 57 |
| Tamm (2004) | 5 | 90 | Segal (2003) | 2 | 58 |
| Vazquez Padilla (2010) | 2 | 84 | Sheu (2012) | 12 | 76 |
| Vidal (2006) | 4 | 99 | Steinfeld (1996) | 3 | 63 |
| Vijayaraghavan (2006) | 3 | 51 | Tamme (2001) | 3 | 76 |
| Wang (2016) | 5 | 50 | Von Zedtwitz (2003) | 3 | 50 |
| Zhang (2007) | 5 | 97 | Wegner (2006) | 1 | 140 |
| Cluster 9 | Cluster 10 | ||||
| Fiaschi (2012) | 1 | 93 | Baghernejad (2010) | 6 | 97 |
| Ghasemi (2014) | 4 | 51 | Kim (2012) | 2 | 110 |
| Lecompte (2013) | 4 | 136 | Qiu (2017) | 1 | 84 |
| Maraver (2014) | 2 | 161 | Yamaguchi (2006) | 8 | 167 |
| Schuster (2009) | 5 | 300 | |||
| Tempesti (2012) | 4 | 102 | |||
| Tempesti (2013) | 5 | 51 | |||
Table A6.
Detailed cluster information for the most common sources (detailed information for Figure 11).
Table A6.
Detailed cluster information for the most common sources (detailed information for Figure 11).
| Source | Links | Total Link Strength | Citations | Source | Links | Total Link Strength | Citations |
|---|---|---|---|---|---|---|---|
| Cluster 1 | Cluster 2 | ||||||
| Applied Energy | 31 | 540 | 114 | Energy Policy | 10 | 19 | 13 |
| Energy Conversion and Management | 29 | 722 | 158 | International Journal of Renewable Energy Research | 5 | 5 | 6 |
| Energy Technology | 4 | 4 | 5 | International Journal of Thermodynamics | 6 | 9 | 5 |
| International Journal of Hydrogen Energy | 10 | 59 | 38 | Journal of Energy Engineering | 11 | 45 | 7 |
| Journal of Power Sources | 4 | 6 | 9 | Renewable & Sustainable Energy Reviews | 28 | 408 | 50 |
| Sustainability | 6 | 6 | 8 | Renewable Energy | 25 | 342 | 66 |
| Sustainable Energy Technologies and Assessments | 12 | 56 | 9 | ||||
| Cluster 3 | Cluster 4 | ||||||
| Energy | 30 | 621 | 124 | Environmental Research Letters | 3 | 3 | 6 |
| International Journal of Energy Research | 14 | 109 | 30 | Environmental Science & Technology | 6 | 7 | 6 |
| Journal of Energy Resources (ASME) | 11 | 43 | 9 | International Journal of Greenhouse Gas Control | 11 | 18 | 9 |
| Journal of Solar Energy Engineering (ASME) | 23 | 238 | 43 | Journal of Cleaner Production | 18 | 82 | 32 |
| Proceedings of the ASME 5th Conference on Energy Sustainability 2011 | 4 | 7 | 6 | ||||
| Proceedings of the ASME TurboExpo 2011 | 2 | 4 | 5 | ||||
| Cluster 5 | Cluster 6 | ||||||
| Proceedings of the SolarPACES 2016 | 9 | 24 | 11 | Proceedings of the ASME 4th Conference on Energy Sustainability | 2 | 3 | 5 |
| Proceedings of the SolarPACES 2017 | 8 | 11 | 10 | Proceedings of the ASME TurboExpo 2014 | 5 | 12 | 6 |
| Proceedings of the SolarPACES 2014 | 10 | 21 | 10 | Proceedings of the Institution of Mechanical Engineers | 6 | 8 | 5 |
| Proceedings of the SolarPACES 2013 | 15 | 48 | 19 | Solar Energy | 30 | 483 | 101 |
| Cluster 7 | Cluster 8 | ||||||
| Applied Thermal Engineering | 29 | 501 | 91 | Energies | 13 | 95 | 33 |
| International Conference on Applied Energy 2014 | 5 | 14 | 6 | International Journal of Life Cycle Assessment | 4 | 4 | 5 |
| Journal of Renewable and Sustainable Energy | 4 | 5 | 6 | ||||
| Cluster 9 | Cluster 10 | ||||||
| Journal of Engineering for Gas turbines and Power (ASME) | 11 | 71 | 17 | International Journal of Exergy | 10 | 43 | 12 |
| Proceedings of the 9th International Conference on Applied Energy | 4 | 4 | 5 | ||||
References
- Martínez, D.M.; Ebenhack, B.W. Understanding the role of energy consumption in human development through the use of saturation phenomena. Energy Policy 2008, 36, 1430–1435. [Google Scholar] [CrossRef]
- Jorgenson, A.K.; Alekseyko, A.; Giedraitis, V. Energy consumption, human well-being and economic development in central and eastern European nations: A cautionary tale of sustainability. Energy Policy 2014, 66, 419–427. [Google Scholar] [CrossRef]
- Oberthür, S.; Ott, H.E. The Kyoto Protocol: International Climate Policy for the 21st Century; Springer-Verlag: Berlin, Germany, 1999. [Google Scholar]
- Rogelj, J.; den Elzen, M.; Höhne, N.; Fransen, T.; Fekete, H.; Winkler, H.; Schaeffer, R.; Sha, F.; Riahi, K.; Meinshausen, M. Paris Agreement climate proposals need a boost to keep warming well below 2 °c. Nature 2016, 534, 631–639. [Google Scholar] [CrossRef]
- UN. COP25 Climate Change Conference. 2019. Available online: https://unfccc.int/cop25 (accessed on 26 August 2020).
- UN. About the Sustainable Development Goals—United Nations Sustainable Development. 2020. Available online: https://www.un.org/sustainabledevelopment/sustainable-development-goals/ (accessed on 26 August 2020).
- European Commission. COM(2014) 15 Final: A Policy Framework for Climate and Energy in the Period from 2020 to 2030; European Environment Agency (EEA): Brussels, Belgium, 2014; pp. 1–18. [Google Scholar]
- Li, Q.; Wang, J.; Zhang, Y.; Fan, Y.; Bao, G.; Wang, X. Multi-Period Generation Expansion Planning for Sustainable Power Systems to Maximize the Utilization of Renewable Energy Sources. Sustainability 2020, 12, 1083. [Google Scholar] [CrossRef]
- IRENA. Electricity Storage and Renewables: Costs and Markets to 2030. 2017. Available online: https://www.irena.org/publications/2017/Oct/Electricity-storage-and-renewables-costs-and-markets (accessed on 30 July 2020).
- Lund, H.; Salgi, G. The role of compressed air energy storage (CAES) in future sustainable energy systems. Energy Convers. Manag. 2009, 50, 1172–1179. [Google Scholar] [CrossRef]
- Cabeza, L.F. (Ed.) Advances in Thermal Energy Storage Systems: Methods and Applications; Woodhead Publishing Series in Energy: Cambridge, UK, 2015. [Google Scholar]
- Kraemer, S. Make Carnot Batteries with Molten Salt Thermal Energy Storage in ex-Coal Plants. SolarPACES. 16 April 2019. Available online: https://www.solarpaces.org/make-carnot-batteries-with-molten-salt-thermal-energy-storage-from-ex-coal-plants/ (accessed on 26 August 2020).
- Zhang, H.L.; Baeyens, J.; Degrève, J.; Cacères, G. Concentrated solar power plants: Review and design methodology. Renew. Sustain. Energy Rev. 2013, 22, 466–481. [Google Scholar] [CrossRef]
- Islam, M.T.; Huda, N.; Abdullah, A.B.; Saidur, R. A comprehensive review of state-of-the-art concentrating solar power (CSP) technologies: Current status and research trends. Renew. Sustain. Energy Rev. 2018, 91, 987–1018. [Google Scholar] [CrossRef]
- Powell, K.M.; Rashid, K.; Ellingwood, K.; Tuttle, J.; Iverson, B.D. Hybrid concentrated solar thermal power systems: A review. Renew. Sustain. Energy Rev. 2017, 80, 215–237. [Google Scholar] [CrossRef]
- Zhu, Y.; Zhai, R.; Yang, Y.; Reyes-Belmonte, M.A. Techno-Economic Analysis of Solar Tower Aided Coal-Fired Power Generation System. Energies 2017, 10, 1392. [Google Scholar] [CrossRef]
- Aguilar-Jiménez, J.A.; Velázquez, N.; Acuña, A.; Cota, R.; González, E.; González, L.; López, R.; Islas, S. Techno-economic analysis of a hybrid PV-CSP system with thermal energy storage applied to isolated microgrids. Sol. Energy 2018, 174, 55–65. [Google Scholar] [CrossRef]
- Ju, X.; Xu, C.; Hu, Y.; Han, X.; Wei, G.; Du, X. A review on the development of photovoltaic/concentrated solar power (PV-CSP) hybrid systems. Sol. Energy Mater. Sol. Cells 2017, 161, 305–327. [Google Scholar] [CrossRef]
- Singer, C.; Buck, R.; Pitz-paal, R.; Müller-steinhagen, H. Assessment of Solar Power Tower Driven Ultrasupercritical Steam Cycles Applying Tubular Central Receivers With Varied Heat. J. Sol. Energy Eng. 2016, 132, 1–12. [Google Scholar] [CrossRef]
- Turchi, C.S.; Ma, Z.; Neises, T.W.; Wagner, M.J. Thermodynamic Study of Advanced Supercritical Carbon Dioxide Power Cycles for Concentrating Solar Power Systems. J. Sol. Energy Eng. 2013, 135, 041007. [Google Scholar] [CrossRef]
- Binotti, M.; Astolfi, M.; Campanari, S.; Manzolini, G.; Silva, P. Preliminary assessment of sCO2 cycles for power generation in CSP solar tower plants. Appl. Energy 2017, 204, 1007–1017. [Google Scholar] [CrossRef]
- Neises, T.; Turchi, C. A Comparison of Supercritical Carbon Dioxide Power Cycle Configurations with an Emphasis on CSP Applications. Energy Procedia 2014, 49, 1187–1196. [Google Scholar] [CrossRef]
- Vignarooban, K.; Xu, X.; Arvay, A.; Hsu, K.; Kannan, A.M. Heat transfer fluids for concentrating solar power systems—A review. Appl. Energy 2015, 146, 383–396. [Google Scholar] [CrossRef]
- Liu, M.; Tay, N.H.S.; Bell, S.; Belusko, M.; Jacob, R.; Will, G.; Saman, W.; Bruno, F. Review on concentrating solar power plants and new developments in high temperature thermal energy storage technologies. Renew. Sustain. Energy Rev. 2016, 53, 1411–1432. [Google Scholar] [CrossRef]
- Ho, C.K.; Iverson, B.D. Review of high-temperature central receiver designs for concentrating solar power. Renew. Sustain. Energy Rev. 2014, 29, 835–846. [Google Scholar] [CrossRef]
- Ho, C.K. A review of high-temperature particle receivers for concentrating solar power. Appl. Therm. Eng. 2016, 109, 958–969. [Google Scholar] [CrossRef]
- Stein, W.H.; Buck, R. Advanced power cycles for concentrated solar power. Sol. Energy 2017. [Google Scholar] [CrossRef]
- Giuliano, S.; Buck, R.; Eguiguren, S. Analysis of Solar-Thermal Power Plants With Thermal Energy Storage and Solar-Hybrid Operation Strategy. J. Sol. Energy Eng. 2011. [Google Scholar] [CrossRef]
- Reyes-Belmonte, M.A.; Sebastián, A.; González-Aguilar, J.; Romero, M. Performance comparison of different thermodynamic cycles for an innovative central receiver solar power plant. AIP Conf. Proc. 2017, 1850, 160024. [Google Scholar] [CrossRef]
- Wang, X.; Wang, J.; Zhao, P.; Dai, Y. Thermodynamic Comparison and Optimization of Supercritical CO2 Brayton Cycles with a Bottoming Transcritical CO2 Cycle. J. Energy Eng. 2016, 142, 04015028. [Google Scholar] [CrossRef]
- Yu, A.; Su, W.; Lin, X.; Zhou, N. Recent trends of supercritical CO2 Brayton cycle: Bibliometric analysis and research review. Nucl. Eng. Technol. 2020. [Google Scholar] [CrossRef]
- Crespi, F.; Gavagnin, G.; Sánchez, D.; Martínez, G.S. Supercritical carbon dioxide cycles for power generation: A review. Appl. Energy 2017, 195, 152–183. [Google Scholar] [CrossRef]
- Turchi, C.S.; Ma, Z.; Dyreby, J. Supercritical carbon dioxide power cycle configurations for use in concentrating solar power systems. In Proceedings of the ASME Turbo Expo, Copenhagen, Denmark, 11–15 June 2012; Volume 5, pp. 967–973. [Google Scholar] [CrossRef]
- Reyes-Belmonte, M.A.; Sebastián, A.; Romero, M.; González-Aguilar, J. Optimization of a recompression supercritical carbon dioxide cycle for an innovative central receiver solar power plant. Energy 2016. [Google Scholar] [CrossRef]
- Allam, R.; Martin, S.; Forrest, B.; Fetvedt, J.; Lu, X.; Freed, D.; Brown, G.W., Jr.; Sasaki, T.; Itoh, M.; Manning, J. Demonstration of the Allam Cycle: An Update on the Development Status of a High Efficiency Supercritical Carbon Dioxide Power Process Employing Full Carbon Capture. Energy Procedia 2017, 114, 5948–5966. [Google Scholar] [CrossRef]
- Poullikkas, A. An overview of current and future sustainable gas turbine technologies. Renew. Sustain. Energy Rev. 2005, 9, 409–443. [Google Scholar] [CrossRef]
- Smith, R.W. Steam turbine cycles and cycle design optimization: Combined cycle power plants. In Advances in Steam Turbines for Modern Power Plants; Woodhead Publishing: Duxford, UK, 2017; pp. 57–92. [Google Scholar]
- Wasserman, S.; Faust, K. Social Network Analysis in the Social and Behavioral Sciences. In Social Network Analysis; Cambridge University Press: Cambridge, UK, 2012; pp. 3–27. [Google Scholar] [CrossRef]
- Alcayde, A.; Montoya, F.G.; Baños, R.; Perea-Moreno, A.J.; Manzano-Agugliaro, F. Analysis of research topics and scientific collaborations in renewable energy using community detection. Sustainability 2018, 10, 4510. [Google Scholar] [CrossRef]
- Uribe-Toril, J.; Ruiz-Real, J.L.; Milán-García, J.; Valenciano, J.D.P. Energy, economy, and environment: Aworldwide research update. Energies 2019, 12, 1120. [Google Scholar] [CrossRef]
- Hernández-Escobedo, Q.; Perea-Moreno, A.J.; Manzano-Agugliaro, F. Wind energy research in Mexico. Renew. Energy 2018, 123, 719–729. [Google Scholar] [CrossRef]
- Wang, L.; Wei, Y.M.; Brown, M.A. Global transition to low-carbon electricity: A bibliometric analysis. Appl. Energy 2017, 205, 57–68. [Google Scholar] [CrossRef]
- Saikia, K.; Vallès, M.; Fabregat, A.; Saez, R.; Boer, D. A bibliometric analysis of trends in solar cooling technology. Sol. Energy 2020, 199, 100–114. [Google Scholar] [CrossRef]
- Imran, M.; Haglind, F.; Asim, M.; Alvi, J.Z. Recent research trends in organic Rankine cycle technology: A bibliometric approach. Renew. Sustain. Energy Rev. 2018, 81, 552–562. [Google Scholar] [CrossRef]
- Yu, H.; Wei, Y.M.; Tang, B.J.; Mi, Z.; Pan, S.Y. Assessment on the research trend of low-carbon energy technology investment: A bibliometric analysis. Appl. Energy 2016, 184, 960–970. [Google Scholar] [CrossRef]
- van Eck, N.J.; Waltman, L. Software survey: VOSviewer, a computer program for bibliometric mapping. Scientometrics 2010, 84, 523–538. [Google Scholar] [CrossRef]
- International Renewable Energy Agency. Renewable Power Generation Costs in 2019; International Renewable Energy Agency: Abu Dhabi, United Arab Emirates, 2020. [Google Scholar]
- Centre for Science and Technology Studies—Leiden University. VOSviewer—Visualizing Scientific Landscapes. 2020. Available online: https://www.vosviewer.com/ (accessed on 27 August 2020).
- Mills, D. Advances in solar thermal electricity technology. Sol. Energy 2004, 76, 19–31. [Google Scholar] [CrossRef]
- Behar, O.; Khellaf, A.; Mohammedi, K. A review of studies on central receiver solar thermal power plants. Renew. Sustain. Energy Rev. 2013, 23. [Google Scholar] [CrossRef]
- Schuster, A.; Karellas, S.; Kakaras, E.; Spliethoff, H. Energetic and economic investigation of Organic Rankine Cycle applications. Appl. Therm. Eng. 2009, 29, 1809–1817. [Google Scholar] [CrossRef]
- Lenert, A.; Wang, E.N. Optimization of nanofluid volumetric receivers for solar thermal energy conversion. Sol. Energy 2012, 86, 253–265. [Google Scholar] [CrossRef]
- Quoilin, S.; Orosz, M.; Hemond, H.; Lemort, V. Performance and design optimization of a low-cost solar organic Rankine cycle for remote power generation. Sol. Energy 2011, 85, 955–966. [Google Scholar] [CrossRef]
- Iverson, B.D.; Conboy, T.M.; Pasch, J.J.; Kruizenga, A.M. Supercritical CO2 Brayton cycles for solar-thermal energy. Appl. Energy 2013, 111, 957–970. [Google Scholar] [CrossRef]
© 2020 by the author. Licensee MDPI, Basel, Switzerland. This article is an open access article distributed under the terms and conditions of the Creative Commons Attribution (CC BY) license (http://creativecommons.org/licenses/by/4.0/).