Article

Research on Innovation Catering Behavior and Its Economic Consequences—An Empirical Analysis Based on Threshold Regression Model

1
School of Economics and Management, China University of Mining and Technology, Xuzhou 221116, China
2
College of Economics and Management, Huaiyin Normal University, 71 Jiaotong Avenue, Huaian 223300, China
*
Author to whom correspondence should be addressed.
Sustainability 2020, 12(19), 8198; https://doi.org/10.3390/su12198198
Submission received: 14 September 2020 / Revised: 23 September 2020 / Accepted: 30 September 2020 / Published: 5 October 2020
(This article belongs to the Special Issue Innovation and the Development of Enterprises II)

Abstract

:
The purpose of this research is to develop the subjective initiative and enhance the sense of independent innovation in the process of high-tech enterprises, so as to guarantee the sustainable development of innovation ability. Based on the relevant data of high-tech enterprises from 2012 to 2017, a threshold regression model was established to study the existence of innovative “incentive” catering behaviors in the process of identifying high-tech enterprises. First, the empirical test results support the hypothesis of innovative “incentives” catering behavior, identified by high-tech enterprises, with a threshold of 0.0370. The empirical results show that the one-size-fits-all objective identification standard will indeed encourage some companies to adopt catering behaviors. Next, the paper verifies that high-tech companies that do not adopt “incentive” catering behaviors will have higher innovation efficiencies. Moreover, the R&D investment and R&D subsidy of high-tech enterprises without catering behaviors will be higher. Finally, through a stepwise regression test, it was found that R&D investment and R&D subsidies play an intermediary role in the relationship between innovation “incentives” catering behavior and corporate innovation efficiency. High-tech enterprises affect the innovation efficiency of enterprises through the transmission mechanism of R&D investment and R&D subsidies.

1. Introduction

With the rapid development of technology and the advance of the information age, independent innovation capabilities have played a vital role in the economic growth of enterprises and even whole countries. Science and technology are the foundations of a country’s prosperity and innovation is the soul of national progress. At the same time, this also emphasizes that enterprises should carry out scientific innovation, strengthen intellectual property rights, train innovative talents, improve the innovation environment, construct better innovation capacity, and pursue sustainable innovation development (APEC, 2014) [1]. As is known to all, the innovation ability of a country depends on the development of the micro-economy, especially the high-tech enterprises are at the leading position of innovation and development, which are vital to the lifeline of the entire country.
Catering behavior research first emerged from the issue of the choice of dividend policy. Baker and Wurgler (2004) [2] proposed a “catering theory” based on the perspective of behavioral finance. With the deepening of research, many scholars have discovered that catering behavior may exist not only in cash dividends but also universally in areas such as innovation investment (Nayak & Choudhury, 2014) [3], government subsidies (Su et al., 2019) [4]. From the perspective of catering, most of the catering behaviors of enterprises are based on manipulation to obtain a certain qualification, and most of them are based on the benefits of industrial incentive policies (Song, Wang & Zhang, 2020) [5].
Based on this point, the paper takes the “Administrative Measures for the determination of high and new technology enterprises” provision for R&D intensity in the “Certification Measures” as the starting point, and focuses on solving the following two issues: (1) Is there an innovative “incentive” catering behavior in the process of identification of high-tech enterprises in China? (2) Does the innovation “incentive” cater to the high-tech enterprise identification process have an impact on the innovation efficiency of the enterprise, and if so, is there an internal mechanism?
The structure of the article is as follows. First, the paper uses the threshold regression model to reveal the existence of catering behaviors in the process of identifying high-tech enterprises, and derives the corresponding catering interval. Secondly, the paper further studies the impact on innovation efficiency of enterprises if there is no innovation catering behavior. Thirdly, in the further study of innovation efficiency, the mediation effect of R&D investment and R&D subsidy is also discussed. Finally, relevant feasibility opinions based on the research results are put forward. Empirical research indicates that this research proves the hypothesis that innovation “incentives” conform to the behavioral assumptions of high-tech companies. Further, it is found that the true internal mechanism of high-tech enterprises that affects innovation efficiency is R&D investment and R&D subsidies.
The contributions of this paper start with “Certification Measures” and use a threshold regression model to verify that the enterprise innovation is “pseudo innovation” for enterprises to cater to the government. It is different from the existing research on high-tech enterprises, which are mostly based on the discrimination of “yes” or “no”, while ignoring the problems of “true” and “false”. This paper combines the enterprise’s “incentive” catering behavior for innovation with the recognition of high-tech qualifications, researches the problems and economic consequences of enterprises’ innovation “incentive” catering behavior in the process of identification, and explores the active catering behavior of enterprises to obtain more government R&D subsidies from the perspective of enterprises themselves. Furthermore, this paper treats the government as a neutral policy issuer and regulator, and enterprises as a rational subject to fight for high-quality scarce resources of the government. This paper also systematically studies the behavior of enterprises as rational subjects and caters to government policies according to the government’s own interests. Additionally, it also reveals the chaotic behavior of innovation in the process of identifying high-tech enterprises from an empirical point of view and verifies the effectiveness of the implementation of high-tech enterprise identification and, to a certain extent, policy. A new perspective for research on high-tech accreditation policies is also provided.

2. Theoretical Analysis and Research Hypotheses

In theory, in a completely free market, companies have no incentive to innovate, and innovation inputs themselves to obtain the property of public goods (Arrow, 1962) [6]. Therefore, most countries give preferential support to enterprise innovation activities when certain conditions are met. According to “External Control of Organization” published by Pfeffer and Salancik (1979) [7], the resource dependence theory holds true, due to environmental uncertainty and scarcity of resources.
The authors believe that high-tech certification lacks resources as free transfer payments, and not all companies adopt universal support. This is a crucial basis for “Certification Measures”, which lists a series of objective and subjective standards. High-tech enterprises are identified as an “innovation-incentive” industrial policy, facing the company’s strategic catering response behavior, identifying the true innovation intentions of the enterprise is a fairly complicated task. It is relatively economical to give equal resource support to companies that meet the identified standards. According to the theory of information asymmetry and the theory of signal transmission, in the case of information asymmetry between the two sides, the enterprise transmits the information that reaches the recognition threshold to the government department, so as to obtain the recognition of the government department. Secondly, from the perspective of enterprises and the external market, enterprises will obtain the recognition of high-tech enterprises as a good investment signal to the investors in the external market, as well as the enterprise’s innovation capabilities and industry prospects (Shen, Sha & Wu, 2020) [8], and then help companies obtain the required innovation resources to improve corporate performance (Kleer, 2010) [9]. An enterprise can only be recognized as a high-tech enterprise and enjoy a series of tax incentives and government subsidies if it releases “innovation signals” that comply with the “Recognition Measures”.
According to the assumption of a rational economic person, once the company applies policy insights, the company or management may obtain asymmetric information. Based on its own interests, the company would consider taking proactive measures to meet the recognition policy which is difficult for the government to really identify whether the applicant company caters to the behavior or the true state of innovation. At the same time, it is difficult to directly identify the catering behavior of application enterprises due to the existence of political connections such as false reports and rent-seeking of intermediary organizations. Therefore, it can be considered that some companies that do not have the corresponding qualifications or no longer meet the conditions, would take appropriate measures to obtain the high-tech enterprise certification or maintain the “high-tech enterprise” certification to obtain the relevant benefits. The following hypotheses are proposed based on the above analysis:
Hypotheses 1 (H1).
In the process of high-tech enterprises identify in China, there may be innovative “incentives” catering behavior.
According to the theory of resource dependence and signal transmission, obtaining the title of high-tech enterprise would undoubtedly affect the innovation of the enterprise while also bringing tax relief for the enterprise. Nevertheless, the government and external stakeholders have no ability to identify “authentic” high-tech enterprises, they can only make their own choices by further examining the capabilities of other aspects of the enterprise. Although in this process, the “catering company” still has to pass a high-tech qualification certification, it can still obtain more tax incentives. Qualification certification is only a product of the company’s response to the behavior and cannot directly generate the economic benefits that need to use the conduction mechanism to be completed. If “catering enterprise” intends to enhance its value like a real high-tech enterprise for a long time, it needs to rely on the pulling power policy, like corporate R&D investment and research and development subsidies, to help companies overcome difficulties or achieve sustainable development of the enterprise. Long-term dependence on unproductive behaviors such as catering will certainly inhibit the improvement of innovation efficiency. Therefore, regarding the research of Yi et al. (2017) [10], a model is established to investigate the effects of the innovation efficiency of high-tech enterprises, explore the impact of innovative “incentive” catering behaviors on corporate innovation efficiency, solve the previously mentioned second major problem, and closely question the mechanism of innovative “incentive” catering behaviors: In the process of high-tech enterprise identification, whether the innovation “incentive” catering behavior has an impact on the innovation efficiency of the enterprise If so, is there a mechanism of action?
Obtaining the title of high-tech enterprise will undoubtedly affect the innovation efficiency of the enterprise while bringing tax relief to the enterprise. Catering behavior has seriously distorted the effectiveness of high-tech enterprise policies, resulting in high-quality resources not being allocated to innovative enterprises that need urgent development. As a result, “pseudo high-tech” invests the scarce resources obtained into nonproduction and operation activities, weakens the promotion effect of policy identification on the innovation efficiency of enterprises, caters to the enterprises’ possible intensified use of the resources obtained for a new round of catering behavior, and creates a serious vicious cycle. The substantial innovation-oriented invention is the foundation of our life. The strategic behavior of unilaterally pursuing catering methods can indeed achieve high returns in a short period, but in the long run, it will not increase the efficiency of innovation. The innovation “incentive” catering behavior may induce strategic innovation for the purpose of catering policy. Many catering costs occupy the innovation resources of enterprises, thus damaging the innovation efficiency of enterprises and reducing the efficiency of social resource allocation. Therefore, the fundamental purpose of innovation “incentive” catering behavior is to obtain the tax relief brought by the recognition of high-tech enterprises. If the obtained high-quality innovation resources are not utilized in the innovation activities of the enterprise itself, it would be hard to improve the actual innovation level of the company, which, naturally, would be impossible to improve the innovation efficiency of the enterprise. On the contrary, high-tech enterprises that pass the recognition threshold through hard strength may obtain more room for improvement, and their innovation efficiency performance would be correspondingly better. Based on the above analysis, the following hypothesis is raised.
Hypotheses 2 (H2).
Innovation efficiency of high-tech enterprises without innovation “incentive” catering behavior will be better.
Existing studies have examined the impacts of government R&D subsidies on general innovation, and most conclusions are from the investigations of high-tech (Howell, 2017, Liu et al., 2016) [11,12] and emerging firms (Geldes et al., 2017, Huergo and Moreno, 2017) [13,14]. Innovation “incentive” catering behavior is a strategic innovation activity aimed at obtaining other short-term and high benefits. It largely reflects the “crowding effect” of innovation resources, which poses a huge challenge to the effectiveness of policies. As the cost of R&D investment increases, the company will measure whether the return it brings is sufficient to balance its costs, and companies on the edge of the identification threshold of high-tech companies will only need to spend a small amount of money. In return, after controlling their innovation investment to reach the recognition threshold, catering companies may not have the incentive to continue to increase R&D investment, but only need to keep their investment level stable—at a controllable level, to ensure that the requirements of the identification standards are always met. However, “True high-tech” companies will pay more attention to the improvement of their own innovation capabilities which will not stop at the threshold and stop their R&D activities. As Dai and Wang (2019) [15] pointed out, in order to release the signal of “innovative enterprises”, enterprises will set up “image projects” to cater to “innovate for innovation”. The independent innovation ability of enterprises is the key point of policy emphasis, so high-tech enterprises focus on innovation behavior aimed at promoting technological progress and maintaining competitive advantages. In addition, due to the government pressure on high-tech enterprises they will promote enterprises’ increased innovation (Lin & Luan 2020) [16]. Government subsidies, as one of the government’s macro-control measures, have played a vital role in China’s economic development, and government research and development subsidies have a self-evident role in promoting China’s innovation. For enterprises, government R&D grants are a significant source of funding. If an enterprise receives R&D subsidies, it can increase the company’s disposable funds for its management. Therefore, whether from the perspective of the company or from the perspective of the management, companies have an incentive to meet the relevant standards set by the government through dietary behavior, thereby obtaining government R&D subsidies. For the research object of this paper—high-tech enterprises, the government would examine the indicators related to enterprise innovation when issuing R&D subsidies, such as the proportion of enterprise R&D personnel, whether there are a research and development institution, and whether the innovation output is innovative. The requirements for granting R&D subsidies are more stringent than the standards recognized by high-tech enterprises. “True high-tech” companies that do not cater to behaviors pay more attention to the allocation of human and financial resources related to innovation. In government evaluations, indicators related to innovation can better meet the requirements of related indicators, thereby obtaining more R&D subsidies. Based on the above analysis, the authors believe that, compared with companies that do not have catering behaviors, catering behavior cannot really improve the performance of R&D investment and R&D subsidies.
Hypotheses 3 (H3).
High-tech enterprises without innovative “incentives” catering behavior, will receive higher R&D investments and subsidies.
In the previous hypothesis analysis, the above content has discussed in detail the relationship between the innovative “incentive” catering behavior of high-tech companies, R&D investment, and R&D subsidies. The impact of corporate R&D investment and subsidies on corporate innovation efficiency is self-evident. As a source of funding for corporate innovation, R&D investment, and corporate R&D subsidies have a fundamental impact on the company’s technological innovation capabilities. Through empirical analysis, many scholars have found that enterprises’ R&D investment and R&D subsidies can significantly affect their innovation. “Pseudo-high-tech” companies have no incentive to control their innovation investment to continue to increase R&D investment after reaching the recognition threshold, but can only maintain their investment level at a controllable level to ensure that they meet the requirements and always meet the certification standards. However, “true high-tech” enterprises will pay more attention to the improvement of their own innovation capabilities. They will not stop their R&D activities at the threshold and continue to increase their R&D investment. Additionally, “true high-tech” enterprises can also get more R&D subsidies, which means enterprises have more funds for innovation activities, so the innovation efficiency of enterprises will also increase at the same time. In light of this, the following assumption is made:
Hypotheses 4 (H4).
R&D investment and R&D subsidies play an intermediary role in the relationship between innovation “incentives” catering behavior and corporate innovation efficiency.
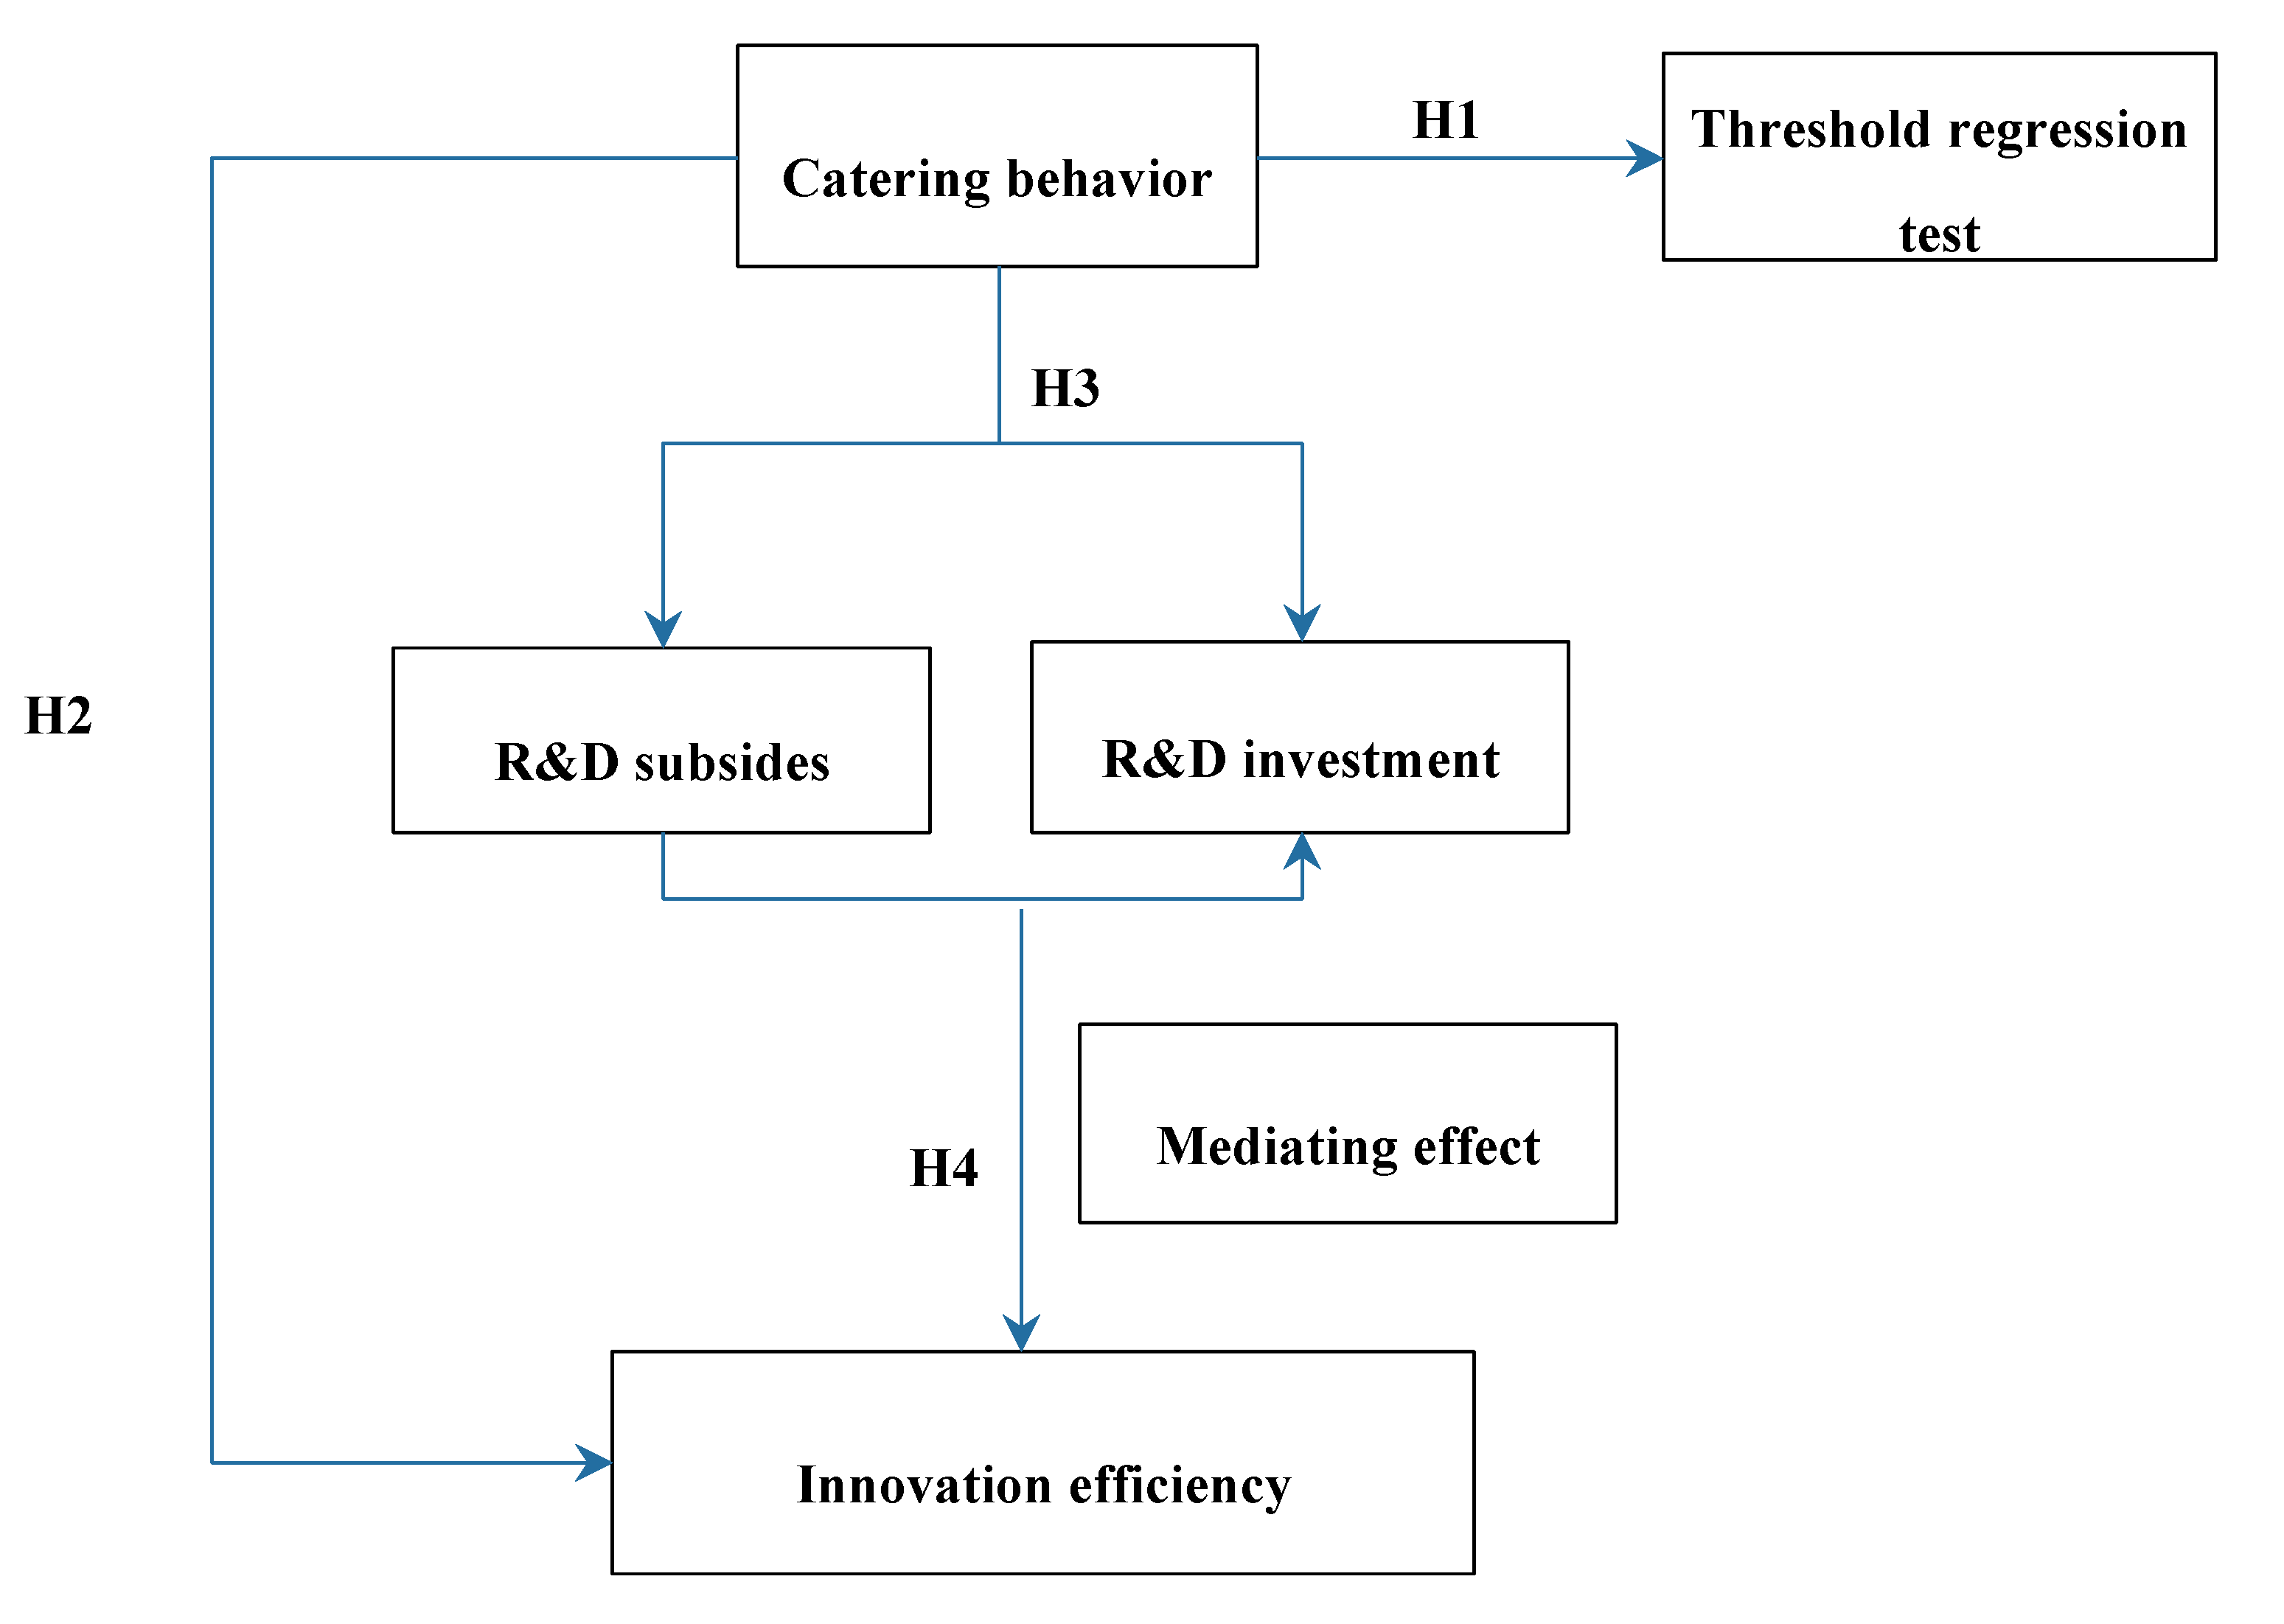
The theoretical model of this paper is shown in Figure 1.

3. Sample Selection and Research Design

3.1. Sample Selection

Based on the analysis of the advantages and disadvantages, accuracy, and cost of existing scholars’ sample selection methods, a more reasonable method for high-tech companies’ sample selection is proposed. First, the stock code data of all Chinese A-share listed companies from 2008 to 2017 was derived from the CSMAR database, and matched with the CSMAR qualification certification database to determine the sample data of the parent company and the subsidiary as high-tech, respectively. Secondly, according to the provisions of the “Certification Measures”, if it is identified as a high-tech enterprise, the income tax benefit that can be enjoyed is 15%, and the validity period is 3 years. Then, this paper utilized the tax rate data of CSMAR to cross-check the sample data of high-tech companies in the three years after identification to determine whether the company still enjoys a 15% tax benefit, and to further determine the completeness and accuracy of the sample. If there was a mismatch, the manual collection of the annual report and official website data were compared, and finally, the appropriate sample of high-tech enterprises was determined. Because some listed companies did not disclose the identity of high-tech enterprises in their annual reports or disclosed their recognition of high-tech enterprises, the subsequent annual reports did not disclose whether they passed the review or not. Whether a listed company qualified as a high-tech enterprise will be determined if it does not apply for a review, fails the review, or is disqualified as a high-tech enterprise. It is vital for the research samples and conclusions of this paper. Therefore, in addition to collating the samples listed in the qualification certification database, the paper also combines the “high-tech enterprise certification management work”. The public documents on various websites on the Internet further determine the sample high-tech enterprise qualifications to ensure that the data are authentic and reliable. In summary, the data sources of the paper mainly involve the following aspects: (1) the main financial data come from the CSMAR database (http://cn.gtadata.com) and the CCER database (http://www.ccerdata.cn); (2) the data of enterprise R&D investment comes from the WIND database (https://www.wind.com.cn); (3) the sample of high-tech enterprises comes from CSMAR accreditation database and tax rate database (http://cn.gtadata.com); (4) Government R&D subsidy data were manually collected.

3.2. Definition of High-Tech Enterprises

According to the “Certification Measures”, high-tech enterprises refer to resident enterprises that carry out continuous research, development, and transformation of scientific and technological achievements in high-tech fields supported by the state and have core independent intellectual property management activities. In addition, the government science and technology department and the taxation department jointly identify high-tech enterprises as responsible persons. The applicant must meet the following eight hard conditions in the Table 1 at the same time, as follows:

3.3. Variables Definition

3.3.1. Definition of Ingratiatory

This paper draws on the research of Burgstahler and Dichev (1997) [17,18] to define the “micro-profit” and “micro-increased” companies. From the perspective of data analysis, there are two types of companies that believe that they should meet the “incentives” for high-tech recognition of innovation: companies whose R&D investment indicators do not meet the recognized standards of high-tech companies and the threshold for suspected behavior. Specifically, we can see Table 2, the threshold is measured by 1% exceeding the recognition threshold (see threshold regression model results for the specific index algorithm). In the current literature, it is generally considered that companies hovering around the threshold of indicators have stronger catering motivation. According to the R&D intensity standards stipulated in the “Certification Measures”, it is believed that high-tech companies that meet the following conditions may adopt innovation “incentives” catering behaviors. Specifically, the paper considers companies with R&D intensity equal to or less than the range to be “pseudo-high-tech”, and a value of zero is possible to cater behavior, otherwise the company is deemed to be “true high-tech” and assigned a value of one.

3.3.2. Other Variables Definition

Table 3 shows additional variables variables. Innovation efficiency—when an enterprise is carrying out innovation, the greater the innovation efficiency, the more motivation the enterprise has to carry out innovation activities. Therefore, exploring innovation efficiency is of great significance in the field of innovation research. DEA is used to measure enterprise innovation efficiency, using three indicators of enterprise R&D investment intensity, technical personnel investment intensity, and Tobin’s Q value to measure the innovation input of high-tech enterprises. At the same time, the innovation output of high-tech enterprises is measured by proxy indexes such as the number of patents per capita, the ratio of technological assets, the growth rate of operating income and the profit rate of the main business. The remaining control variables mainly include company size, property rights, company growth, sales scale, asset liability ratio, cash, return on total assets, comprehensive tax rate, shareholders, independent directors proportion and incentives management compensation.

3.4. Model Specification

In order to avoid the subjective bias that may be caused by dividing the high-tech enterprises’ catering interval artificially, this paper adopts the method of Hansen (1999) [19] and Yeh (2010) [20], which uses a threshold regression model to solve such problems. Specifically, a threshold regression model is assumed to exist as follow. Among them, the dependent variable is enterprise innovation efficiency ( I E ), the threshold variable is R&D intensity ( R D ), I is indicative function, T is the threshold to be estimated, α is the intercept term estimated by the model, β i is the regression coefficient of each variable, ε is the random interference term. The remaining variables are the control variables.
I E i , t = α + β 1 R D i , t I ( R D i , t T ) + β 2 R D i , t I ( R D i , t > T ) + β 3 S I Z E i , t + β 4 S O E i , t                                + β 5 G r o w t h i , t + β 6 S a l e s i , t + β 7 L E V i , t + β 8 C a s h i , t + β 9 R O A i , t                                + β 10 T A X i , t + β 11 S i , t + β 12 I n d i r i , t + β 13 l n   M S i , t + ε
Learning from Bollen and Stine (1990) [21], Zhao et al. (2010) [22] and Hayes (2017) [23] used a stepwise regression method to test the mediation effect and established the following model to study the economic consequences and internal mechanism of high-tech enterprises’ catering behavior.
Equation (2) mainly tests the relationship between the “incentive” of catering to innovation and the efficiency of enterprise innovation;
I E i , t = α 0 + β 1 I n g r a t i a t o r y i , t + β 2 S I Z E i , t + β 3 S O E i , t + β 4 G r o w t h i , t + β 5 S a l e s i , t                                + β 6 L E V i , t + β 7 C a s h i , t + β 8 R O A i , t + β 9 T A X i , t + β 10 S i , t + β 11 I n d i r i , t                                + β 12 l n   M S i , t + ε
Equations (3) and (4) are mainly used to explain the relationship between innovation “incentive” catering behavior and R&D investment and R&D subsidy;
R D i , t = α 0 + β 1 I n g r a t i a t o r y i , t + β 2 S I Z E i , t + β 3 S O E i , t + β 4 G r o w t h i , t + β 5 S a l e s i , t                                + β 6 L E V i , t + β 7 C a s h i , t + β 8 R O A i , t + β 9 T A X i , t + β 10 S i , t + β 11 I n d i r i , t                                + β 12 l n   M S i , t + ε
R D S i , t = α 0 + β 1 I n g r a t i a t o r y i , t + β 2 S I Z E i , t + β 3 S O E i , t + β 4 G r o w t h i , t + β 5 S a l e s i , t                                + β 6 L E V i , t + β 7 C a s h i , t + β 8 R O A i , t + β 9 T A X i , t + β 10 S i , t + β 11 I n d i r i , t                                + β 12 l n   M S i , t + ε
Equations (5) and (6) are mainly used to explain the relationship between R&D investment and R&D subsidies and innovation efficiency of enterprises, which is a factor to be tested if a significantly positive, the assumption has been verified.
I E i , t = α 0 + β 1 R D i , t + β 2 S I Z E i , t + β 3 S O E i , t + β 4 G r o w t h i , t + β 5 S a l e s i , t + β 6 L E V i , t                                + β 7 C a s h i , t + β 8 R O A i , t + β 9 T A X i , t + β 10 S i , t + β 11 I n d i r i , t                                + β 12 l n   M S i , t + ε
I E i , t = α 0 + β 1 R D S i , t + β 2 S I Z E i , t + β 3 S O E i , t + β 4 G r o w t h i , t + β 5 S a l e s i , t + β 6 L E V i , t                                + β 7 C a s h i , t + β 8 R O A i , t + β 9 T A X i , t + β 10 S i , t + β 11 I n d i r i , t                                + β 12 l n   M S i , t + ε
In order to further study the internal mechanism of high-tech enterprises that affect the innovation efficiency of enterprises, the variables of R&D input and subsidies were added to Equation (2) to test, and the following model was established:
I E i , t = α + β 1 I n g r a t i a t o r y i , t + β 2 R D i , t + β 3 S I Z E i , t + β 4 S O E i , t + β 5 G r o w t h i , t                                + β 6 S a l e s i , t + β 7 L E V i , t + β 8 C a s h i , t + β 9 R O A i , t + β 10 T A X i , t + β 11 S i , t                                + β 12 I n d i r i , t + β 13 l n   M S i , t + ε
I E i , t = α + β 1 I n g r a t i a t o r y i , t + β 2 R D S i , t + β 3 S I Z E i , t + β 4 S O E i , t + β 5 G r o w t h i , t                                + β 6 S a l e s i , t + β 7 L E V i , t + β 8 C a s h i , t + β 9 R O A i , t + β 10 T A X i , t + β 11 S i , t                                + β 12 I n d i r i , t + β 13 l n   M S i , t + ε

4. Empirical Analysis

4.1. An Empirical Analysis of the Enterprise “Incentive” Catering Behavior

4.1.1. Descriptive Statistics

Table 4 is the descriptive statistics ratio of R&D investment to the operating income of the sample. From 2012 to 2017, the proportion of R&D investment in high-tech enterprises increased generally. It verifies to a certain extent the effectiveness of the high-tech enterprise qualification certification policy in encouraging enterprise investment and innovation and provides strong support for China to continue to implement high-level incentive policies. Nonetheless, whether it is the result of independent innovation based on its own development needs, or the existence of catering behavior, remains to be tested empirically. At the same time, we can also see that despite the continuous improvement in R&D intensity, the average and median of each year fluctuate around 4% and 3%, which is very close to the 3% and 4% threshold standards stipulated in the “Certification Measures”. Based on this, the paper speculates that in the process of identifying high-tech enterprises, some listed companies may obtain high-tech enterprise quotas by catering to the identification standards. Next, the threshold regression model is used to specifically verify whether there is such a critical point.

4.1.2. Threshold Regression Model Test

First, testing the threshold effect. Second, determining the number of observation thresholds under the threshold effect. Finally, the threshold value in the threshold regression model is solved with the sequential estimation method proposed by Hansen (1999) [18]. On this basis, the estimated value of each threshold is tested, and the confidence interval of the threshold is constructed.
From the results in Table 5 and Table 6, at the 5% significance level, a single threshold passed the test and a double threshold failed. The estimated value of the single threshold is 0.0370, which is within the 95% confidence interval (0.0361, 0.0371), and the double threshold effect is not significant, so there is no need to test the truth of the threshold estimate.
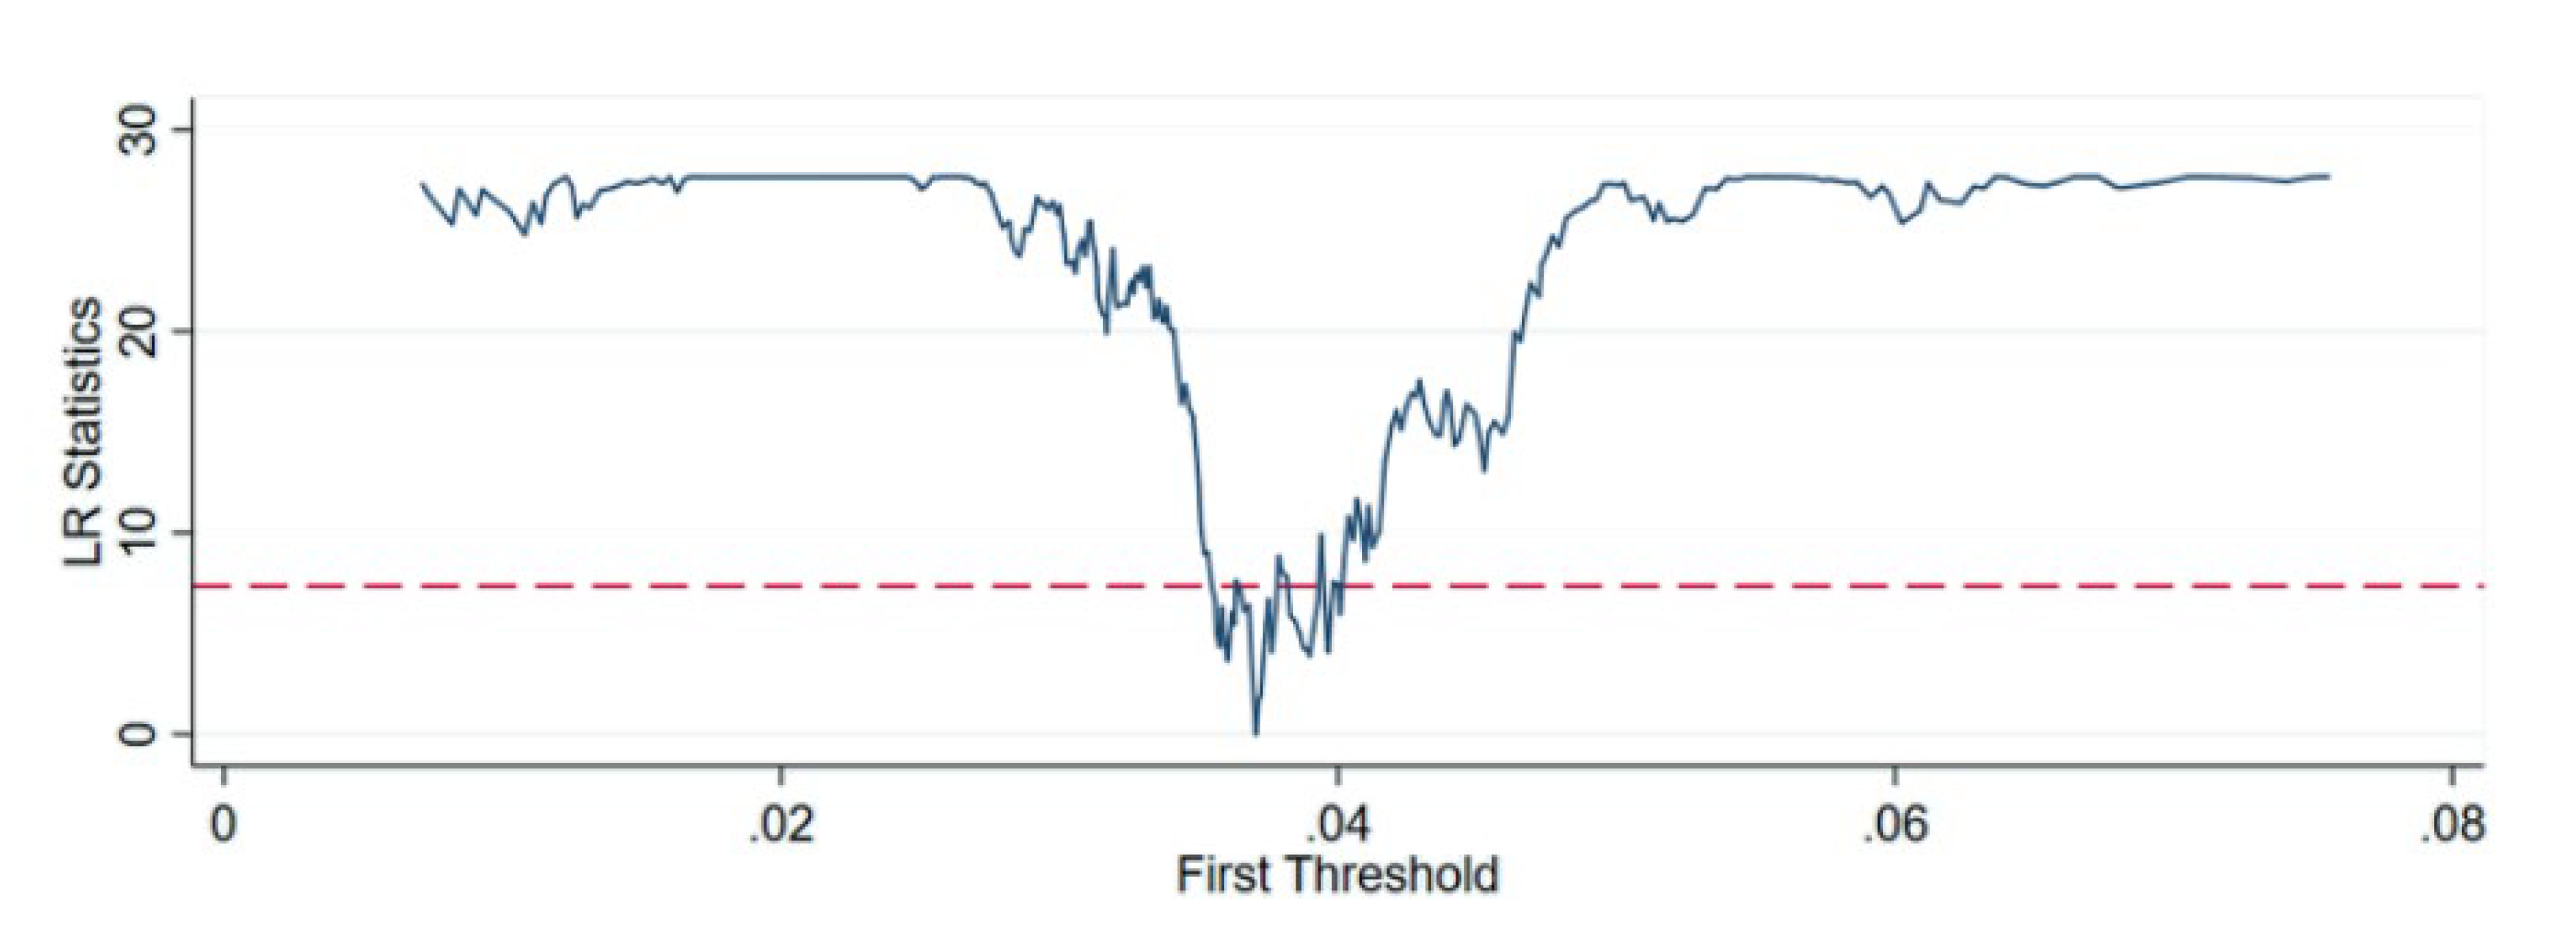
Then, based on the regression results of the threshold effect model, this paper draws the corresponding likelihood ratio function graph, depicting the correspondence between the LR value and the threshold, to more intuitively see that there is a catering behavior of innovation investment in the identification process of high-tech enterprises.
As is shown in Figure 2, in the threshold model, the threshold parameter estimated value is 0.0370. The 95% confidence interval of the threshold estimate is the interval formed by the value of the critical value (corresponding to the dotted line in the figure) when the LR value has less than a 5% significance level. The estimated threshold value is equal to the true value, whose threshold value is true and effective. According to the conclusion of the threshold regression model, for the impact of R&D intensity on the innovation efficiency of enterprises there exists a threshold effect. The paper takes the threshold value of 3.70% as the boundary and combines the minimum standards for R&D investment of enterprises with a sales income of more than 200 million (RMB) as stipulated in the management determination method. The minimum standard of 3% is the lower limit. In the (3%, 4%) interval, the R&D intensity of high-tech enterprises is significantly negatively correlated with the enterprise value, but it is significantly positively correlated in the interval above 4%. It provides test evidence and an explanation range for the existence of the identified behavior of high-tech enterprises. Next, this article will test the economic consequences of R&D investment intensity by learning from previous earnings management research ideas for corporate profit manipulation. The “Certification Measures” set three identification thresholds for R&D intensity: 6%, 4% and 3%. In this paper, the samples are grouped according to the sales income of high-tech companies, with the R&D intensity interval as the horizontal axis and the number of samples in the interval as the vertical axis. (In the sample companies, there are less than 10 sample observations, and the sample observations with sales revenue less than 200 million yuan are not representative, so they are deleted from the total number of samples).
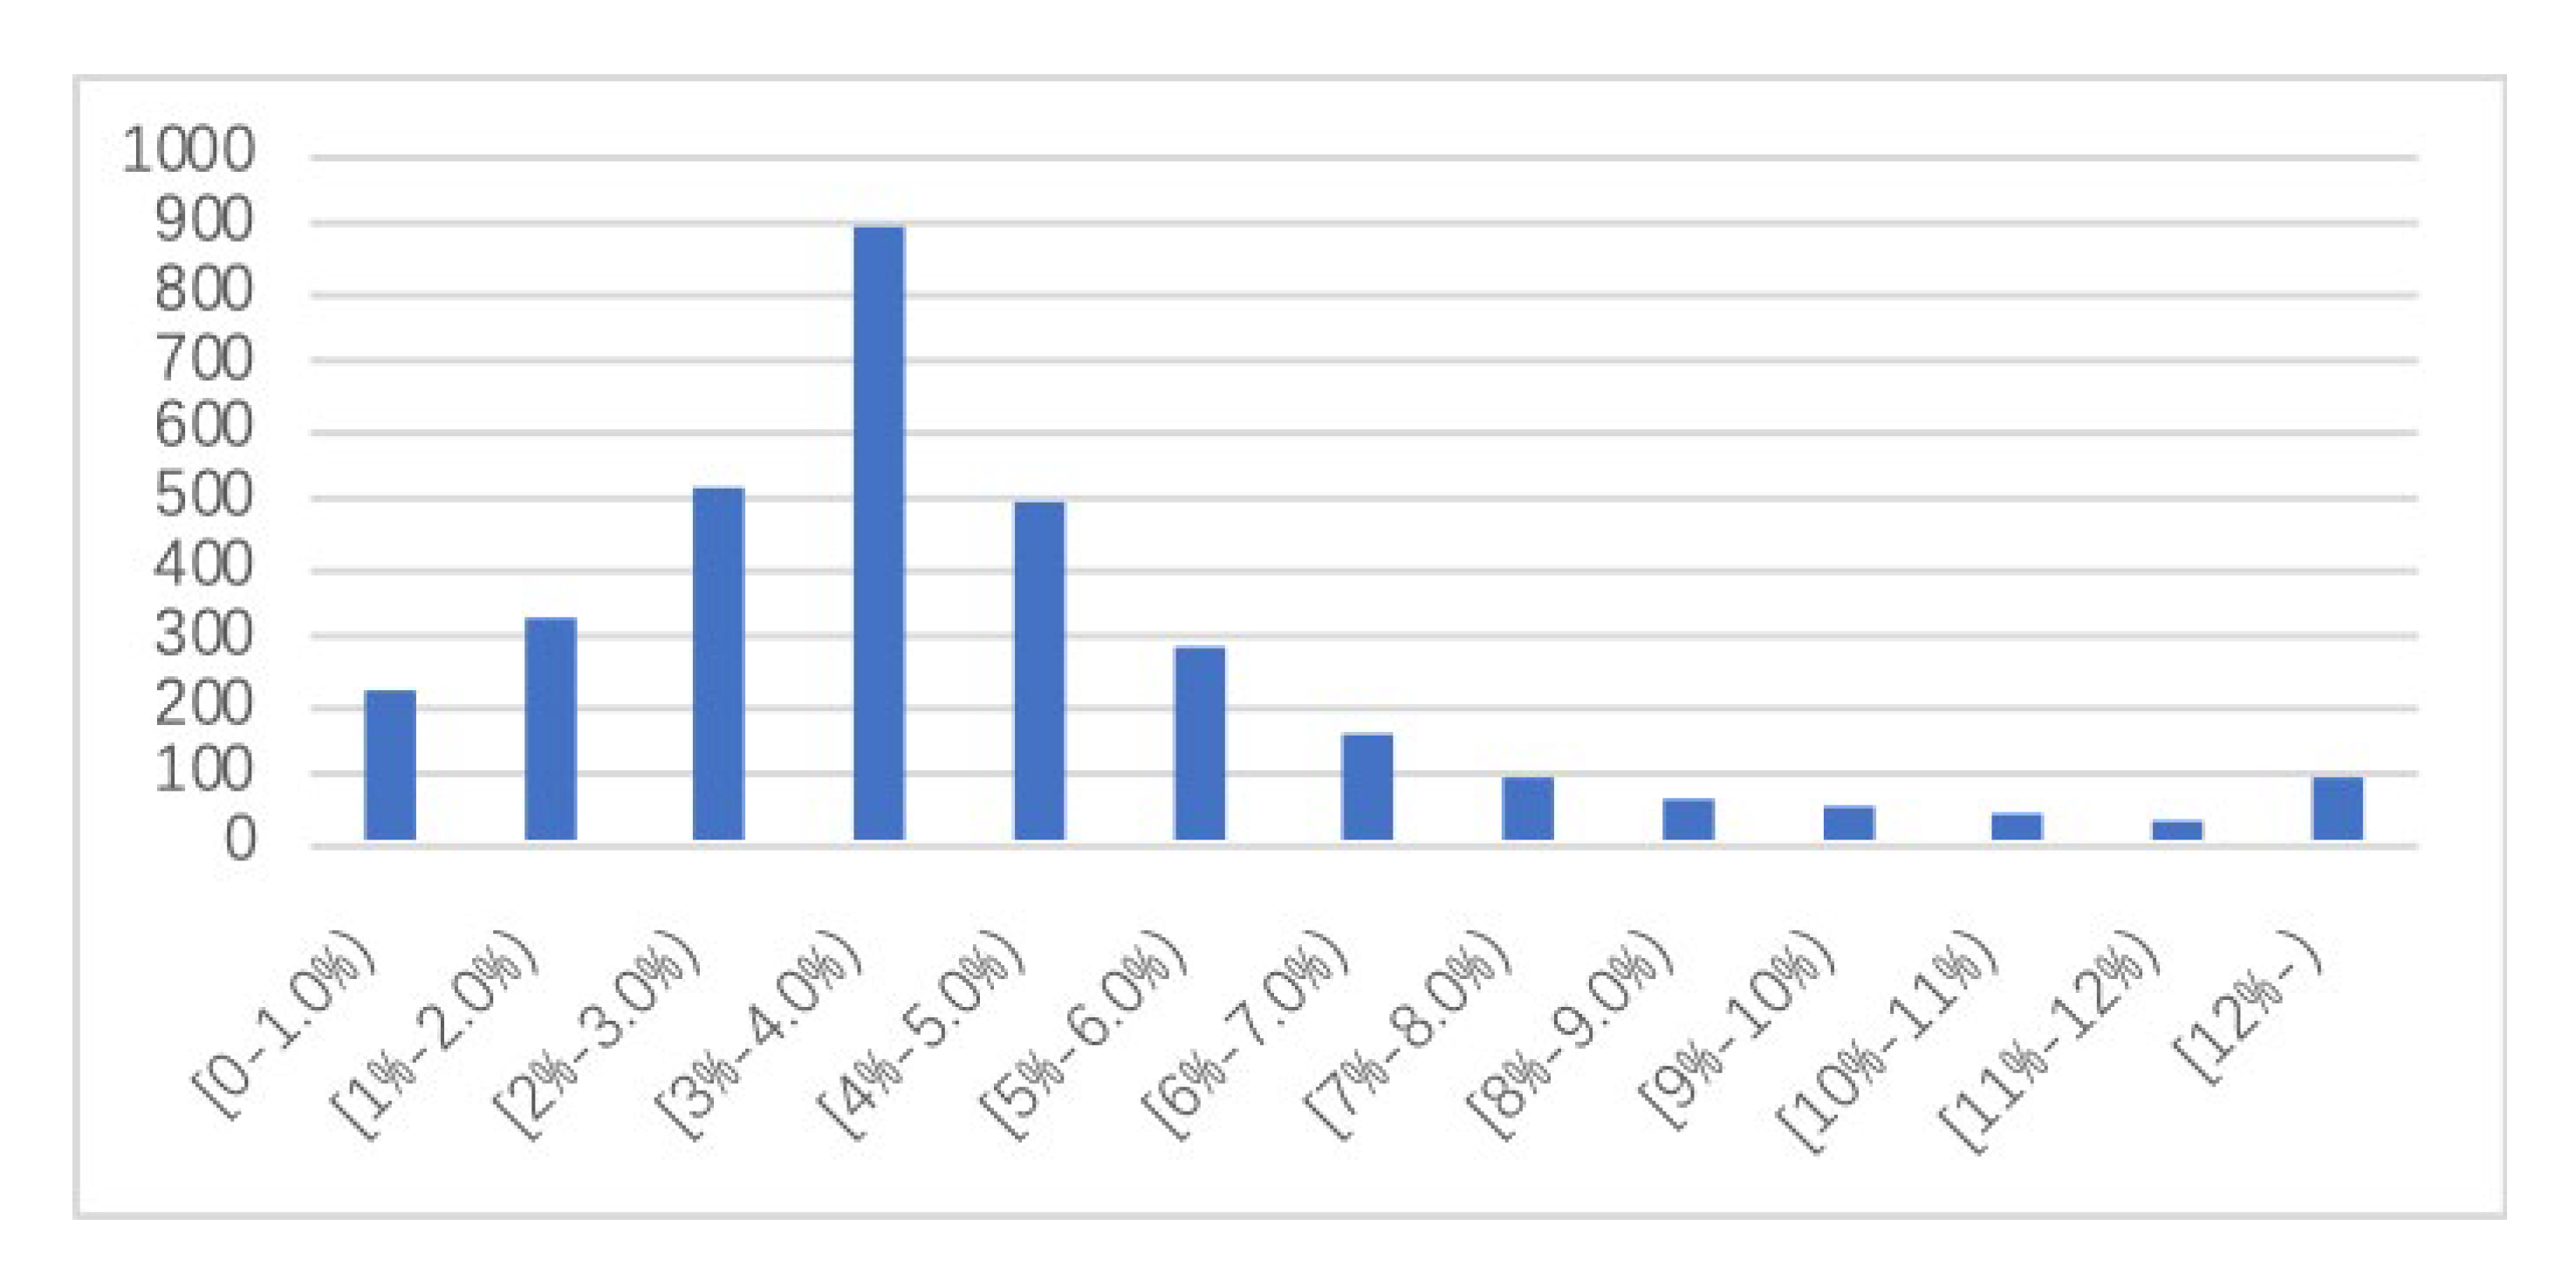
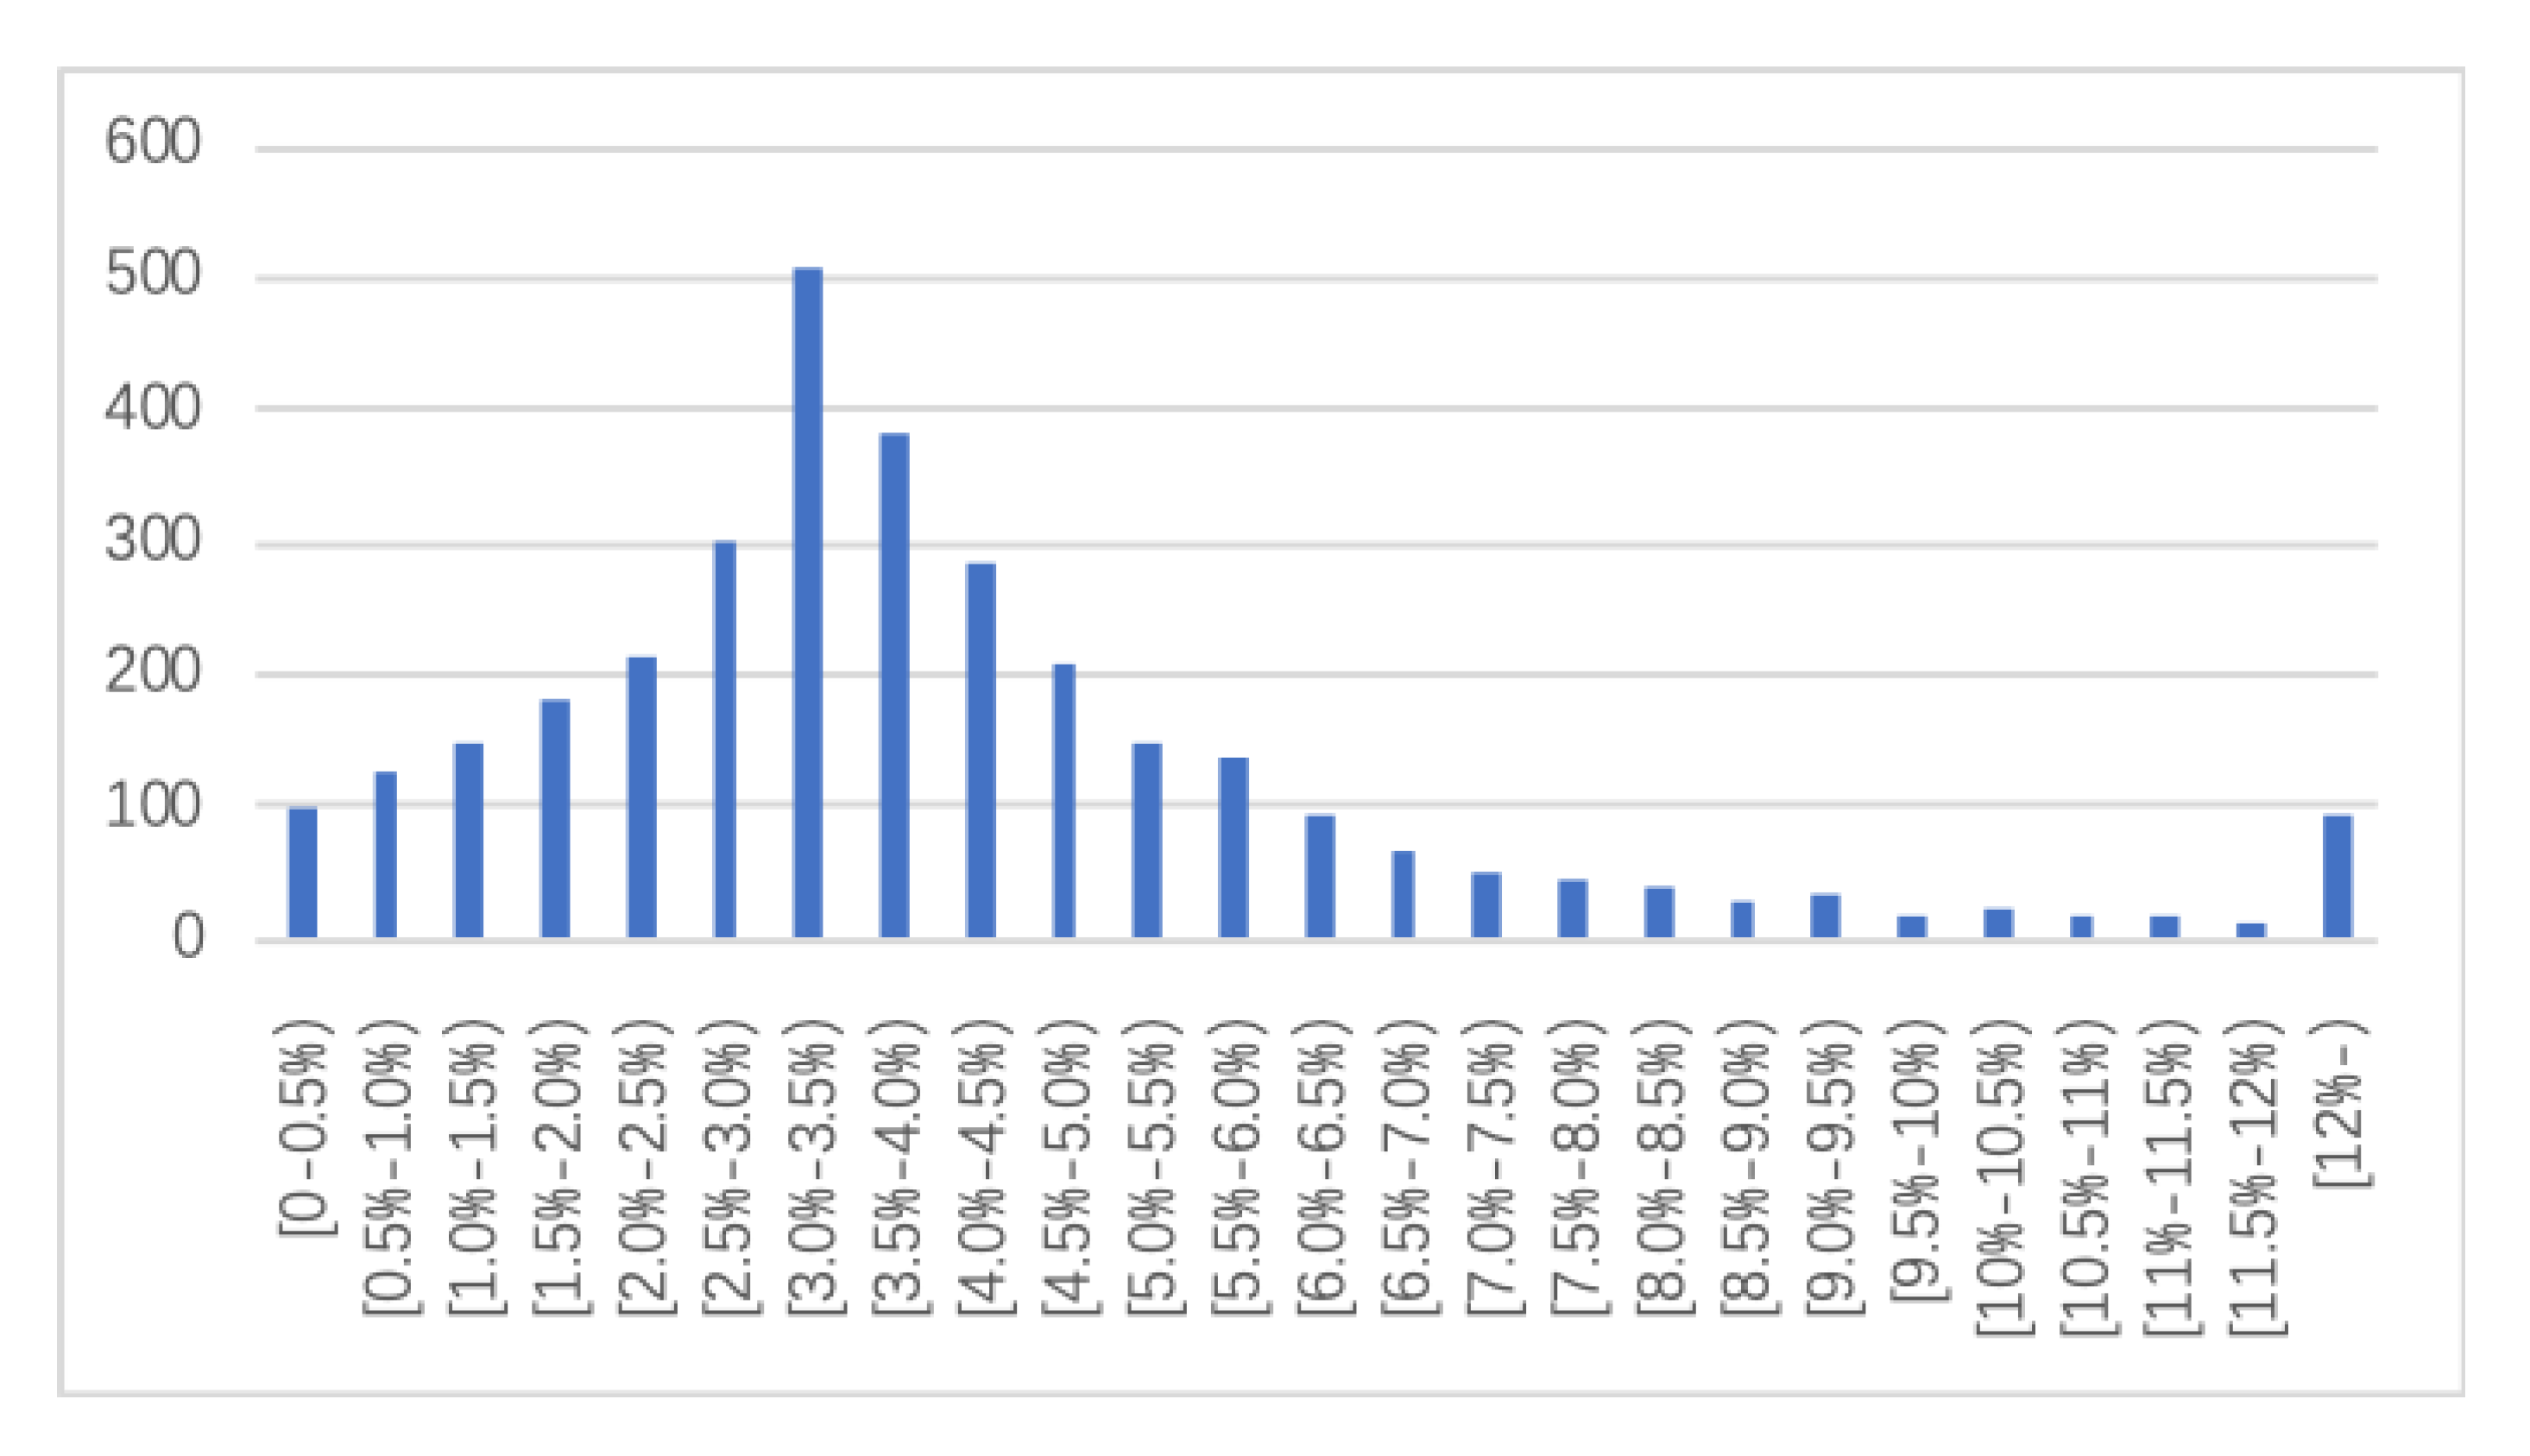
Figure 3 is a statistical chart of the test when the sales revenue is more than or equal to 200 million RMB, and the number of samples whose R&D intensity is in the (3%, 4%) range suddenly increases. This article takes a high-tech enterprise with a sales income of more than 200 million yuan as an example. The number of observations within the threshold range of (3%, 4%) is 892, and the number of observations within these two ranges is 512 and 493, which is significantly higher than the number of observations in the two sides intervals. The above statistics charts show that to reach the recognition threshold of high-tech enterprises, some high-tech enterprises will indeed conduct innovation “incentives” to meet the recognition criteria. In order to ensure the robustness of the results, the sample distribution with the interval width of 0.5% is drawn in the Figure 4, and the results are completely consistent.

4.2. Intermediary Effect Test of Innovation “Incentive” Catering Behavior and Enterprise Innovation Efficiency

(1) Empirical test on catering behavior identification and high-tech enterprises innovation efficiency.
In Table 7, the Ingratiatory coefficient of innovation “incentive” catering behavior in Equation (2) is significantly positive at the level of 1%, which indicates that the innovation efficiency of high-tech enterprises without an innovation “incentive” to catering behaviors would be better. It is difficult to really improve the innovation efficiency of enterprises to meet the recognition threshold of high-tech enterprises through innovation “incentive” catering behavior, hypothesis two passes the verification. The results also demonstrate that in a fierce market competition environment, strategic behaviors that only rely on catering policies to gain more support cannot win the market, nor can they improve innovation efficiency.
(2) Test of the relationship between innovation “incentive” catering behavior, R&D investment, and R&D subsidy.
In Table 7, the incentive coefficient of the innovation “incentive” in Equation (3) on the catering behavior is positive, significantly 1%, which indicates that the “innovation” of high-tech services for enterprises is only a strategic behavior, not a strategic behavior. This kind of real innovation based on its own development strategy activities, and that pursues short-term effects cannot keep the company’s innovation capability at a high level for a long time. The ingratiatory coefficient of innovation “incentive” catering behavior in Equation (4) is positive at the 5% level, which also shows that high-tech companies without catering behavior can get more R&D subsidies. Thus, hypothesis three passes verification. The coefficient R&D input (RD) that caters to innovation “incentives” in Equation (5), is significantly positive at the level of 1%, indicating that the R&D investment of high-tech enterprises can positively promote the efficiency of enterprise innovation. The R&D subsidy (RDS) coefficient of the innovation “incentive” catering behavior in Equation (6) is remarkably positive at the 5% level, which also demonstrates that the R&D subsidies obtained by high-tech companies can positively promote the efficiency of corporate innovation.
(3) An empirical test of innovation “incentive” catering behavior and corporate innovation efficiency: intermediary test based on R&D investment and R&D subsidy.
According to the traditional stepwise regression test model, Equation (2) has proved that the catering behavior of high-tech companies has a significant impact on the innovation efficiency of enterprises, that is, the tested coefficient of stepwise regression testing is significant; then, Equations (3) and (4) also verify the catering behavior of high-tech companies. Both R&D investment and R&D subsidies have a critical impact, that is, the tested coefficient is also significant; subsequently, Equations (5) and (6) also verify that the R&D investment and R&D subsidies of high-tech enterprises have a vital influence on the innovation efficiency of enterprises, that is, the tested coefficient is also significant. Finally, the coefficient of the independent variable ingratiatory in Equations (7) and (8)is significantly positive at the 1% level. In other words, the tested coefficient is significant, and the coefficients of the intermediate variables RD and RDS are also significantly positive at the level of 10% and 5%, respectively. Thus, the tested coefficient is significant. According to the test steps, we can know that the R&D investment and R&D subsidies have played a part in the intermediary role in the identification of catering behavior and innovation efficiency of high-tech enterprises. Hypothesis four is verified, which also illustrates that high-tech enterprises that do not demonstrate catering behavior can positively affect their innovation efficiency through R&D investment and R&D subsidies.

5. Conclusions and Limitations

5.1. Conclusions

Through empirical inspection of the threshold regression model, this paper finds that there is a threshold effect on the R&D intensity of high-tech enterprises, with a threshold value of 0.0370. The “identification method” is taken as the objective identification standard, which is 6%, 4%, and 3% of the R&D intensity of high-tech enterprises, and this threshold is the limit. Furthermore, the high-tech enterprises in our country are divided into two categories: the existence of innovation input catering behavior and the absence of innovation input catering behavior. The empirical results show that the “one size fits all” objective recognition threshold standard in the recognition method would indeed urge some enterprises to adopt catering behavior, supporting the innovation input catering hypothesis.
Different from previous studies, it is found that the mechanisms of the effect of tax preference on innovation efficiency in real high-tech enterprises are R&D investment and R&D subsidy. The test results demonstrate that the innovation efficiency, R&D investment, and R&D subsidy of high-tech enterprises without innovation input catering behavior have better performances.

5.2. Suggestions

The key to an enterprise’s development through technological innovation is to give full play to its subjective initiative and increase its enthusiasm for independent research and development, and make the innovation capability of the enterprise sustainable. From the perspective of the enterprise itself, it can be seen from the results of empirical research that if they rely solely on catering behaviors to obtain high-tech qualifications, then they cannot fundamentally resolve the problem of the insufficient innovation ability of enterprises, and deeper influencing factors should be considered. The immediate short-term benefits should be based on the role of technological innovation and research and development subsidies in promoting the efficiency of corporate innovation.
Under the current economic development model, the government should allocate resources reasonably. For example, to better survive and develop in fierce competition, companies have enough motivation to actively or passively win the trust of government officials, which is also the result of the government’s resources. Nonetheless, actively seeking political connections to obtain government R&D subsidies, only to a certain extent guarantees funding sources for technological innovation. To truly give play to the incentive effect of the R&D subsidy policy, enterprises should invest funds in R&D projects in accordance with regulations after obtaining resources to avoid transfers. Through the rational use of R&D subsidies to ensure a certain level of the input–output rate, it is possible to improve the efficiency of the use of government R&D subsidies to promote the innovation and development of the company. Meanwhile, in the process of enterprise development, the uncertainty brought about by the institutional environment must be continuously monitored and business strategy adjusted continuously. Therefore, enterprises should use corporate resources for the company’s business development and technological innovation, fully participate in market competition, and resolve financing constraints through multiple channels, instead of relying on political connections to obtain funds from the government. After all, the relationship between the government and enterprises is unsustainable, and there is no long-term guarantee that the company’s R&D funds will be in place. At the same time, enterprises should also implement technology innovation incentive mechanisms, introduce research and development personnel, improve research and development efficiency, and improve the innovation capacity of enterprises.

5.3. Limitation

The research on the catering behavior of high-tech enterprises is limited to the aspect of innovation investment, without comprehensive consideration of other elements of the “Certification Measures”. The paper starts from the objective provisions of the R&D intensity in the “Assessment Measures”, and empirically tests the catering behavior of high-tech enterprises’ innovation input and its impact on innovation efficiency. In the definition of catering behavior, only the identification standard of R&D intensity is considered, without in-depth consideration of the possible catering phenomena in subjective indicators such as the proportion of R&D personnel, the proportion of new product sales revenue, and patents.
The response of the capital market to corporate innovation investment should be further investigated. When considering the economic consequences of high-tech enterprises, the article only examines the innovation efficiency of enterprises and does not thoroughly examine the impact of such aspects on enterprise value. Moreover, considering that the development of the stock market is not completely sound, whether there will be adverse selection of innovation investment catering behavior of high-tech enterprises is unclear. Thus, the research on the response of the capital market to the catering behavior of high-tech enterprises is also a relatively urgent issue. This paper does not cover it further and needs to be strengthened later.
Author Contributions

Writing, Y.Z. and Z.S.; Collected data and estimated the empirical model, Y.Z. and L.W.; Writing—review and editing, Y.Z.; X.W. and L.Z. All authors have read and agreed to the published version of the manuscript.

Funding

This research was supported by 2019 Fundamental Research Funds for the Central Universities (No. 2019WP06); 2018 The National Social Science Fund of China (No. 18FGL019); 2018 Ministry of Education Humanities and Social Sciences Research Planning Fund (No. 18YJA790070).

Acknowledgments

The authors wish to appreciate the valuable comments of the anonymous reviewers. All errors remain the sole responsibility of the authors.

Conflicts of Interest

The authors declare no conflict of interest.

References

  1. APEC Study Center of Nankai University. China-APEC: Cooperation, Development, Better Future, 1st ed.; China Intercontinental Press: Beijing, China, 2014. [Google Scholar]
  2. Baker, M.; Wurgler, J. A Catering Theory of Dividends. J. Financ. 2004, 59, 1125–1165. [Google Scholar] [CrossRef]
  3. Nayak, D.; Choudhury, R.N. A Selective Review of Foreign Direct Investment Theories (No. 143); ARTNeT Working Paper Series; ESCAP: Bangkok, Thailand, 2014. [Google Scholar]
  4. Su, Z.; Xiao, Z.; Yu, L. Do political connections enhance or impede corporate innovation? Int. Rev. Econ. Financ. 2019, 63, 94–110. [Google Scholar] [CrossRef]
  5. Song, M.; Wang, S.; Zhang, H. Could environmental regulation and R&D tax incentives affect green product innovation? J. Clean. Prod. 2020, 258, 120849. [Google Scholar] [CrossRef]
  6. Arrow, K.; Hurwicz, L. Competitive Stability under Weak Gross Substitutability: Nonlinear Price Adjustment and Adaptive Expectations. Int. Econ. Rev. 1962, 3, 233–255. [Google Scholar] [CrossRef]
  7. Stern, R.; Pfeffer, J.; Salancik, G. The External Control of Organizations: A Resource Dependence Perspective. Contemp. Sociol. 1979, 8, 612. [Google Scholar] [CrossRef]
  8. Shen, J.; Sha, Z.; Wu, Y. Enterprise Adaptive Marketing Capabilities and Sustainable Innovation Performance: An Opportunity–Resource Integration Perspective. Sustainability 2020, 12, 469. [Google Scholar] [CrossRef] [Green Version]
  9. Kleer, R. Government R&D subsidies as a signal for private investors. Res. Policy 2010, 39, 1361–1374. [Google Scholar] [CrossRef] [Green Version]
  10. Yi, J.; Hong, J.; Hsu, W.; Wang, C. The role of state ownership and institutions in the innovation performance of emerging market enterprises: Evidence from China. Technovation 2017, 62–63, 4–13. [Google Scholar] [CrossRef]
  11. Howell, A. Picking ‘winners’ in China: Do subsidies matter for indigenous innovation and firm productivity? China Econ. Rev. 2017, 44, 154–165. [Google Scholar] [CrossRef]
  12. Liu, X.; Li, X.; Li, H. R&D subsidies and business R&D: Evidence from high-tech manufacturing firms in Jiangsu. China Econ. Rev. 2016, 41, 1–22. [Google Scholar] [CrossRef]
  13. Geldes, C.; Felzensztein, C.; Palacios-Fenech, J. Technological and non-technological innovations, performance and propensity to innovate across industries: The case of an emerging economy. Ind. Mark. Manag. 2017, 61, 55–66. [Google Scholar] [CrossRef]
  14. Huergo, E.; Moreno, L. Subsidies or loans? Evaluating the impact of R&D support programmes. Res. Policy 2017, 46, 1198–1214. [Google Scholar] [CrossRef] [Green Version]
  15. Dai, X.; Wang, F. Does the high- and new-technology enterprise program promote innovative performance? Evidence from Chinese firms. China Econ. Rev. 2019, 57, 101330. [Google Scholar] [CrossRef]
  16. Lin, B.; Luan, R. Do government subsidies promote efficiency in technological innovation of China’s photovoltaic enterprises? J. Clean. Prod. 2020, 254, 120108. [Google Scholar] [CrossRef]
  17. Burgstahler, D.; Dichev, I. Earnings management to avoid earnings decreases and losses. J. Account. Econ. 1997, 24, 99–126. [Google Scholar] [CrossRef]
  18. Jacob, J.; Jorgensen, B. Earnings Management and Accounting Income Aggregation. J. Account. Econ. 2007, 43, 369–390. [Google Scholar] [CrossRef]
  19. Hansen, B. Threshold effects in non-dynamic panels: Estimation, testing, and inference. J. Econom. 1999, 93, 345–368. [Google Scholar] [CrossRef] [Green Version]
  20. Yeh, M.; Chu, H.; Sher, P.; Chiu, Y. R&D intensity, firm performance and the identification of the threshold: Fresh evidence from the panel threshold regression model. Appl. Econ. 2010, 42, 389–401. [Google Scholar] [CrossRef]
  21. Bollen, K.; Stine, R. Direct and Indirect Effects: Classical and Bootstrap Estimates of Variability. Sociol. Methodol. 1990, 20, 115. [Google Scholar] [CrossRef]
  22. Zhao, X.; Lynch, J.; Chen, Q. Reconsidering Baron and Kenny: Myths and Truths about Mediation Analysis. J. Consum. Res. 2010, 37, 197–206. [Google Scholar] [CrossRef]
  23. Hayes, A.F. Introduction to Mediation, Moderation, and Conditional Process Analysis: A Regression-Based Approach; Guilford Publications: New York, NY, USA, 2017. [Google Scholar]
Figure 1. The theoretical model of the paper.
Sustainability 12 08198 g001
Figure 2. Threshold regression model LR diagram.
Sustainability 12 08198 g002
Figure 3. Ratio of R&D investment to sales revenue (%)—range width of 1%.
Sustainability 12 08198 g003
Figure 4. Ratio of R&D investment to sales revenue (%)—range width of 0.5%.
Sustainability 12 08198 g004
Table 1. Qualification requirements for high-tech enterprises (2016 revision) (RMB).
TermExamination StandardStandard
Employee ratioThe ratio of scientific and technological personnel with a college education or above in the total number of employees in the enterprise≥30%
The ratio of R&D personnel to the total number of employees≥10%
R&D intensitySales revenue of the company in the last year < 50 million≥6%
50 million ≤ Sales revenue of the company in the last year < 20 million≥4%
Sales revenue of the company in the last year ≥ 20 million≥3%
Income ratioThe ratio of high-tech product revenue in the company’s total revenue in the past year≥50%
Year of establishmentIncorporation for more than one year≥1
Intellectual propertyCore intellectual property rights are required that can be obtained through independent research and development, transfer, donation, merger, and acquisition, etc.
Main businessThe technology that plays a core supporting role in the main products (services) of an enterprise must be within the specified scope
Innovation abilityThe evaluation of enterprise innovation ability should meet the corresponding requirements
Social responsibilityNo major safety or quality accident or serious environmental violation
Table 2. High-tech certification meets the definition of the company (RMB).
Classification StandardSales RevenueInterval
1%revenue of ≥ 200 million(3%, 4%)
1%200 million > revenue ≥ 50 million(4%, 6%)
1%50 million > revenue(6%, 7%)
Table 3. Main variable definitions.
VariablesDefinition
R&D input (RD)R&D investment to sales revenue
R&D subsidy (RDS)Government R&D subsidy to total assets
Innovation efficiency (IE)DEA index calculation
Company Size (SIZE)Natural logarithm of the company’s total assets at the end of the period
Property Right (SOE)Divided by the nature of the actual controller: take 1 for SOE and 0 otherwise
Company growth (Growth)Operating income growth rate
Sales scale (Sales)Natural logarithm of operating income for the year
Asset liability ratio (LEV)The ratio of total liabilities to total assets
Cash (CASH)Net cash flow from operating activities/total assets at the beginning of the period
Return on total assets (ROA)Net profit/total assets
Comprehensive Tax Rate (TAX)(Business tax + income tax)/Total operating income
Shareholders (S)2–10 largest shareholders holding ratio/the first largest shareholder holding ratio
Independent Directors Proportion (Indir)independent directors/directors
Incentives Management compensation ( l n   M S )Natural logarithm of Directors, supervisors, and senior executives’ total annual salaries
Table 4. Sample descriptive statistics ratio of R&D investment to operating income.
Fiscal YearMeanMedianStandard DeviationMinimumMaximum
20124.04%3.45%3.39%0.05%42.91%
20134.14%3.46%3.43%0.02%40.16%
20144.24%3.60%3.43%0.01%40.96%
20154.39%3.63%3.17%0.06%28.83%
20164.48%3.76%3.22%0.14%31.29%
20174.38%3.60%3.33%0.04%35.44%
Total4.28%3.58%3.33%0.01%42.91%
Table 5. Threshold affect test results.
VariablesModelFPBS1%5%10%
RDSingle threshold24.75 ***0.0090100023.141718.982316.2706
Note: ***, indicate that the coefficients pass the significant levels of 1%, respectively.
Table 6. Threshold estimates and confidence intervals.
Threshold Estimates95% Confidence Intervals
A single threshold0.0370(0.0361, 0.0371)
A double thresholdNot obviously
Note: Confidence interval in () indicates the threshold is at a 95% confidence level.
Table 7. Intermediary effect test.
Variables Equation (2)Equation (3)Equation (4)Equation (5)Equation (6)
Dependent Variables IERDRDSIEIE
Independent VariablesIngratiatory0.054 ***0.017 ***0.494 **
(4.000)(15.960)(2.220)
Intervening VariableRD 0.857 ***
(2.900)
RDS 0.003 **
(2.460)
Control VariableSIZE0.214 ***0.010 ***0.1920.213 ***0.224 ***
(9.040)(5.350)(0.700)(8.780)(9.33)
SOE−0.0620.0040.038−0.066 *−0.063 *
(−1.600)(1.490)(0.030)(−1.690)(−1.680)
Growth−0.029 ***−0.001−0.084 *−0.028 ***−0.029 ***
(−2.760)(−1.560)(−1.900)(−2.730)(−2.740)
SALES−0.008−0.015 ***0.497−0.003−0.020
(−0.320)(−5.260)(1.470)(−0.130)(−0.830)
LEV−0.054−0.009−0.765−0.051−0.058
(−0.910)(−1.390)(−0.730)(−0.850)(−0.970)
CASH0.0870.011 *0.4130.0690.075
(1.460)(1.900)(0.340)(1.150)(1.250)
ROA−0.784 ***−0.035 ***2.787−0.755 ***−0.776 ***
(−5.930)(−2.840)(−1.460)(−5.630)(−5.790)
TAX−0.087−0.1131.5660.008−0.085
(−0.420)(−1.630)(−0.760)(0.030)(−0.400)
A1−0.047 ***0.002 **0.011−0.047 ***−0.045 ***
(−3.960)(2.100)(0.050)(−3.950)(−3.800)
A20.2090.0152.1780.1870.190
(1.520)(1.390)(0.870)(1.350)(1.380)
A30.066 ***0.003 **0.2390.064 ***0.067 ***
(4.280)(2.030)(0.960)(4.230)(4.360)
N32883288328832883288
Adj R20.2550.2260.0140.2530.251
F Value42.410 ***32.730 ***1.940 **41.830 ***41.310 ***
Note: ***, **, * indicate significance levels of 1%, 5%, and 10%, respectively.