Article

Potential of Sustainable Concept for Handling Organic Waste in Tunisia

1
Department of Chemical and Process Engineering, National Engineering School of Gabes, University of Gabes, Gabes 6029, Tunisia
2
Department of Waste and Resource Management, Faculty of Agricultural and Environmental Sciences, University of Rostock, 18051 Rostock, Germany
3
Department of Biological and Chemical Engineering, National Institute of Applied Sciences and Technology, University of Carthage, Tunis 1080, Tunisia
4
Deutsches Biomasseforschungszentrum gGmbH (DBFZ), the German Centre for Biomass Research, 04347 Leipzig, Germany
*
Author to whom correspondence should be addressed.
Sustainability 2020, 12(19), 8167; https://doi.org/10.3390/su12198167
Submission received: 1 September 2020 / Revised: 25 September 2020 / Accepted: 28 September 2020 / Published: 3 October 2020

Abstract

:
Nowadays, Tunisia is seeking to implement cost-efficient and sustainable solutions in relation to the treatment of organic waste which, at up to 65%, makes up the largest proportion of total waste generated in the country. Therefore, an efficient tool for decision makers is needed to provide a clear approach about the potential of organic waste as well as the treatment concept, which can be adapted based on technical requirements and local conditions. Results revealed that there is a high variation in terms of the nature of the collected biowaste, which affects the selection of the adopted bioprocess for each geographical zone of the study area. Three main categories of biowaste are produced along the coastline of Tunisia: food waste (FW) (102.543 t/a); green waste (GW) (1.326.930 t/a); and cattle manure (CM) (1.548.350 t/a). Based on the results of similar projects and laboratory-scale research work, anaerobic and aerobic digestion were examined. Regarding aerobic digestion, the monitoring of several physicochemical parameters ascertained that the co-composting of FW and GW at different ratios (GW: FW = 100:0, 75:25, 50:50, and 25:75) allowed the production of a stable and mature compost. A highly qualified end-product was generated from each trial categorized as a finished compost of class V with reference to German Standards of compost. Regarding the anaerobic process, different feedstock mixtures (FW:CM = 0:1, 1:1, 2:1, and 3:1) were prepared to feed semi-continuous anaerobic reactors. However, a significant improvement in the process development was recorded for digesters including a higher fraction of FW, which produced 0.846 LN/kg VSin as the maximum biogas production. Therefore, biological treatments of food waste and different co-substrates seems to be a suitable technique for Tunisia in terms of waste management, environmental, and energy aspects. However, the evaluation of the efficiency of the proposed biological treatments was also verified by a draw-up of a technical and economic feasibility analysis. Although the cost–benefit estimations proved that the profits from both the compost and biogas plants would be very modest, the feasibility of such sustainable projects should not only be evaluated on an economic basis, but also by taking into account socio-environmental considerations including decreasing environmental threats, providing work opportunities, increasing incomes, stimulating public awareness as well as reducing the operating costs linked to landfilling.

1. Introduction

In light of population growth, the rapid rate of urbanization and industrialization as well as the changes in consumption patterns with higher standards of living, the production of waste, which is undesirable but unavoidable, by-products is increasingly important, making the creation of an efficient solid waste management strategy (SWMS) a worldwide challenge. Indeed, the unsustainable treatment of municipal, agricultural, and industrial solid waste is an alarming issue, which puts extra pressure on the environment as well as on human health [1].
Today, around 70% of the world’s waste ends up in dumps and landfills [2]. Nevertheless, dumps, which are a large-scale waste storage without any technical management, have also become a major source of waste pollution, while lower environmental concerns are caused by landfills, as they include varying degrees of technical measures aiming to reduce the amount of leachate and gases produced [3]. A global snapshot of solid waste management to 2050 illustrates that SWMS issues concerns not only developing countries, but also some developed ones [4]. As a developing country, Tunisia is facing numerous issues including human health, environmental, and sociopolitical threats, thus pushing the decision makers to improve solid waste management (SWM) schemes into more integrated approaches in recent years [5]. Indeed, the major challenges in the case of Tunisia are the lack of operational enforcement, financing, public awareness, trained staff, reliable data, and basic know-how. Thus, the decision-makers have access to limited tools for selecting appropriate treatment/disposal techniques to increase the effectiveness of the systems dealing with the local conditions [6].
Organic and inorganic residues are the main fractions characterizing the solid waste (SW) streams. Kaza et al. (2018) revealed that organic waste management is one of the major worries that requires special attention for both developed and developing countries [7]. It is true that developed countries generate a huge amount of SW, however, its execution is achieved through regular techniques such as biological and thermal treatments, ensuring the advantage taken from the entire SW stream [4]. However, this concept is still in progress in developing countries as the latter randomly discards the collected SW in dumpsites or landfills ascertaining the lack of the fundamental practices and basic tools for an appropriate SWM [8]. Moving toward a circular economy, waste materials should re-enter production flows as material or embedded energy through recycling, composting, or anaerobic digestion [9]. However, countries that advance from open dumping and other rudimentary waste management methods are more likely to succeed when they select locally appropriate solutions [10]. European countries have established the EU Waste Framework Directive [11], which sets basic concepts and defines priorities for different waste management alternatives. Among the EU Member States, Germany, Sweden, and Norway have been effectively using organic waste management and treatment concepts, where the biological treatments are their common organic waste management schemes [2,12,13]. In the same context, despite the high quantity of organic waste generated in Tunisia reaching around 68% of the total SW, only 5% is devoted to the composting process, while the absence of biogas plants throughout the area is marked in the country [14], so the introduction of new disposal technologies become primordial [15]. Therefore, particular attention has to be given to look for appropriate waste management approaches such as source segregation into organic and inorganic flows, followed by either aerobic or anaerobic digestion to take advantage of the considerable volumes of the generated organic waste [16].
Anaerobic digestion (AD) and the composting process represent the main options for biowaste since they allow material recovery by converting organic streams into valuable end-products. Previous studies have confirmed that for a performant biological treatment, the selection of the initial feedstock material is fundamental. Due to their high biodegradability, food waste (FW), green waste (GW), and manure are the most exploited organic residues to be converted into useful final outputs: biogas or compost [16,17,18]. Moreover, one of the primitive criteria of organic waste selection is the purity of the material to be used. Several works have focused on the efficiency of biological treatments with regard to the type and the quality of the feedstock and revealed that the collection of organic streams at the source had a powerful impact on the process development as well as the quality of the end-products of biogas, digestate, and compost [19,20,21]. With regard to the current Tunisian case, despite the great potential of biowaste generated from the agricultural, commercial, and industrial sectors, a major obstacle faces the biological treatment opportunities. In fact, SW are collected, mixed, and then sent to landfills [22,23]. It is necessary to bear in mind that the availability of raw materials, the ease with regard to applying cost-efficient technologies, and the production of market-oriented end product fractions are guaranteed if political and decision-makers at different levels support such approaches by introducing an organized legal and financial framework.
Given these gaps, in this research work a characterization of the collected biowaste from different sectors of activity was first achieved to quantify and qualify the solid streams generated in the selected study area. Therefore, experimental works as well as technical and economic feasibility analyses were carried out to evaluate the efficiency of anaerobic and aerobic treatments. As a last step, a road map for the proposed biological treatment options was presented for different regions of the study area to help decision-makers implement an appropriate solid waste management strategy in Tunisia.

2. Background Information

2.1. Study Area: Coastline of Tunisia

Located in North Africa, Tunisia covers an area of about 163.610 km2. It is divided into 24 governorates, grouped in the Northeast, Northwest, Mideast, Midwest, Southeast and Southwest, and incorporates more than 270 municipalities or urban agglomerations. The total population of Tunisia is 11,722,038 with around 70% of them being concentrated on the coast [24]. Consequently, specific attention has been paid to that region of Tunisia during the current work. Apart from a few very limited sites, the Tunisian coast is under strong pressure as it is characterized by a high concentration of urban population. In fact, approximately 7.5 million inhabitants live in this part of the country. In addition, almost all activity sectors including tourism, agriculture, and industry are located on the coast, entailing huge streams of biowaste [15]. Thus, the coastline was chosen as the study area to be examined during this research as it represents the economic potential of Tunisia (Figure 1).

2.2. Biowaste Sources: Land-Use Planning per Sector of Activity

2.2.1. Urban Sector

Urbanization is defined as a result of economic growth and consequent increased employment opportunities, leading to migration from rural areas [25]. Therefore, the coast of Tunisia is identified by its high population concentration as it contains several different facilities including healthcare, hospitality, and civic service areas responding to the citizens’ needs. This urbanization mainly relates to Greater Tunis (more than 60 km of coastline including Lake Tunis), Sfax (15 km), and Sousse (40 kms) as well as a few other important cities located on the coast such as Bizerte and Gabes, reaching a rate of 100%, 62%, 81%, 65%, and 70%, respectively [26]. There are nearly 124 km of dense urbanization associated with large and medium-sized cities along the coast, comprising a large number of universities, hospitals, parks, markets, etc. and generating a significant volume of organic residue. In terms of hospitals and clinics, Greater Tunis, Sfax, and Sousse present around 8509, 2505 and 1688 beds, respectively, highlighting the density of healthcare facilities in the quoted governorates in this part of the country [27]. Moreover, in terms of educational institutions, and more particularly their canteens as the main generators of biowaste, Greater Tunis, Sfax, and Sousse include 21, nine, and five university refectories, generating around 18,869, 10,914, and 4568 meals per day, respectively [28]. Thus, for the purpose of performing this research, the biowaste collected from the quoted citizen service providers were restricted to green and food waste. Hence, the quantification of kitchen waste collected from hospitals, canteens, and refectories was undertaken for the coastline of Tunisia as well as the green residue produced from parks and wholesale markets.

2.2.2. Touristic Sector

As the Tunisian coastline includes around 94% of the hotel capacity of Tunisia (around 250,000 beds), it is marked by a significant increase in population, resulting in the large production of bio-solid waste. In fact, the study area comprised around 836 hotel establishments, 358 tourist restaurants, nine golf courses, six marinas, and 474 travel agencies, leading to the provision of well-developed services, thus making the region an attractive destination for approximately nine million tourists in 2019 [29]. Moreover, the large influx of tourists has a direct impact on the quantities of solid waste (SW) generated, specifically on the volume of organic residues, revealing that during the high season, the volume of biowaste is almost doubled [30]. Due to the striking effect of tourism activities on commercial and leisure facilities, etc., tourism and citizen services areas are closely interlinked. Concerning this sector of activity, wasted food gathered from the hospitality sector was examined to identify the biowaste volumes generated throughout the Tunisian coast.

2.2.3. Agricultural Sector

Since the agricultural area covers approximately 38% of the coastal zone, agricultural activities are considered as one of the global economic activities in the region. The Tunisian coast comprises around 24% of the country’s total area of cereals, 29% of fodder crops, 41% of pulses, 50% of market gardening, and 53% of arboriculture, which outlines the importance of horticulture in this part of the country [31]. In fact, the arable land located on the Tunisian coast is almost equal to that of the interior parts of the country, comprising around 45% of farmers throughout the country (around 234,000). In addition, as part of agricultural activities, animal husbandry is also considered as a producer of a notable amount of biowaste (manure, dung, etc.), highlighting the additional organic streams gathered from the selected study area.

2.2.4. Industrial Sector

Tunisia is divided into 55 industrial zones, 37 of which are located on the coast, making up approximately 89% of the total area given over to industry [32]. However, during this study, particular attention was paid to the generated solid streams by food processing factories, olive-oil mills, livestock and poultry slaughterhouses as well as wood industries located in the selected study area, and considered as the main source of solid biowaste of the industrial sector [33].

2.3. Current Waste Management System in Tunisia

Facing numerous human health and environmental threats, Tunisia has sought to improve solid waste management (SWM) schemes by introducing more integrated approaches in recent years [34]. Nowadays, Tunisia generates around 6.5 million tons of solid waste (SW) with around 68% that is organic. The latter is collected and mixed with the other fractions, which is then deposited in different standards of landfill without any treatment [5]. Referring to the Ministry of Local Affairs and Environment (MLAE), around 80% of the total collected residues is conveniently disposed of, while about 20% ends up in improperly [35]. Therefore, particular attention is required to look for appropriate waste management approaches and face the alarming situation in terms of SWM in Tunisia. Indeed, the lack of operational enforcement, financing, public awareness, trained staff, reliable data, and basic know-how are considered as the main challenges [36]. In terms of solid waste management: Law No. 96-41 of 10 June 1996, relating to waste disposal control system defines the specific framework for waste management and disposal methods as well as the provisions relating to the prevention and reduction of the production of waste at the source, recovery, recycling, reuse, and the elimination of ultimate waste in controlled landfills [37]. Thus, finding other alternatives to reduce the amount of SW that is sent to landfills seems to be an efficient way for a sustainable SWM. To this end, a specific qualification and quantification of the residues is indispensable for the creation of a suitable SW system. The exploitation of organic streams easily collected at the source is considered as a first step to prevent the mixture of organic and inorganic wastes, in order to take advantage of each fraction as a second step [38]. The segregation at the source is then followed by either aerobic or anaerobic digestion for the organic flow, which is considered as one of the most appropriate treatments for biowaste recovery [39].

2.4. Alternatives for Biowaste Recovery in Tunisia: Compost or Biogas?

To overcome the environmental concerns caused by the huge amounts of biodegradable residues produced from the study area, biological treatment is the most appropriate operative alternative. Therefore, the waste streams are subjected to aerobic, anaerobic, or combined processes. Based on the types of substrates involved, Table 1 summarizes the process dealing with each kind of organic residue gathered from each region. “Compost or biogas?” is the question commonly raised by decision-makers. Thus, the geographical distribution as well as the sector of activity allows the elaboration of a suitable approach for the production of valuable end-products. It should be taken into consideration that if the raw materials are available, the selected process should be achieved in the same area that produces the biowaste to take local advantage of the organic residues collected and avoid the extra cost of waste transportation to landfills. Particular attention has to be paid to the needs of the area under consideration in terms of the outputs, in order to guarantee the sustainability of the composting or anaerobic digestion plants. Hence, the government should not only focus on green energy production as well as the reduction of waste streams, but also on the technical, financial, and social challenges that require specific consideration [40].

3. Materials and Methods

3.1. Data Collection

The used data were gathered from a previous research achieved by one of the authors within the framework of a project realized by the National Agency for Waste Management of Tunisia (ANGed) in collaboration with German Corporation for International Cooperation (GIZ) [41]. Thus, in a preliminary stage, the determination of the biowaste ’volume generated from Tunisia’ governorates was ensured by ANGed. Then, an update of the collected data was achieved in cooperation with the municipalities of the selected study area, taking into consideration the collected biowaste generated during 2019.
Based on the potential of biowaste generated as well as their suitability for materials and energy recovery, the selection of several organic residues was investigated. Thereafter, it was fully characterized and biologically treated at a lab scale to evaluate the synergistic effects of biowaste mixtures on biogas, digestate, and compost quality. At a later stage, technical and economic feasibility analyses of aerobic and anaerobic digestion plants were examined based on Mediterranean experiences with regard to biogas plants (as there is no biogas plant in Tunisia) and Tunisian experiences in terms of composting plants.

3.2. General Description of the Methodology: ECO-Concept for Biowaste Recovery in Tunisia

This section presents the pathway of the research seeking to utilize several kinds of biowaste gathered from different sectors of activity: urban, agricultural, and touristic sectors. Indeed, the technical waste concept offered two options to take advantage of organic residues (Figure 2). The main objectives of the chosen processes were to decrease the volume of recoverable fractions ending up in landfill, reduce greenhouse gas emissions, and produce a valuable end-product needed in the zone from which the biowaste was gathered. The assumptions made for the following strategies depended first on the availability of the organic residues in the selected study area, the purity of the collected wastes, and then on their appropriateness to both the aerobic and anaerobic process (Table 1).
This system included three main blocks introducing the organic waste collected from different sectors of activity to be exploited for different biological treatments. Cattle manure, food, and green waste were used as feedstocks for both the aerobic and anaerobic digesters. The first proposed technique was to treat the segregated organic fractions collected from different areas by converting them into value-added products using windrow piles composting technology. Regarding the second proposed strategy, it introduced the concept of material and energy recovery using semi-continuous anaerobic digestion processes dealing with different biowaste streams collected from different sectors of activity. It recommended that the raw organic materials would be subjected to anaerobic processes for the production of biogas and methane. These can be used as a source of electricity or heat as well as an alternative fuel to liquid petroleum gas (LPG) and natural gas. After completion of the AD process, the second AD-effluent (digestate) would go through further composting/stabilization for further mass reduction. To this end, projects related to composting and AD were carried out in Tunisia and Germany to evaluate the effectiveness of biological treatments exploiting different types of organic residues generated from the studied area.

3.3. Upcycling of Biowaste Generated from Different Sectors of Activity

3.3.1. Selection and Characterization of Biowaste

The selection of the exploited biowaste was done based on their availability in different zones as well as their appropriateness for aerobic and anaerobic co-digestion. Food waste (FW) was opted as a main substrate for biological treatments as it corresponds to food residues collected from different sectors of activity, for example, the food processing sector, catering service as well as kitchen waste gathered from hospitality areas. Cattle manure (CM) gathered from the agricultural sector was selected as a co-substrate for FW anaerobic digestion, while GW was used for the composting process. This latter can be gathered from different areas such as touristic and agricultural (arboriculture wastes) as well as urban sectors (green spaces, municipal and wholesale markets). The selected organic wastes were analyzed to identify the physio-chemical characteristics of the feedstock mixtures used for biological treatments. Table 2 illustrates the measured parameters as well as the methods of analysis.

3.3.2. Food and Green Waste Co-Composting Process

Experimental works were carried out in Tunisia to evaluate the food and green waste open windrows co-composting at different mixing ratios, which could be adopted in different zones of the study area considering their local conditions [16]. FW and GW were co-composted for 13 to 15 weeks. A daily monitoring of temperature was realized to assess the composting performance, while samples were taken every two weeks to evaluate the stability and maturity phases as well as the end-product quality. Therefore, in situ measurements were achieved over the period of the treatment to identify different physio-chemical parameters.
The performed experimental trials based on total weight were as follows:
  • P0: 100% GW
  • P1: FW:GW = 25:75
  • P2: FW:GW = 50:50
  • P3: FW:GW = 75:25

3.3.3. Food Waste and Livestock Manure Anaerobic Co-Digestion Process

Bench experiments using a semi-continuous stirred-tank reactor were conducted to evaluate the mixing ratios effects of food waste and cattle manure streams on biogas and digestate quality. Different feedstock mixtures were prepared to feed, twice per day, eight digesters: FW:CM = 0:1, 1:1, 2:1, and 3:1. The experiments were carried out in mesophilic lab digesters with a nominal volume of 20 L, which were heated by warm air and kept at a constant temperature of 38 ± 1 °C.
To evaluate the process performance, the biogas volume was continuously logged and monitored using drum-type gas meters (type TG05, RITTER Mess Technik GmbH, Germany). Therefore, the headspace of the reactor was measured every other day using a gas to identify the biogas composition. Regarding the liquid AD-effluent, digestates were characterized to examine the physical-chemical properties of each and therefore decide how it could be efficiently recovered. It should be mentioned that some analyses were additionally valuable to identify the average calorific value of the used feedstock, which was found to be around 7 MJ.

3.4. Economical Evaluation of ECO-Concept

In general, cost and economic analysis include two main streams. The first is related to expenditure representing the investment cost, which is returnable as annual payments during the first 10–15 years of the lifespan of the power plant [43], and operational costs, which are continued during the lifespan of the power plant as salaries of the working staff (engineers, technicians, managers, etc.), and maintenance and replacement of the components, as will be discussed later. The second stream is related to income, representing the income from power sales and digestate sales (for this case). Then, the financial budget (cash flow) can be calculated by taking the difference between the annual expenditure and annual income.
The aim of this economic analysis was to show the potentiality of erecting a biogas power plant in Tunisia. The cost for each ton of biowaste to be treated in this power plant was calculated. To calculate the distribution of capital cost investment, Equation (1) was used:
C ( t ) c a p i t a l = C A P E X . r i . ( 1 + r i ) t d e b t ( 1 + r i ) t d e b t 1
where:
  • C ( t ) c a p i t a l is the annual distribution of the capital cost;
  • ri is the interest rate [%];
  • tdebt is the annual debt [year]; and
  • CAPEX is the capital expenditure.
The levelized cost of electricity was analyzed based on Equation (2):
L E C = t = 1 t   L i f e C ( t ) c a p i t a l +   C ( t ) o p e r a t i o n ( 1 + r d ) t t = 1 t L i f e E e l y ( 1 + r d ) t
where:
  • LEC is the levelized cost of electricity;
  • C ( t ) o p e r a t i o n a l is the annual distribution of the operational cost;
  • rd is the discount rate [%]; and
  • E_(el-y) is the annual power production [MWe/year].
To calculate income from power and digestate sales, the following equation was used:
I l = 365   D t   f   A M P
where:
  • f is the inflation rate [%];
  • Il is the income for the first year [US $];
  • Dt is the level of production [kWh/tons per day]; and
  • AWMP is the average market price [US $].
Many parameters have been applied in this model; many of them were assumed and others were found in the literature. Table 3 shows all the parameters used in this model.

4. Results and Discussion

4.1. Potential of Biowaste in Tunisia: Quantification of Biowaste per Sector of Activity

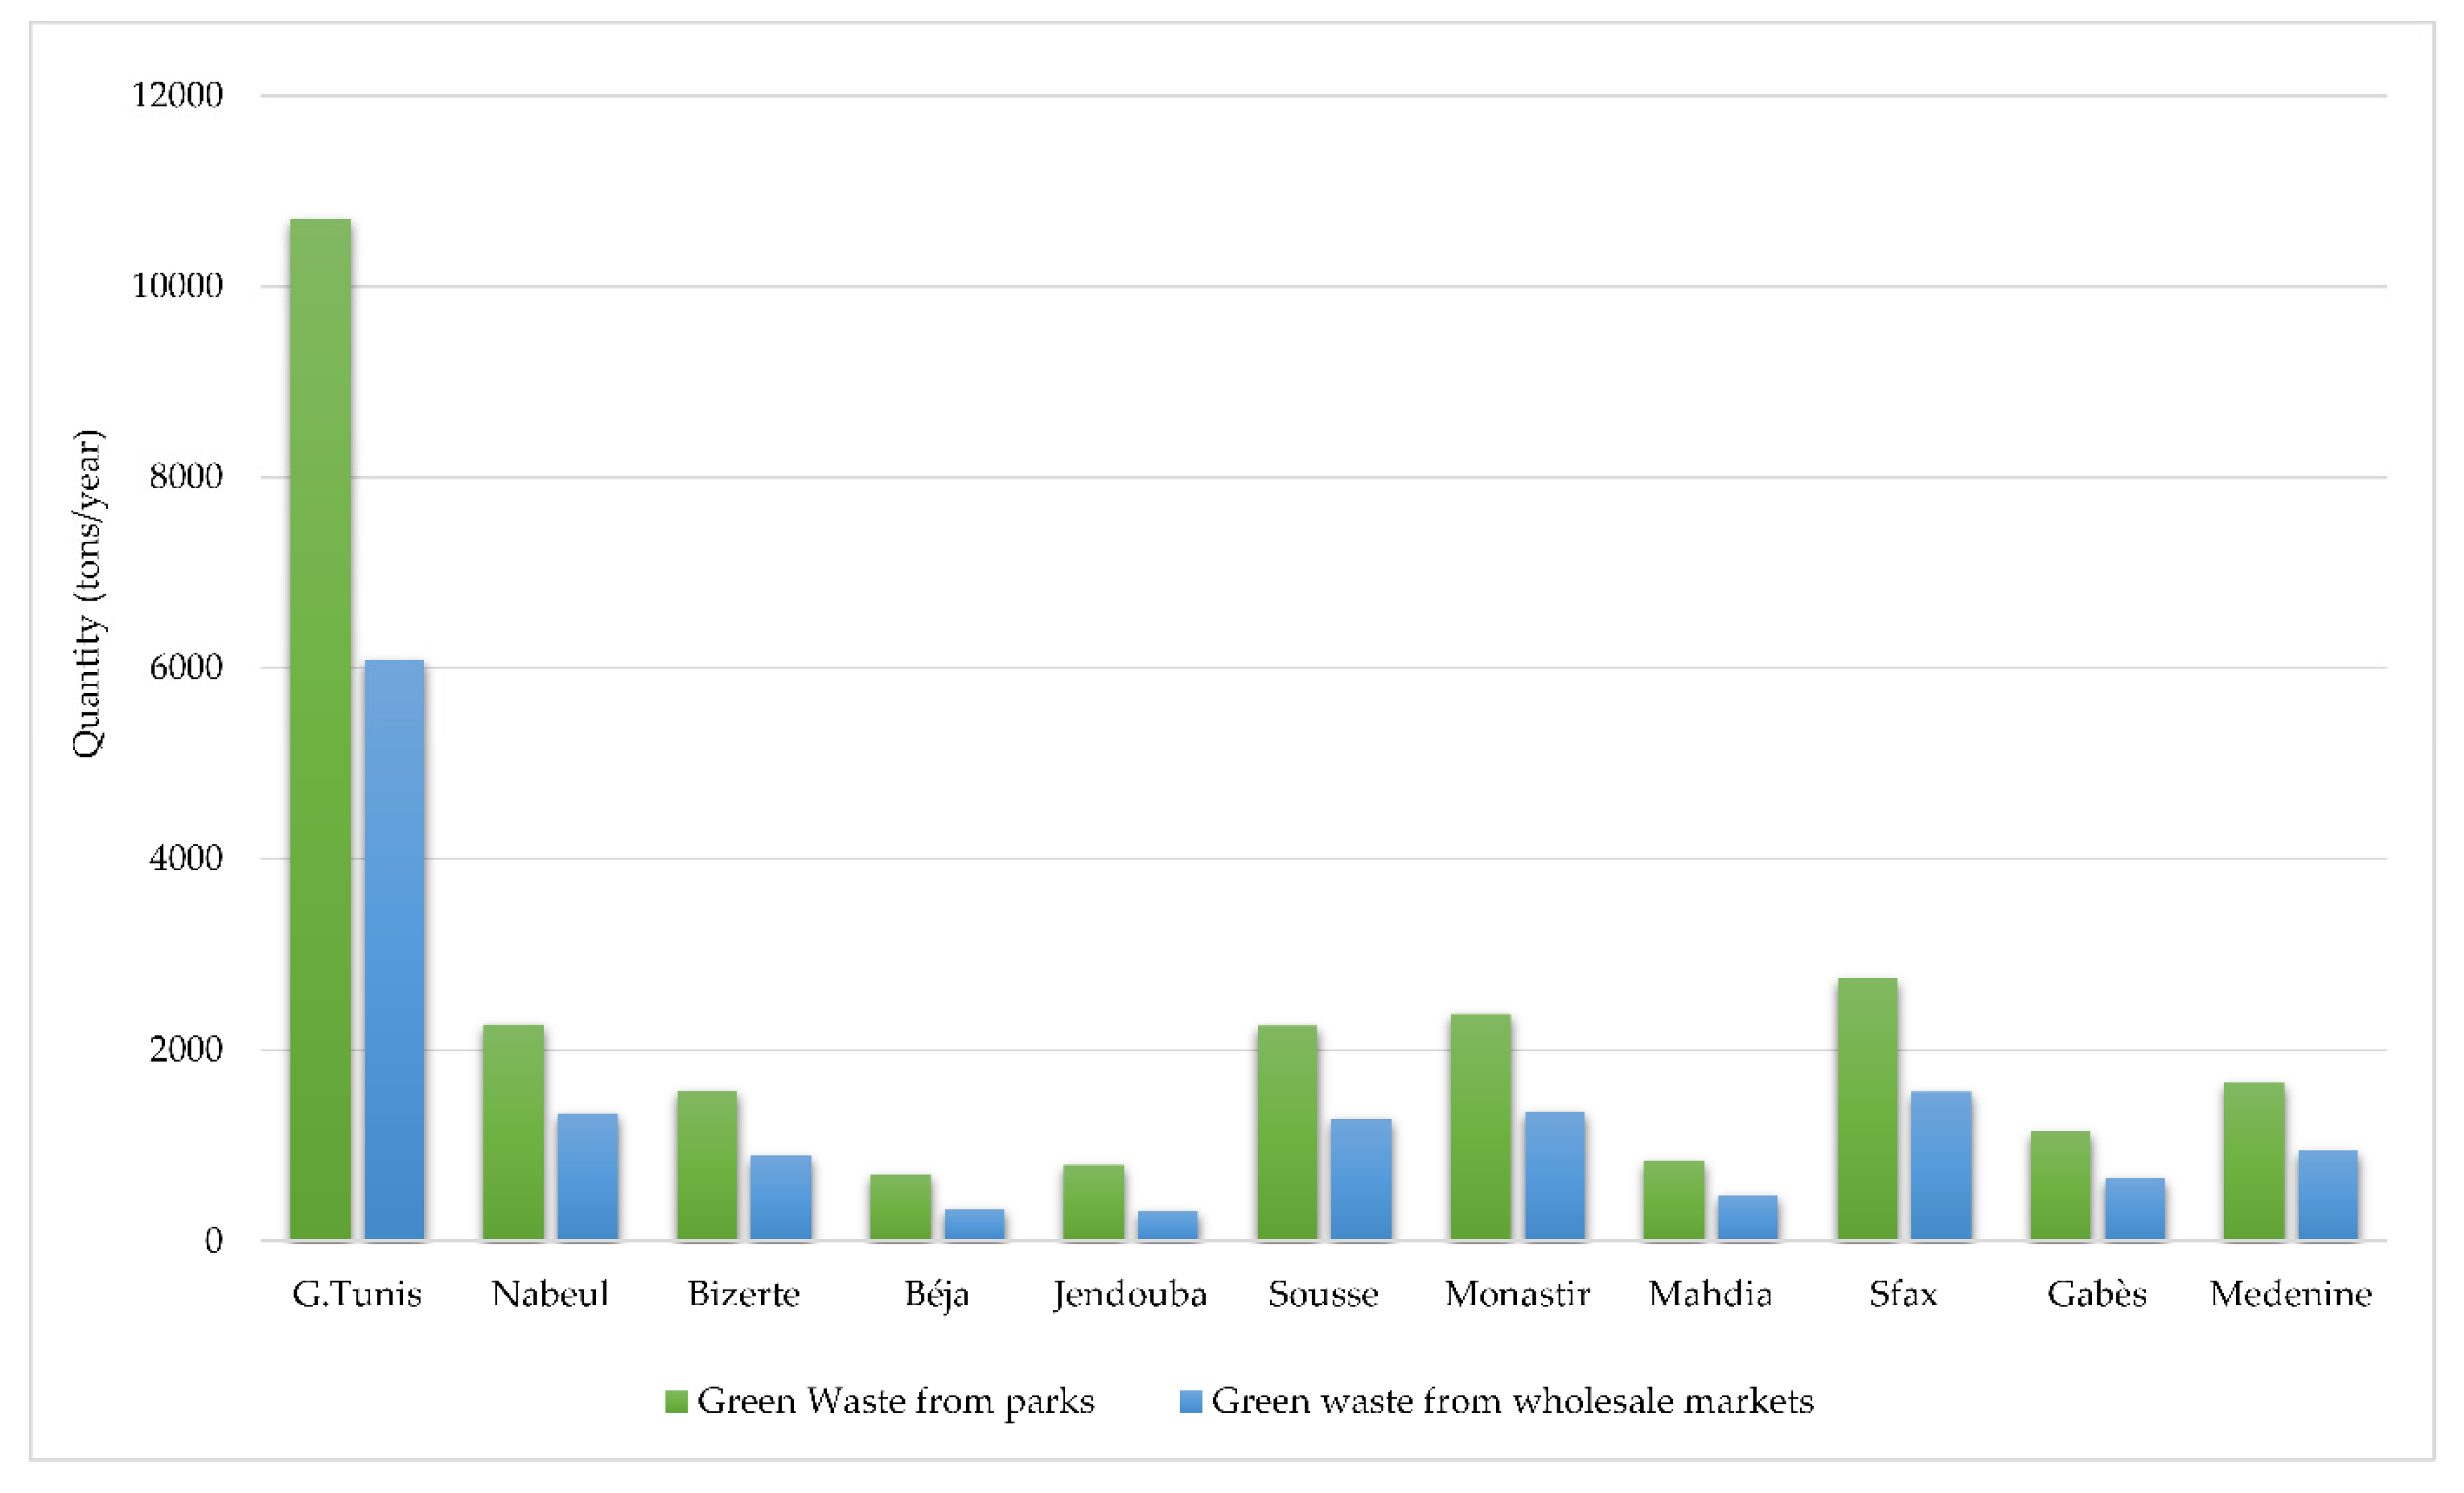
4.1.1. Biowaste Generated by the Urban Sector

During this research, biowaste generated from the urban sector was restricted to food and green waste collected from citizen services providers such as hospitals and clinics, the hospitality and commercial sectors as well as green residue gathered from parks. Household residue was not taken into consideration as part of the biowaste gathered from the urban sector.
Starting with green waste (GW) collected from parks and wholesale markets, a substantial volume was recorded for Greater Tunis, amounting to 10,700 tons/year of gardening residue and around 6085 tons/year of GW generated from the commercial facilities. In fact, Greater Tunis, which is the capital of Tunisia, is well-known for its high population density (3,002,093 inhabitants) and its remarkable civic service provision as well as its commercial activity. Consequently, a very large amount of biowaste is expected. The same considerations underlie Sfax, Sousse, and Nebeul, which are also characterized by a large population. Figure 1 shows that Sfax, Nebeul, and Sousse produced around 2600 tons/year of GW collected from parks, and approximatively 1400 tons/year collected from wholesale markets. Consequently, it can be seen that the population density as well as the consumption level of citizens have a considerable impact on biowaste flows [48].
Figure 3 illustrates that GW generation, as a part of urban waste, is linked to population concentration as well as economic and consumption activities. In fact, the current results indicate that the outlined socioeconomic factors affect the biowaste streams collected from different zones, and is in line with several works [49].
Coupled with GW, waste food is also considered as one of the dominant biowaste flows generated from urban areas. With reference to European law in Directive (EU) 2018/851, food waste is defined as food and kitchen waste from households, offices, restaurants, wholesale, canteens, caterers, and retail premises and comparable waste from food processing plants [50]. As the eatery areas of healthcare and educational services represent one of the producers of FW, Greater Tunis, which is characterized by its high rate of urbanization, generate a significant volume of kitchen waste due to the high number of hospitals, schools, universities, etc. Figure 4 illustrates that the capital region generates around 3000 tons/year from university canteens, almost double that generated by Sfax. It is expected that there will be a considerable difference in terms of FW collected from the university eating areas as Greater Tunis and Sfax contain the greatest number of educational institutions. Furthermore, since students eat at least one meal per day, a significant volume of plate waste is handled everyday by the university canteens, which explains the notable amounts of waste food collected from such canteens [51].
In terms of the kitchen residue produced from healthcare facilities, Greater Tunis also produces a notable amount of biowaste, as much as 1100 tons/year, which is nine times higher than the amount of FW from hospitals and clinics in the other governorates on the coastline of Tunisia. Therefore, the amount of FW collected from several forms of catering services is not only linked to the size of the population, but is also closely related to the services provided in each zone (the number of hospitals, universities, refectories, etc.). Several studies have revealed that the activity sector, social characteristics, and service facility have an influence on the consumption patterns and biowaste generation volumes [52,53]. However, Dias-Ferreira et al. (2015) focused on FW production in Portugal, and stated that the amounts of plate waste collected from hospitals were two to three times higher than the FW production in Tunisia [54]. This may be due to consumer behavior as well as the quality and quantity of food served in both Tunisia and Portugal.

4.1.2. Biowaste Generated by the Tourism Sector

Biowaste production is considered as one of the most pressing environmental concerns resulting from the activities of the hospitality sector, especially hotels that use huge quantities of consumer goods as part of their operations [55]. The large amounts of organic residue generated by the tourism sector cannot be ignored. It is indeed noticeable that the flow of biowaste in this sector is dominated by FW. The latter is therefore considered as the main raw material input generated by this sector, and was the object of this part of the research [56].
Figure 5 illustrates that around 45% of the cumulative stream of FW generated by coastline hotels was produced from the center-east of Tunisia. Significant volumes were also generated particularly from Sousse, Medenine, and Nebeul, reaching 11,500, 10,000, and 8500 tons/year, respectively. However, regarding the capital region, Greater Tunis produced significantly lower quantities of FW at around 3100 tons/year, which is linked to the diversity and nature of the customer base visiting the quoted governorates [29].
The obtained findings confirm that external factors including the geo-localization of hotels as well as the activity of the region have a prominent impact on biowaste generation. This can be clearly observed in Beja, Gabes, and Bizerte, governorates that are recognized by their low tourism activities, and that mostly only attract local tourists and produce low volumes of FW, amounting to an average of 150 tons/year. Due to the diversity in terms of the targeted tourism areas, beaches, or businesses, variable quantities of FW were gathered from the study area. In addition, the type of guest in terms of local or international tourists has a significant impact on the biowaste generation rate. Therefore, both the type and quality of services provided in hotels and restaurants influence the quantities of FW generated [57]. Several studies have highlighted the aspects that influence waste generation from the tourism sector, and have revealed that physical, social, cultural and economic dimensions have a powerful impact on biowaste streams, particularly kitchen waste generation [58].

4.1.3. Biowaste Generated by the Agricultural Sector

Agricultural waste is defined as the residue from the growing and processing of raw agricultural products such as fruits, vegetables, poultry, and livestock [59]. However, agricultural activities depend on the geo-localization of the region as well as the activities of its citizens. In fact, located on the Tunisian coast, Bizerte and Nabeul jointly account for around 34% of the total cattle husbandry in Tunisia, which is clear from the significant volumes of livestock manure collected from these locations.
Figure 6 illustrates that the area with the highest production of livestock manure is Bizerte (230,000 tons/year), followed by Beja (220,350 tons/year) and Nebeul (180,000 tons/year), representing 17%, 16%, and 13% of the total manure gathered from the study area, respectively. The finding is due to the large number of livestock bred on the Tunisian coastline: 42%, 30%, and 35% of cattle, sheep and goat herding, respectively, characterize the study area. Regarding the manure from poultry, Nebeul and Sousse generate around 29% and 22% of the total poultry manure streams, amounting to 60,000 tons/year and 45,000 tons/year, respectively. The substantial flows generated by the livestock and poultry sectors in Nebeul are due to the enhancement of agro-activities from traditional animal breeding, mainly for personal consumption or local market distribution to an active industrial production.
Regarding arboricultural waste, the major producing regions are Sfax, Mehdia, and Medenine with around 33%, 16%, and 15% of the total volume, respectively. Those volumes are due to the higher productivity in terms of olive production, which characterizes Sfax, Mehdia, and Sousse, given the abundance of irrigation systems as well as the use of modern agricultural machinery. However, the very favorable climate of Medenine is beneficial for date palm production. Consequently, huge amounts of palm residue were recorded at around 197,000 tons/year.

4.1.4. Biowaste Generated by the Industrial Sector

Food and wood processing production are the main generators of large amounts of biowaste or by-products annually from a variety of sources throughout the study area. The main food processing waste flows considered during this work were biowaste derived from slaughterhouses, wine manufacturing, fruit and vegetable production as well as olive-oil processing. In terms of these particular waste streams, Nebeul is considered as the main producer. It generates 72%, 60%, and 41% of the total waste generated from winemaking, fruit and vegetable canneries, and poultry slaughterhouses, respectively, in terms of the total biowaste originating from food processing industries, while it produces around 22% of the total wood manufacturing waste collected from the Tunisian coast (Figure 7). The significant amount of organic waste gathered from different manufacturing areas in Nebeul was expected, as the region includes approximately 43% of the total canned tomato industry and 90% of winery and grape juice manufactories, generating around 20,000 tons/year and 8800 tons/year of residues, respectively. As part of agro-industrial waste, the most abundant wastes derived from slaughterhouses were collected from Greater Tunis at about 9000 tons/year and 6200 tons/year of livestock and poultry slaughterhouse solid waste, respectively. Regarding the forest and wood processing industries, it is worth underlining that Nebeul is a major producer of wood residue (around 12,000 tons/year), followed by Greater Tunis and Sousse, generating approximately 11,000 tons/year of biowaste.
It can be clearly seen from Figure 4 that the most important producers of biowaste from several sources in the food and wood industries are located in Nebeul and Greater Tunis, with around 35% and 22%, respectively, in terms of the total stream of biowaste from the Tunisian coast. In fact, the quantity as well as the nature of biowaste depends on several factors including geo-localization and socioeconomic aspects, which influence the variance of biowaste streams gathered from each zone. The authors in [60] revealed that geo-localization as well as economic aspects significantly influence the quantitative and qualitative features of biowaste, which is in line with the findings of this research.

4.2. Lab-Scale Biological Process Performance

4.2.1. Characterization of the Selected Biowaste

The physical and chemical characteristics of the residues are summarized in Table 4. The dry matter contents were 22.60%, 58.88%, and 11.50% for FW, GW, and CM, respectively. Microorganisms have a certain demand for carbon and nitrogen in any growth environment, therefore the C:N ratios were evaluated for each substrate. These were corrected at a later stage and regulated in the range of 20–30 for different feedstocks by the addition of CM for anaerobic digestion and GW for thee composting process as co-substrates [61]. As the presence of minor elements is crucial for the microorganism communities, some micro- and macro-elements were identified [62]. Copper (Cu), nickel (Ni), and zinc (Zn) were detected in varying quantities, with Zn recording the highest quantities in the different substrates. This finding notwithstanding, the presence of major constituents such as phosphorus (P), potassium (K), and magnesium (Mg) was also observed.

4.2.2. Evaluation of Food and Green Waste Co-Composting Performance

The monitoring of several physicochemical parameters ascertained that the co-composting of FW and GW allowed for the production of a stable and mature compost at different mixing ratios. Table 5 illustrates the results obtained in terms of evaluating the process performance. However, it is clear that P3, which consisted of 75:25 of FW and GW, produced a poor quality biofertilizer in terms of sanitation (the thermophilic duration is lower than two weeks), maturity (nitrification index higher than 3), and stability as the C:N ratio was not in the requested range of 10–15 [63]. This (poor quality) was due to the high production of nitrogen causing an intensive degree of nitrification and a relatively low final C:N ratio. Consequently, to ensure good process performance, the optimization of the FW:GW is crucial, and the FW contribution must not exceed 50–60%, especially in terms of the nature of the FW of Tunisia, which is very rich in nitrogen [63].
Obviously, the heavy metal content has a significant impact on germination rates as it can severely delay plant growth. Therefore, the identification of the amounts of heavy metal were ensured to evaluate the biofertilizer’s efficiency and quality [64]. To this end, sampling was carried out to measure the incidence of heavy metals as required by several composting standards of different countries including Tunisia and Germany (Table 6). As the feedstock used was collected separately at the source, it was expected to have low contents of heavy metals, particularly with such a mixture of food and green waste. Therefore, the findings indicate that the generated composts are characterized by lower heavy metal concentrations than exists in the requirements of several countries, particularly Tunisia and Germany. Accordingly, the quality of the composts obtained from different piles, and exploiting different FW and GW mixing ratios was ascertained.

4.2.3. Evaluation of Food Waste and Cattle Manure Anaerobic Co-Digestion Performance

This research work examined the anaerobic co-digestion progress of CM and FW at an OLR of 2 kg VS/m3·d. Figure 8 illustrates that the FW addition at different fractions was notably efficient at enhancing the biogas and methane production. For the first two weeks, an improvement in terms of SBY reached 66%, 61%, and 86% for R2 (FW:CM = 1:1), R3 (FW:CM = 2:1), and R4 (FW:CM = 3:1), respectively, in comparison with the blank test (R1; FW:CM = 0:1). Indeed, the prominent improvement since the first week could be due to the changes of feedstock characteristics such as the increase of biodegradable organic matter and improved nutrient balance in the mixtures as well as the synergetic effect between FW and CM [65,66]. However, starting from the fourth week, a small decline in terms of biogas yield was recorded for both R1 and R2 to be almost stable until the end of the treatment period. Indeed, the exploited CM contained certain amounts of hardly biodegradable components such as cellulose and lignin, which caused inefficiency in terms of the process performance for both R1 and R2. However, once FW was added at a certain fraction, CM played the role of an enriched co-substrate characterized by a complementary effect to balance the C:N ratio, adjust pH for buffering capacity, and stimulate the activity of enzyme and co-enzymes furnishing the needed trace element content, which was clear with regard to R3 and R4 productivity [67]. Therefore, as R3 and R4 included a higher fraction of FW, the considerable biogas production was observed to reach around 0.611 LN/kg VSin and 0.846 LN/kg VSin, respectively, after four weeks of treatment. However, R4 produced the highest SBY as well as SMY, which proved that FW:CM = 3:1 was the optimal mixing ratio. Similar findings have also been reported by several researchers examining FW and CM anaerobic co-digestion and revealed that high synergistic effects were recorded once a higher fraction of food waste was added [68,69]. Hence, it was distinct that FW and animal manure complement each other for maximizing biogas production, but with initially optimized mixing ratios.

4.3. Technical and Economic Feasibility Analysis of Aerobic Treatment in Tunisia

4.3.1. Design of a Composting Plant

Based on the setup of an open windrow composting plant of 10,000 ton/year in size, an economic model was developed. Two main raw inputs in terms of organic materials were considered: Food Waste (FW) and Green Waste (GW). Therefore, three scenarios were designed with the aim to exploit different mixing ratios of food and green residues: 100% of GW, one portion of FW to one portion of GW (1:1), and finally one portion of FW to three portions of GW (1:3). Table 7 shows the assumptions for the purpose of the windrow pile composting site design.

4.3.2. Cost–Benefit of Establishing a Composting Plant in Tunisia

In order to assess the economic benefits of organic utilization, the cost of constructing a composting plant in Tunisia was estimated (Table 8). Considering the biowaste potential in the country with a balanced C:N ratio, there is a possibility of setting-up an open windrow composting plant of 10,000 tons/year in size. According to the preliminary calculation, a composting plant of this size would cost around two million euros to build. Additionally, the composting plant would incur an additional yearly operational, maintenance, and capital costs of 285,400 €/year. A composting plant of such a size is economically feasible only with a reliable market for selling the compost. Given a selling price of compost at 30 €/ton, 30% of the investment being available as a state grant, and the provision of a free site for building the composting plant, it would be possible to achieve financial amortization in two years.
From an economic point of view, it is clear from the cost–benefit analysis that the profits from the compost station would be very modest. However, the feasibility of such a project should not be evaluated only on an economic basis. From the socio-environmental point of view, its contributions in mitigating the environmental threats to the environment and to human health, providing work opportunities, increasing incomes, increasing public awareness as well as reducing operating costs in the event of waste being transferred to landfills, are all factors that should motivate stakeholders and push such stakeholders toward investment in this sector. To this end, to ensure sustainability, it is recommended that such projects be established at the municipal level, provided that the municipality is the owner of the investment. This proposal gives the municipality the right to choose who runs and operates such a station. The municipality may take over the management and operation of the facility or enter into a contract with organizations in the private sector for this purpose.
Based on the experimental results and the potential of biowaste generated from different sectors of activity, three scenarios were assumed: 100% of GW, one portion of FW to one portion of GW (1:1), and finally one portion of FW to three portions of GW (1:3). However, the economic analysis for the suggested mixtures is as follows:
  • Scenario 1: Designing a triangular windrow section from green residues only (100% GW)
    • Volume of material available to be composted = 317 m3/d.
    • Assume dimensions of windrow: length = 10 m, height = 2.0 m, and width = 3.5 m.
    • Volume of windrow: triangular section V = 1⁄2 × (3.5 × 2.0) × 10 m = 35 m3.
    • Number of windrow/days = total volume of material/volume of windrow 317/35 ≈ 9.
Composting of source-separated organic waste has potential as a beneficial recycling tool. Its safe use in agriculture, however, depends on the production of good quality compost, specifically, compost that is mature and sufficiently low in metals and salt content. Composting will be a financial source given that the price for one ton of compost in Tunisia is about 30€. Early source separation is necessary, perhaps requiring separation to occur before or during curb side collection.
  • Volume of finished compost = 317 × 0.7 (reduction volume 30%) = 222 m3 d−1 = 66,600 m3 y−1;
  • Weight of finished compost ≈ 6926 tons y−1; and
  • Profit from compost sale = 6926-ton y−1 X 30 €/ton = 207.792 €/y.
  • Scenario 2: Designing a triangular windrow section from FW and GW (1:1)
    • Volume of material available to be composted: 50% FW + 50% GW = 55 m3 d−1 + 159 m3 d−1 = 214 m3/d;
    • Number of windrows/days = total volume of material/volume of windrow 214/35 ≈ 6;
    • Volume of finished compost = 214 × 0.7 (reduction volume 30%) =150 m3 d−1= 45,000 m3 y−1; and
    • Mixture density = 200 kg m−3.
    • So, the weight of finished compost ≈ 9000 tons y−1.
    • Profit from compost sale = 9000 ton/y × 30 €/ton =270,000 €/y.
  • Scenario 3: Designing a triangular windrow section from FW and GW (1:3)
    • Volume of material available to be composted: 25% FW + 75% GW = 28 m3 d−1 + 238 m3 d−1 = 266 m3/d;
    • Number of windrows/days = total volume of material/volume of windrow 214/35 ≈ 8;
    • Volume of finished compost = 266 × 0.7(reduction volume 30%) =186 m3 d−1= 55,860 m3 y−1; and
    • Mixture density= 153 kg m−3.
    • So, the weight of finished compost ≈ 8550 tons y−1.
    • Profit from compost sale = 8550 ton/y × 30 €/ton =256,500 €/y.
From an environmental benefits point of view, composting can be beneficial in terms of recycling the organic fractions of the solid waste, reducing by up to 30% the volume of organic matter entering already overcrowded landfill sites. Converting organic materials from municipal SW from landfills by converting it to fertilizer has many environmental benefits such as reducing greenhouse gas emissions and reducing leachate quantities once disposed of in landfills.
Overall, the composition of Tunisian organic waste and its chemical properties (in terms of heavy metals content) indicate that composting is a good alternative for Tunisia, and that quality matured finished compost could be produced using the windrow.

4.4. Technical and Economic Feasibility Analysis of Anaerobic Treatment in Tunisia

4.4.1. Design of a Biogas Plant

The modeling of the AD process involving the treatment of food and agricultural waste was done by carrying out mass and energy balances with regard to some of the most recent plants operating in Mediterranean countries, particularly in Italy [60]. To this end, an anaerobic process was chosen assuming 30 days of hydraulic retention time (HRT) and producing 163 m3 of biogas (almost 60% of CH4) per ton of feedstock. Figure 9 illustrates the flowsheet balance, which is in line with what has been described in the previous monitoring processes associated with FW anaerobic co-digestion. It should be mentioned that the digestate was exploited for aerobic treatment to produce a compost meeting local and international standard for agricultural use.
As laboratory results are not flexible enough to assimilate the real experimental conditions, some Mediterranean experiences were taken as reference points in order to remain as close as possible in terms of the similarity of the collected biowaste, particularly with regard to FW [70,71]. To this end, some research works that were achieved in Spain, Italy, Turkey, France, and Greece were reviewed to investigate the feasibility of FW and CM anaerobic co-digestion [72,73,74].

4.4.2. Cost–Benefit of Establishing a Composting Plant in Tunisia

The analyzed facility was able to produce 0.4 MWe from 30 × 103 tons. It should be noted that the feeding capacity was not completely consumed in the digester. There was still a by-product (digestate) that has also been considered as a second source of income for the plant, in addition to the electric power. Of course, biogas technology suffers from a variety of problems. A very important problem in Tunisia, in particular as well as in the MENA region in general, is that there is no extensive experience of it due to its very limited numbers and low dispatchability in the region. Accordingly, the selling price of the digestate was assumed to be 20 $/ton, with this product needing to be treated to make it into a compost. Coming back to the economic analysis of the power plant, it includes two parts in terms of capital cost (capital investment), which contains the main part of the investment of the plant. The second part is the operational costs. These costs continue up to the last year of the lifespan of the plant. Detailed capital and operational costs are summarized in Table 9. The available data related to the cost distribution of the CAPEX and OPEX were gathered from a website umwelt Bundesamt [74]. while many other values were evaluated according to the economic conditions in Tunisia. This included acquiring land, engaging in building and construction, staff numbers, and staff salaries. It should be noted that in this research, the number of staff was assumed to be more than usual due to the lack of experience in this field and the maturity of the technology.
In general, the cost analysis can be divided into two main streams: income, which contains power sales and digitate sales, and expenditure, which contains CAPEX and OPEX. The total CAPEX for the assumed plant was around 3.5 million US $ and OPEX was 250 × 103 US $.
Cash flow analysis was achieved where different scenarios were taken into consideration in terms of the selling price of the power generated. According to the references (STEG) the local power price is around 8 cent/kWh. This value was incorporated in the analysis. In addition, the price was increased to show the effect of this very important part of the income for the biogas power plant, and how it accelerates the recovering rate of debts and enhances the cash flow movement. The increment was an average of 2 cent/kWh. The studied scenarios started from eight cents and rose to 18 cent/kwh.
It should be noted here that the return payback was considered to be 8% of the income. The income of the biogas plant in this study included two streams: power sales and digestate sales. In addition, two options were considered regarding the digestate. First, it can be sold if it is acceptable in terms of the market criteria for farms in Tunisia, or second, it needs advanced treatment before it can be sold. In the latter case, it must be converted to compost and needs to be treated and improved to match the required limitations. The income from digestate (if is saleable) was fixed at 200,000 US $/year. Figure 10 shows the cash flow analysis for one year of the lifespan of the plant, and Table 10 summarizes the results.
Table 10 illustrates the cash flow including the digestate as part of the income. With 8 cent/kwh, which is the local price of power in Tunisia, the plant had a deficit of around 63,000 US$/year and the pay-back was around 35,000 US$/year. This means that the plant will not cover its expenditure, even though there is a loan (if there is a loan from a bank). The same conclusion was arrived at with the other scenarios (at 10 cents, 12 cents, …, 18 cents). However, with 18 cents US$/kwh as the selling price for power, it can be seen that the profit was much better at around 230,000 US$/year. Consequently, the payback can be increased to 200,000 US$/year to close the gap and to pay back the loan to the bank. From this, it can be concluded that the payback percentage must be increased to at least 30% from the income to cover the payback principal and the operational costs.
The second option is one without income from the digestate. It can be concluded for all scenarios that the project is in a deficient stage except in the case of 18 cent/kwh, when the plant can close the gap. In addition, the payback percentage must be increased to 35% of the income.
To summarize, this study introduces the concept of the cash flow for a biogas plant in Tunisia, and drew the following conclusions:
  • At a selling price of 8 cent/kwh, it is not worth building such a plant.
  • The digestate should be included in the income streams to increase the affordability of the plant and to determine the economic life of the project.
  • The optimum price for determining a matching level among all the cash streams is 18 cent/kwh as a power price. Furthermore, the payback percentage must be increased to around 25–30% of the income to cover the cost of loans or any other commitment.
Note that the levelized cost of electricity was found to be equal to 15 US$ cent/KWh, according to the local selling price of power in Tunisia (8 cent/kwh).

4.5. Mapping of Biowaste and Appropriate Biological Treatment in the Coastal Region of Tunisia

Dealing with the sensitivity related to the selection of an appropriate location as well as a suitable system for biowaste recovery, a mutual connection between several factors has to be taken into consideration in the form of specific technologies and specific site selection. The targeted area and selected processes must guarantee meeting the following challenges at the very least:
  • Infrastructure: location (sufficient space), equipment, water, and energy supplies;
  • Raw materials: continuous availability of clean feedstock; and
  • Marketing: stable market demand for the output (biogas, digestate/compost).
The volume of biowaste collected from each zone as well as their geographical distribution represents critical criteria for determining the existing potential for upgrade. Figure 11 illustrates the local biowaste generator sites with regard to the Tunisian coastline. However, it should be mentioned that FW corresponds to waste food collected from the food processing sector (fruit and vegetable canneries and winemaking manufactories) and the catering services area as well as kitchen waste gathered from the hospitality sector. Regarding manure, it relates to poultry and livestock manure and slaughterhouses residue, which together constitute the SW generated by poultry and livestock slaughterhouses.
The selection of the most appropriate processes for recovering biowaste from different zones of the studied area was achieved based on:
  • The mapping of biowaste generated from different zones (Figure 6);
  • Meeting the above-cited challenges;
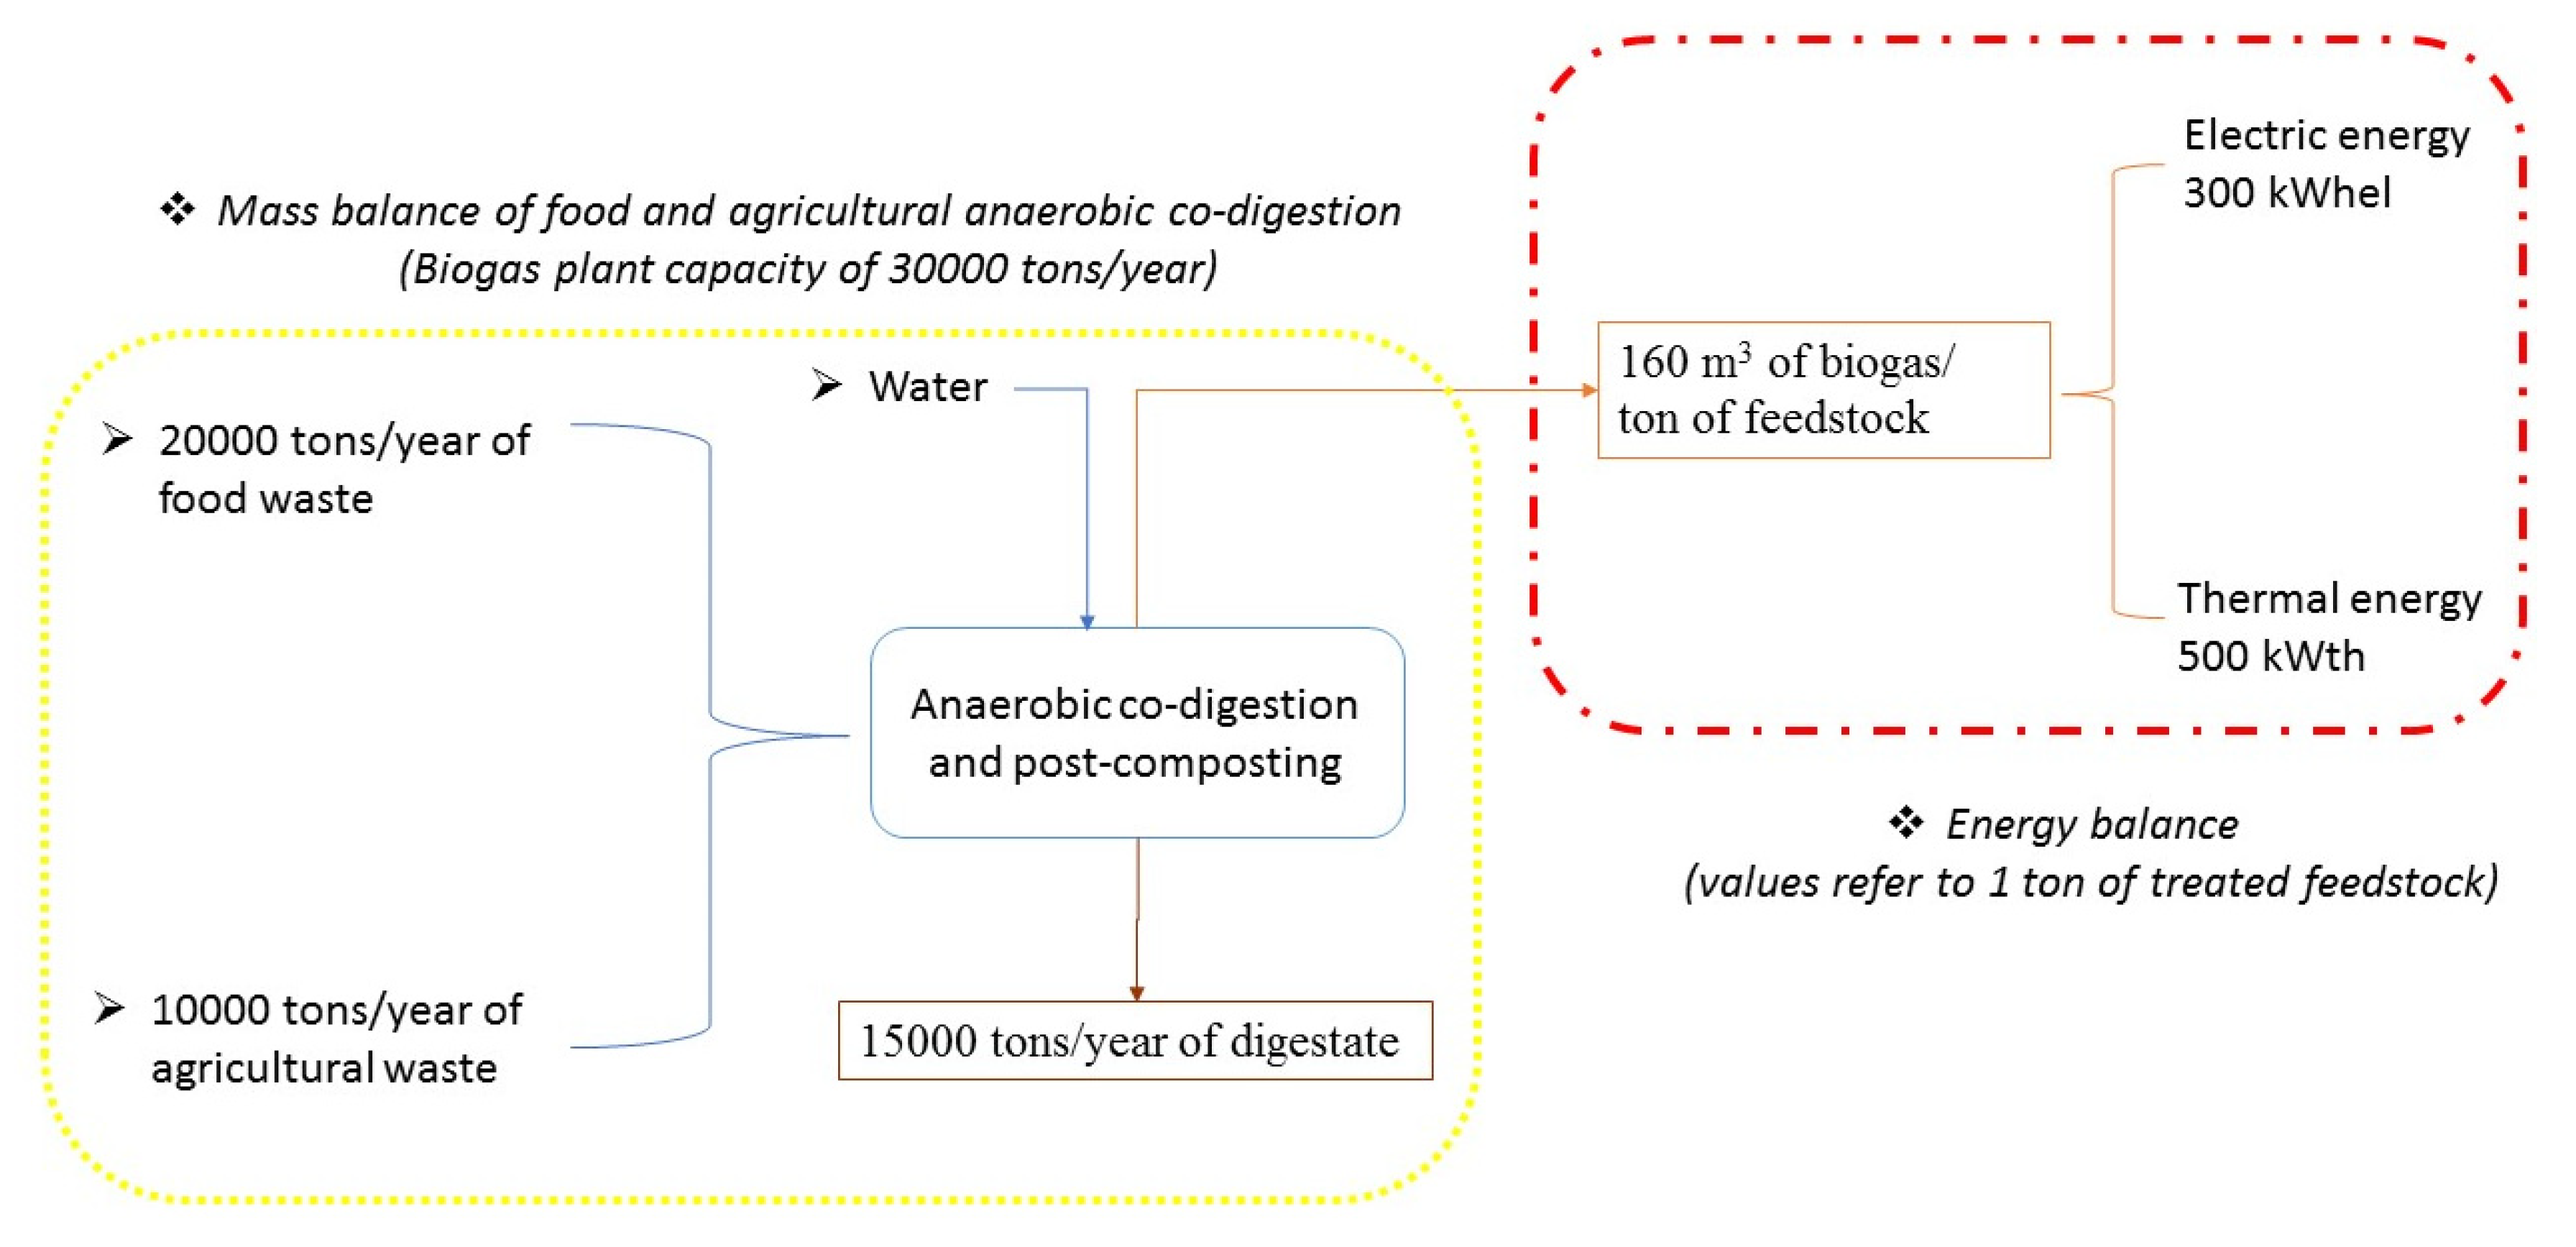
  • Assuming a biogas plant capacity of around 30,000–40,000 tons/year; and
  • Assuming a composting plant capacity of around 5000–10,000 tons/year.
Accordingly, the most suitable technology as well as the number of treatment plants needed are identified as shown in Table 11. Moreover, the selection of the feedstock mixture ratios and appropriate biological processes were made referring to the availability and nature of bio-waste, in addition to the particular needs of each area in terms of either organic fertilizers or energy.

5. Conclusions

This research is an attempt to provide an efficient tool for decision-makers by providing a potential organic waste treatment concept that can be adapted based on technical requirements and local conditions in Tunisia. Therefore, the potential of organic waste was examined, and the characterization and quantification of the existing biowaste gathered from different sectors across Tunisia were carried out. Indeed, data were collected on a dataset from scientific work achieved by one of the authors in cooperation within the framework of a project realized by the National Agency for Waste Management of Tunisia (ANGed) in collaboration with the German Corporation for International Cooperation (GIZ), then an update was ensured in cooperation with the municipalities of the selected study area. However, it should be mentioned that a huge gap was remarked with regard to household waste quantification and qualification. Despite the high fraction of organics that outlined the household waste, the latter was not precisely characterized as it is always mixed with further residues and sent to landfills without any pre-treatment. Therefore, special attention has to be paid to the household streams. When it comes to biowaste “easily” separated and collected at the source, results revealed that cattle manure, food and green waste are suitable for the proposed operational scenarios of aerobic and anaerobic digestion to produce highly qualified end-products. Based on the geographical zones of the selected study area, availability of the necessary organic streams and the technical and economic feasibility analysis of the evaluated biological treatment options, a road map for the proposed processes was presented for different regions to help the decision-makers to implement an appropriate solid waste management strategy in Tunisia. Economically, it is clear that the profits from both the compost and biogas plants would be very modest. Indeed, the feasibility of such sustainable projects should not be evaluated only on an economic basis, but also by taking into account socio-environmental considerations including decreasing environmental threats and the negative impact on human health, providing work opportunities, increasing incomes, stimulating public awareness as well as reducing operating costs linked to landfilling. To this end, to ensure sustainability, it is recommended that such projects be the responsibility of municipalities. The latter, as a facility owner, has the right to select who runs and operates the above-mentioned plants. All of these aspects are factors that should motivate and push politicians and decision-makers at different levels to support such investment by the creation of an organized legal and financial framework.

Author Contributions

Conceptualization, N.E.H.C. and A.N.; Methodology, N.E.H.C. and A.N.; Software, S.H. and Q.T.; Formal analysis, N.E.H.C.; Investigation, N.E.H.C.; Data curation, N.E.H.C. and M.C.; Writing—original draft preparation, N.E.H.C., S.H. and Q.T.; Writing—review and editing, N.E.H.C. and S.H.; Supervision, A.N., M.C., M.H. and M.N. All authors have read and agreed to the published version of the manuscript.

Funding

This research received no external funding.

Acknowledgments

The authors express their sincere appreciation to the National Agency for Waste Management of Tunisia (ANGed) for ensuring the needed data as well as to the Technical Lab for Waste Management and Bioenergy, University of Rostock, Germany, for the analyses of the substrate.

Conflicts of Interest

The authors declare no conflict of interest.

References

  1. Chen, Y.-C. Effects of urbanization on municipal solid waste composition. Waste Manag. 2018, 79, 828–836. [Google Scholar] [CrossRef] [PubMed]
  2. Brancoli, P.; Bolton, K.; Eriksson, M. Environmental impacts of waste management and valorisation pathways for surplus bread in Sweden. Waste Manag. 2020, 117, 136–145. [Google Scholar] [CrossRef] [PubMed]
  3. Feng, S.-J.; Zhao, Y.; Zhang, X.-L.; Bai, Z.-B. Leachate leakage investigation, assessment and engineering countermeasures for tunneling underneath a MSW landfill. Eng. Geol. 2020, 265, 105447. [Google Scholar] [CrossRef]
  4. What a Waste: An Updated Look into the Future of Solid Waste Management. Available online: https://www.worldbank.org/en/news/immersive-story/2018/09/20/what-a-waste-an-updated-look-into-the-future-of-solid-waste-management (accessed on 26 June 2020).
  5. Mahjoub, O.; Jemai, A.; Haddaoui, I. Waste Management in Tunisia—What Could the Past Bring to the Future? In The Economics of Water; Springer International Publishing: Cham, Switzerland, 2019; pp. 35–69. [Google Scholar]
  6. Ammar, S.B. Les Enjeux de la Caractérisation des Déchets Ménagers Pour le Choix des Traitements Adaptés Dans les Pays en Développement: Résultats de la Caractérisation Dans le Grand Tunis Mise au Point d’un Méthode Adaptée. Ph.D. Thesis, Lorraine Polytechnical Institute, National Higher School of Geology of Nancy, Vandœuvre-lès-Nancy, France, 2006; p. 328. [Google Scholar]
  7. Kaza, S.; Yao, L.; Bhada-Tata, P.; Van Woerden, F. What a Waste 2.0: A Global Snapshot of Solid Waste Management to 2050; The World Bank: Washington, DC, USA, 2018. [Google Scholar]
  8. Negm, A.M.; Shareef, N. Introduction to the Waste Management in MENA Regions. In Waste Management in MENA Regions; Negm, A.M., Shareef, N., Eds.; Springer Water; Springer International Publishing: Cham, Switzerland, 2020; pp. 1–11. ISBN 978-3-030-18350-9. [Google Scholar]
  9. Bhatia, S.K.; Joo, H.-S.; Yang, Y.-H. Biowaste-to-bioenergy using biological methods—A mini-review. Energy Convers. Manag. 2018, 177, 640–660. [Google Scholar] [CrossRef]
  10. Agapiou, A.; Andreas, V.; Marinos, S.; Katerina, M.; Zorpas, A.A. Waste aroma profile in the framework of food waste management through household composting. J. Clean. Prod. 2020, 257, 120340. [Google Scholar] [CrossRef]
  11. European Economy 2008—European Commission. Available online: https://ec.europa.eu/economy_finance/publications/european_economy/2008/index_en.htm (accessed on 23 September 2020).
  12. NDE GermanyBMUB Environmental Technologies Export Initiative. Available online: https://www.nde-germany.de/en/profiles/ (accessed on 1 July 2020).
  13. Hannisdal, R.; Nøstbakken, O.J.; Hove, H.; Madsen, L.; Horsberg, T.E.; Lunestad, B.T. Anti-sea lice agents in Norwegian aquaculture; surveillance, treatment trends and possible implications for food safety. Aquaculture 2020, 521, 735044. [Google Scholar] [CrossRef]
  14. ANGED. 2014. Available online: http://www.anged.nat.tn/index.php?option=com_content&view=article&id=146 (accessed on 8 July 2019).
  15. Bank, T.W. Tunisia—Sustainable Municipal Solid Waste Management Project; The World Bank: Tunis, Tunisia, 2015; pp. 1–9. [Google Scholar]
  16. Chaher, N.E.H.; Chakchouk, M.; Nassour, A.; Nelles, M.; Hamdi, M. Potential of windrow food and green waste composting in Tunisia. Environ. Sci. Pollut. Res. 2020, 1–13. [Google Scholar] [CrossRef]
  17. Ardolino, F.; Colaleo, G.; Arena, U. The cleaner option for energy production from a municipal solid biowaste. J. Clean. Prod. 2020, 266, 121908. [Google Scholar] [CrossRef]
  18. Dennehy, C.; Lawlor, P.G.; McCabe, M.; Cormican, P.; Sheahan, J.; Jiang, Y.; Zhan, X.; Gardiner, G. Anaerobic co-digestion of pig manure and food waste; effects on digestate biosafety, dewaterability, and microbial community dynamics. Waste Manag. 2018, 71, 532–541. [Google Scholar] [CrossRef]
  19. Beggio, G.; Schievano, A.; Bonato, T.; Hennebert, P.; Pivato, A. Statistical analysis for the quality assessment of digestates from separately collected organic fraction of municipal solid waste (OFMSW) and agro-industrial feedstock. Should input feedstock to anaerobic digestion determine the legal status of digestate? Waste Manag. 2019, 87, 546–558. [Google Scholar] [CrossRef]
  20. Cesàro, A.; Russo, L.; Belgiorno, V. Combined anaerobic/aerobic treatment of OFMSW: Performance evaluation using mass balances. Chem. Eng. J. 2015, 267, 16–24. [Google Scholar] [CrossRef]
  21. Carabassa, V.; Domene, X.; Alcañiz, J.M. Soil restoration using compost-like-outputs and digestates from non-source-separated urban waste as organic amendments: Limitations and opportunities. J. Environ. Manag. 2020, 255, 109909. [Google Scholar] [CrossRef] [PubMed]
  22. Abdulrahman, A. Solid Waste Management in Tunisia, EcoMENA, Africa, Recycling. 2 June 2018. Available online: https://www.ecomena.org/solid-waste-management-tunisia/ (accessed on 26 June 2020).
  23. Ardhaoui, K.; Bellali, F.; Moussa, M. Composting and lixiviation, case study in Médenine-Tunisia. J. Res. Environ. Earth Sci. 2019, 7, 161–167. [Google Scholar]
  24. Population de la Tunisie 2014–2024. Available online: https://fr.statista.com/statistiques/687752/population-totale-tunisie/ (accessed on 3 February 2020).
  25. Zhou, J.; Shen, L.; Song, X.; Zhang, X. Selection and modeling sustainable urbanization indicators: A responsibility-based method. Ecol. Indic. 2015, 56, 87–95. [Google Scholar] [CrossRef]
  26. Chouari, W.; Belarem, M. Enjeux de la Tunisie orientale: Un territoire développé et un environnement à protéger. Confins 2017. [Google Scholar] [CrossRef]
  27. Tunisie: Rapport de Suivi de la Situation Économique. Available online: https://www.banquemondiale.org/fr/country/tunisia/publication/economic-update-april-2020 (accessed on 23 July 2020).
  28. Statista—Le Portail de Statistiques. Available online: https://fr.statista.com/map/afrique/tunisie/ (accessed on 18 September 2020).
  29. Chaabane, W.; Nassour, A.; Nelles, M. Solid Waste Management Key Indicator Development for Hotels: A Tunisian Case Study Analysis. Recycle 2018, 3, 56. [Google Scholar] [CrossRef] [Green Version]
  30. Pellera, F.-M.; Gidarakos, E. Anaerobic digestion of solid agroindustrial waste in semi-continuous mode: Evaluation of mono-digestion and co-digestion systems. Waste Manag. 2017, 68, 103–119. [Google Scholar] [CrossRef]
  31. Elnaas, A. Actual situation and Approach for Municipal Solid Waste Treatment in the Arab Region. Ph.D. Thesis, The Academic Board of Rostock University, Rostock, Germany, 2015; p. 152. [Google Scholar]
  32. Ministère de l’Industrie, de l’Energie et des Mines. Available online: http://www.tunisieindustrie.gov.tn/ (accessed on 18 September 2020).
  33. Millati, R.; Cahyono, R.B.; Ariyanto, T.; Azzahrani, I.N.; Putri, R.U.; Taherzadeh, M.J. Chapter 1—Agricultural, Industrial, Municipal, and Forest Wastes: An Overview. In Sustainable Resource Recovery and Zero Waste Approaches; Taherzadeh, M.J., Bolton, K., Wong, J., Pandey, A., Eds.; Elsevier: Amsterdam, The Netherlands, 2019; pp. 1–22. ISBN 978-0-444-64200-4. [Google Scholar]
  34. Marzougui, A.; Ben Mammou, A. Impacts of the dumping site on the environment: Case of the Henchir El Yahoudia Site, Tunis, Tunisia. Comptes Rendus Geosci. 2006, 338, 1176–1183. [Google Scholar] [CrossRef]
  35. DevelopmentAid. Available online: https://www.developmentaid.org/ (accessed on 18 September 2020).
  36. Law No. 96-41 of 10 June 1996 on Wastes and the Control of their Management and Disposal | InforMEA. Available online: https://www.informea.org/en/law-no-96-41-10-june-1996-wastes-and-control-their-management-and-disposal (accessed on 18 September 2020).
  37. Abu Hajar, H.A.; Tweissi, A.; Abu Hajar, Y.A.; Al-Weshah, R.; Shatanawi, K.M.; Imam, R.; Murad, Y.Z.; Abu Hajer, M.A. Assessment of the municipal solid waste management sector development in Jordan towards green growth by sustainability window analysis. J. Clean. Prod. 2020, 258, 120539. [Google Scholar] [CrossRef]
  38. Tsapekos, P.; Kougias, P.; Kuthiala, S.; Angelidaki, I. Co-digestion and model simulations of source separated municipal organic waste with cattle manure under batch and continuously stirred tank reactors. Energy Convers. Manag. 2018, 159, 1–6. [Google Scholar] [CrossRef] [Green Version]
  39. Pandyaswargo, A.H.; Gamaralalage, P.J.D.; Liu, C.; Knaus, M.; Onoda, H.; Mahichi, F.; Guo, Y.; Gamaralalage, J.D.; Liu, G. Challenges and An Implementation Framework for Sustainable Municipal Organic Waste Management Using Biogas Technology in Emerging Asian Countries. Sustainability 2019, 11, 6331. [Google Scholar] [CrossRef] [Green Version]
  40. SWEEP-Net Report. Report on the Solid Waste Management in Tunisia, Deutsche Gesellschaft für Internationale Zusammenarbeit (GIZ). 2014. Available online: http://www.retech-germany.net/fileadmin/retech/05_mediathek/laenderinformationen/Tunesien_laenderprofile_sweep_net.pdf (accessed on 25 August 2018).
  41. Wang, H.; Wang, D.; Zhou, X. Analysis on the Trend of Water Quality in Haihe River Basin from 2005 to 2017. J. Geosci. Environ. Prot. 2018, 6, 1–7. [Google Scholar] [CrossRef] [Green Version]
  42. Thabit, Q.; Nassour, A.; Nelles, M. Potentiality of Waste-to-Energy Sector Coupling in the MENA Region: Jordan as a Case Study. Energies 2020, 13, 2786. [Google Scholar] [CrossRef]
  43. Huiru, Z.; Yan, Y.; Liberti, F.; Bartocci, P.; Fantozzi, F. Technical and economic feasibility analysis of an anaerobic digestion plant fed with canteen food waste. Energy Convers. Manag. 2019, 180, 938–948. [Google Scholar] [CrossRef]
  44. Diebels, J. Feasibility Study of Biological Treatment of Organic Waste in Tsumeb Municipality, Namibia. Ph.D. Thesis, KTH Royal Institute of Technology, Stockholm, Sweden, 2014. [Google Scholar]
  45. Garcia, A.P. Techno-Economic Feasibility Study of a Small-Scale Biogas Plant for Treating Market Waste in the City of El Alto. 2014. Available online: http://kth.diva-portal.org/smash/get/diva2:741758/FULLTEXT01.pdf (accessed on 25 July 2019).
  46. Dhinesh, N.; Annamary, J.M.; Iswarya, K.; Murugan, K.V.; Kirubakaran, V. A Comprehensive Study of Food Waste to Biogas Plant: Paths to Improve the Performance—A Case Study. In Bioresource Utilization and Bioprocess; Springer International Publishing: Cham, Switzerland, 2020; pp. 1–12. [Google Scholar]
  47. Liu, J.; Li, Q.; Gu, W.; Wang, C. The Impact of Consumption Patterns on the Generation of Municipal Solid Waste in China: Evidences from Provincial Data. Int. J. Environ. Res. Public Health 2019, 16, 1717. [Google Scholar] [CrossRef] [PubMed] [Green Version]
  48. Kumar, S.; Smith, S.R.; Fowler, G.; Velis, C.; Arya, S.; Rena Kumar, R.; Cheeseman, C.; Kumar, S.J. Challenges and opportunities associated with waste management in India. R. Soc. Open Sci. 2017, 4, 160764. [Google Scholar] [CrossRef] [PubMed] [Green Version]
  49. Directive (EU) 2018/of the European Parliament and of the Council of 30 May 2018 Amending Directive 2008/98/EC on Waste. 32. Available online: https://eur-lex.europa.eu/legal-content/EN/TXT/PDF/?uri=CELEX:32018L0851&from=EN (accessed on 19 September 2020).
  50. Boschini, M.; Falasconi, L.; Claudia, G.; Alboni, F. Food waste in school canteens: A reference methodology for large-scale studies. J. Clean. Prod. 2018, 182, 1024–1032. [Google Scholar] [CrossRef]
  51. Wafi, T.; Ben Othman, A.; Besbes, M. Qualitative and quantitative characterization of municipal solid waste and the unexploited potential of green energy in Tunisia. Bioresour. Bioprocess. 2019, 6, 1–16. [Google Scholar] [CrossRef] [Green Version]
  52. Burke, E.; Napawan, N.C. Between Kitchen Sink and City Sewer: A Socio-Ecological Approach to Food Waste in Environmental Design. In Food Waste Management; Springer International Publishing: Cham, Switzerland, 2019; pp. 169–191. [Google Scholar]
  53. Dias-Ferreira, C.; Santos, T.; Oliveira, V. Hospital food waste and environmental and economic indicators—A Portuguese case study. Waste Manag. 2015, 46, 146–154. [Google Scholar] [CrossRef]
  54. Pirani, S.I.; Arafat, H.A. Solid waste management in the hospitality industry: A review. J. Environ. Manag. 2014, 146, 320–336. [Google Scholar] [CrossRef]
  55. Filimonau, V.; De Coteau, D.A. Food waste management in hospitality operations: A critical review. Tour. Manag. 2019, 71, 234–245. [Google Scholar] [CrossRef]
  56. Dileep, M.R. Tourism and Waste Management: A Review of Implementation of Zero Waste at Kovalam. Asia Pac. J. Tour. Res. 2007, 12, 377–392. [Google Scholar] [CrossRef]
  57. Malefors, C.; Callewaert, P.; Hansson, P.-A.; Hartikainen, H.; Pietiläinen, O.; Strid, I.; Strotmann, C.; Eriksson, M. Towards a Baseline for Food-Waste Quantification in the Hospitality Sector—Quantities and Data Processing Criteria. Sustainability 2019, 11, 3541. [Google Scholar] [CrossRef] [Green Version]
  58. Obi, F.; Ugwuishiwu, B.; Nwakaire, J. Agricultural Waste Concept, Generation, Utilization and Management. Niger. J. Technol. 2016, 35, 957. [Google Scholar] [CrossRef]
  59. Demichelis, F.; Piovano, F.; Fiore, S. Biowaste Management in Italy: Challenges and Perspectives. Sustainability 2019, 11, 4213. [Google Scholar] [CrossRef] [Green Version]
  60. Oviedo-Ocaña, E.R.; Dominguez, I.; Komilis, D.; Sánchez, A. Co-composting of Green Waste Mixed with Unprocessed and Processed Food Waste: Influence on the Composting Process and Product Quality. Waste Biomass-Valorizat. 2017, 10, 63–74. [Google Scholar] [CrossRef]
  61. Akturk, A.S.; Demirer, G.N. Improved Food Waste Stabilization and Valorization by Anaerobic Digestion through Supplementation of Conductive Materials and Trace Elements. Sustainability 2020, 12, 5222. [Google Scholar] [CrossRef]
  62. Chaher, N.E.H.; Chakchouk, M.; Engler, N.; Nassour, A.; Nelles, M.; Hamdi, M. Optimization of Food Waste and Biochar In-Vessel Co-Composting. Sustainability 2020, 12, 1356. [Google Scholar] [CrossRef] [Green Version]
  63. Tibu, C.; Annang, T.; Solomon, N.; Yirenya-Tawiah, D. Effect of the composting process on physicochemical properties and concentration of heavy metals in market waste with additive materials in the Ga West Municipality, Ghana. Int. J. Recycl. Org. Waste Agric. 2019, 8, 393–403. [Google Scholar] [CrossRef] [Green Version]
  64. Ramachandra, T.V.; Bharath, H.; Kulkarni, G.; Han, S.S. Municipal solid waste: Generation, composition and GHG emissions in Bangalore, India. Renew. Sustain. Energy Rev. 2018, 82, 1122–1136. [Google Scholar] [CrossRef]
  65. Km, K.; Reinhart, D.R.; Hawkins, C.V.; Motlagh, A.; Wright, J.D. Food waste and the food-energy-water nexus: A review of food waste management alternatives. Waste Manag. 2018, 74, 52–62. [Google Scholar] [CrossRef]
  66. Bong, C.P.C.; Lim, L.Y.; Lee, C.T.; Klemeš, J.J.; Ho, C.S.; Ho, W.S. The characterisation and treatment of food waste for improvement of biogas production during anaerobic digestion—A review. J. Clean. Prod. 2018, 172, 1545–1558. [Google Scholar] [CrossRef]
  67. Zarkadas, I.S.; Sofikiti, A.S.; Voudrias, E.A.; Pilidis, G.A. Thermophilic anaerobic digestion of pasteurised food wastes and dairy cattle manure in batch and large volume laboratory digesters: Focussing on mixing ratios. Renew. Energy 2015, 80, 432–440. [Google Scholar] [CrossRef]
  68. Li, R.; Chen, S.; Li, X. Anaerobic Co-digestion of Kitchen Waste and Cattle Manure for Methane Production. Energy Sources Part A Recover. Util. Environ. Eff. 2009, 31, 1848–1856. [Google Scholar] [CrossRef]
  69. Serrano, A.; Siles, J.A.; Chica, A.F.; Martín, M.A. Agri-food waste valorization through anaerobic co-digestion: Fish and strawberry residues. J. Clean. Prod. 2013, 54, 125–132. [Google Scholar] [CrossRef]
  70. Wan, S.; Sun, L.; Douieb, Y.; Sun, J.; Luo, W. Anaerobic digestion of municipal solid waste composed of food waste, wastepaper, and plastic in a single-stage system: Performance and microbial community structure characterization. Bioresour. Technol. 2013, 146, 619–627. [Google Scholar] [CrossRef]
  71. Fisgativa, H.; Tremier, A.; Dabert, P. Characterizing the variability of food waste quality: A need for efficient valorisation through anaerobic digestion. Waste Manag. 2016, 50, 264–274. [Google Scholar] [CrossRef]
  72. Bedoić, R.; Čuček, L.; Ćosić, B.; Krajnc, D.; Smoljanić, G.; Kravanja, Z.; Ljubas, D.; Pukšec, T.; Duić, N. Green biomass to biogas—A study on anaerobic digestion of residue grass. J. Clean. Prod. 2019, 213, 700–709. [Google Scholar] [CrossRef]
  73. Lytras, G.; Koutroumanou, E.; Lyberatos, G. Anaerobic co-digestion of condensate produced from drying of Household Food Waste and Waste Activated Sludge. J. Environ. Chem. Eng. 2020, 8, 103947. [Google Scholar] [CrossRef]
  74. Umweltbundesamt | Für Mensch und Umwelt. Available online: https://www.umweltbundesamt.de/en (accessed on 29 September 2020).
Figure 1. Study area: Coastline of Tunisia.
Sustainability 12 08167 g001
Figure 2. ECO-concept for biowaste recovery in Tunisia.
Sustainability 12 08167 g002
Figure 3. Green waste collected from parks and commercial areas.
Sustainability 12 08167 g003
Figure 4. Food waste collected from different sectors of activity.
Sustainability 12 08167 g004
Figure 5. Quantification of kitchen waste generated by the tourism sector.
Sustainability 12 08167 g005
Figure 6. Characterization of biowaste generated by the agricultural sector.
Sustainability 12 08167 g006
Figure 7. Characterization of biowastes generated by the industrial sector.
Sustainability 12 08167 g007
Figure 8. Specific biogas and methane yields from FW and CM anaerobic digestion.
Sustainability 12 08167 g008
Figure 9. Scenario of mass and energy balances of food waste (75%) and agricultural wastes (25%) with regard to anaerobic co-digestion (30,000 tons/year).
Sustainability 12 08167 g009
Figure 10. Distribution expenses of the whole power plant in terms of income and expenditure.
Sustainability 12 08167 g010
Figure 11. Mapping of the source of biowaste on the Tunisian coast.
Sustainability 12 08167 g011
Table 1. Material and energy recovery of biowaste.
Sector of Activity CompostingAnaerobic Digestion
Source of Organic Waste
Urban areaGreen waste from municipal and wholesale markets
Green waste from urban green spaces
Food waste from catering services
Touristic sectorFood leftovers, kitchen waste
Green waste from gardening activity
Industrial and food-processingWinemaking residues
Livestock slaughterhouses waste
Poultry slaughterhouses waste
Fruits and vegetables waste from canneries
Wood manufacturing waste
Solid waste from olive-oil mills (stones, leaves…)
Agricultural sectorLivestock manure
Poultry manure
Arboricultural residue (Palm leaves, olive leaves…)
Table 2. Physical and chemical parameter measurement of biowastes opted for biological treatments.
ParametersUnitsMethod of AnalysisReference
pH-(1:10 w/v sample: water extract)ISO 10390 (1994)
Moisture content (MC)% of FM 1Using electronic oven by drying at 105oC for 24hNF ISO 11465 (1994)
Total solids (TS)% of FM 1
Total Carbon (TC)% of FM 1TOC (%) = ((100 − Ash%) ÷ 1/8)[42]
Total Nitrogen (TN)% of FM 1Titrimetric methodsNF ISO 11265 (1995)
Phosphorus (P)% of TS 2Atomic absorption spectrometric methodsISO 11885 (2007)
Potassium (K)% of TS 2
Magnesium (Mg)% of TS 2Spectrometer, Thermo-Elemental ICP MS-X SeriesISO 11885 (2007)
Lead (Pb)mg/kg TS
Copper (Cu)mg/kg TS
Zinc (Zn)mg/kg TS
Nickel (Ni)mg/kg TS
Cadmium (Cd)mg/kg TS
Arsenic (As)mg/kg TS
1 FM: Fresh Matter; 2 TS: Total Solids.
Table 3. Economic parameters used in the model.
ParameterUnitSymbolValueReference of Values
Inflation rate%F1Assumed
Interest rate%ri8Assumed
Discount rate%rd5Assumed
Cost of power saleUS$-0.08Assumed
Cost of digestate saleUS$-1.2[44]
Lifetime of the power plantYearsN15[45]
Operational hours of the Power planth/yearH8000[46]
Plant capacityTon/year-30.000[47]
Power productionMWeP0.4Assumed
Table 4. Characterization of the selected biowastes for biological treatments.
Selected Organic Waste UnitsUrban & Touristic AreasAgricultural Area
ParametersGreen WasteFood WasteCattle Manure
pH-6.514.225.23
Moisture content (MC)% of FM 141.1277.4088.50
Total solids (TS)% of FM58.8822.6011.50
Volatile solids (VS)% of TS 2-94.608.90
Total Carbon (TC)% of FM48.8147.7042.61
Total Nitrogen (TN)% of FM1.122.601.70
C:N ratio 43.5818.3425.06
Phosphorus (P)% of TS0.230.480.60
Potassium (K)% of TS2.010.912.95
Magnesium (Mg)% of TS-0.092.82
Lead (Pb)mg/kg TS0.120.910.85
Copper (Cu)mg/kg TS17.836.8218.20
Zinc (Zn)mg/kg TS25.8116.33131.00
Nickel (Ni)mg/kg TS9.630.956.91
Cadmium (Cd)mg/kg TS0.090.070.91
Arsenic (As)mg/kg TS-0.570.28
1 FM: Fresh Matter; 2 TS: Total Solids.
Table 5. Summary of the physio-chemical parameters of different composting trials.
TrialThermophilic Phase (days)Tmax (°C)pHNitrification IndexC:N RatioAT4 (mg O2/g TS)Classification vs. “German Standards”
P016 days60 °C7.342.217.54.2Finished compost: Class V
P117 days63 °C7.412.615.24.9Finished compost: Class V
P223 days66 °C7.533.311.55.3Finished compost: Class V
P311 days61 °C8.034.19.25.2Finished compost: Class V
P0: 100% GW, P1: FW:GW = 25:75 P2: FW:GW = 50:50, P3: FW:GW = 75:25.
Table 6. The limits of total metal content (mg/kg TS) relative to the composting standards of certain countries.
Metal (mg/kg TS)Actual ExperimentsCompost Quality
P0P1P2P3UKTunisiaCanadaGermany
Class AClass B
Lead (Pb)2.633.479.039.87200180150150100
Copper (Cu)13.5423.6137.1242.3120030040010070
Zinc (Zn)37.8950.1961.0461.25400600700400300
Nickel (Ni)12.3115.4711.1213.445060625035
Cadmium (Cd)0.090.230.600.841.5331.51
Chrome (Cr)8.1310.9433.9037.1710012021010070
Mercury (Hg)<0.01<0.01<0.010.01---10.7
P0: 100% GW, P1: FW:GW = 25:75 P2: FW:GW = 50:50, P3: FW:GW = 75:25.
Table 7. Assumptions for the purpose of a composting site design with a triangular windrow section.
Calculated ParametersUnitAmount
Composting plant of sizetons year−110,000
Average density of green wasteKg m−3104
Average density of food wasteKg m−3300
Working collection days days/year−1300
Composting period for each pileWeek13–15
Dimensions of windrow pilesLength (l)M10
Height (h)M2
Width (w)M3.5
Volume of windrow: triangular section½ × (l × h × w)m335
Volume reduction in windrow piles %30
Volume of finished compostVolume of inputs × 0.7m3Depending on the feedstock mixtures
Number of windrows per dayVolume of inputs/volume of windrow pilem3
Table 8. Cost–benefit of establishing a composting plant in Tunisia.
Estimated Civil Engineering * Investment Cost (Part 1)Investment Costs on Material and Equipment (Part 2) **Investment Cost ManagementYearly Costs for Operation and Maintenance ***Yearly Costs for Capital, Consumption, & OperationYearly Profit from the Sales of Compost at 30 €/ton
Engineering a3%70,000Turner machine12%250,000State grants30%622,500Personal cost60,000Capital related cost43,575Compost sales210,000
Preparation of land and layout (10 donums)24%500,000Front loader 6%120,000Own contribution0%0.00Fuel & energy consumption45,000Operation and maintenance related cost158,500Production cost202,075
Outdoor facility34%700,000Rotary drum screen)10%200,000Additional investment required70%1,452,500Water consumption 3500Total yearly cost (€/year)202,075Net profit7925
Sum of Part161%1,270,000Shredder10%200,000** Machines and equipment needed:
-
front loader (1)
-
shredder (1)
-
drum screen (2)
-
temperature probe (2)
-
gas measurement (1)
-
Water tank (1)
-
Water pump (1)
Equipment’s and others10,000*** Personnel:
-
Qualified supervisor (1)
-
Trained worker (4)
-
Worker (2)
-
Driver (1)
*** On-site staff responsibilities include:
-
monitoring the biological process
-
turning of windrows
-
watering of windrows
-
quality control of finished compost.
* Site preparation and design including:
-
accessibility and parking concepts
-
composting platform (asphalt/concrete)
-
drainage system for leachate, thereby protecting groundwater.
-
Water and electricity supply
-
Fencing
Workshop equipment’s1%25,000 Building maintenance5000
Office equipment0.5%10,000Machine maintenance30,000
Sum of Part 239%805,000Insurance5000
Total setup costs100%2,075,000Total operation & maintenance cost/a158,500
Table 9. Capital and operation costs of the biogas plant in Tunisia.
Capital Investment Costs (CAPEX) *Operation Costs (OPEX)
Capital Cost Component **Percentage of the Cost (%) ***Operation ComponentsUnitNumberOperation Cost
Construction and land arrangement3.78%Maintenance cost€/kWh-0.015
Loading hall9.28%Maintenance cost for pumps and compressors%-1.5
CHP facility2.32%Staff salaries ****€/Mann121000
Drilling cost0.93%Personal logistic€/Mann12500
Mixing chamber1.39%Facility insurance%-7
Sanitization4.64%Power consumption%-10
Fermenter2.32%Load management%-5
Storage6.49%
Control system5.57%
Social room3.71%
Gas track (pipes)1.67%
Emergency factors1.39%
Pumps & compressors1.39%
Heat exchangers0.93%
Pipes connections4.64%
Biofilter7.42%
Electrical installation4.64%
Planning and design steps1.5%
Networks4.64%
Others2.13%
Total setup costs100%
* CAPEX has been estimated at about 3.5 million US dollars; ** Capital cost of component was based on the prices of the equipment and instruments in Germany; *** Their contribution to total cost has been worldwide stated based on experience; **** Salaries were calculated based on the level of wages in the study area: Tunisia.
Table 10. Effect of power price on the economic analysis of the biogas plant.
Power Price (cent/kWh)Without Digestate SaleWith Digestate Sale
Cash Flow without DigestatePayback without DigestateEvaluationCash flow with DigestatePayback with DigestateEvaluation
8−247,48020,480.00Deficient−63,480.0036,480.00Deficient
10−188,600.0025,600.00Deficient−4600.0041,600.00Deficient
12−129,720.0030,720.00Deficient54,280.0046,720.00Efficient
14−70,840.0035,840.00Deficient113,160.0051,840.00Efficient
16−11,960.0040,960.00Deficient172,040.0056,960.00Efficient
1846,920.0046,080.00Efficient230,920.0062,080.00Efficient
Table 11. Road map for the proposed biological treatment options for different regions of the study area.
Zone Great TunisBizerteNebeulSousseMonastirMehdiaSfaxGabesBejaJendoubaMedenine
Process
CompostingP0, P1P0P0, P1, P2P0, P1P0, P1P0P0P0P0, P1P0P0, P1
Anaerobic digestionR2R1R1, R2, R3R1, R2R1R1R1R1R1R1R1, R2
Number of composting plants suggested93898183886419
No. of biogas plants suggested36722331541
P0: 100% GW, P1: FW:GW = 25:75, P2: FW:GW = 50:50, P3: FW:GW = 75:25, R1: 100% CM, R2: FW:CM = 25:75, R3: FW:CM = 50:50, R4: FW:CM = 75:25.

