Abstract
Rural household livelihood research of ethnic minorities is urgent to the development of ethnic areas in China and achieve the world poverty reduction goal. To improve ethnic rural household livelihood, it is fundamental to figure out what are the types, characteristics as well as impact factors of their livelihood strategies. In the study, we explored the household livelihood strategy choices and livelihood diversity of the main ethnic minorities (Tujia and Miao) in Chongqing, as well as how livelihood capitals impact livelihood strategy through methods of clustering, livelihood diversity index and multiple logistic regression under the framework of sustainable livelihood approach. The results show that: (1) Full-time job, both full-time and part-time job, part-time agriculture, part-time job and subsidized livelihood strategy are livelihood strategies adopted by Tujia and Miao rural households in Chongqing, China. (2) The characteristics of the identified livelihood strategies are diversified and various in natural, financial, human and finance capital. (3) A number of livelihood capitals impact the way that household choose their livelihood strategies, but the livelihood capitals have no significant impact on the livelihood diversity. By detailed analysis of the characteristic of rural ethnic household livelihood strategy, especial livelihood diversity, the research enriched sustainable livelihood literature and provided useful information for policymakers and practitioners in designing effective programs for regional sustainable development and ecological protection.
1. Introduction
Since 1949, the ethnic livelihood in China has undergone tremendous changes along with social development [1]. In the traditional Chinese society that dominated by agriculture, the livelihoods of ethnic minorities show the characteristics of highly diversified, strongly dependent on the environment, and with diverse but unique understanding of man-land relationships [2]. In modern society, the livelihoods of ethnic minorities have shown other characteristics. On the one hand, ethnic livelihoods are merging to the mainstream livelihoods. On the other hand, due to historical, cultural, location and other influences, the current livelihood level of ethnic minorities in China is low, and diverse in ethnics [3]. Previous diversification and uniqueness of livelihoods have weakened or disappeared, but the level of livelihoods has not achieved similar development to the dominate ethnic, Han [4]. Ethnic livelihood is shaped by culture and is the carrier of ethnic culture. Changing livelihoods also changes ethnic cultures, how ethnic minorities understand man–land relationships, as well as livelihood impact on the environment. As generally perceived, minority persons make up a large part of the poverty population in rural China [5]. The study of the ethnic minorities’ livelihoods, especially the livelihoods of ethnic minority rural households, is of great significance to promote economic development in China’s ethnic regions and to achieve the world poverty reduction goal under the background of ethnic livelihood changing.
Sustainable livelihood requires households to have the ability to cope with and recover from stresses and shocks—for example, during the Covid emergency [6]. Prominent ethnic, energy poverty and gender inequality problems make ethnic rural areas key areas for sustainable livelihoods. Mao et al. put forward energy saving countermeasures for ethnic minority rural households in Chongqing, China, that vary in energy use pattern through characteristic energy analysis [7]. Gatto and Busato constructed a composite indicator on energy vulnerability and analyzed the energy vulnerability of a vast number of countries [8]. Drago and Gatto applied the interval-valued global gender gap index to distinguish differences in gender index, which helps to achieve gender equality, especially in rural areas [9]. Factors impact rural households to achieve sustainability, involving several major components—environmental, cultural, economic and social. Among these, female headed households tend to live in poverty [10] and to choose more diversified livelihood strategy [11]. Women endowment, involving improvement of education, access to markets (labor, land, and credit) and decision-making power accelerates poverty reduction and economic growth, both contemporaneously and in future periods [12]. Studies show that lending to women benefits their households although this may not empower the women concerned [13,14]. Reducing intra-household gender inequality protects vulnerable households as well as vulnerable individuals in the process of achieving sustainable livelihoods.
As an approach to achieve sustainable livelihoods, the sustainable livelihoods approach provides a scope and guidelines for the goals and indicates parameters along which sustainable livelihood could be visualized [15]. The sustainable livelihood analysis framework proposed by Department for International Development is an effective tool for quantitative research of household livelihood issues [16,17,18]. It considers the causes of poverty comprehensively and is popular in sustainable livelihood analysis. The framework assesses the household’s livelihood capital under the background of vulnerability, aiming to propose methods to improve rural households’ livelihood levels through policies, institutions and processes [18]. The vulnerability context frames the external environment in which people exist, including critical trends, shocks and seasonality that affect households’ livelihoods and the wider availability of assets and over which they have limited or no control [18]. As the energy poverty problem is urgent in ethnic rural areas, energy poverty related vulnerability draws the attention of scholars. The framework divides the livelihood capital of rural households into five categories—natural capital, human capital, physical capital, financial capital, and social capital—which form the livelihood capital pentagon. Livelihood capital assessment is the basis for conducting further livelihood or poverty analysis. By allocating these capitals properly, households can improve their livelihoods. Livelihood strategy includes two aspects: the choices of livelihood strategy and livelihood diversity. Although there is literature that studies rural households’ livelihoods in ethnic areas with the sustainable livelihood framework, most studies focus on the construction of evaluation index systems of livelihood capital [19], livelihood vulnerability evaluation [20], and the relationship between livelihood capital and strategy [21,22]. Few empirical studies were conducted to reveal the characteristics of livelihood strategy, especial livelihood diversity of ethnic minority rural households [23].
As the only municipality that has the ethnic autonomous areas in China, Chongqing is highly and unevenly developed [24]. Minorities in Chongqing mainly live in its southeast. This region is a karst mountain area, with fragile geology and high ecological importance. Compared with other regions in Chongqing, the southeast Chongqing is characterized by low economic development level and vulnerable eco-environment [25]. The study used the sustainable livelihood analysis framework to study the choices of livelihood strategy and livelihood diversity of rural households of main ethnic minorities (Tujia and Miao) in Chongqing, China. Based on the sustainable livelihood analysis framework, an evaluation index system for sustainable livelihoods of rural households was constructed. Then, questionnaire surveys were conducted to collect livelihood information of Tujia and Miao rural households. Households were clustered into groups by their income composition, representing different choices of livelihood strategy. Income composition, livelihood diversity based on Shannon Weir Index and livelihood capital of households adopting different livelihood strategy were compared. Finally, impact of rural household livelihood capitals on livelihood strategies were analyzed. The study aims to answer the following questions: (i) What are the rural household livelihood strategies of main ethnic minorities in Chongqing, China under the background of ethnic livelihood changes? (ii) What characteristics do households with different livelihood strategies show in income composition and livelihood capital? (iii) How do rural household livelihood capitals impact livelihood strategies of main ethnic minorities in the study area? The results would provide useful information for policymakers and practitioners in designing effective programs for regional sustainable development and ecological protection.
2. Materials and Methods
2.1. Study Area
Chongqing is located in southwest China (28°10′–32°13′ N, 105°11′–110°11′ E). A total of 1.26 × 10⁷ households inhabit there and the year-end resident population reaches 30.75 million in the investigation year, including 35.92% rural residents and 49.57% female [26]. Residents less than age 14 and over 65 years old take up 16.87% and 13.22% of the total population, respectively [26]. The area of Chongqing is 8.23 × 10⁴ km2 and agricultural land in the year is 7.06 × 10⁴ km2. It is the largest municipality and the only municipality that has the ethnic autonomous areas in China. The city has a humid subtropical monsoon climate, with hot summers and cold and humid winters. The area is mountainous, with mountain areas accounting for 75.8% [27], elevation difference of 2723.7 m, and vegetation coverage rate of 20.49% [28]. The study investigated Tujia and Miao ethnic minority rural households in the ethnic autonomous regions and non-national non-ethnic autonomous regions of Chongqing. Among them: Wulong and Qianjiang are non-national autonomous counties that have ethnic autonomous townships, and Xiushan, Youyang and Pengshui are ethnic autonomous counties. Figure 1 shows the location of the study area.
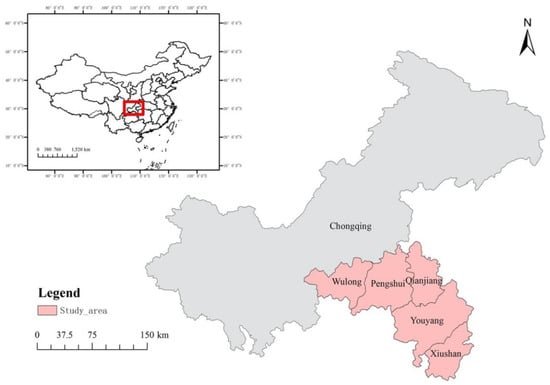
Figure 1.
Location of the study area in Chongqing, China.
2.2. Data Acquisition
Data used in the study were acquired from the questionnaire survey. The stratified sampling method was adopted in selecting questionnaires respondents (head of households). First, all of the four ethnic autonomous counties in Chongqing were chosen as the target survey area. After field investigation, the study excluded Shizhu County, which did not contain enough Miao families for the investigation, and selected Wulong and Qianjiang County as the comparative analysis areas of non-national autonomous counties. Subsequently, four villages in each county, based on altitude and distance to the county center, were selected. Above 20 Tujia and Miao families in each village were randomly investigated.
Based on sustainable livelihood framework, we constructed a household livelihood capital evaluation index system. Then, a questionnaire was designed for the collection of livelihood information of target ethnic minority households. The questionnaire includes the following contents: (i) Household basic information, including ethnic, age, gender and other demographic characteristics. (ii) Household livelihood capitals. Investigated capital information are list as indicators in Table 1. (iii) Types of livelihood strategy and corresponding income of household members. Environmental and cultural outcomes of livelihood were also recorded although not analyzed in this study. The questionnaire survey was conducted during January to March in 2018.

Table 1.
Livelihood capital evaluation index system.
2.3. Data Analysis
2.3.1. Clustering the Household Livelihood Strategies
We first clustered households with their income composition using agglomerative hierarchical clustering methods based on the Bray–Curtis dissimilarity with a flexible linkage of β = −0.25. Bray–Curtis dissimilarity conserves the object space and is commonly used in cluster preprocessing, and a flexible linkage of β = −0.25 has shown good performance in clustering [29]. Prior to clustering, household income data were converted to proportion of income sources to total income. Then, Kruskal–Wallis tests were performed to examine whether there were significant differences among the household groups. The Mann–Whitney U test was adopted as a post-hoc test for pairwise comparison between household groups.
2.3.2. Household Livelihood Capital Evaluation
The evaluation index system was constructed to evaluate household capital (Table 1). Data used in the evaluation process were obtained through questionnaire survey.
The raw data of each indicator were standardized at first. Then the study used the entropy method, which is based on the utility value of the information indicator provides, to determine weight of the indicator. The livelihood capitals of rural household are calculated through weighted average method.
2.3.3. Livelihood Diversity Index
Livelihood diversification refers to the process of rural households’ maintaining survival and improving their living standards by continuously increasing the types of production activities they engage in and expanding their livelihood asset investment [30]. The diversity of rural households’ livelihoods can be calculated through the Shannon Weir Index of the various livelihood income sources of the households. The index is a commonly used diversity index to describe biodiversity in ecosystems in ecology study [31]. This index considers not only the number of livelihood strategy types that household members engaged in, but also the evenness of income from adopted strategy types. The formula is as follows [32]:
where, LDI refers the livelihood diversity index, pi refers the ratio of the ith livelihood income to the total income.
2.3.4. Multiple Logistic Regression
The relationship between rural households’ livelihood capital and livelihood strategy was quantitively explored through the disordered multiple logistic regression method. In this study, part-time agriculture livelihood strategy was defined as the reference level and compared with other levels. Following is the equation:
where refers the probability of household i choosing livelihood strategy j in m strategies; refers the livelihood capitals that influence household livelihood strategy selection; refers the parameters of the model [33].
3. Results
3.1. Livelihood Activity Types and Corresponding Income Distribution of Ethnic Minority Rural Households
A total of 459 valid questionnaires were collected in the study, implying that livelihoods of 459 rural households were recorded. Families in the study area were divided into categories by the livelihood activities household members engage in. Frequency of household members that engaged in corresponding livelihoods was recorded. The results show that the income sources of rural households in the study area include five categories, corresponding to 29 kinds of livelihood activity—1721 person were involved (Table 2). Figure 2 shows the frequency of household members engaged in each type of livelihood activity (Figure 2a) and the sum of income from corresponding livelihood activity is calculated (Figure 2b). The five livelihood activities with the highest sum of income are highlighted with red rectangles in Figure 2. Planting, other part-time jobs, government subsidies, construction workers and breeding are the livelihood activities with the largest number of engaged household members in the region (Figure 2, left). Among them, planting is the livelihood activity with the largest engaged household number in the study area. The number of household members engaged in this livelihood activity was 352, accounting for 20.45% of all people engaged in livelihood activities. However, planting is not the main income source of households in the study area. Although the total income from this livelihood activity ranks third among all livelihood activities, this income only accounts for 5.43% of the total income in the study area. Among the 253 families that engage in planting in the study area, 112 families did not receive income from planting, indicating that many families only plant to meet their own consumption need, not to obtain disposable income. Similar to planting, among the 163 families in the study area who have members engaged in breeding activity, 86 families do not receive income from breeding. The five household livelihood activities with the highest income in the study area are: other part-time jobs, construction worker, planting, factory worker and other fixed salary livelihood types. Among these five livelihood activities, the three highest average incomes come from other fixed salary livelihood types, construction worker and factory worker, which rank sixth, seventh and ninth among the 29 livelihood activities. The average income from other part-time jobs income ranks 12th, and the income from planting ranks 25th. The three livelihoods with the highest average income are from household processing industry, medical staff and other household operating jobs.
Table 2.
Income sources and corresponding livelihood activities of rural households.
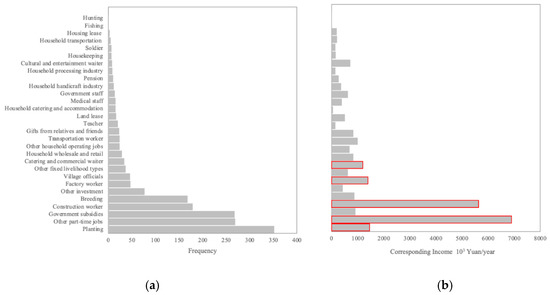
Figure 2.
(a) shows the frequency of ethnic minorities rural household livelihood activities in Chongqing, China; (b) shows the corresponding income of livelihood activities.
3.2. The Livelihood Strategy of Ethnic Minority Rural Households
The study clustered the household income composition data of Chongqing ethnic minority rural households into five groups through agglomerative hierarchical clustering method, indicating five types of livelihood strategy. Subsequently, a statistical analysis, including the non-parametric Kruskal–Wallis test and Mann–Whitney U pairwise test on the income and income composition of household groups were conducted to explore the characteristics of livelihood strategies. Figure 3 shows the income composition comparison of households adopting different livelihood strategies. The results show that there is a significant difference among the income components of households under the confidence interval of 95%. The same letter superscript in Figure 3 indicates that there is no significant difference between household groups adopting different livelihood strategies. The livelihood strategies of the rural households in the study area are clustered into five groups—full-time job, both full-time and part-time job, part-time agriculture, part-time job and subsidized livelihood strategy. The total income of the first group of households (G1) is not significantly different from that of the second (G2), the third (G3) and the fourth group (G4), but is significantly different from the fifth group (G5). However, there are significant differences among the total household income of G2, G3, G4 and G5, indicating that the clustering results distinguish the total household income properly. The characteristic of the G1 household livelihood strategy is that their wage income is significantly different from that of other groups and is much higher. The average total income of this group is relatively high and ranks second among all groups. The G2 households has the highest average total income. The main income of this group comes from wages and part-time jobs, whose incomes rank second among all groups. Incomes from these two livelihood categories are significantly different from other groups. The average incomes from planting, breeding, operating and property of G3 households are the highest among all groups, and its total average income ranks third. The income of each category of G3 is not significantly different from other groups. The part-time job income of G4 households is significantly higher than that of the other groups, and their total average income ranks fourth in the household groups. The G5 households have the lowest average total income. The income of this group is characterized by the highest transfer payments income.
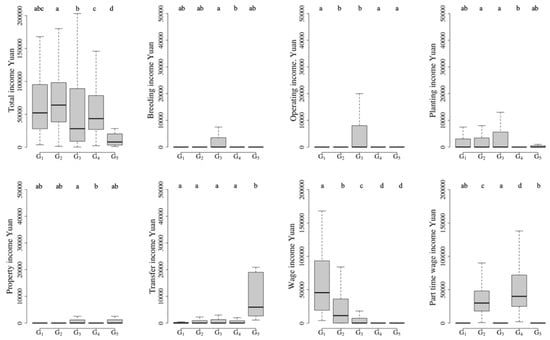
Figure 3.
Boxplots displaying the differences in the income composition among the five family groups. G1 to G5 under the x-axis represent the family groups identified by cluster analysis. The boxes, horizontal lines in the boxes, and whiskers represent the interquartile range, median, and value ranges of the variables, respectively. The lower-case letters above the whiskers are the results of pairwise comparisons, with the same letters indicating no difference at p ≤ 0.05.
The livelihood diversity analysis results show that the livelihood diversity of G2 is the highest (LDI = 0.824); following are G3 (LDI = 0.587), G5 (LDI = 0.379) and G1 (LDI = 0.300), correspondingly. G4 households have the lowest livelihood diversity (0.209). Although in the analysis of livelihood strategies, multiple livelihood incomes of G3 are the highest, its livelihood diversity is lower than that of G2 and ranks second. This could be explained by the high evenness of income composition in G2 households.
3.3. Livelihood Capital of Rural Households with Different Livelihood Strategies
The study normalized each indicator of the rural households’ livelihood capital, and drew the profiles of the livelihood capital indicator in. The left panel of Figure 4 is the spider diagram of livelihood capital indicators, and the right panel of the figure is a livelihood capital pentagon whose weights were calculated through the entropy method. As Figure 4 shows, the livelihood capitals of G1 households are high, with the natural capital, social capital, and financial capital ranks first among all groups, physical capital ranks third and human capital ranks fourth. Combined with the results of the livelihood strategy, it might be deduced that households with abundant livelihood capitals tend to adopt a livelihood strategy of full-time job. The G2 households have the highest human capital, and they tend to adopt the livelihood strategy of both part-time and full-time job. The rank of livelihood capital status of G3 households is medium. Their natural capital and physical capital ranked second, social capital and financial capital ranked third, and human capital ranked fourth. There was little difference in the income compositions of households in this group with that of other groups. The G4 households has the most abundant physical capital, with natural, social, and financial capital being the second to last, and human capital ranking middle (third). The main livelihood strategy of this group is part-time job and its household income level is low (fourth). All of the four capital types of the G5 households are the lowest. Correspondingly, this group has the lowest income and accepts most transfer payment, such as government subsidies and gifts from relatives and friends.
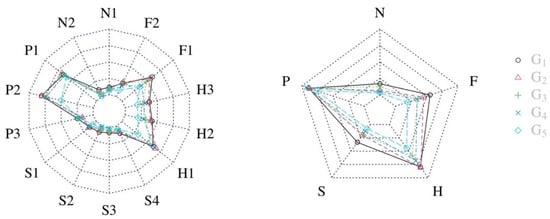
Figure 4.
The distribution of rural livelihood capitals (Left: the spider diagram of livelihood capital indicators; Right: the livelihood capital pentagon); N1—Farmland household owns (mu, here 1 m2=0.0015 mu); N2—Economic forest household owns (mu); P1—House condition; P2—Household durable goods; P3—Productive tools; S1—Communication cost (Yuan/year); S2—Number of cadres/public officials among relatives; S3—Number of participated economic cooperation organizations; S4—Number of migrant workers in relatives; H1—Labor capacity; H2—Education level of members; H3—Professional skills of members; F1—Annual income (Yuan/year); F2—Saving; N—Natural capital; P—Physical capital; S—Social capital; H—Human capital; F—Financial capital.
The results of the Kruskal–Wallis test on livelihood capitals show that there is no significant difference in the physical capital of the household groups adopting different livelihood strategies (the test values H of natural, physical, social, human, and financial capital are: 13.285, 2.485, 17.786, 23.440 and 16.409, respectively. The corresponding p values are 0.010, 0.647, 0.001, <0.001 and 0.003). The Mann–Whitney U test results show that there is no significant difference between capitals of the G1 and G2 households. G3 only differs in human capital from G1 and G2 households (see Table 3). The capitals of G4 are not significantly different from that of G1, but the natural capital and social capital of G4 are significantly different from G2. The main difference between G4 and G3 is in natural capital. The natural capital and physical capital of G5 are not significantly different from the other four groups, but its social capital and financial capital are significantly different from G1 and G2, and its human capital is different from the other four groups.
Table 3.
Mann–Whitney U test of livelihood capitals.
3.4. The Impact of Livelihood Capitals on Livelihood Strategies
As Table 4 shows, poor housing conditions, fewer productive tools, less participation in economic cooperation organizations, more durable goods, more relatives that are cadres, public officials and migrant workers, higher education levels and annual year income are the main reasons that households turn from part-time agriculture to full-time job livelihood strategy. Expect for education level, these factors are also main factors that households turn to both full-time and part-time job livelihood strategy. However, the impact of housing conditions and the number of cadres/public officials among relatives on both full-time and part-time livelihood strategy are opposite to that on full-time job livelihood strategy. Besides, high labor capacity of household members significantly promotes households adopting part-time agriculture livelihood strategies to choose both full-time and part-time livelihood strategies while the larger area of household owned economic forest prevents households from turning to this livelihood. For households adopting the part-time job livelihood strategy, the area of economic forest, housing conditions and productive tools, the number of household cadres/public official relatives, participated economic organizations, education level and annual year income have a negative effect on households adopting part-time agriculture livelihood to choose this livelihood. Household durable goods, labor capacity and professional skills of members, as well as the migrant worker in relatives encourage households to engage in part-time jobs. Better housing conditions, more productive tools, participation of more economic cooperation organizations, higher education levels, professional skill and higher income have a positive effect on households to turn to subsidized livelihood strategy, while area household economic forest, household durables, the number of cadres/public officials among relatives and migrant workers, labor capacity and household deposits inhibit the shift to this livelihood strategy from part-time agricultural livelihood. Physical capital and social capital have the opposite effect on the shift of households to turning to subsidized livelihood strategy and full-time job livelihood. Interestingly, the farmland owned by the household has no effect on the choice of household livelihood strategy, as well as the commonly used social capital indicator: household communication expense.
Table 4.
Impact of rural household livelihood capitals on livelihood strategies.
We also conducted multiple regression of livelihood diversity on livelihood capitals. However, the model is poor fitted, indicating that the impact of livelihood capitals on livelihood diversity is not significant (adjusted R2 < 0.05).
4. Discussion
4.1. Livelihood Characteristics of Ethnic Minorities Rural Households in Chongqing, China
The livelihood activities of the Tujia and Miao rural households in Chongqing show the characteristics of diversification, as well as the characteristics of transition from traditional livelihoods. There are 29 kinds of livelihood activities in the study area. Some rural households keep traditional agricultural production activities (30.33%), such as planting, breeding, hunting and fishing, but more households fully engaged into modern production activities (69.67%). Income from agricultural livelihood activities only accounts for 8.71% of the total income. Agricultural production income is low, and it is unable to support rural households as the main source of income [34]. Large number of rural households engaged in agricultural production activities only to meet the consumption needs of the family, rather than to obtain disposable income (47.61%). Through the analysis of livelihood diversity, it was found that 76.03% of households adopted multiple livelihood methods (LDI > 0), which proves that rural household livelihood strategy in the study area is characterized by livelihood diversification. The diversity of livelihoods is not temporary, but a long-term feature of farmers’ livelihoods [35]. It is commonly adopted by rural households in developing countries to reduce their livelihood vulnerability, ensure food security and reduce the threat of famine and increase income [36]. Ellis summarized the six factors that affect the diversity of livelihoods in developing countries: seasonality, risk, labor markets, credit markets, asset strategies, and coping behavior. She believes that diverse livelihood strategies are useful for managing seasonal, risky and unsound markets [35]. Through multiple regression analysis, livelihood capitals were found to have no significant impact on the livelihood diversity based on the Shannon Weir Index. Study on the influencing factors of livelihood diversity, the impact of livelihood diversity on livelihood strategies and livelihood consequences are required to further reveal characteristics of the rural household livelihoods and supply sustainable livelihood approach study.
4.2. Clustering Results of Livelihood Strategies
In most livelihood research, the livelihood strategy adopted by rural households are grouped by agriculture and non-agriculture. In recent years, there has also been emerging literature using clusters of income composition to distinguish rural households’ livelihood strategies. The different clustering results of livelihood strategies are caused by different livelihood characteristics of the corresponding study area. Liu et al. (2020) grouped the rural households in Inner Mongolia into only breeding small livestock, mainly breeding small livestock, mainly breeding large livestock, only breeding large livestock and non-breeding livestock, and found the factors affecting livelihoods [37]. Using livestock species to classify livelihood strategies of Inner Mongolian rural households well distinguished the characteristics of local households living on livestock. The ecological migration policy in Miyun Reservoir caused a large amount of labor migration. Peng et al. (2017) divided the livelihoods of rural households in the Miyun Reservoir in China into agricultural, local non-agricultural and labor migration based on the clustering method. The livelihood activities of the Tujia and Miao ethnic minorities in this study are characterized by smallholder planting and breeding. In this study, we clustered the livelihood strategies of rural minority households in Chongqing into five groups [33]. Since this livelihood feature of peasant economy is popular in Chinese rural households, the clustering results of livelihood strategies in this study may also be similar to the clustering results of non-ethnic rural households. More research is required to verify this solution.
4.3. Livelihood Capitals and Their Impact on Household Livelihood Choice
Household livelihood capitals are restricted by local external environments and impact household livelihood strategies. In this study, there is no significant difference in the physical capital of households with different livelihood strategies. Buying houses and household appliances after earning money is a common consumption habit of rural households in the study area, as well as other Chinese rural area. Less natural capital is believed to be an important reason for rural households to adopt non-agricultural livelihoods [21]. In this study, there is no significant difference in natural capital among groups except G4. This can be explained by the limited farmland area caused by mountainous terrain in Chongqing. Social capital distinguishes the higher-income G1 and G2 households from the other three groups. Studies have shown that social capital is of great significance for formulating policies to reduce the vulnerability of rural households’ livelihoods [38]. Malherbe et al. analyzed the livelihood strategies of rural coastal communities on Solomon Island, and believed that social capital can reduce the vulnerability of rural coastal communities, and suggested that social capital should be retained when formulating policies for coping with climate change [39]. Ethnic minorities have strong internal social identity and ethnic cohesion. When formulating and implementing policies in ethic area, taking the role of social capital into consideration would facilitate the policy implication. Human capital is significantly different in the G5 households who have the lowest income. There is no significant difference in financial capital between the G3 and G5 households which have lower income, but the financial capital of the G5 households which have the lowest income are significantly different from the other groups. Studies have shown that high financial capital encourages rural households to engage in high-return or capital-intensive production activities. However, the differences in property income among groups is not obvious in the study area. This may be explained by the low financial capital in the study area.
Most livelihood capitals impact the way that households choose their livelihood strategies. Therefore, the reallocation of livelihood capital within households would promote households to turn to different livelihood strategies. As the eco-environment is vulnerable in the study area and part-time agriculture is prone to degrade local ecosystems through firewood, pesticide and fertilizer consumption, shifting from part-time agriculture to other livelihoods, except for subsidized livelihood strategy, would protect the local environment and increase the household income at the same time [40]. Households with subsidized livelihood strategies are constrained by their economic forest area, household durables, the number of cadres/public officials in relatives and migrant workers, labor capacities and savings. Improving these livelihood capitals would help them improve their livelihood status. In this study, the multiple regression method was adopted to explore the impact of livelihood capital on livelihood strategies. However, existing studies have found that there is also an interaction between various capitals [37]. Ignoring the interaction between livelihood capital may lower the credibility of research on the relationship between livelihood capital and livelihood strategy. The relationship between livelihood capitals and strategies needs to be further clarified in future research.
Ethnic minority households in Chongqing live in remote mountainous area, with relatively low economic development level and vulnerable eco-environment. In this relative disadvantage context, launching social and ecological innovation actions supported by government subsidies is another possible approach to improve household livelihood level as well as local eco-environment [6,41]. Community Gardens, for example, were proven to be an effective social-ecological innovation approach to lower temperature, increase cultural cohesion and provide job opportunities at the same time [41].
5. Conclusions
Through the questionnaire survey, the study investigated the livelihood strategy of the ethnic minorities Tujia and Miao in Chongqing, China. The number of livelihood activity types in the study area reached 29. Planting, other part-time jobs, government subsidies, construction working, and breeding are the five livelihood activities with the largest number of household members engaged within them. However, the top five livelihood activities with the highest sum of income are different, which are other part-time work, construction working, planting, factory working and other fixed wage livelihood types, correspondingly. The income from agricultural production is low and unable to support households as the main income source. The livelihood strategies of the rural households in the study area are clustered into five groups, which are full-time job, both full-time and part-time job, part-time agriculture, part-time job and subsidized livelihood strategy. Diversified livelihood strategy is popular in the study area. Except for physical capital, households adopting different livelihood strategies are significantly different in their livelihood capitals. A number of livelihood capitals impact the way that households choose their livelihood strategies, but the livelihood capitals have no significant impact on the livelihood diversity based on the Shannon Weir Index. Shifting from part-time agriculture to other livelihood strategies, except for subsidized livelihood strategy, through the reallocation of livelihood capital within households would protect the local environment and increase the household income at the same time. The clustering results of this study may be similar to the livelihood results of typical Chinese rural households, which requires more research to verify. Future research needs to further explore the relationship between livelihood capital and livelihood strategies considering the interactions between livelihood capital.
Author Contributions
Conceptualization, M.T. and S.M.; formal analysis, S.M.; investigation, S.M., S.Q. and T.L.; writing—original draft preparation, S.M.; writing—review and editing, M.T. All authors have read and agreed to the published version of the manuscript.
Funding
This work was supported by Ministry of Science and Technology of the People’s Republic of China, grant number 2016YFC0502106.
Acknowledgments
We thank Feng Liu for providing invaluable help during the whole investigation; we also thank Shanlin Li, Xinhong Zuo, Jiaxin Lai, Jin Hu, Yong Wang, Linhui Sun, Zhouyu Long, Lanting Li, Qiaoqiao Cao, Can Hou, Shizhu Xiong and Maoxia Wu for help with this investigation.
Conflicts of Interest
The authors declare no conflict of interest.
References
- Zheng, Y. Ethnic livelihood transition and changes in the allocation of resources in China. J. North Minzu Univ. Phil. Soc. Sci. 2015, 1, 23–30. [Google Scholar]
- Yang, S. Chinese Ethnography; The China Minzu University Press: Beijing, China, 2003. [Google Scholar]
- Rui, H. From Tradition to Modernity: On Subsistence Transformation under the Context of Ecosystem Services for Poverty Allievation; Jishou University: Jishou, China, 2018. [Google Scholar]
- Gustafsson, B.; Shi, L. The ethnic minority-majority income gap in rural China during transition. Econ. Dev. Cult. Change 2003, 51, 805–822. [Google Scholar] [CrossRef]
- Gustafsson, B.; Sai, D. Temporary and persistent poverty among ethnic minorities and the majority in rural China. Rev. Income Wealth 2009, 55, 588–606. [Google Scholar] [CrossRef]
- Cattivelli, V.; Rusciano, V. Social innovation and food provisioning during Covid-19: The case of urban–rural initiatives in the Province of Naples. Sustainability 2020, 12, 4444. [Google Scholar] [CrossRef]
- Mao, S.; Qiu, S.; Li, T.; Tang, M.; Deng, H.; Zheng, H. Using characteristic energy to study rural Ethnic Minorities’ household energy consumption and Its impact factors in Chongqing, China. Sustainability 2020, 12, 6898. [Google Scholar] [CrossRef]
- Gatto, A.; Busato, F. Energy vulnerability around the world: The global energy vulnerability index (GEVI). J. Clean. Prod. 2020, 253, 118691. [Google Scholar] [CrossRef]
- Drago, C.; Gatto, A. A robust approach to composite indicators exploiting interval data: The interval-valued global gender gap index (IGGGI). In Proceedings of the IPAZIA Workshop on Gender Issues, Rome, Italy, 2018; pp. 103–114. [Google Scholar]
- Oluwatayo, I.B. Poverty and Income Diversification among Households in Rural Nigeria: A Gender Analysis of Livelihood Patterns, The 2nd Instituto de EstudosSociais e Económicos (IESE) Conference on ‘Dynamics of Poverty and Patterns of Economic Accumulation in Mozambique’; IESE: Maputo, Mozambique, 2009; pp. 22–23. [Google Scholar]
- Simtowe, F.P. Livelihoods diversification and gender in Malawi. Afr. J. Agric. Res. 2010, 5, 204–216. [Google Scholar]
- Morrison, A.; Raju, D.; Sinha, N. Gender Equality, Poverty and Economic Growth; The World Bank: Washington, DC, USA, 2007. [Google Scholar]
- Garikipati, S. The impact of lending to women on household vulnerability and women’s empowerment: Evidence from India. World Dev. 2008, 36, 2620–2642. [Google Scholar] [CrossRef]
- Kabeer, N. Conflicts over credit: Re-evaluating the empowerment potential of loans to women in rural Bangladesh. World Dev. 2001, 29, 63–84. [Google Scholar] [CrossRef]
- Mazibuko, S. Understanding underdevelopment through the sustainable livelihoods approach. Community Dev. 2013, 2. [Google Scholar] [CrossRef]
- Mwenda, J.; Turpin, M.; IEEE. A Comparative Analysis of Approaches to Apply the Sustainable Livelihoods Framework to Do Impact Assessment in ICT4D; IEEE: New York, NY, USA, 2016. [Google Scholar]
- Lindenberg, M. Measuring household livelihood security at the family and community level in the developing world. World Dev. 2002, 30, 301–318. [Google Scholar] [CrossRef]
- DFID. Sustainable livelihoods guidance sheets; Department for International Development: London, UK, 1999. Available online: http://www.livelihoods.org/info/info_guidancesheets.html (accessed on 1 June 2020).
- Sharp, K. Measuring Destitution: Integrating Qualitative And Quantitative Approaches in the Analysis of Survey Data; IDS: Brighton, UK, 2003. [Google Scholar]
- Sujakhu, N.M.; Ranjitkar, S.; He, J.; Schmidt-Vogt, D.; Su, Y.F.; Xu, J.C. Assessing the livelihood vulnerability of rural indigenous households to climate changes in Central Nepal, Himalaya. Sustainability 2019, 11, 2977. [Google Scholar] [CrossRef]
- Yin, K.; Xiao, Y. Impact of farmers’ livelihood capital differences on their livelihood strategies in Three Gorges Reservoir Area. J. Coast. Res. 2020, 258–262. [Google Scholar] [CrossRef]
- Xu, D.; Deng, X.; Guo, S.; Liu, S. Sensitivity of livelihood strategy to livelihood capital: An empirical investigation using nationally representative survey data from rural China. Soc. Indic. Res. 2019, 144, 113–131. [Google Scholar] [CrossRef]
- Paul, S.; Das, T.K.; Pharung, R.; Ray, S.; Mridha, N.; Kalita, N.; Ralte, V.; Borthakur, S.; Burman, R.R.; Tripathi, A.K.; et al. Development of an indicator based composite measure to assess livelihood sustainability of shifting cultivation dependent ethnic minorities in the disadvantageous Northeastern region of India. Ecol. Indic. 2020, 110, 9. [Google Scholar] [CrossRef]
- Shi, K.; Chang, Z.; Chen, Z.; Wu, J.; Yu, B. Identifying and evaluating poverty using multisource remote sensing and point of interest (POI) data: A case study of Chongqing, China. J. Clean. Prod. 2020, 255, 120245. [Google Scholar] [CrossRef]
- Yang, C.; Zeng, W.; Yang, X. Coupling coordination evaluation and sustainable development pattern of geo-ecological environment and urbanization in Chongqing municipality, China. Sustain. Cities Soc. 2020, 61, 102271. [Google Scholar] [CrossRef]
- Yang, H.; Li, T. Chongqing Statistical Book 2018; China Statistics Press: Beijing, China, 2018. [Google Scholar]
- Xiong, W.Q.; Yong, G. Strategies and suggestions to utilize biomass energy in rural areas of Chongqing. Adv. Mat. Res. 2012, 488-489, 975–979. [Google Scholar] [CrossRef]
- Xiao, Y.; Xiao, Q. Identifying key areas of ecosystem services potential to improve ecological management in Chongqing City, southwest China. Environ. Monit. Assess 2018, 190, 258. [Google Scholar] [CrossRef]
- Tornes, E.; Leira, M.; Sabater, S. Is the biological classification of benthic diatom communities concordant with ecotypes? Hydrobiologia 2012, 695, 43–55. [Google Scholar] [CrossRef]
- Niehof, A. The significance of diversification for rural livelihood systems. Food Policy 2004, 29, 321–338. [Google Scholar] [CrossRef]
- Moreno, C.E.; Calderón-Patrón, J.M.; Martín-Regalado, N.; Martínez-Falcón, A.P.; Ortega-Martínez, I.J.; Rios-Díaz, C.L.; Rosas, F. Measuring species diversity in the tropics: A review of methodological approaches and framework for future studies. Biotropica 2018, 50, 929–941. [Google Scholar] [CrossRef]
- Liu, H.; Hao, H.; Hu, X.; Du, L.; Zhang, Z.; Li, Y. Livelihood diversification of farm households and its impact on cultivated land utilization in agro-pastoral ecologically-vulnerable areas in the Northern China. China Geogr. Sci. 2020, 30, 279–293. [Google Scholar] [CrossRef]
- Peng, W.J.; Zheng, H.; Robinson, B.E.; Li, C.; Wang, F.C. Household livelihood strategy choices, impact factors, and environmental consequences in Miyun reservoir watershed, China. Sustainability 2017, 9, 175. [Google Scholar] [CrossRef]
- Hare, D. Rural nonagricultural activities and their impact on the distribution of income: Evidence from farm households in Southern China. China Econ. Rev. 1994, 5, 59–82. [Google Scholar] [CrossRef]
- Ellis, F. The determinants of rural livelihood diversification in developing countries. J. Agric. Econ. 2000, 51, 289–302. [Google Scholar] [CrossRef]
- Sharma, R. Rural livelihood diversity and its impact on livelihood outcome: An empirical investigation from Jammu and Kashmir. Indian Econ. Rev. 2016, 64, 203–217. [Google Scholar] [CrossRef]
- Liu, Y.; Zhang, Q.; Liu, Q.F.; Yan, Y.Z.; Hei, W.X.; Yu, D.Y.; Wu, J.G. Different household livelihood strategies and influencing factors in the Inner Mongolian Grassland. Sustainability 2020, 12, 839. [Google Scholar] [CrossRef]
- Nyairo, R.; Machimura, T.; Matsui, T. A combined analysis of sociological and farm management factors affecting household livelihood vulnerability to climate change in rural Burundi. Sustainability 2020, 12, 4296. [Google Scholar] [CrossRef]
- Malherbe, W.; Sauer, W.; Aswani, S. Social capital reduces vulnerability in rural coastal communities of Solomon Islands. Ocean Coast Manag. 2020, 191, 9. [Google Scholar] [CrossRef]
- Mao, S. Rural Minority Household Livelihoods and its Relationship with Envrionment in Southwest China; Chinese Academy of Sciences: Beijing, China, 2019. [Google Scholar]
- Rusciano, V.; Civero, G.; Scarpato, D. Social and ecological high influential factors in community gardens innovation: An empirical survey in Italy. Sustainability 2020, 12, 4651. [Google Scholar] [CrossRef]
© 2020 by the authors. Licensee MDPI, Basel, Switzerland. This article is an open access article distributed under the terms and conditions of the Creative Commons Attribution (CC BY) license (http://creativecommons.org/licenses/by/4.0/).