Article

Irrigation Influencing Farmers’ Perceptions of Temperature and Precipitation: A Comparative Study of Two Regions of the Tibetan Plateau

1
College of Resources and Environment, Southwest University, Chongqing 400715, China
2
State Cultivation Base of Eco-agriculture for Southwest Mountainous Land, Southwest University, Chongqing 400715, China
3
Fenner School of Environment & Society, Australian National University, Canberra ACT 2601, Australia
*
Author to whom correspondence should be addressed.
Sustainability 2020, 12(19), 8164; https://doi.org/10.3390/su12198164
Submission received: 29 August 2020 / Revised: 23 September 2020 / Accepted: 29 September 2020 / Published: 2 October 2020
(This article belongs to the Section Air, Climate Change and Sustainability)

Abstract

:
Farmers are among the most vulnerable groups that need to adapt to climate change. Correct perception is a prerequisite for farmers to adopt adaptation strategies, which plays a crucial guiding role in the development of adaptation plans and the improvement of the security of livelihoods. This study aimed to compare farmers’ perceptions of temperature and precipitation change with meteorological data in two regions of the Tibetan Plateau, analyzed how irrigation affects farmers’ perceptions. Data were obtained from local meteorological stations and household questionnaires (N = 1005). The study found that, since 1987, the climate warming trend was significant (p < 0.01), and the temperature increase was faster in winter. Precipitation had no significant change trend, but the seasonal variations indicated that the precipitation concentration period moved forward in the Pumqu River Basin and was delayed a month in the Yellow River-Huangshui River valley. The farmers’ perception of temperature change was consistent with meteorological data, but there was an obvious difference in precipitation perception between the two regions. We noticed that irrigation facilities played a mediating role on precipitation perception and farmers having access to irrigation facilities were more likely to perceive increased precipitation. Finally, this study suggested that meteorological data and farmers’ perceptions should be integrated when developing policies, rather than just considering actual climate trends. Simultaneously, while strengthening irrigation investment, the government should also pay attention to publicizing the consequences of climate change and improving farmers’ abilities of risk perception.

1. Introduction

As one of the primary threats to the security of human livelihood, climate change often has a critical impact on agriculture and fisheries through increased insect pests and warming [1,2,3,4], thereby increasing the vulnerability of farmers’ livelihoods and even leading those to fall into a poverty. Adaptation to climate change is one of the current priorities in research on sustainable livelihoods [5]. There is growing evidence that abundant livelihood capital, adequate infrastructure, and strong perceptions were decisive factors for developing countries and the poor to adapt to climate change [6,7]. Perception, as a point of input from the individual, is not only the result of sensory input, but also the product of the complex interaction between the individual and the surrounding environment [8], which then shapes how the individual responses. Therefore, a farmer’s perception of their environment or climate change is critical in how that farmer copes or adapts [9]. Strong perception is the prerequisite for farmers to develop adaptation strategies [10], and farmers’ perceptions of climate change is conducive to the formulation of future adaptation strategies to avoid and mitigate the adverse effects of climate risks [11]. Therefore, it is vital to study the factors that affect farmers’ perceptions to better understand how and why farmers perceive changes in a certain way and adapt to climate change.
Farmers’ perceptions do not always reflect the reality of climate change, and the perceptions may be affected by unstable climate trends or social, economic, and political factors [12]. In the comparison of farmers’ perceptions and measured data, farmers’ perceptions of temperature change have a strong convergence [13,14]. However, farmers’ perceptions of precipitation changes are always unclear or inaccurate [15]. Hitayezu et al. [16] indicated that farmers’ perceptions of precipitation was severely affected by extreme events (e.g., floods, droughts, and storms). Political ideology and public psychological expectations were significant factors affecting farmers’ perceptions in developed countries [17]. Besides, farmers’ characteristics (gender, age, family size, and assets) could also impact perception [18,19,20]. Although the peer reviewed research has explained the factors that influence farmers’ perceptions from different perspectives, apart from a few exceptions [21,22], reports on how infrastructure affects changes in farmers’ perceptions are still lacking in peer reviewed literature.
The Tibetan Plateau is one of the areas of the globe undergoing the most rapid warming due to climate change: one and a half times the global average [23]. In order to actively cope with climate change, in the past two decades, the Chinese government has invested heavily in infrastructure construction to help local farmers withstand climate risks, such as road networks, tap water, and ponds. Meanwhile, as places in the Tibetan Plateau warmed sufficiently to meet crop thermal demands, more arable land was reclaimed through the use of irrigation [24].
Infrastructure such as irrigation, ditches, and tap water, are some of the most important strategies for farmers to cope with climate change and could reduce farmers’ exposure to climate change risks and allow them to withstand extreme weather events. As reported by Wang et al. [25], infrastructure formed a strong safety net and enhanced farmers’ adaptability to climate change on the Tibetan Plateau. While infrastructure has improved farmers’ resilience to climate change, the important role of infrastructure on farmers’ perceptions has been largely overlooked. On the Tibetan Plateau, research into the farmers’ perceptions is scarce, let alone the interaction between infrastructure and farmers’ perceptions of climate change, and whether that infrastructure had an impact or not. Exploring farmers’ perceptions will help to provide useful information for policymakers to develop adaptation strategies. In this study, we interviewed farmers for their perceptions of climate change in two areas of the Tibetan Plateau, and combined this with a meteorological data analysis to answer the following questions: (1) What are the perceptions of local farmers towards climate change and are they consistent with the results observed by the weather station?, and (2) Does irrigation affect farmers’ perceptions of climate change on the Tibetan Plateau?

2. Framework

To explain why people have different perceptions of drought severity under the same climate regime, Taylor et al. [26] originally proposed the drought perception theory (DPT) in the context of drought risk. They confirmed that these four elements of perception affected each individual’s perception of drought in the Ogallala Aquifer Region of the U.S., and their theory was applied successfully elsewhere (cf. [27,28]). Furthermore, Slegers [29] developed the theory that emphasized that environmental effects also had an impact on perception, which could be divided into four categories. Finally, the DPT could be used to analyze the influence of individual characteristics and environmental factors on perception, but there is still a lack of analysis on the feedback effect of adaptive behavior on perception. Therefore, we take the framework by Slegers [29] as a starting point, and simplify and develop the framework to analyze the elements that affect farmers’ perceptions. Specifically, we integrate experience and memory into farmers’ characteristics as they are shaped directly or indirectly by climate events [26]. The expectation of future climate change is the factor that affects farmers’ behavior in the future rather than perception, but we pay more attention to the feedback of existing adaptive behavior to farmers’ perceptions. In addition, previous experiences are an important influence on how someone defines climate change. Therefore, the expectation and the definition are not included in our framework.
The perception of farmers is the result of the interaction of various factors, and the depicting factors that shape farmers’ perceptions of climate change can be integrated into three key elements in this study (Figure 1). The first key element, climate change, as an external environmental risk, has the most direct impact on farmers’ perceptions [30]. Climate change has three subcomponents: Inter-annual change indicates a long-term trend in temperature and precipitation, which would guide farmers to form a stable perception. Seasonal change would affect farmers’ perceptions of the duration and the beginning of the rainy season. Moreover, recent weather patterns and extreme events are more likely to strongly affect farmers’ perceptions as they tend to have better memories of major events [31].
Individual characteristics, as the second key element, play an essential role in affecting farmers’ perceptions of climate change. Individual characteristics are the internal factors that affect farmers’ perceptions. Agricultural experience and indigenous knowledge had positive effects on perception as they can help farmers identify climate change [32], and provide a strong basis for weather forecasts and adaptation strategies in areas where meteorological records are lacking [33]. For instance, farmers can infer the probability of rain the next day from the number of stars at night. Therefore, experienced farmers were more likely to perceive climate change than inexperienced farmers [34,35]. Additionally, the education helps to give agricultural knowledge a mechanistic basis of understanding, so it may also be an important factor influencing farmers’ perceptions [21]. Furthermore, cropland size and household income also affect farmers’ perceptions to climate change and their decisions [13,36].
The third key element is adaptive behavior (Figure 1). There is an interaction between perception and adaptation. Perception is the prerequisite for farmers to adopt adaptive strategies, and adaptation results could also provide feedback on farmers’ perceptions. For instance, incorrect adaptation behaviors could change farmers’ perceptions of similar situations in the future [8]. Adaptive behaviors have two subcomponents: one is at the household level (e.g. labor migration [37], loans [38], and remittance [39]), while the other is at the government level. Some studies have pointed out that government policies play a mediating role on farmers’ perceptions. As reported by Roco et al. [31], farmers with irrigation facilities were not sensitive to precipitation changes. However, Lasco et al. [13] pointed out that farmers with electricity and irrigation were more likely to perceive precipitation changes.

3. Materials and Methods

3.1. Study Area

With an average altitude of 4383 m, the Tibetan Plateau (26~47° N, 73~104° E) is the highest plateau in the world, known as the "roof of the world" (Figure 2a). The area has a population of approximately 11.33 million (in 2015), most of whom are engaged in subsistence agriculture. Due to its unique geographical conditions, complex and changeable terrain, as well as its vulnerable ecological environment, the Tibetan Plateau has become a sensitive area for global climate change, and the vulnerability is aggravated by human activities [24]. Agriculture and animal husbandry are the main sources of livelihood for farmers on the Tibetan Plateau. Irrigation infrastructure is widely distributed in agricultural areas, which helps to stabilize food production in the region. Considering the high sensitivity of agriculture to precipitation and temperature, two agricultural areas were selected as the main study areas in this study (Figure 2b,c).
The Yellow River-Huangshui River valley (YHV) is located in the mid-high mountainous areas above 2700 m (Figure 2b). The Yellow River and the Huangshui River flow through the area from west to east. The surveyed area involves Menyuan County, Huangzhong County, Huangyuan County and Ping’an District, with an area of 11,900 km2. This area has an average altitude of 3112 m. The average annual temperature is 4.4 °C and the annual precipitation is 460 mm. This region is the main grain-producing area of Qinghai Province, and cropland is mainly distributed along the Yellow River and the Huangshui River. Cropland is expanding in a wave pattern (Figure 2d), with the expansion direction shifting from low altitude to high altitude [24]. Overall, in the past 20 years, cropland has expanded by 18,800 ha, with an average annual growth rate of 0.72%. However, the irrigated cropland has shown a continuing trend of decline. From 1995 to 2015, irrigated cropland in the YHV decreased by 4617 ha, with an average annual decrease rate of 0.69%.
The Pumqu River Basin (PRB) is located in the Southern Tibetan Plateau with an average altitude of 5009 m (Figure 2c). The Pumqu River is one of the outflow rivers in the Tibet Autonomous Region, with a basin area of 25,300 km2. The basin has a typical high-altitude mountainous terrain with different temperature and precipitation patterns from other regions. The annual mean temperature is 3.8 °C, and the annual precipitation is 460 mm, of which more than 80% is concentrated in June to October and is abundant at night. In the PRB, cropland, mainly distributed in valleys, has shown a significant expansion trend in the past 25 years (Figure 2e) (Statistics Bureau of Tibet Autonomous Region, 2015). Croplands have increased by 17.65 km2, with an average annual growth rate of 1.21% in the PRB from 1995 to 2015. Irrigation facilities in the PRB have developed rapidly since 1995, with a marked expansion of irrigated cropland along the Pumqu River. The irrigated cropland in the PRB increased from 46.30 km2 to 89.86 km2 from 1995 to 2015, with an average annual growth rate of 4.70%.

3.2. Data Collection and Methodology

3.2.1. Climate Data and Analysis

Our focus is on temperature and precipitation as the main climatic factors. Agricultural production is more sensitive to gross precipitation than average precipitation, and mean temperature is usually used to reflect temperature changes [40]. Therefore, we used the total annual precipitation to characterize the changing trend of precipitation. Simultaneously, we analyzed the changing trend of annual mean temperatures (Tmean), minimum temperatures (Tmin), and maximum temperatures (Tmax) in the region. In total, 6 meteorological stations were selected in the study area (Table 1), and the daily dataset of China’s surface climate data from 1987 to 2017 was downloaded from the National Meteorological Information Center [41]. To determine the historical climate change trends, we used Origin software (v.2018C; Northampton, Massachusetts, USA; 2017) to conduct a simple linear regression on the climate data of the two regions.

3.2.2. Survey Method

From July to August 2017 and from July to September 2018, we adopted the stratified random sampling method to collect data on farmers’ perceptions of changes in precipitation and temperature. The selection principle of the sample counties was that they must be located in the agro-pastoral zone, with meteorological stations and a long time series of data. Therefore, we selected 2 counties in the PRB and 4 counties in the YHV. Secondly, with the cooperation of the local agricultural bureau, we selected 3 townships from each county. Furthermore, considering the small and relatively dispersed population in the PRB, we selected 3–5 villages from each township and randomly interviewed 10–15 households from each village. Simultaneously, we selected 2 villages from each township in the YHV and selected randomly 15–20 households from each village for interviews.
Before the formal investigation, we conducted a 7 day presurvey in Tingri County. According to the feedback results, we discussed and modified the questionnaire. Simultaneously, to solve language barriers, we hired 4 Tibetan students from Tibet University as interview interpreters and trained them properly. In order to grasp the general characteristics of each village, open-ended questions were used to interview representatives of each village. Respondents were mainly village officials and elderly farmers with knowledge of local conditions, mainly involving infrastructure construction, water supply and disaster situations (e.g., the time of last drought or flood in the village and the number of people affected). Additionally, in order to grasp the specific information of the farmers, we used a semistructured interview to conduct the questionnaire surveys. Respondents were mainly householders and their spouses. The questionnaire included questions about household characteristics, farmers’ perceptions of changes in precipitation and temperature, irrigated cropland areas, types of irrigation, and the causes of land reclamation. Moreover, we used handheld GPS devices to locate the farmers’ houses, and to obtain the longitude, latitude, and altitude information. On average, the interview time lasted 1.5 h for each household. A total of 1005 valid questionnaires were collected in this survey, including 505 in the PRB and 500 in the YHV.

3.2.3. Selection of Variables

We did not quantitatively analyze the factors that affect the change in farmers’ perceptions on the temperature because there is a high degree of consistency between farmers’ perceptions on the temperature and meteorological data, which we explore in the Discussion. We quantitatively evaluated the factors that affect farmers’ perceptions of precipitation change, and explanatory variables were selected according to the theoretical framework (Figure 1) and previous studies. Finally, the independent variables are shown in Table 2. Furthermore, we used the Stata software to process the obtained questionnaire data of farmers. A Chi-square test (χ2) was used to test the correlation between the explanatory variables and farmers’ perceptions. A gamma coefficient was used to determine the strength of the correlation between continuous variables (e.g., age, education level, household size, cropland area) and farmers’ perceptions, and Cramer’s V was used to test the strength of the correlation between categorical variables (e.g., types of irrigation, source of potable water) and farmers’ perceptions.

4. Results

4.1. Farmer Characteristics

The characteristics of households in the two regions are shown in Table 3. The age of farmers was related to time spent engaging in farming and pastoral activities and experiencing climate change. In the two regions, the majority of householders were between 41 and 60 years old (64.80% in the YHV and 54.06% in the PRB), with little significant difference in the age structure of farmers in these two regions. Despite the education level of farmers in both study areas being very low, compared with householders in the YHV (where the illiteracy rate was 43.20%), the illiteracy rate of householders in the PRB was higher (62.38%). In the YHV, households with more than four members accounted for 68.6% of the total, compared with 88.72% in the PRB. In general, the average area of cropland owned by farmers in the two areas was quite different. In the YHV, each household had an average of 0.30 ha of cropland. In contrast, 62.57% of the PRB households had more than 0.67 ha with the average household having 0.99 ha.
Participation in community organizations could reflect the ability of information exchange among farmers and can improve their perception of climate change. Although the participation rate of community organizations in both areas was less than 50%, there were considerable differences between the two regions, with a value of 35.20% in the YHV and 48.91% in the PRB, respectively.

4.2. Change Tends of Temperature and Precipitation

Figure 3 illustrates the inter-annual change trends for the climatic variables for the two regions in which each data point corresponds to a year. Results showed that the Tmean in both regions had a significant (p < 0.01) increase in trends since 1987, which was consistent with the global warming trend, and the temperature rises in the YHV (0.62 °C/decade) were faster than that in the PRB (0.41 °C/decade). In addition to the Tmean, the Tmax and Tmin in the two regions had also shown a significant upward trend, but they were asymmetrical because the increase of Tmin was more evident than Tmax in the same period. In the YHV, the increasing trend of Tmax was 0.56 °C/decade (p < 0.01) while the trend of Tmin was 0.77 °C/decade (p < 0.01) in 1987–2017. In the PRB, the increasing trend of Tmax was 0.44 °C/decade (p < 0.01), while the trend of Tmin was 0.47 °C/decade (p < 0.01) in 1987–2017. Annual precipitation has decreased in both regions over the past 30 years, although the decrease trends were insignificant (p > 0.1) for both the YHV (−5.7 mm/decade) and the PRB (−11.3 mm/decade). The slope indicates that the annual precipitation decline rate of the PRB is double that of the YHV.
Climate data from two different periods were used to analyze seasonal change trends in monthly average precipitation and temperatures (Figure 4). In the YHV, an early start of the summer season could be interpreted as a significant increase in temperatures from June to August (Figure 4a). However, the beginning of the rainfall season did not shift, although precipitation decreased in June and July, and increased in August and September (Figure 4a). In the PRB, the summer Tmean increased in the two periods that are not visible, but the winter warming was apparent. Compared with the past, the earlier arrival of the high-intensity precipitation in 2003–2017 could be explained by the fact that precipitation increased in July and then decreased in August (Figure 4b).

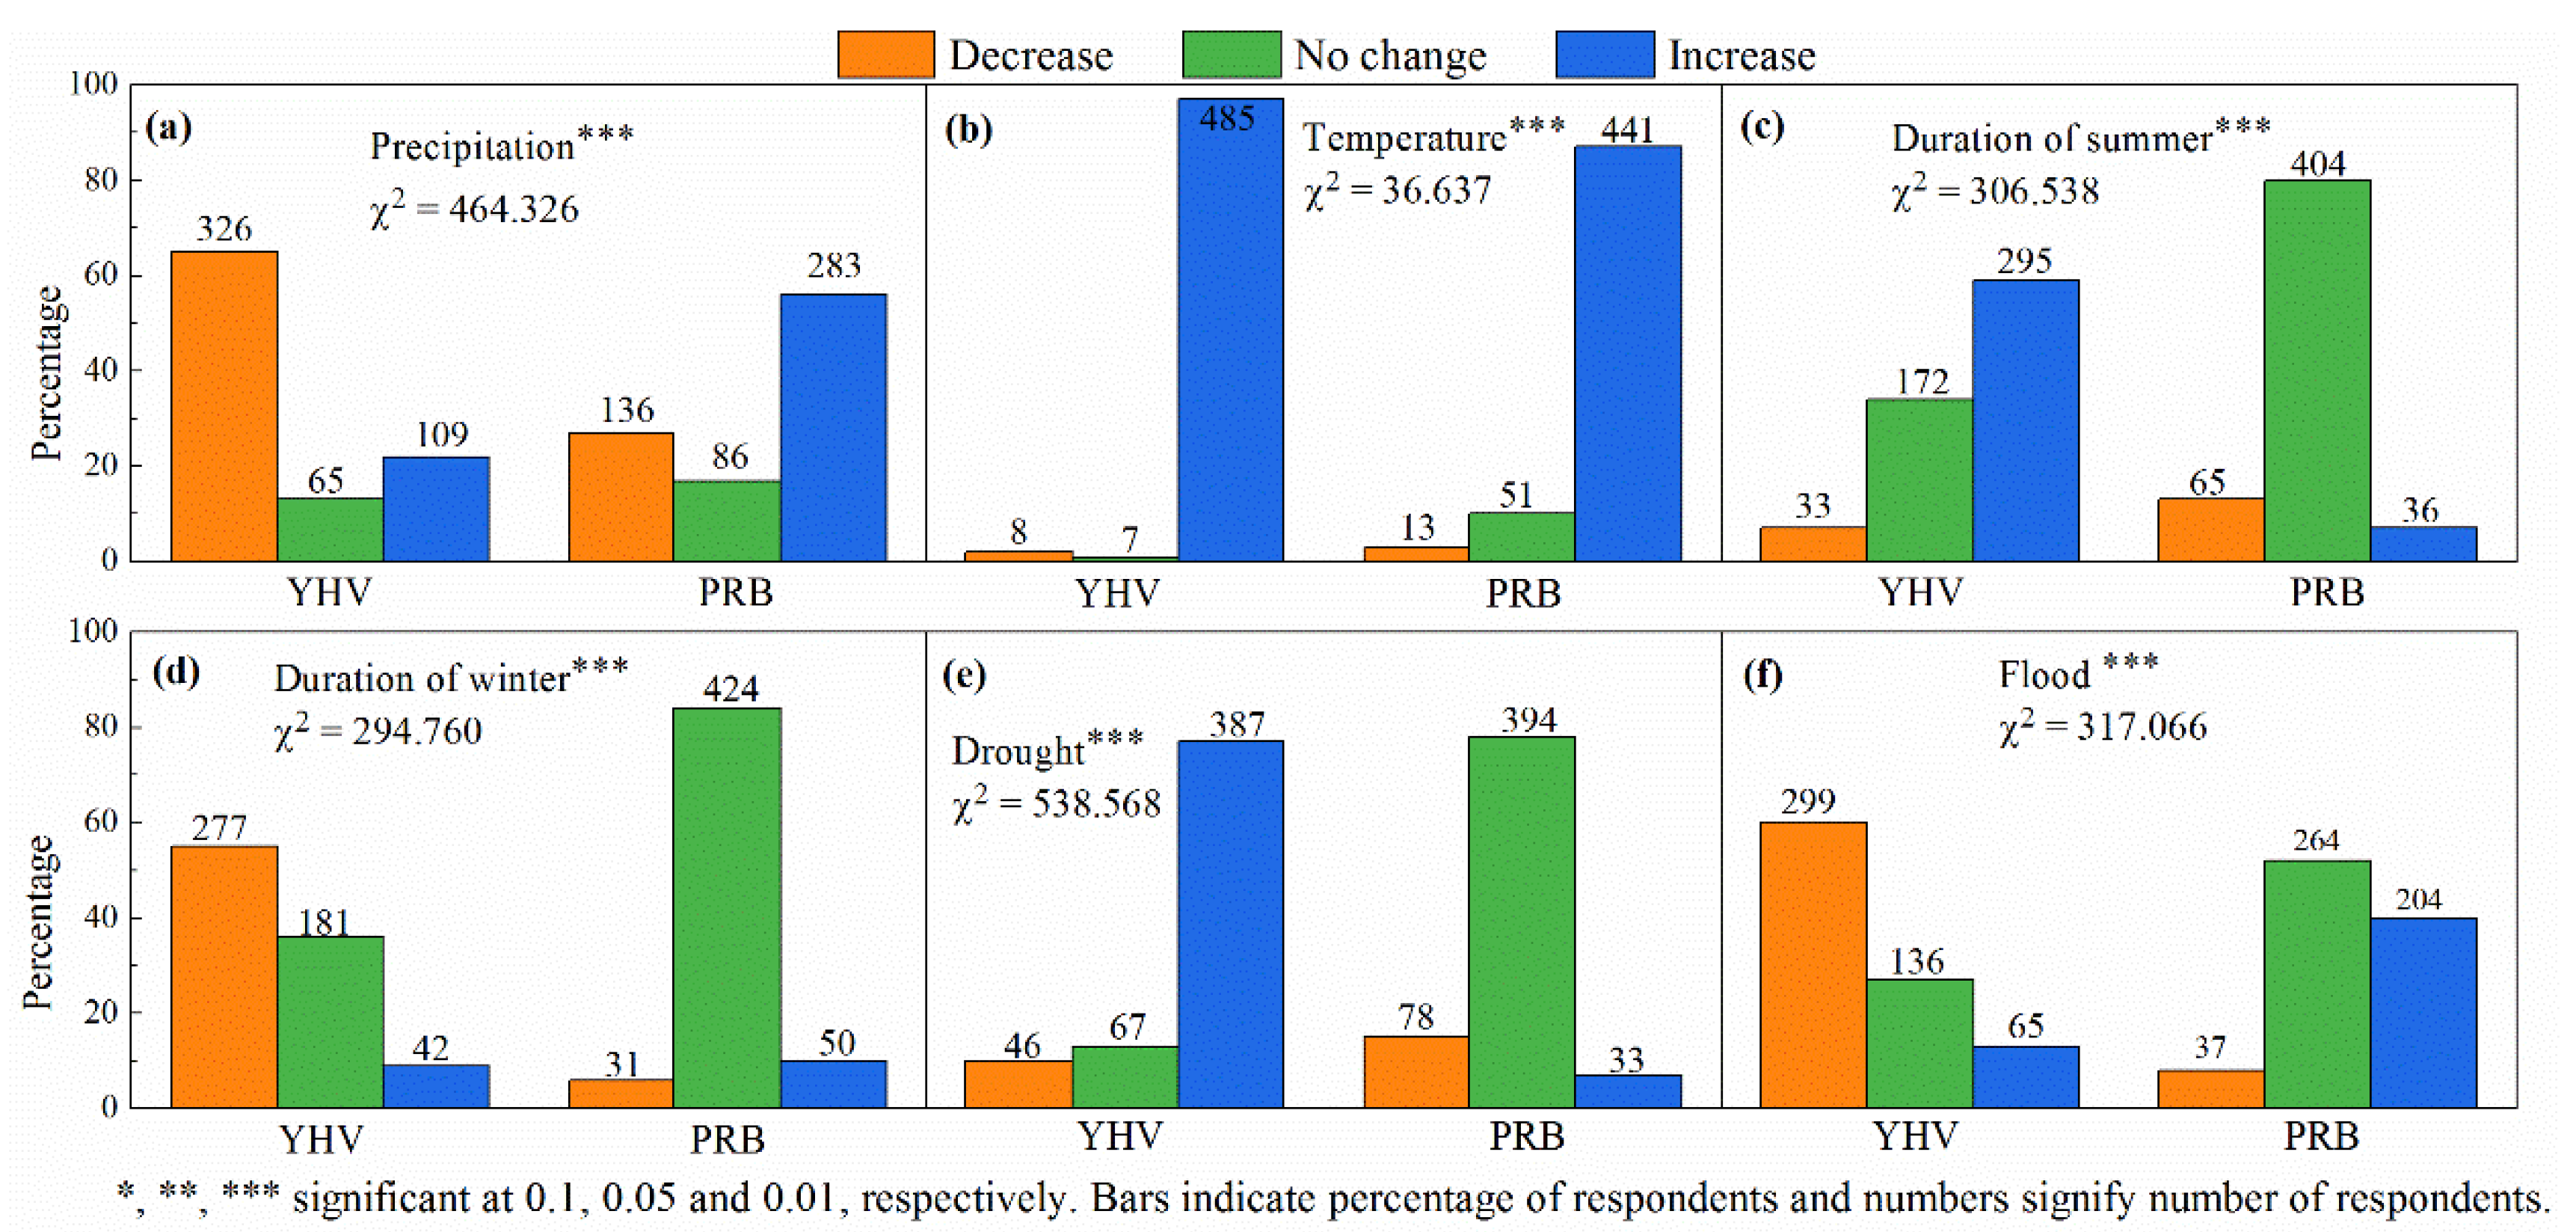
4.3. Farmers’ Perceptionss of Temperature and Precipitation

For farmers in plateau areas whose livelihoods mainly rely on agriculture and animal husbandry, precipitation and temperature are the main climatic factors affecting their livelihoods. Thus, farmers in these areas will be more aware of changes in temperature and precipitation. Information was collected through their recollection of increases or decreases in temperature and precipitation over the past 10 years. The results showed that there was a significant (p < 0.01) difference in the composition of farmers’ perceptions of climate change in the two regions (Figure 5).
Most farmers in both regions were aware of rising temperatures over the past 10 years (97% in the YHV and 87% in the PRB, Figure 5b). Interviewees explained that they now use electric fans in the summer that were not used in the past, and the inter-annual temperature change trends of both regions provided evidence to support the perception (Figure 3). Farmers’ perceptions of precipitation had a contrary view in both areas (Figure 5a). In the YHV, 65% of farmers perceived a decrease in precipitation, which was consistent with the meteorological data. In contrast, and surprisingly, over half of those surveyed reported that there has been an increase in precipitation in the PRB, which did not match the meteorological data. In terms of seasonal perception, farmers in the YHV perceived a prolonged summer (59%, Figure 5c) and shorter winter seasons (55%, Figure 5d), which may be associated with a significant increase in temperatures between June and August (Figure 4). However, more than 80% of farmers in the PRB did not perceive seasonal changes, which could be explained by the absence of a significant increase in monthly mean temperature (Figure 4).
Since drought or flood disasters could directly affect agricultural production, we considered farmers’ perceptions of these two natural disasters in this study in extreme climate events. Farmers in these two regions had almost opposite views of the perception of drought (Figure 5e). In the PRB, 78% of farmers believed that the frequency of drought has not changed, while 40% and 52% of farmers perceived increased and unchanged floods, respectively. However, in the YHV, 77% of farmers perceived an increase in drought and 60% of them perceived a decrease in floods (Figure 5f).
Local farmers reported that climate change has affected their livelihoods. According to the survey, farmers in both regions claimed rising temperatures could help diversify crops, increase crop yields, and reduce the risk of livestock death in winter. Farmers in the PRB also indicated that the early arrival of the rainy season was conducive to the improvement of pasture quality, while more farmers in the YHV reclaimed cropland in higher elevations to realize the vertical migration of planting zone. However, some farmers also pointed out that higher temperatures have increased the breeding capacity of rodents and pests, which increased pest damage to crops and the farmers’ investment in pesticides. Meanwhile, in the YHV, some farmers realized that the unstable precipitation had affected the planting period of barley, potatoes, and rape, and the frequent heavy wind increased the rate of crop lodging. Compared with the past, more than 80% of the farmers have brought forward the planting dates by 8–15 days to match evolving growing seasons.

4.4. Factors Influencing Farmers’ Perceptions of Precipitation Change

The results of the Chi-square test and gamma (Cramer’s V) test are shown in Table 4. Farmers’ perceptions of precipitation change was not related to the age of householders and the amount of household agricultural facilities, but was significantly (p < 0.01) correlated with geographical location, irrigated cropland area, irrigation types in both regions and source of potable water. Additionally, there was a significant (p < 0.01) correlation between farmers’ perceptions of precipitation change and the extent of the education of householders in the YHV. In the PRB, the participation rate of community organizations (p < 0.01), rights to access wells (p < 0.1), and household size (p < 0.01) were significantly correlated with farmers’ perceptions of precipitation change.

5. Discussion

5.1. Climate Change and Farmers’ Perceptions

During the study period, the change of temperature and precipitation were evident in the two regions from 1987 to 2017. The Tmean in both regions showed a significant increasing trend, and when compared with Tmax, the rising trend of Tmin was more prominent. Although some other studies of the Tibetan Plateau region have found different rates and even patterns of change [24,42,43], our study results were consistent with most studies in regard to the patterns and the rates of change. It was found that precipitation on the Tibetan Plateau had been decreasing over the past few decades, and the regional climate had changed to a “warm-dry” type [42]. However, some recent studies have shown that precipitation on the Tibetan Plateau was increasing and regional differences were distinct [24]. Overall, despite the fact that the precipitation trend was uncertain, the great majority of studies have indicated that precipitation would be unstable and unpredictable in the future [23].
The study found that climate change trends dominated the overall characteristics of farmers’ perceptions of climate change. The continuous and significant warming trend has determined that more than 80% of the farmers in the two regions have perceived the increase in temperature, while rainy nights and unstable precipitation trends increased the difficulty of the farmer to accurately perceive the precipitation change, which led to farmers having an inaccurate perception of precipitation and great differences within both regions. Wang et al. [44] observed that when changes in a climate variable over the last several decades is small and there are extremes in that variable over the same period, most farmers were unable to discern the change. Meanwhile, we found that floods could enhance farmers’ perceptions of an increase in precipitation, and droughts could make farmers more clearly perceive a decrease in precipitation.
Interestingly, although most farmers in both regions (87% in the PRB and 97% in the YHV) perceived an increase in temperature and consistent with observations data, there still existed 10% of farmers in the PRB who perceived a decrease in temperature. These farmers’ perceptions could be consistent with actual changes in local temperatures, as the PRB had large-scale irrigation facilities, which could promote local evaporation when providing water for crop growth, resulting in a decrease in local temperatures. Some studies have shown that in large-scale irrigation areas, the impact of irrigation on local temperature was about a 1–2 °C decrease [45]. The results of this study also indicated that the increase in temperature in summer was slower than that in winter in the PRB (detailed in Section 3.2), which could be the result of large-scale irrigation in summer in this area.

5.2. Irrigation and Farmers’ Perceptions

Farmers’ perceptions of precipitation change were significantly (p < 0.01) correlated with the irrigated cropland area owned by farmers. Although most farmers perceived a general trend of a decrease in precipitation in the YHV, farmers with more irrigated cropland were more likely to perceive an increase in precipitation (Table 4). This might be because when farmers adopted crop diversification, they might plant some precipitation-sensitive crops (e.g., rapes and potatoes), which needed sufficient water during the growing season. In drought years, farmers with less irrigated cropland could not obtain adequate water resources, leading such farmers to be more likely to perceive a decrease in precipitation. While farmers with more irrigated cropland could reduce the impacts of drought on crop growth through irrigation, and sufficient irrigation water sources caused them to perceive an increase in precipitation.
Farmers with different irrigation types also had significant (p < 0.01) differences in perception of precipitation (Table 4). Farmers with mixed irrigation and ditch irrigation were more likely to perceive an increase in precipitation than those who relied on rainfall irrigation. For instance, rain-fed farmers were more vulnerable to drought, while farmers with irrigation facilities could adjust the amount of field water by connecting external water sources (e.g., cisterns and rivers) through ditches. As a result, irrigation types reflected the extent of the farmers’ dependence on precipitation, and farmers who relied more on precipitation were more likely to perceive a decrease in precipitation.
Additionally, daily water sources could affect the farmers’ perceptions of precipitation change, as farmers could take water level in wells as an indicator of whether water resources were sufficient, which was also an intuitive basis for perceiving precipitation changes. However, the results showed that the family’s ownership of wells had no significant correlation with the perception of YHV farmers, possibly because well water was not the primary way for farmers to obtain water resources, because 77% of the farmers in the YHV had begun to use tap water, which weakened their perception of precipitation change. While in the PRB, households who used tap water, well water, and stream and lake water accounted for 45%, 35%, and 20%, respectively. Tap water could solve the water access problem for farmers, leading farmers who use tap water to perceive an increase in precipitation more clearly than others.
The local water supply was an important factor affecting farmers’ perceptions of climate change. Even in the absence of rainfall, adequate water resources and an effective transport capacity could affect the farmers’ understanding of water supply and their perception of annual precipitation. Previous studies in other regions around the globe note that irrigation could affect farmers’ perceptions [13,31]. Even with adequate rainfall, less available irrigation water during the dry period could cause farmers to be more sensitive to climate change [46], and farmers with more irrigated farmland are more likely to perceive an increase in annual rainfall [22]. Roco et al. [31] also found that rice farmers became insensitive to reduced precipitation after irrigation facilities were added. Meanwhile, we noticed that although irrigation infrastructures provide sufficient water resources to croplands, it might have adverse feedback effects on the farmers’ perceptions, which probably leads farmers to perceive an increase in precipitation.

5.3. Policy Implications

Overall, although climate factors determine the overall characteristics of individual perceptions in our study, the impact of nonclimatic factors on farmers’ perceptions was more noticeable when climate change showed an insignificant trend (e.g., precipitation). In this case, farmers’ perceptions depended on the scarcity of resources. For example, in the PRB, although the actual precipitation demonstrated a decreasing trend, farmers were perceiving increased precipitation due to positive adaptation strategies (e.g., irrigation infrastructure and tap water). We recognize that irrigation was essential to improving the livelihoods of farmers and enhancing the resilience of farmers, but it should be noted that irrigation has a negative feedback effect on farmers’ perceptions. In order to enhance the farmers’ perceptions, we put forward a series of policy suggestions according to the results of this study.
Firstly, we suggest that while strengthening irrigation investment, the government should also pay attention to publicizing the consequences of climate change and improving farmers’ abilities of risk perception. This is because water resources used for irrigation are also threatened by climate change, especially under certain extremes or if the patterns of increasing temperature continue that there may be times when there is inadequate water for irrigation. Meanwhile, it is more useful for the government to provide real time weather forecasts to farmers than to correct their perception, especially extreme weather and pattern change, which helps farmers understand what opportunities and challenges that these changes might provide. Secondly, joining community organizations is also one of the key factors affecting climate change perception, as it increases the likelihood of information exchange and experience sharing. Therefore, establishing a platform for information exchange might be important for accessing reliable and available climate change information. Additionally, it is not enough to use the results of meteorological data alone as the basis for developing adaptation strategies due to the result of perception being more important than meteorological data for farmers. Therefore, we recommend that governments should integrate the results of individual perception with actual climate trends when developing policies, rather than just considering actual climate trends.

5.4. Limitations

We explained the factors that affect farmers’ perceptions from both a climate and nonclimate aspect, but this study also has the following limitations. Firstly, although peer reviewed research finds that, in some areas, the media affects farmers’ perceptions of precipitation and temperature change [47], this study does not discuss the influence of the media on farmers’ perceptions. This is because the use of media in the border areas of Tibet is not as common as in other regions, and farmers’ and herders’ perceptions of climate change still depend on traditional experience. Secondly, the gender of the householder was not considered in our study. This is because, influenced by traditional attitudes, men tend to have higher family status than women on the Tibetan Plateau, so that the proportion of the male householder was more than 90%.

6. Conclusions

We provided an analytical framework of farmers’ perceptions of climate change, and used long-term (1987–2017) data from meteorological stations to analyze the inter-annual and seasonal change trends of temperature and precipitation in two typical agricultural areas of Tibetan Plateau. The 1005 valid questionnaires were used to analyze farmers’ perceptions of temperature and precipitation change. We explored the relationship between the perception of climate change and actual trends, and how the presence or absence of irrigation affected the farmers’ perceptions of the climatic trends.
From the historical climate data analysis, the inter-annual variation of temperature shows a significant increasing trend, but there are differences in seasonal variation in the two regions, especially as summer is longer in the YHV and the warm winter is more obvious in the PRB. There was a high degree of consistency between farmers’ perceptions of the inter-annual temperature change and meteorological trends in the two regions, but only some farmers perceived the seasonal change of temperature in the YHV. Concerning the precipitation trend, there was a decrease in annual precipitation, but there was no obvious change in the beginning and end of the rainy season in both regions. More farmers believed that the precipitation in the PRB area is increasing, although the slope of the actual precipitation decline is twice that of YHV. Therefore, farmers have changed the cropping calendar and structure of local farming based on the results of their perception.
We found obvious evidence that farmers can perceive significant climate change trends (i.e., temperature), but it is difficult for them to perceive less obvious climate change trends (i.e., precipitation), especially when there are external disturbances (e.g., infrastructure and policy). Irrigation is an important factor that affects farmers’ perceptions of annual precipitation changes, which may cause farmers to form the perception of an increase in annual precipitation, although the actual precipitation demonstrated a decreasing trend. However, irrigation may reduce farmers’ perceptions of the risks of climate change because water resources used for irrigation are also threatened by climate change.
Finally, irrigation, as an external factor, has produced an impact on farmers’ perceptions, and we suggest that future research should examine the relationship between other external factors and perception rather than just individual characteristics. Additionally, averages, extreme weather, and patterns are important components of climate change, and pattern shifts (e.g., less spring rain, more late summer rain) and extreme weather may be more important for crop growth during one stage. We suggest that future research should focus not only on farmers’ perceptions of the average value, but also on the perception of extreme weather and patterns shifts.

Author Contributions

Conceptualization, J.Y. and T.W.; methodology, T.W. and Y.Y.; software, T.W.; validation, X.C. and Y.Y.; formal analysis, T.W.; investigation, J.Y. and T.W.; resources, X.C. and J.Y.; writing—original draft preparation, T.W. and Y.Y.; writing—review and editing, X.C. and J.Y.; supervision, J.Y.; project administration, X.C. and J.Y.; funding acquisition, X.C. and J.Y. All authors have read and agreed to the published version of the manuscript.

Funding

This research work and APC was funded by the National Natural Science Foundation of China, grant number 41571093, 41761144081; the Strategic Priority Research Program of Chinese Academy of Sciences, grant number XDA20040201; and the Fundamental Research Funds for the Central Universities, grant number SWU119037.

Acknowledgments

We thank the local agricultural bureau for their help during the field work. We thank the farmers and other respondents for their patient answers to our questions and for providing sufficient information.

Conflicts of Interest

The authors declare no conflict of interest.

References

  1. Abou Chakra, M.; Bumann, S.; Schenk, H.; Oschlies, A.; Traulsen, A. Immediate Action is the Best Strategy When Facing Uncertain Climate Change. Nat. Commun. 2018, 9. [Google Scholar] [CrossRef] [PubMed]
  2. Li, C.; Yan, J.; Hua, X.; Zhang, Y. Review on the Sensitivity of Farmers Livelihoods to Climate Change. Progress. Inquis. Mutat. Clim. 2019, 15, 290–300. [Google Scholar] [CrossRef]
  3. Deutsch, C.A.; Tewksbury, J.J.; Tigchelaar, M.; Battisti, D.S.; Merrill, S.C.; Huey, R.B.; Naylor, R.L. Increase in Crop Losses to Insect Pests in a Warming Climate. Science 2018, 361, 916–919. [Google Scholar] [CrossRef] [PubMed] [Green Version]
  4. Battisti, D.S.; Naylor, R.L. Historical Warnings of Future Food Insecurity with Unprecedented Seasonal Heat. Science 2009, 323, 240–244. [Google Scholar] [CrossRef] [PubMed] [Green Version]
  5. Khan, M.R.; Roberts, J.T. Adaptation and International Climate Policy. Wires Clim. Chang. 2013, 4, 171–189. [Google Scholar] [CrossRef]
  6. Jones, H.P.; Hole, D.G.; Zavaleta, E.S. Harnessing Nature to Help People Adapt to Climate Change. Nat. Clim. Chang. 2012, 2, 504–509. [Google Scholar] [CrossRef]
  7. Sujakhu, N.M.; Ranjitkar, S.; He, J.; Schmidt-Vogt, D.; Su, Y.F.; Xu, J.C. Assessing the Livelihood Vulnerability of Rural Indigenous Households to Climate Changes in Central Nepal, Himalaya. Sustainability 2019, 11, 2977. [Google Scholar] [CrossRef] [Green Version]
  8. Beyerl, K.; Putz, O.; Breckwoldt, A. The Role of Perceptions for Community-Based Marine Resource Management. Front. Mar. Sci. 2016, 3. [Google Scholar] [CrossRef] [Green Version]
  9. Schluter, M.; Baeza, A.; Dressler, G.; Frank, K.; Groeneveld, J.; Jager, W.; Janssen, M.A.; McAllister, R.R.J.; Muller, B.; Orach, K.; et al. A Framework for Mapping and Comparing Behavioural Theories in Models of Social-ecological Systems. Ecol. Econ. 2017, 131, 21–35. [Google Scholar] [CrossRef]
  10. Hasan, M.K.; Kumar, L. Comparison Between Meteorological Data and Farmer Perceptions of Climate Change and Vulnerability in Relation to Adaptation. J. Environ. Manag. 2019, 237, 54–62. [Google Scholar] [CrossRef]
  11. Gentle, P.; Maraseni, T.N. Climate Change, Poverty and Livelihoods: Adaptation Practices By Rural Mountain Communities in Nepal. Environ. Sci. Policy 2012, 21, 24–34. [Google Scholar] [CrossRef]
  12. Panda, A. Exploring Climate Change Perceptions, Rainfall Trends and Perceived Barriers to Adaptation in a Drought Affected Region in India. Nat. Hazards 2016, 84, 777–796. [Google Scholar] [CrossRef]
  13. Lasco, R.D.; Espaldon, M.L.O.; Habito, C.M.D. Smallholder Farmers’ Perceptions of Climate Change and the Roles of Trees and Agroforestry in Climate Risk Adaptation: Evidence from Bohol, Philippines. Agrofor. Syst. 2015, 90, 521–540. [Google Scholar] [CrossRef]
  14. Mkonda, M.Y.; He, X.; Festin, E.S. Comparing Smallholder Farmers’ Perception of Climate Change with Meteorological Data: Experience from Seven Agroecological Zones of Tanzania. Weather Clim. Soc. 2018, 10, 435–452. [Google Scholar] [CrossRef] [Green Version]
  15. Muthuwatta, L.; Perera, H.P.T.W.; Eriyagama, N.; Upamali Surangika, K.B.N.; Premachandra, W.W. Trend and Variability of Rainfall in Two River Basins in Sri Lanka: An Analysis of Meteorological Data and Farmers’ Perceptions. Water Int. 2017, 42, 981–999. [Google Scholar] [CrossRef]
  16. Hitayezu, P.; Wale, E.; Ortmann, G. Assessing Farmers’ Perceptions about Climate Change: A double-hurdle Approach. Clim. Risk Manag. 2017, 17, 123–138. [Google Scholar] [CrossRef]
  17. Liu, Z.; Smith, W.J.; Safi, A.S. Rancher and Farmer Perceptions of Climate Change in Nevada, USA. Clim. Chang. 2013, 122, 313–327. [Google Scholar] [CrossRef]
  18. Mekonnen, Z.; Kassa, H.; Woldeamanuel, T.; Asfaw, Z. Analysis of Observed and Perceived Climate Change and Variability in Arsi Negele District, Ethiopia. Environ. Dev. Sustain. 2018, 20, 1191–1212. [Google Scholar] [CrossRef]
  19. Mulenga, B.P.; Wineman, A.; Sitko, N.J. Climate Trends and Farmers’ Perceptions of Climate Change in Zambia. Environ. Manag. 2017, 59, 291–306. [Google Scholar] [CrossRef]
  20. Ayanlade, A.; Radeny, M.; Morton, J.F. Comparing Smallholder Farmers’ Perception of Climate Change with Meteorological Data: A Case Study From Southwestern Nigeria. Weather Clim. Extrem. 2017, 15, 24–33. [Google Scholar] [CrossRef]
  21. Imran, M.; Shrestha, R.P.; Datta, A. Comparing Farmers’ Perceptions of Climate Change With Meteorological Data in Three Irrigated Cropping Zones of Punjab, Pakistan. Environ. Dev. Sustain. 2018. [Google Scholar] [CrossRef]
  22. Niles, M.T.; Mueller, N.D. Farmer perceptions of climate change: Associations with observed temperature and precipitation trends, irrigation, and climate beliefs. Glob. Environ. Chang. 2016, 39, 133–142. [Google Scholar] [CrossRef] [Green Version]
  23. Zhang, D.; Huang, J.; Guan, X.; Chen, B.; Zhang, L. Long-term Trends of Precipitable Water and Precipitation over the Tibetan Plateau Derived from Satellite and Surface Measurements. J. Quant. Spectrosc. Radiat. Transf. 2013, 122, 64–71. [Google Scholar] [CrossRef]
  24. Yang, L.; Yan, J.; Wang, P.; Wang, H. Impacts of Climate Change on the Reclamation of Farmers and Herdsmen in the Tibetan Plateau. Acta Ecol. Sin. 2019, 39. [Google Scholar] [CrossRef]
  25. Wang, P.; Yan, J.; Hua, X.; Yang, L. Determinants of Livelihood Choice and Implications for Targeted Poverty Reduction Policies: A Case Study in the YNL Rver Region, Tibetan Plateau. Ecol. Indic. 2019, 101, 1055–1063. [Google Scholar] [CrossRef]
  26. Taylor, J.G.; Stewart, T.R.; Downton, M. Perceptions of Drought in the Ogallala Aquifer Region. Environ. Behav. 1988, 20, 150–175. [Google Scholar] [CrossRef] [Green Version]
  27. Le Dang, H.; Li, E.; Nuberg, I.; Bruwer, J. Farmers’ Perceived Risks of Climate Change and Influencing Factors: A Study in the Mekong Delta, Vietnam. Env. Manag. 2014, 54, 331–345. [Google Scholar] [CrossRef]
  28. Diggs, D.M. Drought Experience and Perception of Climatic Change among Great Plains Farmers. Great Plains Res. 1991, 1, 114–132. [Google Scholar]
  29. Slegers, M.F.W. “If Only It Would Rain”: Farmers’ Perceptions of Rainfall and Drought in Semi-Arid Central Tanzania. J. Arid Environ. 2008, 72, 2106–2123. [Google Scholar] [CrossRef]
  30. Howe, P.D.; Thaker, J.; Leiserowitz, A. Public Perceptions of Rainfall Change in India. Clim. Chang. 2014, 127, 211–225. [Google Scholar] [CrossRef]
  31. Roco, L.; Engler, A.; Bravo-Ureta, B.E.; Jara-Rojas, R. Farmers’ Perception of Climate Change in Mediterranean Chile. Reg. Environ. Chang. 2014, 15, 867–879. [Google Scholar] [CrossRef]
  32. Alexander, C.; Bynum, N.; Johnson, E.; King, U.; Mustonen, T.; Neofotis, P.; Oettlé, N.; Rosenzweig, C.; Sakakibara, C.; Shadrin, V.; et al. Linking Indigenous and Scientific Knowledge of Climate Change. BioScience 2011, 61, 477–484. [Google Scholar] [CrossRef] [Green Version]
  33. Green, D.; Raygorodetsky, G. Indigenous knowledge of a changing climate. Clim. Chang. 2010, 100, 239–242. [Google Scholar] [CrossRef]
  34. Shrestha, U.B.; Shrestha, A.M.; Aryal, S.; Shrestha, S.; Gautam, M.S.; Ojha, H. Climate Change in Nepal: A Comprehensive Analysis of Instrumental Data and People’s Perceptions. Clim. Chang. 2019, 154, 315–334. [Google Scholar] [CrossRef]
  35. Wu, J.; Qu, J.; Li, H.; Xu, L.; Zhang, H.; Aryal, S.; Zeng, J.; Fan, Y.; Wei, Q.; Liu, X. What Affects Chinese Residents’ Perceptions of Climate Change? Sustainability 2018, 10, 4712. [Google Scholar] [CrossRef] [Green Version]
  36. Allahyari, M.; Ghavami, S.; Daghighi Masuleh, Z.; Michailidis, A.; Nastis, S. Understanding Farmers’ Perceptions and Adaptations to Precipitation and Temperature Variability: Evidence from Northern Iran. Climate 2016, 4, 58. [Google Scholar] [CrossRef] [Green Version]
  37. Jessoe, K.; Manning, D.T.; Taylor, J.E. Climate Change and Labour Allocation in Rural Mexico: Evidence from Annual Fluctuations in Weather. Econ. J. 2017, 128, 230–261. [Google Scholar] [CrossRef]
  38. Denkyirah, E.K.; Okoffo, E.D.; Adu, D.T.; Bosompem, O.A.; Yildiz, F. What Are the Drivers of Cocoa Farmers’ Choice of Climate Change Adaptation Strategies in Ghana? Cogent Food Agric. 2017, 3. [Google Scholar] [CrossRef]
  39. Couharde, C.; Generoso, R. The Ambiguous Role of Remittances in West African Countries Facing Climate Variability. Environ. Dev. Econ. 2014, 20, 493–515. [Google Scholar] [CrossRef] [Green Version]
  40. Iqbal, W.; Zahid, M. Historical and Future Trends of Summer Mean Air Temperature over South Asia. Pak. J. Meteorol. 2014, 20, 67–74. [Google Scholar]
  41. Center, C.M.D.S. Dataset of Monthly Surface Observation Values in China. Available online: http://data.cma.cn/data/cdcdetail/dataCode/SURF_CLI_CHN_MUL_MON.html (accessed on 24 October 2019).
  42. Zhang, L.; Wei, Y.; Zhou, Q.; Liu, F.; Chen, Q.; Yang, D.; Zhao, P.; Hou, Z. Assessment of the Adaptation Capacity of Famers to Climate Change and Limiting Factor Analysis: A Survey in a Typical Agricultural Area on the Qinghai-Tibet Plateau. Pratacult. Sci. 2019, 36, 1177–1189. [Google Scholar] [CrossRef]
  43. Zhang, N.; Xiao, T.; Jia, L. Spatial and Temporal Characteristics of Precipitation in the Tibet Plateau from 1979 to 2016. J. Arid Meteorol. 2018, 36, 373–382. [Google Scholar] [CrossRef]
  44. Wang, C.; Yang, Y.; Pang, W.; Hong, J.; Xie, J. A Review on Farmers’ Perceptions and Adaptation of Climate Change and Variability. Sci. Geogr. Sin. 2017, 37, 938–943. [Google Scholar] [CrossRef]
  45. Mueller, N.D.; Butler, E.E.; McKinnon, K.A.; Rhines, A.; Tingley, M.; Holbrook, N.M.; Huybers, P. Cooling of US Midwest Summer Temperature Extremes from Cropland Intensification. Nat. Clim. Chang. 2015, 6, 317–322. [Google Scholar] [CrossRef] [Green Version]
  46. Habtemariam, L.T.; Gandorfer, M.; Kassa, G.A.; Heissenhuber, A. Factors Influencing Smallholder Farmers’ Climate Change Perceptions: A Study from Farmers in Ethiopia. Environ. Manag. 2016, 58, 343–358. [Google Scholar] [CrossRef] [PubMed]
  47. Soglo, Y.Y.; Nonvide, G.M.A. Climate Change Perceptions and Responsive Strategies in Benin: The Case of Maize Farmers. Clim. Chang. 2019, 155, 245–256. [Google Scholar] [CrossRef]
Figure 1. The research framework of farmers’ perceptions of climate change.
Sustainability 12 08164 g001
Figure 2. Location and elevation of the Yellow River-Huangshui River valley (YHV) and Pumqu River Basin (PRB) in the Tibetan Plateau (a). Meteorological stations and sample villages are shown for (b) YHV and (c) PRB. Red lines are the track of our research route recorded by handheld GPS, and black lines represent administrative unit at the county level. Historical changes in cropland and irrigated area are shown for (d) YHV and (e) PRB from 1995 to 2017, which were derived from statistical yearbook of Tibet Autonomous Region and Qinghai Province.
Sustainability 12 08164 g002
Figure 3. Inter-annual change trends in precipitation and temperature from 1987 to 2017 in the YHV (a) and the PRB (b). Shaded bands indicate these samples at the 95% confidence interval.
Sustainability 12 08164 g003
Figure 4. Seasonal change trends in mean precipitation and mean temperature between two different periods (1987–2002 and 2003–2017) in the YHV (a) and the PRB (b).
Sustainability 12 08164 g004
Figure 5. The percentage of interviewees in two regions on (a) perception of precipitation change; (b) perception of temperature change; (c) perception of the duration of summer; (d) perception of the duration of winter; (e) perception of droughts; (f) perception of floods. Chi-square test showed that there were significant differences in the responses of interviewees in two regions for all six climatic variables (p < 0.01).
Sustainability 12 08164 g005
Table 1. Distribution of meteorological stations and loss year in study areas.
NameRegionLong/°ELat/°NElevation/mTypeLoss
HuangzhongYHV101.5836.502667GeneralNone
HuangyuanYHV101.2536.682675GeneralNone
MenyuanYHV101.6237.382850OrdinaryNone
Ping’anYHV102.1036.502125General1986–1988
TingriPRB87.0828.634300OrdinaryNone
NyalamPRB85.9728.183810BaseNone
Table 2. Statistical characteristics of variables in the PRB and the YHV (N = 1005).
TypeVariableDescriptionPRB (N = 505)YHV (N = 500)Expected Effect
MeanS.DMeanS.D
dependent variableFarmers’ perceptions of precipitation changedecrease = −1, no change = 0, increase = 10.780.22−0.430.68
geographical locationRegions 1Ping’an = 1, Menyuan = 2, Huangzhong = 3, Huangyuan = 4, Tingri = 5, Nyalam = 65.510.252.511.25/
Household characteristicsAge of householder16~40 = 1, 40~60 = 2, above 60 = 31.990.462.060.35(+)
Educational level of householderIlliterate = 1, primary = 2, middle = 3, high and above = 41.450.401.820.66(+)
Household size1~3 = 1, 4~6 = 2, above 6 = 32.320.451.740.30(–)
Community organizations 2Whether the household participation community organizations (yes = 1, no = 0)1.510.251.950.05(+)
Hold irrigated cropland (ha)0~0.2 = 1, 0.2~0.67 = 2, above 0.67 = 32.480.541.590.49(?)
Types of irrigation 3Rain-fed type = 1, mixed type = 2, ditches type = 32.370.351.680.74/
Adaptive behaviorWellsWhether the household holds a well (yes = 1, no = 0)0.090.080.020.02(–)
Agricultural facilities 40~3 = 1, 4~6 = 2, 7~9 = 31.720.461.340.24(+)
Source of potable waterStream water = 1, tap-water = 2, well water = 32.190.511.970.03(–)
1 Based on elevation, the higher the elevation, the greater the value. 2 Community organizations are composed of plantation cooperatives, animal husbandry cooperatives, and poverty alleviation associations. 3 Rain-fed type refers to the only rely on rainfall, without any irrigation facilities; mixed type refers to both rainfall and farmers’ self-organized irrigation (e.g., pumping water for irrigation); ditches type refers to the reliance on the government building irrigation facilities (e.g., dams for water storage). 4 Agricultural facilities include tractors, mechanical plows, water pumps, sprayers, threshing machines, micro tillage machines, rice noodle processing machines, feed processing machines, and flatbed trucks.
Table 3. Characteristics of interviewed households in the PRB and the YHV.
CharacteristicsPRB/%YHV/%
Age of householder16–4023.5614.40
41–6054.0664.80
>6022.3820.80
Educational level of householderIlliterate62.3843.20
Primary30.1031.40
Middle and above 7.5225.40
Household size1–311.2931.40
4–645.3563.20
>643.375.40
Hold irrigated cropland (ha)0–0.214.2653.20
0.2–0.6723.1734.60
>0.6762.5712.20
Types of irrigationRain-fed type5.9458.20
Mixed type51.0915.60
Ditches type42.9726.20
Average elevation of households (m)4317.832883.75
Participation ratio of community organizations48.9135.20
Table 4. Factors influencing farmers’ perceptions of precipitation change in both regions.
Independent VariableYHVPRB
χ2Gamma (Cramer’s V)χ2Gamma (Cramer’s V)
Regions37.5350.29911.5700.035
(0.000) ***(0.000) ***(0.003) ***(0.749)
Age of householder1.704−0.1012.182−0.039
(0.79)(0.208)(0.702)(0.688)
Educational level of householder17.5640.2373.3560.054
(0.002) ***(0.001) ***(0.500)(0.606)
Household size0.591−0.00714.956−0.152
(0.964)(0.943)(0.005) ***(0.053) *
Community organizations0.9880.04449.1730.298
(0.610)(0.610)(0.000) ***(0.000) ***
Hold irrigated cropland10.8470.23814.0850.181
(0.028) **(0.001) ***(0.007) ***(0.071) *
Types of irrigation126.6690.45055.2260.314
(0.000) ***(0.000) ***(0.000) ***(0.000) ***
Wells3.5260.0845.0810.1
0.1720.172(0.079) *(0.079) *
Agricultural facilities1.346−0.0152.961−0.026
(0.853)(0.870)(0.564)(0.787)
Source of potable water5.512
(0.064) *
0.731
(0.006) ***
55.566
(0.000) ***
0.315
(0.000) ***
Note: *, **, and *** denote significance at 0.1, 0.05, and 0.01 levels of probability. Values in brackets are p-values.

