Article

Investments in Polish Agriculture: How Production Factors Shape Conditions for Environmental Protection?

by
Piotr Bórawski
1,*,
Marta Guth
2,
Aneta Bełdycka-Bórawska
1,
Krzysztof Józef Jankowski
1,
Andrzej Parzonko
3 and
James W. Dunn
4
1
Department of Agrotechnology, Agricultural Production Management and Agribusiness, Faculty of Land Management and Agriculture, University of Warmia and Mazury in Olsztyn, 10-719 Olsztyn, Poland
2
Faculty of Economics, Poznan University of Economics and Business, al. Niepodległości 10, 61-875 Poznań, Poland
3
Department of Economics and Organization of Enterprises, Faculty of Economics, Warsaw University of Life Science SGGW-Warsaw, 02-787 Warszawa, Poland
4
Department of Agricultural Economics, Sociology, and Education, Faculty of Agricultural Sciences, Pennsylvania State University, University Park, PA 16802, USA
*
Author to whom correspondence should be addressed.
Sustainability 2020, 12(19), 8160; https://doi.org/10.3390/su12198160
Submission received: 18 August 2020 / Revised: 26 September 2020 / Accepted: 29 September 2020 / Published: 2 October 2020

Abstract

:
In recent years, social and economic goals have been preferable compared to environmental issues. However, global problems with the environment, increasing pollution, and gas heating emissions have made environmental issues a major priority. Suddenly, human beings have realized that environmental investments are needed to maintain better world conditions for future generations. This article investigates the development of agricultural investment in the context of production factors in Polish voivodeships in the years 2000–2018. Farmers have to choose between investing and developing production or being more environmentally friendly and invest on a smaller scale or transform their farms into organic production. Moreover, the investment in environmental protection in Poland was analyzed. Investment outlays on fixed assets for environmental protection and outlays on fixed assets for water management were investigated. The level of investment has changed since Poland joined the EU. With membership, Poland gained access to new markets and technology. Particular attention has been focused on production factors (land, capital, and the work force). We have conducted as a proxy regular regression analysis and after panel regression to measure the impact of the chosen factors on explained variables: investment outlays in agriculture, and investment outlays per 1 ha of agricultural land. We have used correlation analysis to examine the relations between explanatory variables and total gross investment in agriculture and total investment outlays in agriculture per 1 ha of agricultural land, outlays on fixed assets for environmental protection, and outlays on fixed assets for water management. Our analysis confirms that explanatory variables are important in shaping total investment outlays in agriculture and total investment outlays per 1 ha of agricultural land.

1. Introduction

The biggest problems of modern agriculture include volatility of agricultural product prices, population growth, and climate change. These factors cause uncertainty both for farmers and customers. One of the causes for this problem is the unstable supply of goods. Investment in agriculture helps a country to attain food security because it may increase the level of self-sufficiency [1]. However, food demand is increasing worldwide and it is a challenge to feed the world’s population. The sustainable intensification of agriculture can help to address this problem and to improve the environmental impacts of agriculture [2,3]. Agriculture will have to increase its productivity to feed the growing and more urban populations, particularly in sub-Saharan Africa (SSA) and South Asia [4]. Population growth can exert strong pressure on agriculture production, affect the producer-consumer system, and lead to resource depletion. The expansion of agriculture and the greater use of inputs can impact biodiversity negatively [5]. The environmental challenges need to include agricultural sustainability [6]. The development of the economy and population growth requires more food, and investment in agriculture can help produce it.
The necessary agricultural productivity increases can impact the whole economy. Investment in agriculture can not only increase food production and increase self-sufficiency, but also can promote the shifting of part of the workforce to more productive sectors. Modern efficient agriculture is based on fertilizer usage, which enables the achievement of higher yields and changes in the geography of agriculture [7].
One of the most important issues in the development of Polish, European, and world agriculture is investment, which is a crucial factor for technological progress that leads to an increase in the returns of all productive factors and greater food production. The growth capacity, not only of agriculture, but the entire economy, depends on technical progress [8,9]. Investment plays a key role in the development of capital [10]. Investment is responsible for fostering agricultural growth, effectiveness, and development [11,12]. Investment outlays can help to renew the machinery complement of farms and make agriculture more effective. They help to introduce new livestock production technologies and plants that support global food self-sufficiency [13].
There are many kinds of investments. According to Sierpińska and Jachna [14], we can exchange the following kinds of investments: reconstruction, modernization, innovation, development, strategic, and other. Investment decisions are a crucial category of decisions in the process of management [15].
Limited funds are a factor limiting optimal investment decisions [16]. There are several factors determining investment levels, among which the most important are initial costs, expected life of the investment, operating costs, and market share [17]. Investments are very important not only for farms, but for any enterprise, and they should improve effective resource use, including financial and natural resources. The process of investment enables an increase in technical and technological growth [18]. The investment outlays in the Polish agricultural sector are necessary to improve competitiveness and economic efficiency [19].
Investment is a crucial activity in modernizing farms and in environmental protection. Poland and other EU countries have benefited from the SOP (Sectoral Operational Programme) and the RDP (Rural Development Programme) within the CAP (Common Agricultural Policy). These programs include payments for investments in agricultural production. According to Buchta and Buchta [20], farmers experienced faster rates of growth in income and better productivity. Poland’s accession to the European Union (EU) contributed to a better situation for Polish farmers as a result of the Common Agricultural Policy (CAP) implementation and triggered the mechanisms of financial support for agriculture [21]. The investment also decreased agricultural employment. The investment had a tremendous impact on environmental protection, increased innovation, and improved living conditions of animals. The investment development has been increased in the protection of the ecological landscape, environmentally friendly agricultural modernization, and management.
Farmers can invest in agricultural land. There are many reasons why farmers invest in land. Examples are the need to secure reliable food supplies and demand for agro-fuel. Such a direction of utilization of land into plants delivering biofuels and non-food crops is the effect of the supported energy policy of the EU [22]. In the future, the EU will invest in more advanced biofuels (second, third, and fourth) that can reduce the land acquisition for energy purposes. Other examples of investments are machinery, barns, and increasing herd size. These investments have long-term economic consequences for farm development [23].
Generally speaking, the investment in the agricultural sector of the EU is organized under the Common Agricultural Policy (CAP) and environmental policy and includes agriculture, food, and rural areas. These changes include legislation for safety and quality of food, environmental standards, and international trade [24].
The understanding of investment in Polish agriculture has been widely described in the literature, but to the best of our knowledge none of the existing studies consider the impact of production factors on it.
Kusz [25] and Nowak and Kamińska [26] measured the regional diversification of investment outlays in Polish agriculture in the years 2002–2007. They found that Wielopolskie voivodeship, Zachodnio-Pomorskie voivodeship, Oposkie voivodeship, Warminsko-Mazurskie voivodeship, and Lubuskie voivodeship have the highest investment activity among voivodeships. These authors found that, in the years 2004–2011, there were major changes in the investments in Polish agriculture. The value of investments doubled during the analyzed period. This change was aided by EU financial support under the Common Agricultural Policy (CAP). The process of investment in agriculture can be shaped by policy. The increased investment outlays were particularly seen in machinery and technical equipment. Proper policy influences the profitability of agricultural resource uses, most importantly agricultural land. However, in the short term, the changes in agricultural productivity are minor because agricultural investment has mostly longer-term effects [27,28].
Poland is a very good example to study investments for various reasons. First, the market economy was introduced in 1989 and changed the conditions of farms and the economy overall. In one decade (1989–2000) over 2 million Polish small farms found themselves in a new market reality in which international corporations began to aggressively take control of food supply chains. Poland, as one of the larger countries of Central and Eastern Europe and of the republics of the former USSR (Union of Soviet Socialist Republics), is therefore a kind of testing ground for agricultural economics, because there is no other region in the world where systemic changes would force almost simultaneous and equally targeted adjustments of production structures in so many countries [29]. Second, Poland, along with nine other countries in Eastern Europe, joined the EU in 2004. These farmers had to adapt to the new market conditions and modernize their farms and production systems [30].
Many papers describe the investment changes in the EU countries. However, little attention is paid to the factors shaping investment in agriculture. Moreover, limited scholarly attention has been paid to the crucial role in the economic development of agriculture and the prognosis of investment and factors shaping it. The authors of this paper wanted to fill in the gap in the literature concerning the investment diversification in the context of production factors utilization.
The objective of our analysis was to scientifically measure the investment in Polish agriculture and the environment and the factors shaping it. We wanted to answer following questions:
  • What are the investment outlays in agriculture and the environment in Poland and how have they changed after accession to the EU?
  • How are the changes of investment in Polish Agriculture and Environment?
  • Which factors determined the investment in Polish agriculture and environment?
  • How will the investment in Polish agriculture and factors shaping it change?
To achieve the objective, we have used multiple regression analysis as a proxy for further panel regression analysis to check the impact of selected factors on the investment in agriculture and environment in Polish voivodeships in 2000–2018. Based on the regression equation, the strength of the relationship (regression coefficient) between the dependent and independent variables was calculated [31,32].
The paper is organized as follows. In the next section, we describe the production factors in the economy and we concentrate on the impact of investment on the environment. Then, we present the method of analysis. Next, we discuss the diversification of investment in Polish agriculture and the environment, followed by an economic analysis of factors having an impact on Polish investment in agriculture and the environment. Finally, we draw conclusions.

2. The Role of Production Factors in the Development of Agriculture and Food Security

Production factors have been widely described in economic theory. The introduction of the market economy in Poland changed the relationship between production factors. The changes after 1989 were so large and severe that they caused “instability of the macroeconomic environment” and relations between elements of the food economy. Production factors, i.e., land, labor, and capital, vary in mobility, and areas used for agriculture were limited. According to Guth and Smedzik-Ambroży [33], factor endowments are the primary determinants of the economics of farming. This is also supported by other studies of various authors that show that the effects of farming in agriculture are primarily determined by the use of production resources. At the same time, not only resources in the quantitative sense, but also in the qualitative sense, and the relations between them in the production process play an important role [34]. A. Marshall introduced a fourth factor into economics—organization or entrepreneurship, while J. Schumpeter recognized the importance of innovation as a production factor having a fundamental impact on the achievement of competitive advantage by enterprises [35,36]. This also applies to agricultural products. According to the above theories, the factor endowments determine the production costs and therefore the incentive to invest.
The impact of factor endowments on the efficiency of agricultural production results from the production function. It illustrates the relationship between the amount of expenditure incurred and measured, e.g., depreciation, the number of man-hours, the number of employees, the area of agricultural land, the value of fertilizers and other current assets, and the results achieved (e.g., the amount of product produced) [37]. It should be noted that this relationship is increasingly shaped by unconventional factors external to the given entity, e.g., scientific research, dissemination of progress, technical infrastructure, and climate. Other exogenous factors affecting production efficiency are primarily: market relations (prices of products and means for their production) and institutional and legal instruments, e.g., the EU common agricultural policy. Despite this, the factor-product relationship remains one of the main economic characteristics of production processes, and the improvement of this relationship is an endogenous, fundamental source of maximization of the producer’s objective function, which is the selection of the most effective allocation of factors of production to the production effort [38].

2.1. Land as a Factor Determining Agriculture Development

Land is considered to be the most important asset for the rural population because it is the place of their livelihood [39]. The soil is responsible for the production of 95% of the food produced for people and feed produced for animals [40]. In Poland, many problems exist with land management. These problems reflect economic resources whose supply is inflexible in the short term. Other production factors such as capital and labor can move relatively quickly from poorer utilized regions to more efficient regions. Land, on the other hand, is immobile, which can lead to its inefficient utilization and lower profitability [41,42]. Even with such serious management problems, land is an essential agricultural production resource, even though Johnson [43] claims that its role is increasingly being replaced by capital.
Land use changes can include conversion of forest, grassland, urban land, and cultivated land. The process can be linked with climate change. It is very common in Western and Eastern Europe to convert cropland or grassland into forests [44]. The land can also be converted from agriculture to nature or between different agricultural sectors [45]. The social function of property and land in cities is becoming more and more important [46]. Sustainable land management focuses on balancing economic, environmental, and social demands on land use. It is characterized by management decisions of farms or farm managers because land delivers various goods and services [47]. It is a complex system including science, alliance, communication, and education embedded in social and political context and models [48]. Sustainable land use shows to what extent the natural capital can be replaced by other capital and the investment quality in natural capital. Kaphengst [49] claims that strong sustainability is more sensitive to the quality of natural capital than weak sustainability.
Brekke [50] says that we consider it weak sustainability if the development is non-diminishing from generation to generation. This is by now the dominant interpretation of sustainability. Strong sustainability views sustainability as non-diminishing life opportunities. This should be achieved by conserving the stock of human capital, technological capability, natural resources, and environmental quality. The key issue is the ecosystem and environmental assets that deliver essential services and non-use values.

2.2. The Role of Capital in Agriculture Development

A second important factor is capital, which has the greatest mobility. The inflow of capital to rural areas is increasing. This is related to Poland’s accession to the EU (2004) and the payment of direct payments and other funds from EU funds to farmers. The concept of investing is inseparably connected with the capital equipment of a farm. In the case of farms, as in other entities, the condition for the development of their activity is not only the restoration of production assets, but, above all, making development investments for the modernization of their assets [51]. In Polish agriculture, this is particularly important, since the consumption of fixed assets is significant, which in 2011 amounted to as much as 77% and almost doubled compared to 1990. The reason for this is that fixed assets in Polish agriculture were often used for a period exceeding their total amortization, as well as the prescribed standards, especially on smaller farms. Research by Kuś and Matyka [52] showed that thanks to access to EU funds, investments in Polish agriculture doubled (comparative analysis for 2000–2012 using data from the Central Statistical Office and Eurostat). Farmers allocated a major part of investment funds to the purchase of tractors and other agricultural machinery, but also to modernized livestock buildings and fruit storage facilities [25]. This significantly increased the capital stock in Polish farms and its use. According to Ruttan, progress in mechanical technology is the main source of increased labor productivity, while progress in biological technology is the main source of increased soil productivity [53].

2.3. The Role of Labor in Agriculture Productivity Development

Efficiency in agriculture depends to a large extent on the labor force used in production. The workforce often shows limited mobility. It is estimated that in Poland in 2009, about 13.3% of the population was employed in agriculture, while in more developed EU-15 member states, employment in agriculture ranged on average from 3% to 6% of the population [54]. Nevertheless, labor productivity in Polish agriculture is at a much lower level than in highly developed countries [55].
From the literature, we have inferred the research hypotheses:
Hypothesis 1 (H1).
Total investment in Polish agriculture and hunting will decrease as the result of CAP fund shortages.
Hypothesis 2 (H2).
The large Polish agricultural workforce decreases the investment outlays in agriculture and the environment.

3. Materials and Methods

The changes in the level of investment are presented in the paper. We have used Central Statistical Office in Warsaw data for 2000–2018 to analyze the investment in agriculture and the environment in Poland and this data on the regional level. We used the CSO (Central Statistical Office) [56] data in Poland as the source of this information. We show the changes and present the results using descriptive, tabular, and graphical forms to describe the changes. We have also used the data from Agricultural Land Market in Poland to analyze the sale of land from the National Center for Agricultural Support [57]. To analyze the outlays on fixed assets for environmental protection and outlays on fixed assets for water management, we acquired the data from Environment analysis published by CSO [58].

3.1. Regression Analysis and Panel Regression Analysis

In the first stage, we present the direction and dynamics of investment in agriculture and the environment in the years 2000–2018. Pearson correlation coefficients were calculated to determine the dependence of variables. Various research methods were used in data analysis, including comparative analysis, correlation analysis, and multiple regression and panel regression analysis. In order to determine the impact of macroeconomic variables on the investment in agriculture, a regression method was used. We used multiple regression analysis to find a subset of variables associated with the dependent variable as is described by the following formula [59]:
y   =   a × x + b
  • a—directional factor of the straight regression
  • b—free expression of a simple regression r xy
where:
a = X i X ˙ × Y i Y ˙ ( X i X ˙ ) 2 = cov X , Y x 2 σ 2 x = r xy ×   σ y σ x
  • b = Y ˙ −a X ˙
  • X i , Y i ,   variable   values   X ,   Y
  • X ˙ , Y ˙ —average of variables X, Y
  • cov (X, Y)—covariance of variables X i Y
  • σ x ,   σ y standard   deviations   X   i   Y
  • r xy correlation   coefficient   between   X   i   Y
The same procedure was used in panel regression, where the collinearity between the independent variables was checked by VIF analysis. We have chosen to use fixed effects model (FE) as the assumptions of random distribution of error term and no correlation between individual effects and vector of covariates in secondary data are unlikely to hold. However, we also ran the Hausman test and it further proved that in all four cases we should use FE models. As autocorrelation and heteroscedasticity may influence our results, we calculated robust standard errors proposed by Arellano [60]. Next, we have used descriptive methods to present the changes in investment in Poland. We also conducted the descriptive statistics to measure the average, median, minimum, maximum, standard deviation, kurtosis, skewedness, and coefficient of variation of investment in agriculture in Poland.
Based on the regression equation, the strength of the relationship (forward multiple step regression coefficient) between the described (dependent) variables and the individual descriptive (independent) variables was calculated. Appropriate means and standard deviations of the examined features, the coefficient of linear correlation between the examined features, and the multiple regression equations were collected in tables. We have used the F-test to assess the regression equation, and the Student’s t-test to assess the correlation coefficient. The significance assessment was made at the level of 0.05.

3.2. Setting the Variables

The selection of dependent variables resulted from their importance for investments in agriculture. We have analyzed the total investment outlays in agriculture and investment in agriculture per 1 ha of agricultural land. The analysis of investment per 1 ha of agricultural land enabled a comparison of the spatial differentiation of investment. There is a big differentiation of agriculture and farm area in individual voivodeships in Poland. Presenting only the total investment in agriculture does not take into account the production potential for agriculture in individual voivodeships. Therefore, the value of investment outlays per 1 ha of agricultural land is presented. This approach is confirmed by the literature [25]. Moreover, the authors of the paper wanted to show the environmental impact of investments. That is why we analyzed the outlays on fixed assets for environmental protection and outlays on fixed assets for water management.
The selection of the independent variables was made on the basis of the substantive justification of their impact on the dependent variable. In this respect, endogenous and exogenous variables were taken into account. Then, from the set of presented variables, those with high autocorrelation were eliminated. Ultimately, the sets of variables were limited to a few that had a statistically significant effect on the dependent variables and a strong intuitive reason for inclusion based on our understanding of the problem (Table 1).
The final variable X5 (gross domestic product increase) can contribute to the analysis of investment in Polish agriculture and environment. The logic here is that if the economy overall is strong, this helps the agricultural sector thrive as well. It is proven that the higher gross domestic product increase can stimulate the investment level from one side. The increase of investment can contribute to the increase of gross domestic product. The decrease of investment level can slow down the gross domestic product. It is proved in the literature that the economic growth and investment rate depends on each other. Sztaudynger [61] analyzed the impact of the investment rate on the GDP growth rate in the Polish economy in 1967–2001. Moreover, foreign direct investment contributes to the development of the country [62].
Taking into account the literature and data availability, five potential explanatory variables were initially selected that may affect investment in agriculture in Poland: total gross value of fixed assets (in mln PLN), average farm area (ha), sale of land from the National Center for Agricultural Support (thousand hectares), employed persons in agriculture (in thousands), and gross domestic product increase (%).
For the analysis of changes in investments in agriculture in 2000–2018, the measures of variability (median, kurtosis, skewness, standard deviation, coefficient of variation, range) and the dynamics of changes (statistical indexes) were used. The research results were compiled in tabular, graphic, and descriptive form.

3.3. ARIMA Model Description

An ARIMA model was used to check the stationarity of the model and the prognosis.
y t = φ 0 + φ 1 y t 1 + φ 2 y t 2 + + φ p y t p + e t
where:
  • y t ,   y t 1 , y t 2 , ,   y t p —the forecast value of the variable that time period t , t 1 , t 2 , ,   t p
  • φ 0 , φ 1 , ,   φ p —model parameters;
  • et—error (rest) of the model for the period t; and
  • p—delay operator.
The structure of the model is based on the assumption that there is autocorrelation between the values of the forecast variable and its values delayed in time.
Another model is the moving average MA model:
y t = θ 0 + e t θ 1 e t 1 θ 2 e t 2 θ q e t q
where:
  • yt—is the value of the forecast variable in period t;
  • et, et − 1, …, et − q—errors (residuals) in periods t, …, t − q
  • θ 0 , θ 1 ,   , θ q —model parameters, and
  • q—delay operator.
To achieve greater flexibility in matching the model to the time series, it is sometimes appropriate to combine both models, which leads to the autoregression model and the ARMA moving average:
y t = φ 1 y t 1 + φ 2 y t 2 + + φ p y t p + θ 0 θ 1 + e t 1 θ 2 e t 2 θ q e t q
The model assumes that the value of the forecast variable at the moment or period t depends on its past values and on the differences between the past actual values of the forecast variable and its values obtained from the model (forecast errors) [63,64,65,66,67].

4. Results

4.1. Changes of Investment in Polish Agriculture and Environment

Investment in agriculture helps a nation achieve technological development. According to Czyżewski, Matuszczak, and Miśkiewicz [68], farmers invest when the expected return on investment is higher than the cost of implementation. Furthermore, they do not invest when the expected income is lower than the value of purchased assets. In a situation when the expected revenue is lower than the cost of purchase but higher than the resale value, a ‘’high profit trap” can occur, which means that capital is immobile [69].
Formerly, farmers tried to get money from the Rural Development Programme to invest. However, the procedure was complicated and farmers needed to prepare a plan of farm development with many necessary documents. They needed help in this process and often had to hire advisory services. In the first years of new perspectives, the ARMA (The Agency for Restructuring and Modernization of Agriculture) did not overcome problems with distributing money to farmers. The most highly developed farms conducted the necessary investment to adjust their farms to the new demanding standards of the EU in the perspective 2007–2014, so they did not invest in the next years. These and other reasons will delay investment in the future.
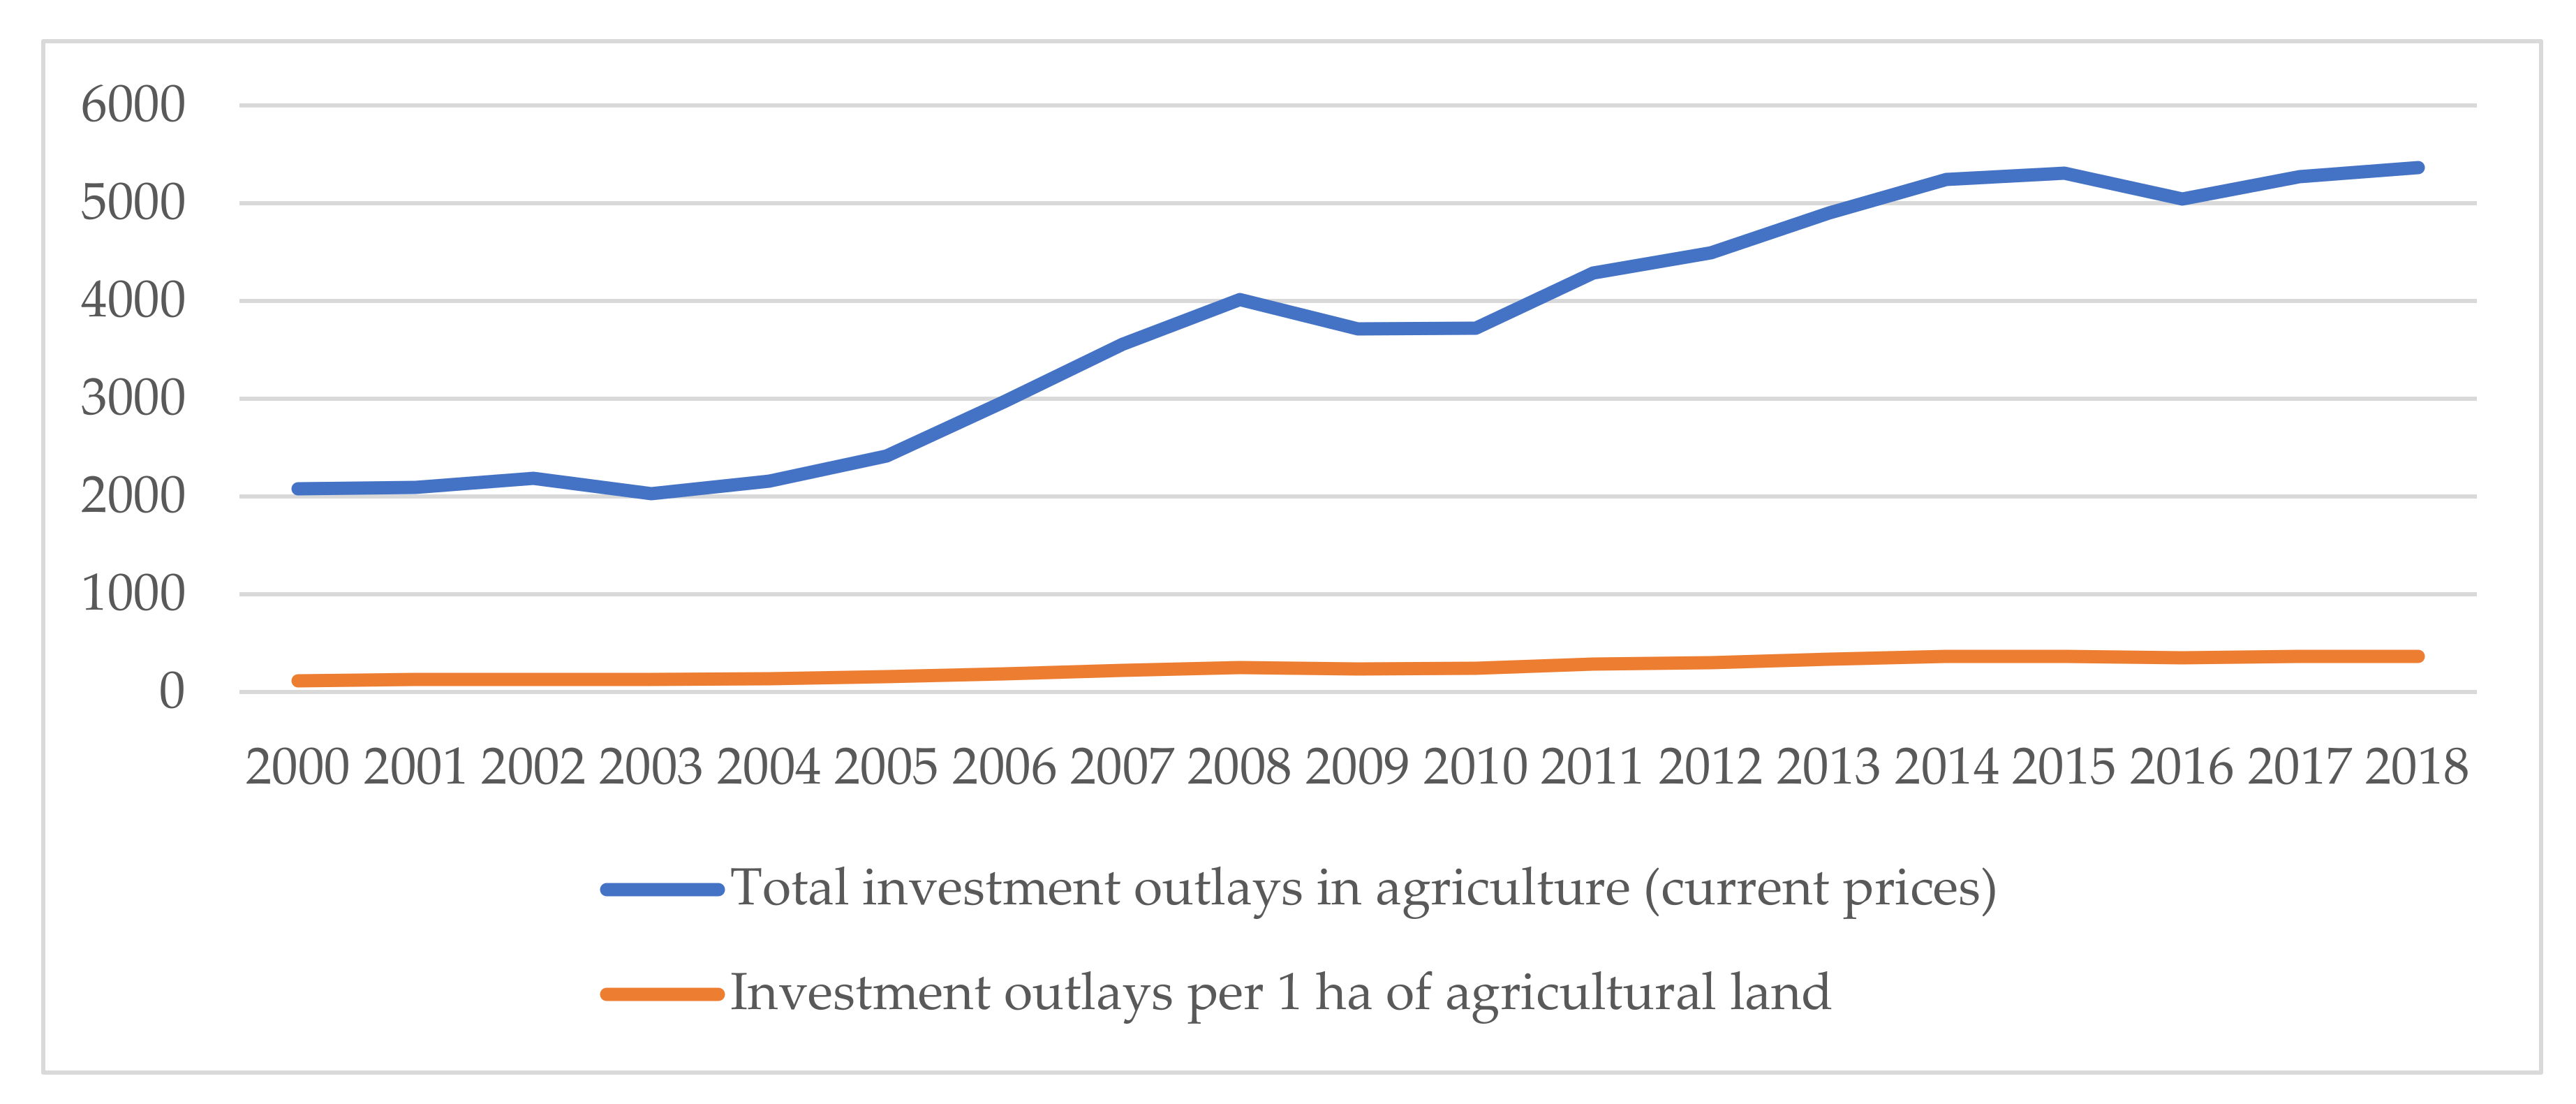
The level of investment in Polish agriculture has changed in 2000–2018 (Table 2). We wanted to recognize how the investment outlays in agriculture and hunting changed in the years 2000–2018. The analysis confirmed that the highest investment outlays in agriculture and hunting were found in 2018 in Wielkopolskie voivodeship (771.0 mln PLN), Mazowieckie voivodeship (713.6 mln PLN), Warmińsko-Mazurskie voivodeship (425.2 mln PLN), and Podlaskie voivodeship (423 mln PLN). These voivodeships have considerable meadow and pastures, which create good conditions for milk and beef production [70]. The lowest investments in agriculture and hunting in 2018 were found in Świetkorzyskie voivodeship (143.8 mln PLN), Podkarpackie voivodeship (152.8 mln PLN), and Lubuskie voivodeship (179.9 mln PLN). These regions are located in the southern and eastern regions of Poland. These regions have the worst conditions for agriculture production management and poorer soils [71].
There are many reasons for the differences in financial outlays of agriculture in Poland. Kusz [25] explained the differences in investment outlays as the effect of differences in the average land area of farms in Poland. Polish agriculture is very diverse regionally in production potential, structure of production, and its efficiency. That is why investment needs differ [26].
The highest increase of investment outlays in agriculture and hunting in the years 2000–2018 were found in Warmińsko-Mazurskie voivodeship (174.1%), Lubuskie voivodeship (163.0%), and Śląskie voivodeship (154.1%). The lowest increases in the analyzed period were observed in Zachodniopomoskie voivodeship (53.3%), Łódzkie voivodeship (77.0%), and Podkarpackie voivodeship (88.4%).
The highest average levels of investment outlays were found in the years 2000–2018 in Wielkopolskie voivodship (686.42) and Mazowieckie voivodship (620.14). The lowest levels of investment in the years 2004–2015 were found in Świętkorzyskie voivodship (118.42) and Lubuskie voivodship (119.80).
The coefficient of variation informs us about changes in the years 2000–2018. The highest coefficients of variation were found in Warmińsko-Mazurskie voivodship (31.27%) and Podlaskie voivodship (27.61%). The lowest were found in Podkarpackie voivodeship (18.92%) and Świętokrzyskie voivodship (19.52%).
The kurtosis reached negative values except for the Lubuskie and Śląskie voivodeships. Negative kurtosis informs that the values were different in relation to the mean.
A more detailed analysis was done to find the investment outlays in agriculture and hunting by voivodeship per 1 ha of agricultural land (Table 3). Our analysis confirms that the highest value of investment outlays in agriculture and hunting were found in 2018 in Lubuskie voivodeship (460.4 PLN per 1 ha of agricultural land), Warmińsko-mazurskie voivodeship (450.8 PLN per 1 ha of agricultural land), and Wielkopolskie voivodeship (435.1 PLN per 1 ha of agricultural land). The lowest value of investment outlays in agriculture and hunting per 1 ha of agricultural land in 2018 were found in Lubelskie voivodeship (260.5), Podkarpackie voivodeship (268.3), and Świętokrzyskie voivodeship (295.7). Such a diversification of investment level can cause differences in agricultural development in Poland. Nowadays, agriculture development should be subsidized equally, which helps to develop climate-smart agriculture. This particularly includes improved agronomic practices, integrated nutrition management, conservation tillage, water management, and other practices [72].
The European Agricultural Guarantee Fund (EAGF) supports agriculture producers with direct payments [73]. More than 1.4 million farmers each year get financial support in Poland. The second source of financing the development of agriculture is the European Agricultural Fund for Rural Development (EAFRD).
The Common Agricultural Policy (CAP) plays an important role in the supporting changes in production of Polish and European agriculture. It also plays a vital role in agriculture investments. Generally, EU-13 countries in the Central and Easter European (CEE) region are characterized by lower investment compared to the farming sector of the EU-15 countries. Therefore, policy makers should take into consideration local conditions in supporting agricultural investments in the EU [74].
The support of rural development is divided in four axes; however, almost half of the public funds are to be spent on improving the competitiveness of agriculture (Axis 1) within the 2007–2013 programming period [75]. The modernization of agricultural holdings is the main priority of Axis 1 support programs in Poland (66%), while 16% are for “early retirement” programs. A very important source are direct payments. Although they are not considered an investment support measure, empirical evidences found that they may stimulate agricultural investment [76].
Poorer farmers have to take loans and endure credit rationing, high borrowing costs, and rural financial market imperfections to finance the rest of their investment [76,77]. However, financing agriculture is still a high-risk activity for most banks because of low profitability in the sector and ineffective land markets. Furthermore, agricultural loans tend to be highly correlated since most producers have similar weather and prices, which increases risk for the lenders. [78].
The highest increase of investment outlays in agriculture and hunting in the years 2000–2018 were found in the Lubelskie voivodeship (223.1 PLN per 1 ha of agricultural land), Małopolskie voivodeship (198.9 PLN per 1 ha of agricultural land), and Warmińsko-Mazurskie voivodeship (190.3 PLN per 1 ha of agricultural land). These voivodeships have the chance to increase the productivity, profitability, and the efficiency of agriculture. The increases in investment can also enhance the adoption of measures to reduce the negative side effects of agriculture on the climate and reduce greenhouse gas emissions [79].
The lowest increase of investment outlays in agriculture and hunting by voivodeships in PLN per 1 ha of agricultural land in the years 2000–2018 were found in Zachodniopomorskie voivodeship (87.2%), Łódzkie voivodeship (89.7%), and Lubelskie voivodeship (104.3%).
The highest levels of investment in PLN per 1 ha of agricultural land in the years 2000–2018 were found in Wielkopolskie voivodeship (387.52 PLN) and Opolskie voivodeship (315.25 PLN). The lowest level of investment was observed in Podkarpackie voivodeship (212.38%).
The coefficient of variation informs us about changes in the years 2000–2018. The highest coefficients of variation were found in Małopolskie voivodeship (33.49%) and Warmińsko-mazurskie voivodeship (33.12%). The lowest were found in Kujawsko-pomorskie (22.16%) and Lubuskie voivodeship (23.30%). The kurtosis reached the negative values in all voivodeships, which informs us that they were different in relation to the mean.
Higher socio-economic development increases the degradation of environment. To stop the degradation of the environment, elimination of pollution should be a priority. Thanks to activities focused on environmental protection, the welfare of nations and people can be improved [80]. It is necessary to invest in environmental protection to eliminate pollution and other degradation processes, which are the effect of human economic activity [81]. The aim of these investments is to achieve environmental balance.
The intensification of agricultural production and the development of industrial agriculture led to the reduction in landscape and ecological diversity and loss of semi-natural habitats. This damage to the environment can be caused by intensive use of chemical fertilizers and land. The assessment of social costs can help to determine the optimal agricultural output [82].
Moreover, future growth of population and consumption, increasing production of bioenergy from agriculture, and using more land for roads and businesses will increase the demand for agricultural land. The area of agricultural land is shrinking and the future demand for food and energy can only be fulfilled by more intensive use of existing land [83,84,85].
The investment in the environment in the EU has crucial meaning in innovations. The EU is owner of 30% of the world patents regarding renewable energy sources. However, many enterprises do not achieve success in this field. That is why innovation on the business model level is required to align incentives and revenue mechanisms to leverage sustainable solutions [86,87].
Investment in the development of renewable energy sources is important for the economy because they are responsible for energy security [88].
The investment in the environment can be in the production of second, third, and fourth generation biofuels. However, this production is still in the development and commercial phase. Lignocelusosic plants, which are a source of second-generation biofuels, can be grown on lower quality soils and degraded areas [89,90]. It can also be in farms and other equipment helpful in obtaining renewable energy.
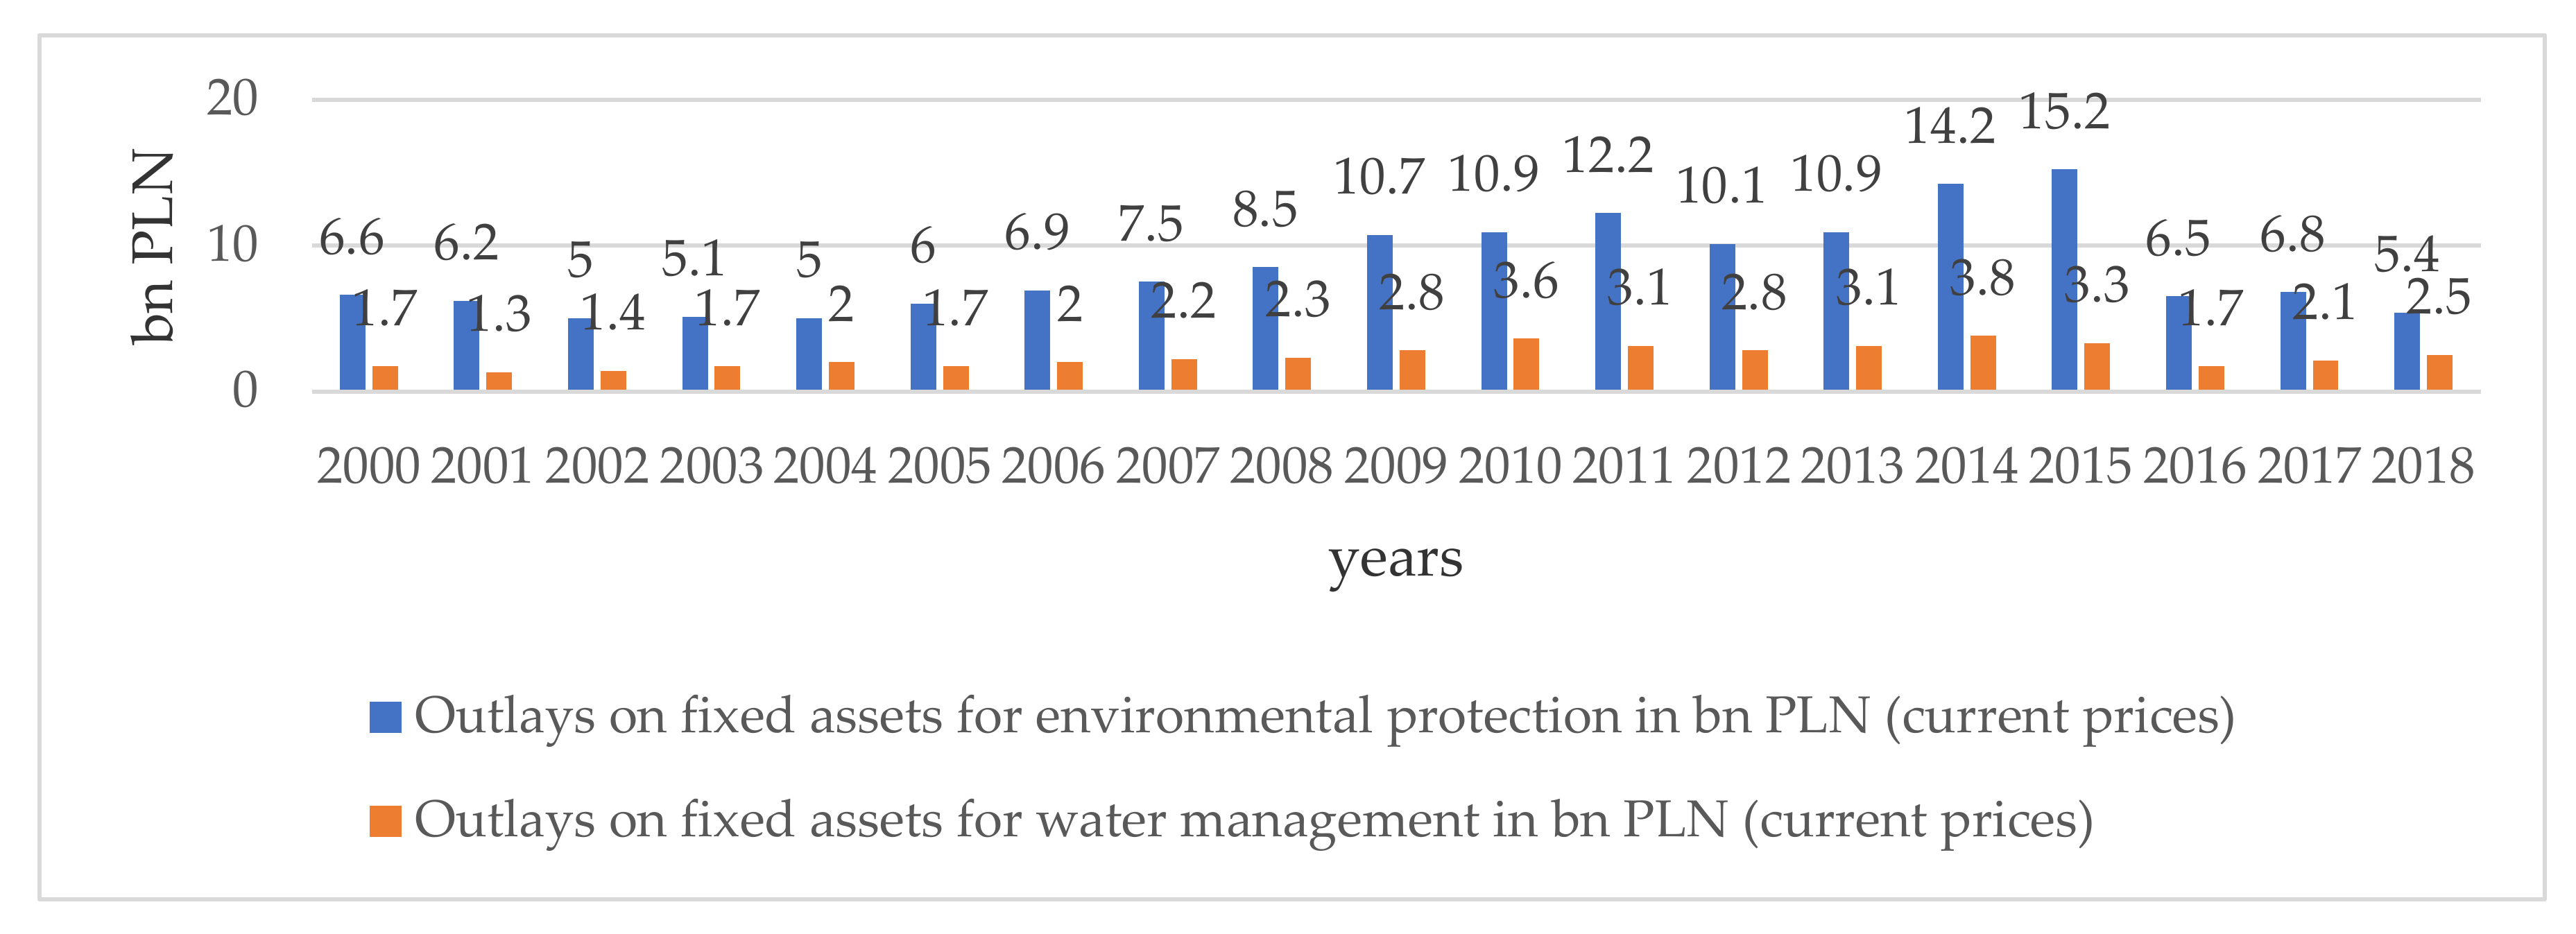
Poland is having quite large outlays on fixed assets for environmental protection (Figure 1). The biggest outlays were in 2015 (15.2 bn PLN). In the years 2005–2015, the outlays increased by 153%. However, in 2016 and 2017, the outlays decreased respectively to 6.5 bn PLN and 6.8 bn PLN. This was because many big investments were financed from the perspective 2007–2013 and from the fact that money from new perspective 2014–2020 were not fully invested. The outlays for sewage management and water preservation, and air and climate preservation, are a main part in the structure of fixed assets on environmental protection. The outlays on sewage management and water preservation were from 35% to 66% on fixed assets on environmental protection. Another big part was outlays on air preservation and climate, which increased from 19% to 39% in the years 2000–2017.
The investment in the environment can be both in urban and rural areas. Cities choose different strategies that have environmental impacts on living conditions of inhabitants. The strategies include most environmentally friendly initiatives [91]. Nowadays, major environmental consequences result from products, processes and activities, and degradation [92].
In 2017, the share of outlays on sewage management and water preservation and the preservation of air and climate were respectively 39.8% and 33.9%. The remaining 26.3% was expenditure on waste management (12.7%), on biodiversity and landscape protection (2.0%), noise and vibration reduction (1.0%), the protection of soil and underground and surface waters (0.7%), research and development activities (0.3%), and other activities related to environmental protection (9.6%). The largest expenditure on fixed assets for environmental protection in 2017 were incurred in the Śląskie voivodeship (16.9% of total outlays on fixed assets for environmental protection), Mazowieckie (12.2%), and Zachodniopomorskie (10.2%), while the smallest were in Warmińsko_mazurskie (1.7%) Świętokrzyskie (1.8%) and Lubuskie (2.3%) [93].
Another group of outlays are for water management. Investments related to water management include the construction of water intakes (total with treatment devices and main water and distribution network). Moreover, the investment includes construction of laboratories for water quality control (including automatic water quality measuring stations) and construction of retention tanks (except for fire prevention tanks and diurnal equalization). Additionally, the investment in water includes water stages, navigation and energy, as well as locks and weirs, regulation of rivers and development of streams, construction of flood embankments, and construction of pumping stations and depressive areas [94]. They have increased from 1.7 bn PLN in 2005 to 3.8 bn PLN in 2014 (124%). However, it decreased in 2016 and 2017 respectively to 1.7 bn PLN and 2.1 bn PLN (Figure 2).
In water management, the largest outlays were incurred in the following voivodships: Śląskie (23.5% of total outlays), Lower Silesia (20.8%), and Mazowieckie (13.4%), while the smallest were in Świętokrzyskie (2.0%) and in Warmińsko-Mazurskie (1.5%). Expenditure on water management in most voivodships was incurred in urban areas. They constituted from 52% to 82% of expenditure on water management.
In four voivodships—Kujawsko-Pomorskie, Lubelskie, Świętokrzyskie, and Warmińsko-Mazurskie—outlays in rural areas accounted for over 50% of outlays on water management (respectively, 63%, 78%, 59%, and 58%). The largest expenditure on water management calculated per capita was incurred in 2017 in the Dolnośląskie voivodship, and the smallest in the Warmińsko-Mazurskie voivodeship (PLN 148 and PLN 21, respectively).
The global economy creates the demand for products such as raw materials, semi-finished, and finished goods, which have an impact on the environment. It has become a global challenge to make production and consumption more environmentally sustainable and friendly [94].
The EU has introduced different environmental taxes, the aim of which was to relieve the pressure on the environment. Generally, the EU countries have freedom in designing taxation systems and this creates big differences between countries. This solution can help internalize the negative effects of economic growth [95].
Environmental protection is an international issue. Countries have ratified international environmental agreements (IEAs), for example Kyoto Protocol and Paris Agreement, to achieve global cooperation for climate change [96]. Effective IEAs should promote public goods and mitigation of climate change [97]. Environmental management requires the consolidation of efforts not only at the EU level, but also on country and local levels [98].

4.2. Factors Shaping Investment in Polish Agriculture and Environment

The increasing demand for land resulted in significantly higher prices over time. The land in the National Center for Agricultural Support (KOWR) mostly was sold to private investors and the amount of available land decreased from 108 thousand ha in 2005 to 4 thousand ha in 2017 (Table 4) [99].
Another factor shaping investment in Polish agriculture is average farm size. The average farm area in Poland has increased from 9.38 ha in 2005 to 10.65 ha in 2017. The main cause of the farm area increase was the effect of the CAP, which helped farmers to subsidize harvest costs.
Total gross value of fixed assets in agriculture and hunting is also an important factor shaping investments in Polish agriculture. It increased from 112,777.1 mln PLN in 2005 to 144,158.2 mln PLN in 2017. The increasing value of fixed assets can be explained by purchase of new equipment by farmers and investment in buildings and land [25]. The employment in agriculture in Poland is constantly changing with restructuring of agriculture and consolidation of small farms. Polish villages are becoming the place of residence for urban inhabitants. Poland’s gross domestic product economy has been growing because of improved conditions in the European economy.
The pace of changes in agricultural land movement in Poland is caused by various factors, among which the most important is the opportunity to exit agriculture by people to work in other occupations. The interests in land purchase should be linked with the increase of production assets and income increases. Poland is an important land user among EU countries. The land includes arable land and permanent pastures, which deliver fodder especially during summer for dairy production. Many Polish farms are organic and the pasture grazing has a positive effect on grassland and provides organic fertilizers, preserves soil and organic matter, and does not destroy vital organisms [100].
We wanted to check how the investment and factors shaping it changed during the analyzed period. The coefficient of variation measures the changes in the analyzed variables. Our analysis shows that the highest coefficients of variation were found in the sale of land from the State Agency and gross domestic product increase (Table 5).
Kurtosis was negative for almost all analyzed variables except sales of land from the State Agency. The skewedness asymmetry measure was negative except for employed persons in agriculture, outlays on fixed assets for environmental protection, and outlays on fixed assets for water management, indicating that they were different in the analyzed period in relation to the mean.
The highest coefficients of variation were found in sale of land from National Center for Agricultural Support and gross domestic product increase. Such a differentiation of investment and production factors suggests that farmers have to make decisions that do not only help them to acquire agricultural machinery, but also solve ecological problems such as to minimize the consumption of chemicals [73].
In turn, the analysis of factors that may affect total outlays of investment in agriculture shows some interesting results. The multiple regression results are presented in Table 6. After verification of the independent variables, it can be observed that the adjusted R2 = 0.86, so the model explains 86% of the variability of total investment outlays in agriculture in Poland. The multiple regression coefficient where R2 = 0.86 means that total investment outlays in agriculture are strongly correlated with the following variables: X2—average farm area, X3—sale of land from the National Center for Agricultural Support, and X4—employed persons in agriculture. The adjustment of panel model was much weaker—it explained 48% of within variability (in time) and 26% of between variability (differences between voivodeships) (Table 7).
Based on the results of the regression analysis, it can be concluded that the total investment outlays in agriculture are primarily influenced by X2—average farm area, which means that with the increase of this measure by 1 ha, total gross investment in agriculture increases by 3.440 thousand PLN. These investments can cause excess production, which can cause the noneffective utilization. This indicates that investment can increase the cost of assets maintenance [15]. According to Pawlak [21], the total value of investments in technical means of construction, mechanization, and transport in agriculture increased by 103.0% during the ten years after accession to the EU.
At the same time, the results imply that an increase in sale of land from the National Center for Agricultural Support by 1 thousand ha will result in decrease of gross investment in agriculture by 280 PLN.
Finally, the increase of employment by 1 thousand people will increase the total gross investment in agriculture by 1.930 mln PLN. Poland is one of the countries of the EU together with Romania with the highest employment in agriculture.
In turn, the analysis of factors that may affect total outlays of investment outlays in agriculture per 1 ha of agricultural land are presented in Table 8 and in Table 9. After verification of the independent variables, it can be observed that adjusted R2 = 0.86, so the model explains 86% of variability of total investment outlays in agriculture per 1 ha of agricultural land, the adjustment of panel model was much weaker in this case and reached only 56% of explanatory power of within variability (in time) and 2% of between variability (differences between voivodeships). Total investment outlays in agriculture per 1 ha of agricultural land are strongly correlated with the following variables: X2—average farm area, X3—sale of land from the National Center for Agricultural Support, X4—employed persons in agriculture.
Based on the results of the regression analysis, it can be concluded that the total gross investment in agriculture per 1 ha of agricultural land is primarily influenced by average farm area by 1 ha will result in an increase of investment outlays in agriculture by 4.070 PLN per 1 ha of agricultural land. Additionally, the increased sale of land from the National Center for Agricultural Support by 1 thousand ha will decrease the total gross investment in agriculture by 290 PLN per 1 ha of agricultural land. The increase of employment by 1 thousand persons will increase the total gross investment in agriculture by 2.210 PLN per 1 ha of agricultural land.
In Table 10 and Table 11, we present the factors that may affect outlays on fixed assets for environmental protection. After verification of independent variables, it can be observed that adjusted R2 = 0.99, so the model explains 99% of variability of outlays for fixed assets for environmental protection. As in the previous cases, the adjustment of panel model was much weaker. Based on the results of the regression analysis, it can be concluded that outlays on fixed assets for environmental protection is primarily influenced by X2—average farm area and X3—sale of land from the National Center for Agricultural Support.
Economic growth has at negative impact on the environment, especially the global climate [99]. One of the resources that is affected by global climate change is water. Proper water management requires actions to protect water sources and provide sufficient capacity. Water can be contaminated by industrial plants and intensive agriculture production. Additionally, the nitrogen and phosphorus surplus in agriculture can contaminate surface water [100].
Table 12 and Table 13 present the impact of chosen factors on outlays on fixed assets for water management. After verification of independent variables, it can be observed that adjusted R2 = 0.99, so the model explains 99% of variability of outlays on fixed assets for water management. As in the previous cases the adjustment of panel model was much weaker, and the only variable which proved to be significant is the number of employed in agriculture. The outlays on fixed assets for water management were influenced by following variables: X1—total gross value of fixed asset, X2—average farm area, X3—sale of land from the National Center for Agricultural Support and X5—gross domestic product increase.

4.3. Stationary and Non-Stationary Autoregression and the Prognosis of Investment and Factors Shaping It

Therefore, an ARIMA model was estimated to test if the investment in agriculture and factors shaping them depend on the previous values in the period under examination (Table 14). The authors of the paper have calculated phi, which are the parameters of the auto-regressive (AR) component model (starting with the lowest lag), and theta, which are the parameters of the moving-average (i.e., MA) component model (starting with the lowest lag).
The next step was to check how many lags should be taken into account when constructing the ARMA model. For this purpose, the Auto- and Cross-Covariance and Correlation ACF and PACF functions were processed. The function ACF computes (and by default plots) estimates of the autocovariance or autocorrelation function. The PACF function is used for the partial autocorrelations.
In order to examine further changes in the investment in agriculture and factors shaping them, a forecast was developed (Table 15). The analysis shows that the total gross value of fixed assets in agriculture and hunting (−3.8%) and employed persons in agriculture (2.0%) will decrease in the years 2019–2023.
The outlays on fixed assets for water management will stay the same in the years 2019–2023.
Our initial analysis shows that the highest increase in 2023 in comparison to 2019 will be observed in land sold from the State Agency (246.2%), outlays on fixed assets for environmental protection (29.0%), investment outlays in agriculture per 1 ha of agricultural land (9.7%), and total investment outlays in agriculture (7.8%). The smallest increase will be observed in 2022 in comparison to 2018 in average farm area (3.7%) and gross domestic product increase (2.7%).

4.4. Discussion

In this paper, the authors wanted to show the meaning of investment in agriculture and the environment. Moreover, we wanted to check which factors determine the investment in Polish agriculture and environment. Our analysis found that farmers increased the level of investment in Poland.
One of the main reasons for the weakening of the propensity to invest among farmers is the difficult weather situation, which adversely affects farmers’ income. In addition, many farms also struggle with the problem of animal diseases, including African Swine Fever (ASF). Expensive loans and high machinery prices are among the factors that discourage investment. Farmers most often finance the purchase of machinery with their own resources, plus financial support under EU subsidies and loans.
Agriculture in Poland shows great regional variation in terms of production potential, production structure, and management efficiency. Thus, the conditions and investment needs in this sector vary across the country [26]. Our analysis has confirmed big differences in investment outlays in agriculture in Poland. The highest investment outlays were observed in Wielkopolskie voivodeship, Mazowieckie voivodeship, Warmińsko-Mazurskie voivodeship, and Podlaskie voivodeship. The lowest investments in agriculture in 2017 were found in the Świetkorzyskie voivodeship, Podkarpackie voivodeship, and Lubuskie voivodeship. Such differences of investment have created an effect of division of Polish farms into large and small investment. This can be the effect of differences in farm area of farms.
Agriculture is the third largest source of greenhouse gases in Europe, accounting for more than 10% of emissions. Sustainable and more environmentally friendly agriculture is a direction that can reduce greenhouse gas emissions. Biodiversity, protection of species and ecosystems, and a greater balance between nature and agriculture should be factors regulating the amount of funding for investments in agriculture and the environment, both in Poland and the entire EU.
Investments in environmental protection are also important, as they will contribute to the improvement of the quality of discharged sewage, lessening of damage to the so-called public goods, reduction of emissions of substances into the air (greenhouse gases), and optimization of emission charges. The investments realized in environment protection are coherent with the sustainable development paradigm. Among the investors in the field of environmental protection, the most important groups are enterprises, municipalities, and budgetary units. These investors have to adjust their activity to changing legal solutions and requirements [100].

5. Conclusions

The investment increase of Polish agriculture has many sources. First of all, the requirements of the CAP forced Polish farmers to invest. Polish agriculture faced strong international competition and had to introduce technological, organizational, and biological advances. This helped to renew fixed assets that resulted in the realization of current production processes and their development [26]. However, the share of fixed assets in agriculture in Polish farms is still very high (more than 80%). Such a situation can cause low capital efficiency. The fixed production assets transfer only part of their value to the final products. That is why such a structure is unfavorable and the renewal of capital is difficult. Some authors claim that the flow of investment in fixed assets is an important indicator of a country’s industrial structure. So, investment is a necessary activity to improve the efficiency of those sectors of the economy and is a common phenomenon found in many industrialized countries [101].
As a result of the investments carried out, farms may obtain economic, organizational, and social benefits. The main economic benefits are increased revenues and reduced costs. The organizational benefits, on the other hand, consist of improving the quality of processes of increasing flexibility or faster response to needs. Organizational benefits, in turn, are in the creation of an organizational culture or staff development [15].
The high employment in agriculture can hinder the investment and structural changes in agriculture and decrease the utilization of the existing workforce in rural areas. Our research has confirmed the second hypothesis. The overpopulation in rural areas in Poland has a negative impact on investment.
The investment and CAP have led to the increased demand for agricultural land. One factor in particular has been a state policy related to agricultural production support [71]. Since 1 September 2017, the Agricultural Property Agency and Rural Market Agency has been linked into the National Center for Agricultural Support (KOWR). This is a Polish state legal entity that is an executive agency [102].
The policy makers and farmers should consider the assessment of socio-economic and environmental impact of investments. The rural areas and farms may benefit from proper policy concerning innovation and the environmental issues. The policies may be prepared at different levels, for example, crop rotation, livestock, fertilizers, or pesticide use [74].
Better care of agriculture at the level of policy makers can increase the new functions of agriculture such as enhancement of the rural landscape, viability of rural areas, the rural pleasure landscape, and the maintenance of biodiversity [74,80]. The policy makers should consider the following components: social, economic, and environmental [103]. That is why the more effective methods of conservation biodiversity, particularly in lands used for agricultural production and rural areas, should be introduced [76].
New regulations of agricultural land sales introduced in Poland will reduce the number of transactions and eligible owners. This will lead to smaller agricultural land price increases. Hence, it will result in greater price differences for agricultural land in Poland relative to other EU countries. As a result, the demand for cheaper land in Poland from foreign investors will increase.
Agricultural land in central EU countries (to which Poland belongs) is cheaper in comparison to western EU countries such as Holland, Germany, and France. This creates an incentive to buy the land in central EU countries by richer western EU farmers and entrepreneurs. This occurrence is common because of the immobility of land. Poland, as the largest among the east EU countries, can be the leader in establishing agricultural land policy in this region of the EU.
Transfer of agricultural land from small farms to large farms in Poland is slow due to cultural reasons and a tradition of giving land to natural successors, who mainly are family members. The tradition of keeping land in family hands and as a family legacy will allow farmers to keep land in Poland. Small farms do not have economic strength to reproduce their assets. That is why the lease or sale of land or collective use of machinery is recommended [104,105].
The value of investment outlays in Polish agriculture more than doubled in the years 2000–2018. This was the effect of integration with the EU and support of agriculture within the CAP. The result was the inflow of modern machinery and investments in buildings that enabled an increase in production and improved the conditions for animals and investment in land. The National Center for Agricultural Support (KOWR) will remain the most important institution managing the flow of state land to private farms in Poland. The newest regulations will help to stem the flow of land to foreign investors and businesses. This will have two impacts. First, it will keep prices of agricultural land at a lower level that will help local farmers acquire land. However, it will also enlarge the differences in agricultural land prices between Poland and other EU countries.
Among factors that determined the investment outlays in Polish agriculture were average farm area, employed people in agriculture, and sale of land from the State Agency. Additionally, the increase of investment was connected with farm area increase, which confirms investment in buying agricultural land. Our analysis confirms the findings of Fagarasi et al. [74], who found that large and economically powerful farms made the most investment. Their investment includes new machinery and facilities used in the agricultural production. Small farms, which are more numerous, invest on a smaller scale, which means these farms have difficulty recovering the value of fixed assets.
Our prognosis suggests that total investment outlays in Polish agriculture in the years 2019–2023 will increase. Particular growth will be observed in land sold from the State Agency (246.2%), outlays on fixed assets for environmental protection (29.0%), investment outlays in agriculture per 1 ha of agricultural land (9.7%), and total investment outlays in agriculture (7.8%). This will be the effect of the CAP, which is the key instrument shaping positive changes in Polish agriculture.

Author Contributions

Conceptualization, P.B. and M.G.; methodology, P.B. and M.G.; software, P.B. and M.G.; validation, P.B., M.G., A.B.-B. and A.P.; formal analysis, P.B., M.G., A.B.-B.; investigation, P.B., M.G., A.B.-B.; resources, P.B.; data curation, P.B., M.G., A.B.-B.; writing—original draft preparation, P.B., M.G., A.B.-B., A.P., K.J.J.; J.W.D., writing—review and editing, P.B., M.G., A.B.-B., A.P., J.W.D.; visualization, P.B., M.G., A.B.-B., A.P., J.W.D., K.J.J.; supervision, P.B.; M.G., project administration, P.B.; funding acquisition, P.B. All authors have read and agreed to the published version of the manuscript.

Funding

This paper was prepared within the project financed by National Science Center (NCN) in Poland, 2018/29/B/HS4/00392. The funders had no role in the design of the study; in the collection, analyses, or interpretation of data; in the writing of the manuscript, or in the decision to publish the results.

Acknowledgments

The authors would like to express their thanks to the editor and the reviewers for their valuable comments and for the detailed suggestions they made on how to improve the paper.

Conflicts of Interest

The authors declare no conflict of interest.

References

  1. Hallam, D. Foreign investment in developing country agriculture-issues, policy implications and international response. In Proceedings of the Global Forum of International Investment, Paris, France, 7–8 December 2009. [Google Scholar]
  2. Tilman, D.; Balzer, C.; Hill, J.; Befort, B.L. Global food demand and the sustainable intensification of agriculture. Proc. Natl. Acad. Sci. USA 2011, 108, 20260–20264. [Google Scholar] [CrossRef] [PubMed] [Green Version]
  3. Purola, T.; Lehtonen, H. Evaluating profitability of soil-renovation investments under crop rotation constraints in Finland. Agric. Syst. 2020, 180, 1–11. [Google Scholar] [CrossRef]
  4. Thornton, P.K.; Whitbread, A.; Baedeker, T.; Cairns, J.; Claessens, L.; Baethgen, W.; Bunn, C.; Friedmann, M.; Giller, K.E.; Herrero, M.; et al. A framework for priority-setting in climate smart agriculture research. Agric. Syst. 2018, 167, 161–175. [Google Scholar] [CrossRef]
  5. Paul, C.; Techen, A.-K.; Robinson, J.S.; Helming, K. Rebound effects in agricultural land and soil management: Review and analytical framework. J. Clean Prod. 2019, 227, 1054–1067. [Google Scholar] [CrossRef]
  6. Hajjar, R.; Newton, P.; Adshead, D.; Bogaerts, M.; Maguire-Rajpaul, V.A.; Pinto, L.F.G.; McDermott, C.L.; Milder, J.C.; Wollenberg, E.; Agrawal, A. Scalling up sustainability in commodity agriculture: Transferability of governance mechanisms across the coffee and cattle sectors in Brazil. J. Clean Prod. 2016, 124–132. [Google Scholar] [CrossRef]
  7. McArthur, J.W.; Mccord, G.C. Fertilizing growth: Agricultural inputs and their effects in economic development. J. Dev. Econ. 2017, 127, 133–152. [Google Scholar] [CrossRef]
  8. Vila, L.E.; Cabrer, B.; Pavía, J.M. On the relationship between knowledge creation and economic performance. Technol. Econ. Dev. Econ. 2015, 21, 539–556. [Google Scholar] [CrossRef]
  9. Rico, P.; Cabrer-Borrás, B. Entrepreneurial capital and productive efficiency: The case of the Spanish regions. Technol. Econ. Dev. Econ. 2019, 25, 1363–1379. [Google Scholar] [CrossRef]
  10. Mojsoska, S.; Gerasimoski, S. Functioning of Investment Funds in Republic of Macedonia in Terms of Changing Environment. Proc. Soc. Behav. Sci. 2012, 44, 446–452. [Google Scholar] [CrossRef] [Green Version]
  11. Tomich, T.P.; Lidder, P.; Coley, M.; Gollin, D.; Meinzen-Dick, R.; Webb, P.; Carberry, P. Food and agricultural innovation pathways for prosperity. Agric. Syst. 2018, 172. [Google Scholar] [CrossRef]
  12. Fugile, K. R&D capital, R&D spillovers, and productivity growth in world agriculture. Appl. Econ. Perspect. Pol. 2017. [Google Scholar] [CrossRef]
  13. Wójcicki, Z.; Rudeńska, B. Działalność inwestycyjna w badanych gospodarstwach rodzinnych. Investment activity in the researched family farms. Probl. Inż. Rol. 2013, 3, 5–16. [Google Scholar]
  14. Sierpińska, M.; Jachna, T. Assessment of the Enterprise According to World Standards; PWN: Warszawa, Poland, 1997. [Google Scholar]
  15. Pietrzak, M. Inwestycje w majątek trwały a wyniki ekonomiczne-finansowe spółdzielni mleczarskich Investments in fixed assets and economic performance of dairy cooperatives. Zesz. Nauk. SGGW Warszawiež 2014, 106, 97–110. [Google Scholar]
  16. Vakrinienė, S.; Pabedinskaitė, A. Heuristc analysis of investment strategy. Technol. Econ. Dev. Econ. 2006, 12, 62–68. [Google Scholar] [CrossRef] [Green Version]
  17. Kahraman, C.; Kaya, I. Investment analyses using fuzzy probability concept/investicijų analizė taikant tikimybinę neapibrėžtųjų aibių koncepciją. Technol. Econ. Dev. Econ. 2010, 16, 43–57. [Google Scholar] [CrossRef]
  18. Arljukova, I. Problems preventing air companies from efficient investment activities. Technol. Econ. Dev. Econ. 2008, 14, 247–259. [Google Scholar] [CrossRef]
  19. Kata, R. Wykorzystania kredytu bankowego w finansowaniu rolnictwa w Polsce i w innych krajach Unii. Problem of bank credit use in financing agriculture in Poland and other states of the European Union. Acta Sci. Pol. Oeconomia 2010, 9, 145–156. [Google Scholar]
  20. Buchta, S.; Buchta, T. Impact of the investment grants from the European funds on the development of agriculture and rural areas. Agric. Econ. Czech 2009, 55, 59–66. [Google Scholar] [CrossRef] [Green Version]
  21. Pawlak, J. Investment outlays in Polish agriculture. Prob. Agric. Econ. 2016, 3, 143–158. [Google Scholar] [CrossRef]
  22. Antonelli, M.; Siciliano, G.; Turvani, M.E.; Rulli, M.C. Global investments in agricultural land and the role of the EU: Drivers, scope and potential impacts. Land Use Policy 2015, 47, 98–111. [Google Scholar] [CrossRef]
  23. Kramer, B.; Schorr, A.; Doluschitz, R.; Lips, M. Short and medium-term impact of dairy barn investment on profitability and herd size in Switzerland. Agric. Econ. Czech 2019, 65, 270–277. [Google Scholar] [CrossRef] [Green Version]
  24. Drejerska, N.; Gołębiewski, J. The Role of Poland’s Primary Sector in the Development of the Country’s Bioeconomy. Riv. Econ. Agrar. 2017, 3, 311–326. [Google Scholar] [CrossRef]
  25. Kusz, D. Zróżnicowanie Regionalne Nakładów Inwestycyjnych w Rolnictwie Polskim; Regional Differentiation of Investment Input in Polish Agriculture; Zeszyty Naukowe SGGW w Warszawie, Ekonomika Organizacja Gospodarki Żywnościowej; BazEkon: Warszawa, Poland, 2009; Volume 75, pp. 80–89. [Google Scholar]
  26. Nowak, A.; Kamińska, A. Regionalne Zróżnicowanie Nakładów Inwestycyjnych w Rolnictwie w Polsce; Regional Differentiation of Investment Input in Polish, Agriculture; Zeszyty Naukowe SGGW w Warszawie, Ekonomika Organizacja Gospodarki Żywnościowej; Uniwersytet Przyrodniczy w Lublinie: Lublin, Poland, 2013; Volume 103, pp. 17–27. [Google Scholar]
  27. Lehtonen, H. Impact of de-coupling agricultural support on diary investment and milk production volume in Finland. Acta Agric. Scand. Sect. C Food Econ. 2004, 1, 46–62. [Google Scholar] [CrossRef]
  28. Hovinen, M.; Resmussen, M.D.; Pyörälä, S. Under health of cows changing from tie stalls or free stalls with conventional milking to free stalls with either conventional or automatic milking. J. Dairy Sci. 2009, 92, 3696–3703. [Google Scholar] [CrossRef] [Green Version]
  29. Czyżewski, B.; Matuszczak, A. Towards measuring political rents in agriculture: Case studies of different agrarian structures in the EU. Agric. Econ. Czech 2018, 64, 101–114. [Google Scholar] [CrossRef] [Green Version]
  30. Dries, L.; Swinnen, J.F. Foreign direct investment, vertical integration, and local suppliers: Evidence from the Polish dairy sector. World Dev. 2004, 32, 1544. [Google Scholar] [CrossRef]
  31. Kleinbaum, J.D.G.; Kupper, L.L.; Muller, K.E.; Nizam, A. Applied Regression Analysis and Other Multivariable Methods; Duxbury Press: London, UK, 1998. [Google Scholar]
  32. Syska, J. Współczesne Metody Analizy Regresji Wspomagane Komputerowo; Modern computer-assisted regression analysis methods; Uniwersytet Śląski: Katowice, Poland, 2014. [Google Scholar]
  33. Guth, M.; Smędzik-Ambroży, K. Economic resources versus the efficiency of different types of agricultural production in regions of the European union. Econ. Res. Ekon.a Istraž. 2019. [Google Scholar] [CrossRef] [Green Version]
  34. Parzonko, A. Zasoby czynników produkcji i ich wykorzystanie w typowych gospodarstwach mlecznych na świecie. Resources of Production Factors and their Utilization in the Typical Dairy Farms in the World. Rocz. Nauk. SERiA 2007, 9, 378–382. [Google Scholar]
  35. Kunasz, M. Zasoby przedsiębiorstwa w teorii ekonomii. Company’s Resources from a Perspective of the Economic Theory. Gospod. Nar. 2006, 10, 33–48. [Google Scholar] [CrossRef]
  36. Blaug, M. Teoria Ekonomii: Ujęcie Retrospektywne; Economic Theory: Retrospective Approach; WN PWN: Warszawa, Poland, 2000. [Google Scholar]
  37. Smędzik-Ambroży, K. Zasoby a Zrównoważony Rozwój Rolnictwa w Polsce po Akcesji do Unii Europejskiej; Resources and Sustainable Development of Agriculture in Poland after Accession to the European Union; PWN: Warszawa, Poland, 2019. [Google Scholar]
  38. Latruffe, L. Competitiveness, Productivity and Efficiency in the Agricultural and Agri-Food Sectors; OECD Food, Agriculture and Fisheries Working Papers; INRA-Agrocampus Ouest: Rennes, France, 2010; Volume 30. [Google Scholar]
  39. Mulale, K.; Chanda, R.; Perkins, J.S.; Magole, L.; Sebego, R.J.; Althopheng, J.R.; Mphinyane, W.; Reed, M.S. Formal institutions and their role in promoting sustainable land management in Boteti, Botswana. Land Degrad. Develop. 2014, 25, 80–91. [Google Scholar] [CrossRef]
  40. Panagos, P.; Imeson, A.; Meusburger, K.; Borrelli, P.; Poesen, J.; Alewell, C. Soil conservation in Europe: Wish or reality. Land Degrad. Develop. 2016, 27, 1547–1551. [Google Scholar] [CrossRef] [Green Version]
  41. Meijl, H.; Van Rheenen, T.; van Tabeaau, A.; Eickhout, B. The impact of different policy environments on agricultural land use in Europe. Agric. Ecosyst. Environ. 2006, 114, 21–38. [Google Scholar] [CrossRef]
  42. Marks-Bielska, R. Factors shaping the agricultural land market in Poland. Land Use Policy 2013, 30, 791–799. [Google Scholar] [CrossRef]
  43. Johnson, D.G. The decling importance of natural resources: Lessons from Agricultural Land. Resour. Energy Econ. 2002, 24, 157–171. [Google Scholar] [CrossRef]
  44. De Chazal, J.; Rounsevell, M.D.A. Land-use and climate change within assessments of biodiversity change: A review. Glob. Environ. Chang. 2009, 19, 306–315. [Google Scholar] [CrossRef]
  45. Bakker, M.M.; Alam, S.J.; van Dijk, J.; Rounsevell, M.D.A. Land-use change as the result of rural land exchange: An agent-based simulation model. Landsc. Ecol. 2014, 1–14. [Google Scholar] [CrossRef] [Green Version]
  46. Ondetti, G. The social function of property, land rights and social welfare in Brazil. Land Use Policy 2016, 50, 29–37. [Google Scholar] [CrossRef]
  47. Lange, A.; Siebert, R.; Barkman, T. Sustainability in land management: An analysis of stakeholder perceptions in rural northern Germany. Sustainability 2015, 7, 683–704. [Google Scholar] [CrossRef] [Green Version]
  48. Klaus, M. Sustainable land management a new approach for implementation. From pharids to geoinformatics. In Proceedings of the FIG Work ng Week 2005 and GSDI-8, Cario, Egypt, 16–21 April 2005. [Google Scholar]
  49. Kaphengst, T. Towards a Definition of Global Sustainable Land Use? A Discussion on Theory, Concepts and Implications for Governance; Discussion paper produces within the research project. GLOBALANDS Global Land Use Sustainability; Eco Logic: Berlin, Germany, 2014. [Google Scholar]
  50. Brekke, K.A. Economic Growth and the Environment: On the Measurement of Income and Welfare; Edward Elgar: Cheltenham, UK, 1997. [Google Scholar]
  51. Grzelak, A. Determinanty zasobowe procesów reprodukcji majątku gospodarstw rolnych prowadzących rachunkowość rolną (FADN). Resource determinants of reproduction processes of assets of farms engaged in agricultural accountancy (FADN). Rocz. Nauk. SERiA 2015, 17, 69–74. [Google Scholar]
  52. Kuś, J.; Matyka, M. Zmiany organizacyjne w polskim rolnictwie w ostatnim 10-leciu na tle rolnictwa UE Organization changes in Polish agriculture in the last 10 years on the background of EU. Zagadnienia Ekon. Rolnej 2014, 341, 50–67. [Google Scholar]
  53. Ruttan, V.W. Productivity Growth in Word Agriculture: Sources and Constraints in Economics of Sustainable Development; Asefa, S., Ed.; Upjohn Institute for Employment Research: Kalamazoo, MC, USA, 2005. [Google Scholar]
  54. European Union. The Agricultural Situation in the European Union; Annual Reports; European Union: Brussels, Belgium, 2008. [Google Scholar]
  55. Škare, M.; Sinković, D.; Parada-Rochoń, M. Financial development and economic growth in Poland 1990-2018. Technol. Econ. Dev. Econ. 2019, 25, 103–133. [Google Scholar] [CrossRef] [Green Version]
  56. CSO. Central Statistical Office in Warsaw 2019. Available online: https://stat.gov.pl/ (accessed on 10 August 2020).
  57. Agricultural Land Market-State and Perspectives 22; Institute of Agricultural and Food Economics, National Research Institute: Warsaw, Poland, 2019.
  58. Environment 2018. GUS Warsaw 2018. Available online: https://stat.gov.pl/obszary-tematyczne/srodowisko-energia/srodowisko/ochrona-srodowiska-2018,1,19.html (accessed on 20 July 2020).
  59. Sobczyk, M. Statystyka; Statistics; PWN: Warszawa, Poland, 2005. [Google Scholar]
  60. Arellano, M. Panel Data Econometrics; Oxford University Press: Oxfordshire, UK, 2003. [Google Scholar]
  61. Sztaudynger, J.J. Nieliniowość wpływu stopy inwestycji na wzrost gospodarczy. Nonlinearity of the impact of the investment rate on economic growth. Ekonomista 2003, 6, 775–794. [Google Scholar]
  62. Borrmann, C. Methodological Problems of FDI Statistics in Accession Countries and EU Countries; Hamburgisches Welt-Wirtschafts-Archiv Report; Hamburg Institute of International Economics: Hamburg, Germany, 2003; p. 231. [Google Scholar]
  63. Hamulczuk, M.; Hertel, K.; Klimkowski, C.; Stańko, S. Wybrane Problemy Prognozowania Detalicznych Cen Żywności; Selected Problems of Forecasting Retail Food Prices; Instytut Ekonomiki Rolnictwa i Gospodarki Żywnościowej—Państwowy Instytut Badawczy: Warszawa, Poland, 2004. [Google Scholar]
  64. Choi, B.S. ARMA Model Identification; Springer: Berlin/Heidelberg, Germany, 1992. [Google Scholar]
  65. Routa, M.; Majhi, B.; Majhi, R.; Panda, G. Forecasting of currency exchange rates using an adaptive ARMA model with differential evolution based training. J. King Saud Univ. Comput. Inf. Sci. 2014, 26, 7–18. [Google Scholar] [CrossRef] [Green Version]
  66. De Jonga, P.; Penzerb, J. The ARMA model in state space form. Stat. Probab. Lett. 2004, 70, 119–125. [Google Scholar] [CrossRef]
  67. Box, G.E.; Pierce, D.A. Time Series Analysis: Forecasting and Control; Holden—Dey: San Francisco, CA, USA, 1970. [Google Scholar]
  68. Czyżewski, B.; Matuszczak, A.; Miśkiewicz, R. Public goods versus the farm price-cost squeeze: Shaping the sustainability of the EU’S Common Agricultural Policy. Technol. Econ. Dev. Econ. 2019, 25, 82–102. [Google Scholar] [CrossRef] [Green Version]
  69. Johnson, D.G. Reducing the Urban-Rural Income Disparity; Paper No. 00-07; University of Chicago: Chicago, IL, USA, 2000. [Google Scholar]
  70. Bórawski, P.; Bełdycka-Bórawska, A.; Szymańska, E.J.; Jankowski, K.J.; James, W.; Dunn, J.W. Price volatility of agricultural land in Poland in the context of the European Union. Land Use Policy 2019, 82, 486–496. [Google Scholar] [CrossRef]
  71. Bórawski, P.; Bełdycka-Bórawska, A.; Szymańska, E.J.; Jankowski, K.J.; Dubis, B.; Dunn, J.W. Development of renewable Energy sources market and biofuels in the European Union. J. Clean. Prod. 2019, 228, 467–484. [Google Scholar] [CrossRef]
  72. Lili, L.; Peng, Q. The impact of Chjna’s investment increase in fixed assets on ecological environment: An empirical analysis. Energy Proc. 2011, 5, 501–507. [Google Scholar] [CrossRef] [Green Version]
  73. Khatri-Chhetri, A.; Pant, A.; Aggarwal, P.K.; Vasireddy, V.V. Stakeholders prioritization of climate-smart agriculture interventions: Evaluation of a framework. Agric. Syst. 2019, 174, 23–31. [Google Scholar] [CrossRef]
  74. Fagarasi, J.; Wieliczko, B.; Wigier, M.; Tóth, K. Financing of Agriculture and Investment Supports in Agriculture Structural Changes in Polish and Hungarian Agriculture Since Eu Accession; Lessons learned and implications for the design of future agricultural policies; Potori, N., Chmieliński, P., Fieldsend, A.F., Eds.; Research Institute of Agricultural Economics: Budapest, Hungary, 2014. [Google Scholar]
  75. Vercammen, J. Farm bankruptcy risk as a link between direct payments and agricultural investment. Eur. Rev. Agric. Econ. 2007, 34, 479–500. [Google Scholar] [CrossRef]
  76. Bakucs, L.Z.; Fertő, I.; Fogarasi, J. Investment and financial constraints in Hungarian agriculture. Econ. Lett. 2009, 104, 122–124. [Google Scholar] [CrossRef]
  77. Latruffe, L. The impact of credit market imperfections on farm investment in Poland. Post Communist Econ. 2005, 17, 349–362. [Google Scholar] [CrossRef]
  78. Swinnen, J.F.M.; Gow, H.R. Agricultural credit problems and policies during the transition to market economy in Central and Eastern Europe. Food Policy 1999, 24, 21–47. [Google Scholar] [CrossRef] [Green Version]
  79. Steward, P.R.; Thierfelder, C.; Dougill, A.J.; Ligowe, I. Conservation agriculture enhances resistance of maize to climate stress in a Malawin medium-term trial. Agric. Ecosyst. Environ. 2019, 277, 95–104. [Google Scholar] [CrossRef]
  80. Kling, C.L.; Kathleen, S.; Shogren, J.F. Environmental economics: How agricultural economists help advance the field. Am. J. Agric. Econ. 2010, 92, 487–505. [Google Scholar] [CrossRef]
  81. EC (European Communities). Environmental Expenditure Statistics; Industry data collection handbook; Office for Official Publications of the European Communities: Luxemburg, 2002. [Google Scholar]
  82. Bowers, J. Economics Growth and Sustainable Environment; Farm income and the benefits of environmental protection; Collard, D., Pearce, D., Ulph, D., Eds.; Palgrave Macmillan: London, UK, 1998; pp. 161–171. [Google Scholar]
  83. Levers, C.; Butsic, V.; Verburg, P.H.; Müller, D.; Kuemmerle, T. Drivers of changes in agricultural intensity in Europe. Land Use Policy 2016, 58, 380–393. [Google Scholar] [CrossRef] [Green Version]
  84. Godfray, H.C.J. The challenge of feeding 9–10 billion people equitable and sustainably. J. Agric. Sci. 2014, 152, 2–8. [Google Scholar] [CrossRef]
  85. Geissdoerfer, M.; Vladimirowa, D.; Enavs, S. Sustainable business model innovation: A review. J. Clean. Prod. 2018, 198, 401–416. [Google Scholar] [CrossRef]
  86. Rashid, A.; Asif, F.M.A.; Krajnik, P.; Nicolescu, C.M. Resource Conservative Manufacturing: An Essentials change in business and technology paradigm for sustainable manufacturing. J. Clean. Prod. 2013, 57, 166–177. [Google Scholar] [CrossRef]
  87. Krzyżaniak, M.; Stolarski, M.J.; Warmiński, K. Life cycle assessment of Virginia Maslow production with different fertilisation options. J. Clean. Prod. 2018, 177, 824–836. [Google Scholar] [CrossRef]
  88. Petit-Boix, A.; Leipold, S. Circular economy in cities: Reviewing how environmental research aligns with local practices. J. Clean. Prod. 2018, 195, 1270–1281. [Google Scholar] [CrossRef]
  89. Lifset, R.; Graedel, T.E. Industrial ecology: Goals and definitions. A Handbook. Ind. Ecol. 2002, 3–15. [Google Scholar] [CrossRef]
  90. Laskowska, E. The market of agricultural land in Poland in the European market. Prob. World Agric. 2014, 14, 140–149. [Google Scholar]
  91. Janssen, S.; van Ittersum, M.M. Assessing farm innovations and responses to policies: A review of bio-economic farm models. Agric. Syst. 2007, 94, 622–636. [Google Scholar] [CrossRef]
  92. Corrado, S.; Rydberg, T.; Oliveira, F.; Cerutti, A.; Sala, S. Out of sight out of mind? A life cycle-based environmental assessment of goods traded by the European Union. J. Clean. Prod. 2020, 246. [Google Scholar] [CrossRef] [PubMed]
  93. Brodzińska, K. Problems of Biodiversity Conservation in Polish Agriculture. Agroecol. Sustain. Food Syst. 2015, 39, 155–169. [Google Scholar] [CrossRef]
  94. Cieślak, K.; Pawlewicz, K.; Pawlewicz, A. Sustainable Development in Polish Regions: A Shift-Share Analysis. Pol. J. Environ. Stud. 2019, 28, 565–575. [Google Scholar] [CrossRef]
  95. Kołoszko-Chomentowska, Z. The economic consequences of supporting organic farms by public funds: Case of Poland. Technol. Econ. Develop. Econ. 2015, 21, 332–350. [Google Scholar] [CrossRef]
  96. Bórawski, P.; Bełdycka-Bórawska, A.; Jankowski, K.; Dubis, B.; Dunn, J.W. Development of wind energy market in the European Union. Renew. Energy 2020, 161, 691–700. [Google Scholar] [CrossRef]
  97. Andreoni, V. Environmental taxes: Drivers behind the revenue collected. J. Clean Prod. 2019, 221, 17–26. [Google Scholar] [CrossRef]
  98. Takashima, N. Cooperative R&D investments and licensing breakthrough technologies: International environmental agreements with participation game. J. Clean. Prod. 2020, 248. [Google Scholar] [CrossRef]
  99. Bórawski, P.; Gotkiewicz, W.; Bełdycka-Bórawska, A.; Szymańska, E.J.; Brelik, A.; Harper, J.K.; Dunn, J.W. Changes in grassland and their impact on milk production in Poland in the context of Environmental Protection. Pol. J. Environ. Stud. 2020, 29, 1–12. [Google Scholar] [CrossRef]
  100. Kurlavičius, A. Sustainable agricultural development: Knowledge-based decision support. Technol. Econ. Dev. Econ. 2009, 15, 294–309. [Google Scholar] [CrossRef] [Green Version]
  101. Barret, S. Climate treaties and “breakthrough” technologies. Am. Econ. Rev. 2006, 96, 22–25. [Google Scholar] [CrossRef]
  102. Perron, M.G.; Côte, R.P.; Duffy, J.F. Improving environmental awareness training in business. Clean. Prod. 2006, 14, 551–562. [Google Scholar] [CrossRef]
  103. Saneé-Mengual, E.; Secchi, M.; Corrado, S.; Beylot, S.; Sala, S. Assessing the decoupling of economic growth from environmental impacts in the European Union: A consumption-based approach. J. Clean. Prod. 2019, 236. [Google Scholar] [CrossRef]
  104. Galka, A. Using a cleaner production preventive strategy for the reduction of the negative environmental impacts of agricultural production-using cattle husbandry as a case study. J. Clean. Prod. 2004, 12, 513–516. [Google Scholar] [CrossRef]
  105. Mazur-Wierzbicka, E. Nakłady inwestycyjne w ochronie środowiska w Polsce. Investment outlays in the environmental protection in Poland. Prace Naukowe Uniwersytetu Ekonomicznego Wrocławiu 2015, 395, 252–262. [Google Scholar] [CrossRef]
Figure 1. Total investment outlays in agriculture (total in mln PLN current prices), investment outlays per 1 ha of agricultural lane (in PLN per 1 ha of agricultural land). Source: Author’s calculations based on [78].
Sustainability 12 08160 g001
Figure 2. Outlays on fixed assets for environmental protection and water management in bn PLN (current prices). Source: Own elaboration on the basis Environment 2019.
Sustainability 12 08160 g002
Table 1. The dependent and independent variables.
Number of VariableSpecification
Y1total investment outlays in agriculture (mln PLN)
Y2
Y3
Y4
investment outlays in agriculture per 1 ha of agricultural land.
outlays on fixed assets for environmental protection
outlays on fixed assets for water management
X1total gross value of fixed assets (in mln PLN)
X2average farm area (ha)
X3sale of land from the National Center for Agricultural Support (thousand hectares)
X4employed persons in agriculture (in thousands)
X5gross domestic product increase (%)
Table 2. Descriptive statistics of investment outlays in agriculture and hunting by voivodeships (total in mln PLN current prices).
VoivodeshipAverageMedianMinimalMaximalCoefficient of VariationSkewednessKurtosis
Poland (mln PLN)4223.14283.92408.95303.922.03−0.45−0.83
Dolnośląskie227.74241.80144.90328.2023.840.14−1.02
Kujawsko-pomorskie256.47269.20142.20342.8021.79−0.32−0.29
Lubelskie324.11327.00190.50407.4020.95−0.64−0.53
Lubuskie119.80116.9068.400179.9023.850.460.13
Łódzkie272.83267.40177.60349.8019.800.00−0.99
Małopolskie164.07166.4097.400231.7024.200.04−0.79
Mazowieckie620.14678.70301.10818.5026.720.58−0.87
Opolskie164.42160.1097.00217.8020.680.16−0.56
Podkarpackie136.50139.3081.10173.4018.92−0.76−0.10
Podlaskie302.32278.00151.50423.0027.61−0.11−0.98
Pomorskie199.48209.00116.40269.4024.61−0.34−0.95
Śląskie136.39140.5079.30201.5022.280.090.43
Świętokrzyskie118.42113.2076.20151.5019.52−0.26−1.03
Warmińsko-mazurskie265.77221.30155.10425.2031.270.53−0.96
Wielkopolskie686.42728.90360.10926.9024.06−0.50−0.62
Zachodniopomorskie223.02206.70165.60303.8021.310.53−1.03
Source: Own elaboration on the basis of Central Statistical Office (CSO) data.
Table 3. Descriptive statistics of investment outlays in agriculture and hunting by voivodeships (in PLN per 1 ha of agricultural land).
VoivodshipsAverageMedianMinimalMaximalCoefficient of VariationSkewednessKurtosis
Poland (mln PLN)278.7283.1151.4364.625.89−0.25−1.22
Dolnośląskie242.3253.6148.4360.926.270.19−1.04
Kujawsko-pomorskie241.9258.6136.0321.722.16−0.26−0.56
Lubelskie222.7227.7127.5285.223.30−0.47−0.97
Lubuskie270.1241.5142.5460.432.110.69−0.16
Łódzkie268.1273.5163.5357.724.440.03−1.26
Małopolskie270.5274.9137.3410.433.490.09−1.19
Mazowieckie309.7337.4141.0434.130.74−0.37−1.15
Opolskie315.2304.9175.1433.024.58−0.06−1.05
Podkarpackie212.4221.7107.7301.729.64−0.23−1.24
Podlaskie278.3260.0138.0397.528.96−0.05−1.07
Pomorskie264.2274.2148.2355.326.23−0.35−1.06
Śląskie322.6342.5163.2458.425.72−0.42−0.51
Świętokrzyskie228.2220.1136.9308.625.85−0.08−1.50
Warmińsko-mazurskie264.8225.0155.3450.833.120.73−0.53
Wielkopolskie387.5402.6204.5516.424.60−0.42−0.79
Zachodniopomorskie251.3216.7166.7365.227.680.49−1.24
Source: Own elaboration on the basis of CSO data.
Table 4. Factors shaping investment in Polish agriculture.
YearsX1—Total Gross Value of Fixed Assets in Agriculture and HuntingX2—Average Farm AreaX3—Sale of Land from the National Center for Agricultural SupportX4—Employed Persons in AgricultureX5—Gross Domestic Product Increase
In mln PLNHaThousand HectaresIn Thousands%
2000149,2316.81202120.44
2001142,2316.91472113.01.1
2002140,6037.21592109.01.1
2003139,9397.41022088.73.7
2004135,3267.51042094.25.1
2005112,777.19.381082083.33.5
2006115,076.19.571072093.36.2
2007117,739.39.911042079.57.0
2008119,921.410.02782074.14.2
2009122,570.010.151022070.62.8
2010124,296.910.23972326.83.6
2011127,081.810.361252325.15.0
2012130,367.810.381322325.71.6
2013134,044.110.421482326.71.4
2014137,357.210.481212331.43.3
2015139,642.710.49772331.23.9
2016142,978.010.56182328.62.8
2017144,158.210.6542327.24.8
2018150,145.310.8132324.24.6
Source: Own elaboration on the basis of CSO data.
Table 5. Summary statistics of investment and factors shaping it.
VariableMedianMinimumMaximum(+/-) NumberCoefficient of VariationSkewnessKurtosis
Y1—total investment outlays in agriculture3716.002026.805303.91278.3034.30−0.1096−1.5132
Y2—investment outlays per 1 ha of agricultural land239.70116.70365.9095.3639.26−0.0065−1.5212
Y3—outlays on fixed assets for environmental protection6.905.0015.203.1737.740.7566−0.5996
Y4—outlays on fixed assets for water management2.201.303.800.7531.620.3984−0.9926
X1—total gross value of fixed assets3726.432026.805367.401278.318.69−0.2819−1.1348
X2—average farm area10.156.8010.811.4415.31−0.9324−0.8677
X3—sale of land from the National Center for Agricultural Support104.003.00159.0045.2846.35−1.00120.16685
X4—employed persons in agriculture2120.402070.602331.40121.065.490.07743−1.9570
X5—gross domestic product increase3.901.107.001.6644.36−0.04889−0.61483
Source: Own elaboration on the basis of CSO data.
Table 6. Regression analysis of total investment outlays in agriculture.
SpecificationCoefficientStd. Errort-RatioR2Fp-Value
Const−8043.43409.3−2.3590.0334
X1—total gross value of fixed assets−0.330
X2—average farm area3.440
X3—sale of land from the National Center for Agricultural Support−0.280540.70.8625.860.000
X4—employed persons in agriculture1.930
X5—gross domestic product increase−2.400
Source: Own elaboration on the basis of CSO data.
Table 7. Panel regression of total investment in agriculture in Polish voivodeships in the years 2005–2017.
Total InvestmentCoefficient.Standard Errorp-Value
X1—total gross value of fixed assets in agriculture and hunting0.0246890.00260020.00
X2—average farm area23.6829710.946720.032
X3—sale of land from State Agency−0.0015960.00095440.096
X4—employed persons in agriculture−0.0002150.00021040.919
X5—gross domestic product increase−5.0232341.3606240.000
Constant term−195.7816144.88320.178
R-sq
Within:0.4749Number of obs:192
Between:0.2553Number of groups:16
Overall:0.2682
Source: Own elaboration on the basis of CSO data.
Table 8. Regression analysis of investment outlays in agriculture per 1 ha of agricultural land.
SpecificationCoefficientStd. Errort-RatioR2Fp-Value
Const−719.90231.74−3.110.008
X1—total gross value of fixed asset−0.250
X2—average farm area4.070
X3—sale of land from the National Center for Agricultural Support−0.29036.750.85924.260.000
X4—employed persons in agriculture2.210
X5—gross domestic product increase−2.500
Table 9. Panel regression in Polish voivodeships in the years 2005–2017.
Investment Outlays per 1 ha of Agricultural LandCoef.Standard Errorp Value
X1—total gross value of fixed assets in agriculture and hunting0.017330.00248860.000
X2—average farm area58.8359610.476730.000
X3—sale of land from State Agency−0.00292610.00091340.002
X4—employed persons in agriculture0.00071670.00020130.000
X5—gross domestic product increase−5.2660741.3022070.000
Constant term−685.0846138.66280.000
R-sq
Within:0.5577Number of obs:192
Between:0.0212Number of groups:16
Overall:0.0267
Source: Own elaboration on the basis of CSO data.
Table 10. Regression analysis of outlays on fixed assets for environmental protection.
SpecificationCoefficientStd. Errort-RatioR2dfFp-Value
Const−31.9113.50−2.360.033
X1—total gross value of fixed asset0.00
X2—average farm area1.14
X3—sale of land from the National Center for Agricultural Support0.872.140.995.14360.340.000
X4—employed persons in agriculture0.26
X5—gross domestic product increase0.11
Source: Own elaboration on the basis of CSO data.
Table 11. Panel regression in Polish voivodeships in the years 2005–2017.
Investment Outlays per 1 ha of Agricultural LandCoef.Standard Errorp Value
X1—total gross value of fixed assets in agriculture and hunting−0.7176516.310130.965
X2—average farm area18,645.0568,665.150.786
X3—sale of land from State Agency−0.00292615.9867820.001
X4—employed persons in agriculture0.00071671.3195640.520
X5—gross domestic product increase−11,988.288534.7410.162
Constant term199,099.6908,804.20.827
R-sq
Within:0.0788Number of obs:192
Between:0.1017Number of groups:16
Overall:0.0236
Source: Own elaboration on the basis of CSO data.
Table 12. Regression analysis of outlays on fixed assets for water management.
SpecificationCoefficientStd. Errort-RatioR2dfFp-Value
Const−11.903.24−3.670.003
X1—Total gross value of fixed asset0.07
X2—Average farm area0.82
X3—Sale of land from the National Center for Agricultural Support0.040.510.996990.960.000
X4—Employed persons in agriculture−0.05
X5—Gross domestic product increase0.22
Source: Own elaboration on the basis of CSO data.
Table 13. Panel regression in Polish voivodeships in the years 2005–2017.
Outlays on Fixed Assets for Water ManagementCoef.Standard Errorp Value
X1—Total gross value of fixed assets in agriculture and hunting7.03410822.436830.754
X2—Average farm area69,995.8894,458.370.460
X3—Sale of land from State Agency1.17568.2356420.887
X4—Employed persons in agriculture3.9718221.8152420.030
X5—Gross domestic product increase4267.99711,740.710.717
Constant term−13,443,5761,120,1850.284
R-sq
Within:0.0360Number of obs:192
Between:0.0292Number of groups:16
Overall:0.0014
Source: Own elaboration on the basis of CSO data.
Table 14. ARIMA model of investment outlays in Polish agriculture.
VariableCoefficientStd. Errorzp-ValueCoefficientStd. Errorzp-Value
Total investment outlays in agriculturephi_10.9650.07412.930.003theta_10.3560.3551.0050.315
Investment outlays in agriculture per 1 ha of agricultural landphi_10.9710.06914.030.001theta_10.3040.3160.9620.336
Outlays on fixed assets for environmental protectionphi_10.6420.2622.4420.015theta_10.1410.6110.2320.817
Outlays on fixed assets for water managementphi_10.5350.2212.4190.016theta_10.5000.2611.9120.056
Total gross value of fixed assets in agriculture and huntingphi_10.8260.1405.8840.004theta_10.2610.2321.1230.262
Average farm areaphi_10.8870.1725.1440.002theta_1−0.1270.475−0.2670.790
Land sold from the State Agencyphi_10.8590.3162.7170.007theta_10.2460.5060.4870.627
Employed persons in agriculturephi_10.8470.1266.7130.001theta_10.0480.2470.1960.844
Gross domestic product increasephi_10.1080.2890.3720.710theta_10.5880.2062.8590.004
Table 15. Prognosis of investment and factors having an impact on them in the years 2019–2023.
Variable20192020202120222023
PredictionStd. ErrorPredictionStd. ErrorPredictionStd. ErrorPredictionStd. ErrorPredictionStd. Error
Total investment outlays in agriculture5446.4249.45558.8413.55667.3522.05772.2606.05873.5675.0
Investment outlays in agriculture per 1 ha of agricultural land373.016.3382.526.45391.733.3400.638.6409.243.1
Outlays on fixed assets for environmental protection6.22.26.92.97.43.17.83.28.03.2
Outlays on fixed assets for water management2.40.52.40.72.40.72.40.82.40.8
Total gross value of fixed assets in agriculture and hunting149,965.45825.3148,103.38605.0156,564.410,071.8145,292.710,961.3144,241.711,529.4
Average farm area10.70.410.90.510.90.511.00.611.10.6
Land sold from the State Agency9.325.116.437.422.544.327.748.832.251.9
Employed persons in agriculture2307.658.42292.878.52280.390.22269.797.72260.7102.8
Gross domestic product increase3.71.33.81.63.81.63.81.63.81.6

