Article

The Impact of Using Small-Scale Irrigation Motor Pumps on Farmers’ Household Incomes in Ethiopia: A Quasi-Experimental Approach

by
Wubamlak Ayichew Workneh
1,*,
Jun Takada
1 and
Shusuke Matsushita
2
1
Graduate School of Life and Environmental Sciences, University of Tsukuba, Tsukuba 305-8572, Japan
2
Faculty of Life and Environmental Sciences, University of Tsukuba, Tsukuba 305-8572, Japan
*
Author to whom correspondence should be addressed.
Sustainability 2020, 12(19), 8142; https://doi.org/10.3390/su12198142
Submission received: 27 August 2020 / Revised: 24 September 2020 / Accepted: 30 September 2020 / Published: 2 October 2020

Abstract

:
Sectoral economic growth data in Ethiopia show that the agriculture sector has the lowest growth, which is caused by frequent drought and inefficient technologies, among other factors. As a result, the productivities of land and labor, as well as the income of small-scale farm households, are very low, and rural areas have a relatively high poverty rate. A quasi-experiment was applied to understand the impact of using small-scale irrigation motor pumps on farmers’ livelihood improvement. Specifically, a survey was conducted in 2019 on a sample of 92 small-scale irrigation motor pump and canal irrigation users as the treatment and control groups. The weighted propensity score matching method was applied to eliminate initial differences and adjust sampling proportions across the groups. Based on the average treatment effect on the treated estimation results, we cannot state that the mean income difference in small-scale irrigation motor pump users and canal irrigation system users is different from zero. This indicates that countries with little capital to invest in large-scale irrigation projects can introduce household-level small-scale irrigation motor pumps to improve farmers’ incomes.

1. Introduction

Ethiopia has been one of the fastest-growing economies worldwide since 2003/2004, with an average real gross domestic product (GDP) growth rate of 10.1% [1,2]. From Figure 1a,b, sectoral economic growth data show that agriculture has the lowest growth in Ethiopia, despite the large labor force involved in it [1].
One reason for the slower growth of agriculture is the low share of investment in this sector, which only accounts for 4.2% of the total investment capital in the country [1,3]. As a result, the productivities of land and labor, as well as the income of farm households (HH), are very low. Furthermore, agriculture is dependent on natural rainfall and is easily affected by drought, which negatively affects production and productivity. This results in the prevalence of a relatively high poverty rate in rural areas, an average of 25.6%, whereas the urban poverty rate is 14.8% [4,5]. Additionally, in Table 1, cross-sectional data from the World Bank show that Ethiopian farmers have the lowest farm income [6]. Therefore, Ethiopian farmers must make more efforts to transform the agriculture sector so that it reaches the level of modern agriculture and set long-term targets to achieve higher incomes.
The advancement of irrigation technologies can boost these extremely low levels of production and productivity by creating alternative sources of water for agricultural production [7,8]. This is expected to improve the income of small-scale farm HH. Recently, the Ethiopian government has started paying attention to the expansion of irrigation projects to increase production and productivity. Specifically, it planned to increase the area of land covered by irrigation from 2.34 million hectares in 2014/2015 to 4.14 million hectares by the end of 2019/2020 and provide access to at least one alternative water point for 1.74 million ha of additional irrigated land [9].
Many researchers found that using irrigation motor pumps or canal irrigation has a positive impact on HH income [10,11,12,13]. Therefore, we hypothesized that there is no significant difference between the mean incomes of small-scale irrigation motor pump (SSIMP) users and small-scale canal irrigation system (SSCIS) users (H0: ATTSSIMP-ATTSSCIS = 0). This is due to the similarity in soil types, technology level, agricultural extension awareness, and availability of alternative water sources for both groups. Alternatively, we argued that, because of differences in farm size and the number of people in the labor force, there will be a significant difference between the mean incomes of SSIMP users and SSCIS users (H1: ATTSSIMP-ATTSSCIS ≠ 0).
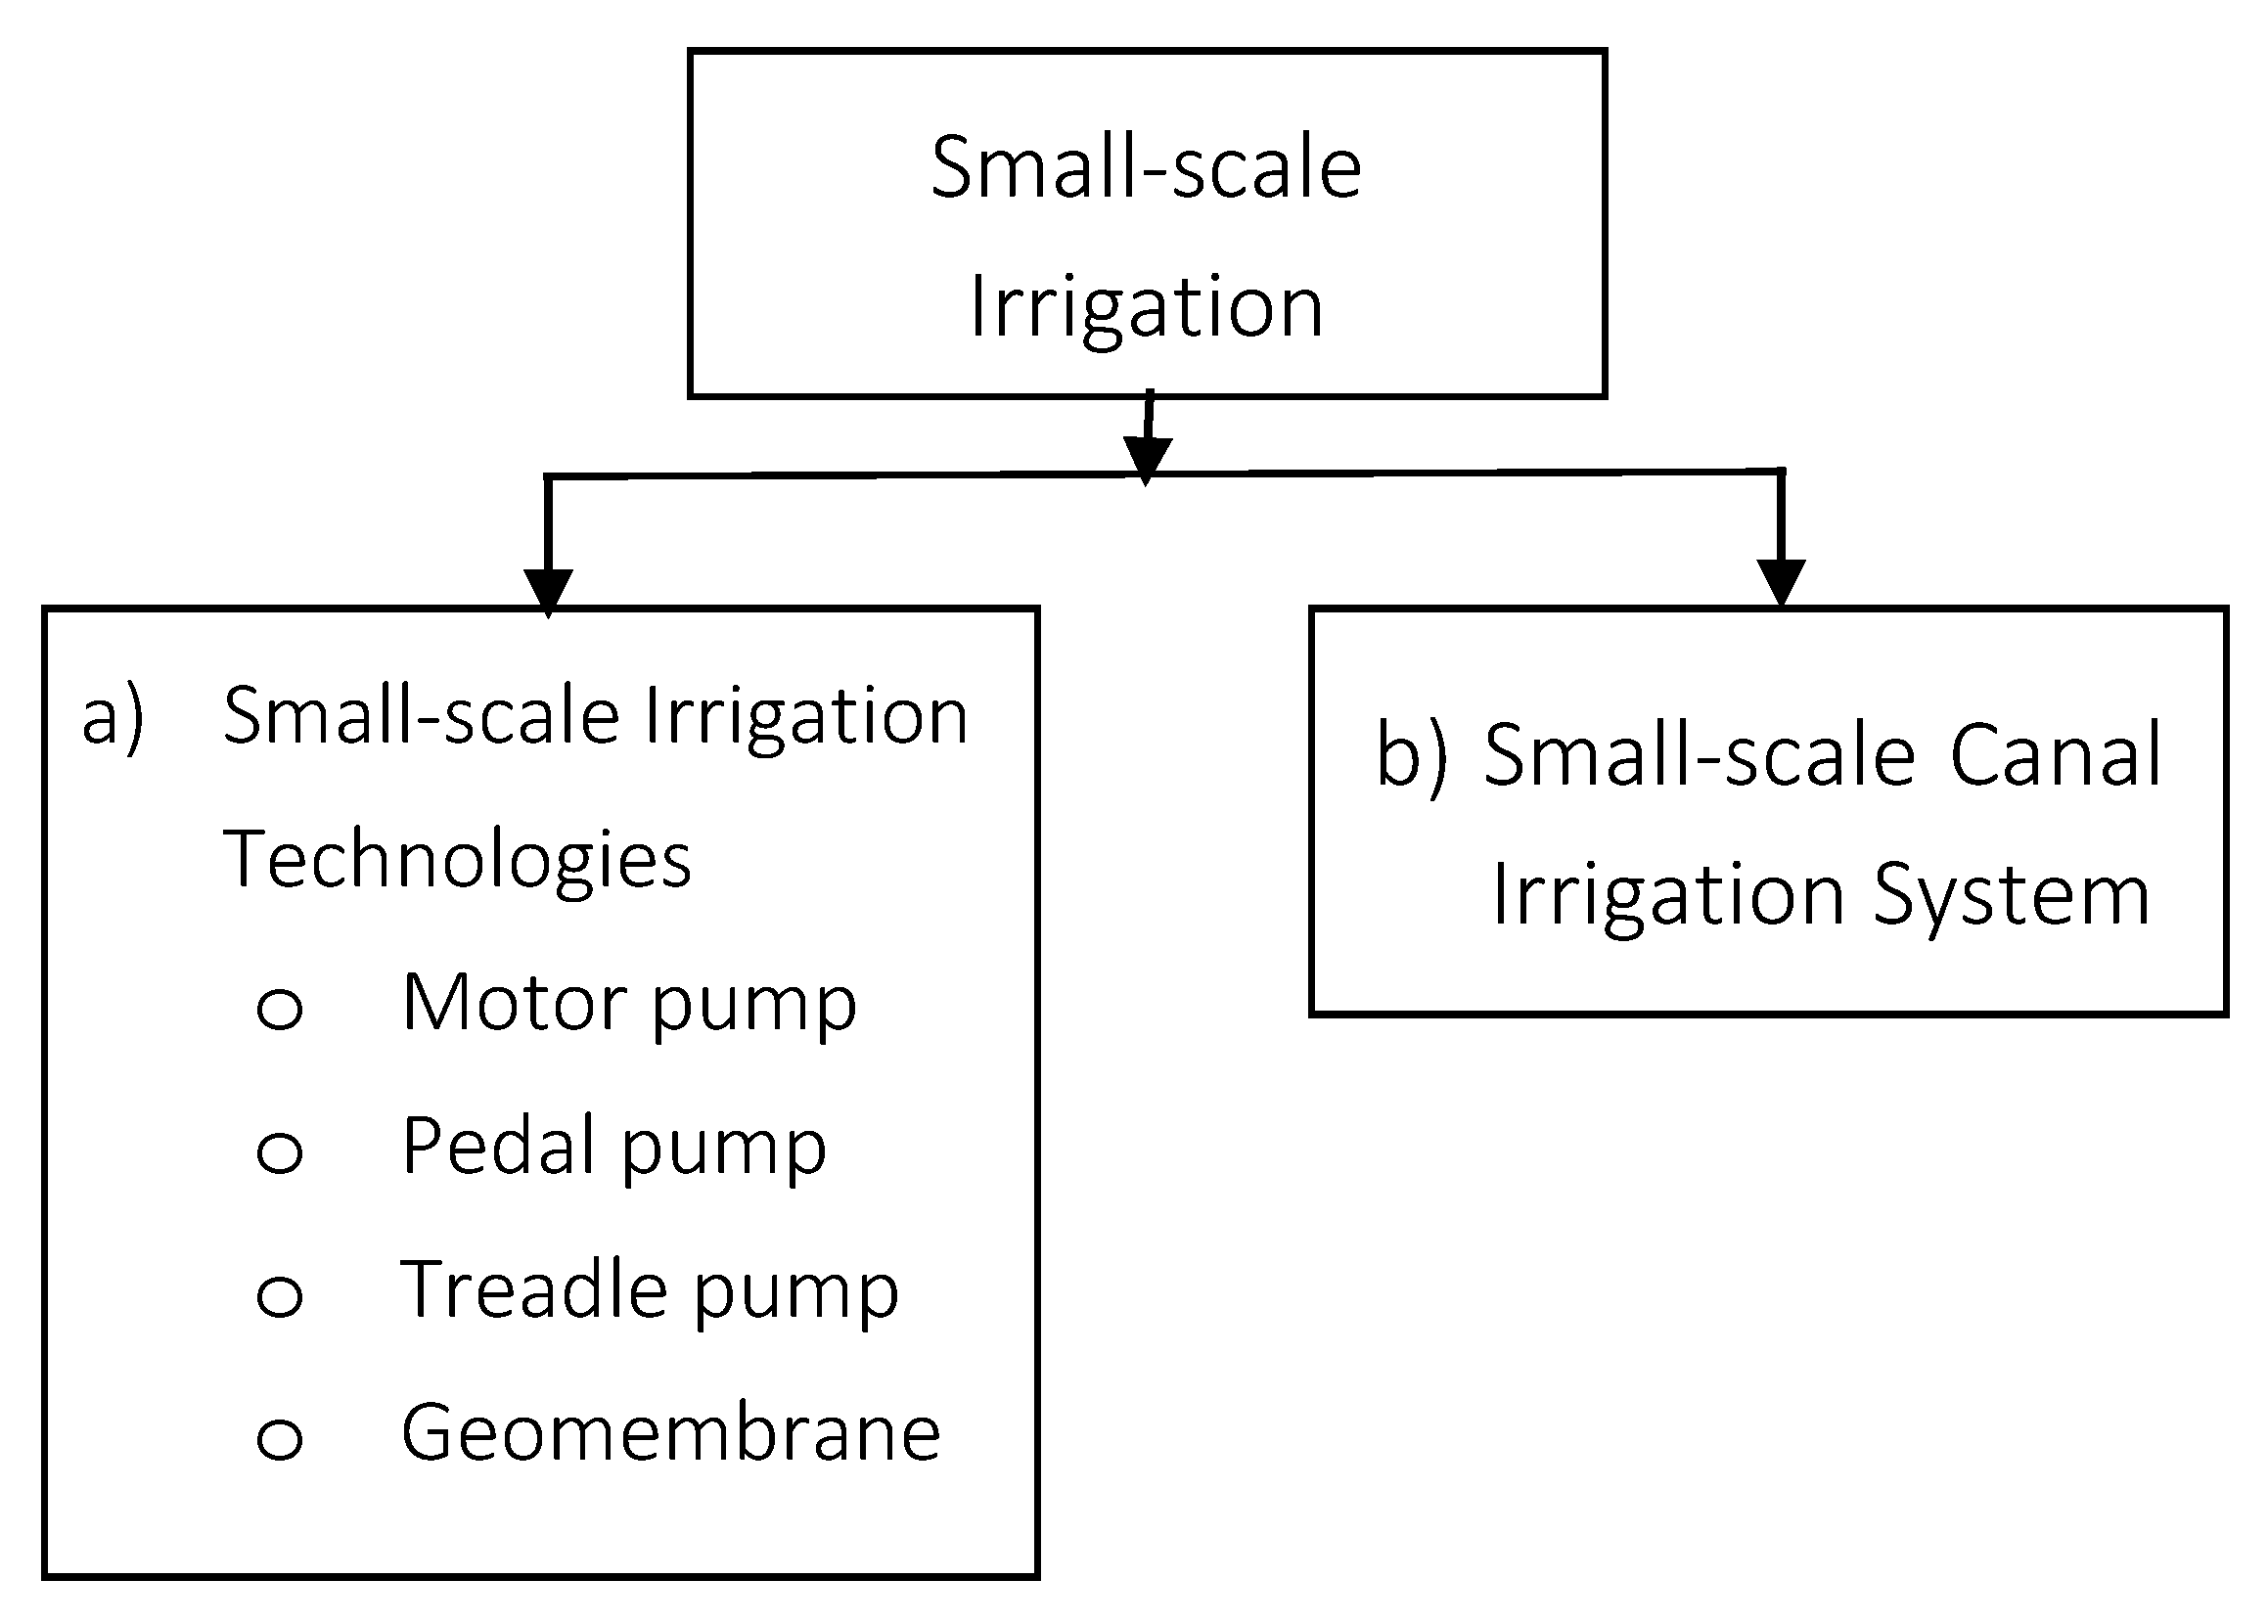
This study compared the difference between the impacts of the two treatment groups, SSIMP users and SSCIS users, instead of the differences between SSIMP users and non-irrigation users. It also measured the benefits of using household-level alternative SSIMP when SSCIS is not accessible. Specifically, we measured the impact of using SSIMP on farmers’ livelihood improvement. The types of small-scale irrigations are presented in Figure 2.
As discussed below, most studies have tried to evaluate the impact of irrigation on livelihood improvement based on data from irrigation users and non-users. Ahmed et al. [14] used a random sample of 200 HHs and employed propensity score matching (PSM) to determine the impact of irrigation on HH income and food security status in the Oromia region in Ethiopia. The estimation results showed that the farm income and calorie intake of irrigation users improved compared with non-users. Gebregziabher et al. [15] used a sample of 613 farm HHs to measure the impact of irrigation participation on income in the Tigray region in Ethiopia. They applied an experimental method and found that irrigation users’ income is higher than the regional average, whereas non-users’ income is 50% lower. Enyew et al. [16] found, based on a sample of 313 HHs from the Rift Valley Lake Basins in Ethiopia, that irrigation improved HH income and contributed to poverty reduction.
Differing from earlier research, this study used a quasi-experimental approach to evaluate the comparative advantage of using SSIMPs in cases where SSCIS is not available. The study enhances the current understanding of: (1) the expanded application of experimental methods using two treated groups instead of the conventional treated and non-treated groups; and (2) the benefit of using HH-level alternative irrigation technologies in cases where canal irrigation is not applicable.

2. Materials and Methods

2.1. Sampling and Data Collection

This study was conducted in the Debre Eliyas district, Ethiopia. Debre Eliyas is located in the East Gojjam administrative zone in the Amhara national regional state. In the study area, for 12 existing small-scale canal irrigation projects, the total size of irrigable land before 2007 had increased sixfold by 2018, which improved the income of an additional 831 HHs. Furthermore, household-level small-scale irrigation technologies (SSIT) were also distributed, which improved the livelihood of 705 HHs with no access to an SSCIS.
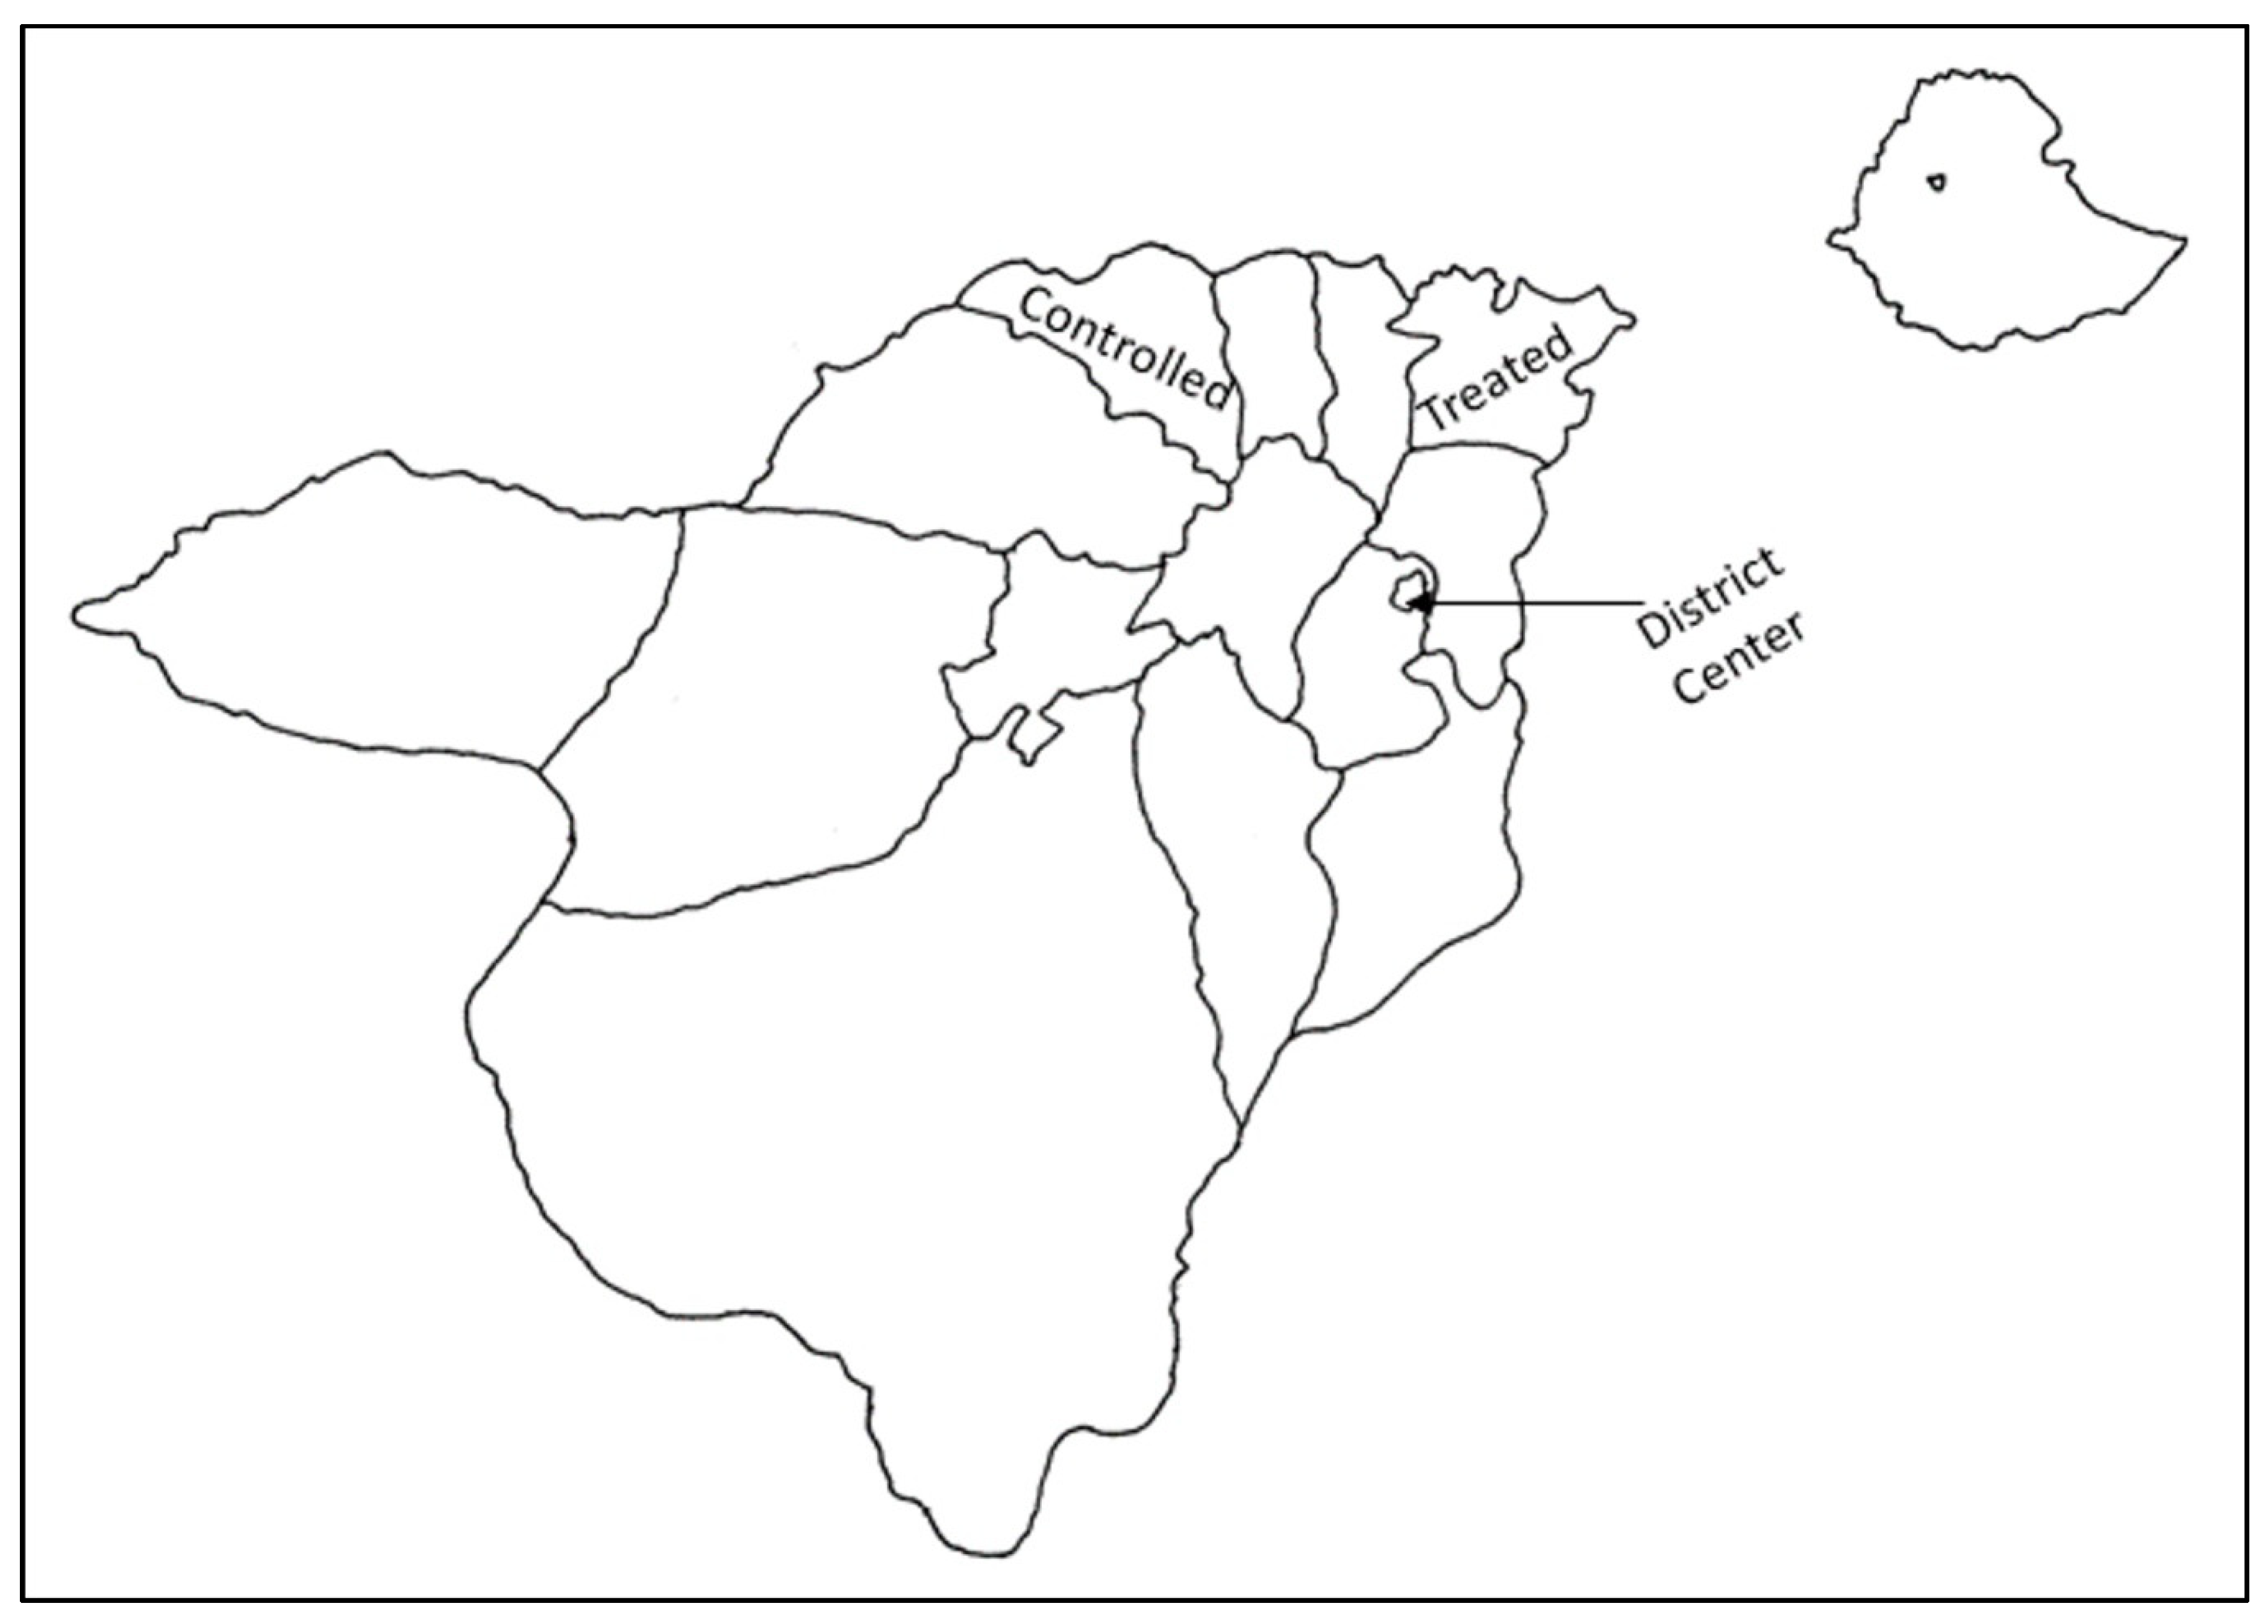
Our target population was naturally placed under two different treatments (see Figure 3). One is located near the Gedeb river, which is not used for canal irrigation, and the other near a canal irrigated area, namely the Shimburit II small-scale irrigation dam. All 17 HHs located near the Gedeb river have started using SSIMP. In total, 324 HHs are located within the command area of the Shimburit II small-scale irrigation dam. Based on this, we constructed a study sample by randomly selecting 75 HHs from the SSCIS users and all 17 SSIMP users. Because of the low number of SSIMP users in the population, applying random selection would mean the probability of selecting an SSIMP user would be nearly zero. Furthermore, PSSIMP = 17/341 = 5%, which is too small to use in the estimation. Instead, we attached weights to the selected samples to balance the sampling rate and representation [17,18], (Table 2).
We used a structured questionnaire containing questions on HH demographic characteristics, sources of income, components of expenditure, savings, and credit information. It was challenging to collect the income of rural HHs directly, as they are engaged in multiple livelihood activities whose contributions are difficult to quantify [19,20]. Furthermore, because of the strong association between income and expenditure in low-income countries, and the fact that GDP is estimated with an expenditure survey, we used HH expenditure as a proxy measure for HH income [19,20,21,22,23].
In the expenditure section of the survey, we included food consumption expenditure (e.g., purchased foods, own production, donations), non-food consumption expenditure, non-consumption expenditure (e.g., remittance, gamming), savings, and credit information. Therefore, the expenditure approach to the HH income represents the sum of all expenditures made by a HH, including savings, investment, and credit repayment [19,20].
The questionnaire was pretested with 10 randomly selected farmers, and we found that it is suitable for the survey. Next, in consultation with the Debre Eliyas district office of agriculture and the office of the district chief administration, we selected five enumerators to conduct face-to-face interviews in the selected kebeles. Detailed practical training was given to the enumerators, and survey guidelines were prepared for quick reference. Then, the house-to-house survey was conducted during 5–9 June 2019 (i.e., over five days). The authors conducted daily follow-ups during the survey period.

2.2. Data Analysis Method

We adopted a quasi-experimental method to scale the treatment effect of using SSIMP on farmers’ HH incomes. For each SSIMP user, we have an expected income of y1, and y0 otherwise. As such, the difference between the two expected incomes (y1y0) is the treatment effect of using SSIMP [24]. However, an individual cannot be in two states (user and non-user) during the survey. Therefore, from the non-users, we constructed a comparison group using PSM, that is, the probability of being in the SSIMP user group, to estimate the average treatment effect (ATE) of using SSIMP [25,26,27,28]. Since SSIMPs are distributed by the office of agriculture in a district, we did not conduct a baseline survey for each farmer to measure the initial differences across treatment and control groups.
Assume M = 1 for SSIMP users, and M = 0 otherwise.
The expected income of farmer i is given by:
Y i = M i Y 1 i + ( 1 M i ) Y 0 i
We cannot observe both outcomes for an individual farmer as he/she will be either in the treatment or the control group. Therefore, the expected income of any individual farmer is given by:
Y i = { y 1 i , i f M i = 1 y 0 i , i f M i = 0
We constructed a comparison group of non-SSIMP users conditional on propensity scores, P(X). Then, the ATE is given by:
A T E = E [ y 1 | M = 1 , P ( X ) ] E [ y 0 | M = 0 , P ( X ) ] , A T E = { E [ y 1 | M = 1 , P ( X ) ] E [ y 0 | M = 1 , P ( X ) ] } + { E [ y 0 | M = 1 , P ( X ) ] E [ y 0 | M = 0 , P ( X ) ] } .
Selection bias was eliminated by PSM, and SSIMP and non-SSIMP users became observationally similar, conditional on the observed covariates [29].
A T E S S I M P = E [ y 1 | M = 1 , P ( X ) ] E [ y 0 | M = 0 , P ( X ) ] , A T E S S I M P = A T T S S I M P ,  
where E [ y 0 | M = 1 , P ( X ) ] = E [ y 0 | M = 0 , P ( X ) ] .
Mostly, ATE is used in cases where there are both treated and untreated groups [30]. However, we applied ATE to evaluate the impact differences between two experimental groups with different treatments: SSIMP and SSCIS users.
Assume D = 1 for SSIMP users and D = 0 otherwise, and B = 1 for SSCIS users and B = 0 otherwise. Then, the difference between the two ATEs conditional on observed covariates is given by:
ATE SSIMP & SSCIS = E ( y 1 | D = 1 ) E ( y 1 | B = 1 ) = { [ E ( y 1 | D = 1 ) E ( y 0 | D = 1 ) ] + [ E ( y 0 | D = 1 ) E ( y 0 | D = 0 ) ] }   { [ E ( y 1 | B = 1 ) E ( y 0 | B = 1 ) ]   +   [ E ( y 0 | B = 1 ) E ( y 0 | B = 0 ) ] } ,
ATT ( E ) = ATT ( E ) SSIMP ATT ( E ) SSCIS
Selection bias was cleared by PSM, and the difference in the average treatment effect on the treated (ATT(E)) of the two groups is the ATT(E) of using SSIMPs on motor pump users [25,26]. Then, assuming M = 1 for SSIMP users and 0 for SSCIS users, Equation (5) will be equal to Equation (4), on the condition of the observed covariates.
However, the magnitude of ATT(E) in Equation (5) shows only the income differences between SSIMP and SSCIS users, not the actual income difference between SSIMP users and irrigation non-users. Variable definitions are shown in Table 3.

3. Results and Discussion

3.1. Descriptive Statistics

The descriptive statistics in Table 4 show that, on average, a farm HH has five family members, two of whom are full-time workers, two part-time workers, and the remaining one is either under working age or retired. The average age of the HH head is 45 years old and 77% of them are married. Regarding physical resources, they have an average of six cattle, three sheep and/or goats, one transporting animal, and 1.71 ha of farmland, of which 0.68 ha is irrigated.
Farmers have strong connections with agricultural development agents for daily consultations and short-term training, and half of them are model farmers. They use their own agricultural production experiences and undertake short-term training and daily consultations with development agents for crop production and animal husbandry activities. The main product is wheat.

3.2. Estimation Results

To estimate the propensity scores (PS), we included covariates associated with the treatment assignment and outcome variable, as well as weights for each sample, to balance the sampling rate difference [31]. The number of people in the family classified as the working labor force and who owned farmland were the covariates included in the PS estimation. The PS was estimated with a logit model using the data from the survey design. As shown in Table 5, the weights attached to the sample groups improved the significance level of the variables.
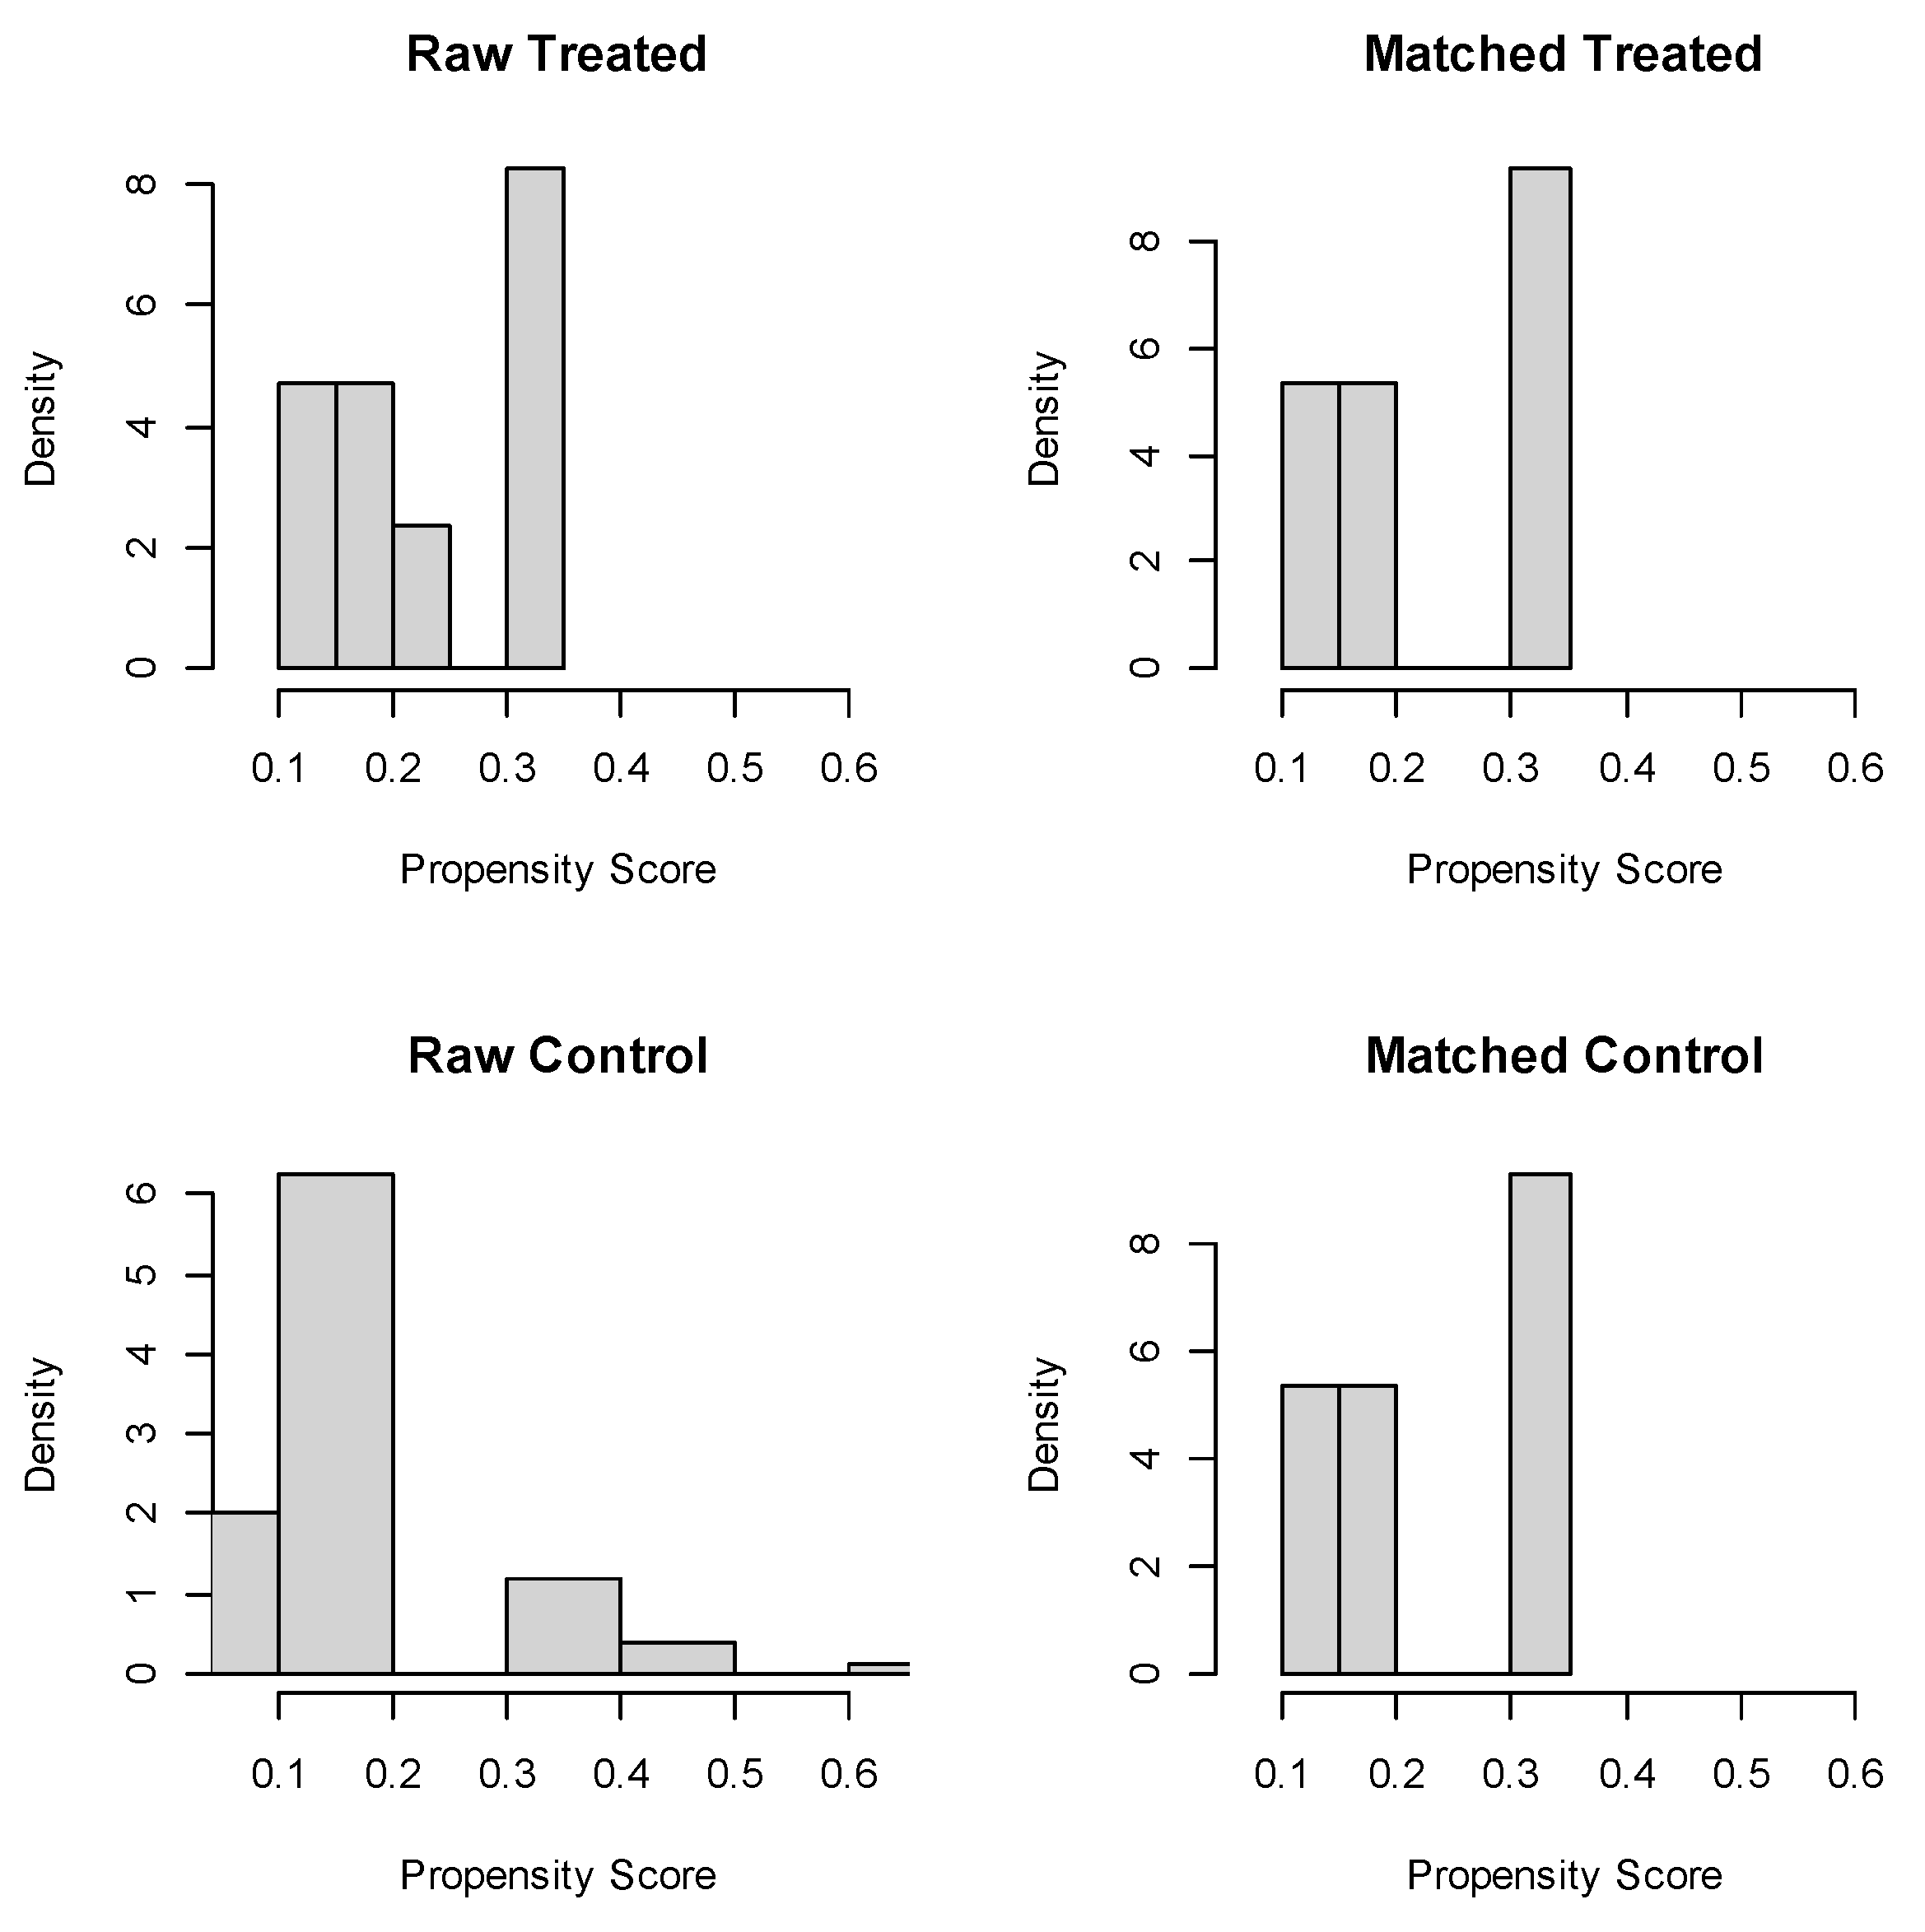
Then, using the calculated PS, we minimized the dimensions of covariates into scalar variables to match the SSIMP users and SSCIS users [32]. As shown in Table 6 and Figure 4, nearest neighbor matching (NNM) with 0.25 and 0.1 calipers was found to provide better matches, as the standardized mean differences are below 5% [25] and the histograms of the two groups are similar. Likewise, before matching, the mean value of PS in the treated group was 96% higher than that of the control group, and, after matching, it was reduced to 0%. Table 7 illustrates that the mean values of the working labor force and land ownership were, respectively, 0.5 and 20% higher in the control group than in the treated groups before matching, and were both 0% after matching. Moreover, the t-test of the difference in means showed an improvement after matching [25,27]. Therefore, the PSM improved the balance between the two groups, which became more similar after matching.
The treatment effect estimation result in Table 8 shows that, for all matching algorithms, p values are not significant. Therefore, we do not have sufficient support for the alternative hypothesis that the mean outcome difference in the two groups is not zero. Thus, we cannot state that the difference between the mean income of SSIMP users and SSCIS users is different from zero. Previous studies asserted that the use of irrigation technologies can improve production and productivity such that it increases HH income [14,15,16]. During field visits, farmers also confirmed that their income had improved due to the adoption of SSIMP and/or SSCIS. This study tried to measure the comparative advantage of using either of the irrigation technologies, considering both technologies have a positive impact on HH income compared with not using irrigation technologies. Therefore, the value of the estimation results shows only the mean income difference between the two treatment groups, but not the actual scale between irrigation users and non-users.
The objective of introducing SSIMPs is to provide irrigation access to farmers and improve their livelihoods. Therefore, HHs can adopt SSIMPs to gain a comparative advantage and improve HH income when large-scale irrigation is not applicable due to high investment costs. The size of irrigated farmland is dependent on the type of motor pumps distributed to farmers. From the descriptive statistics, the average farm size of small-scale farmers in the study area is 1.71 ha (2.36 ha after matching), which is above the national average of 0.9 ha [33,34]. Additionally, the average irrigable farm size is 0.68 ha (0.87 ha after matching), while the command area of the pump is around 10 ha. Furthermore, the average operational cost of irrigation motor pumps is not significantly different from the average maintenance fee of canal irrigation users. Therefore, the different treatments do not show any differences in the size of irrigable land, as well as operational costs and labor. If there are any differences between them, they are random for both treatment conditions. As a result, we considered that the only difference between these two treatments is how they access irrigation water from the source. Namely, SSIMP users access the water by pumping the river to their farmland using irrigation motor pumps and SSCIS users use the irrigation canal constructed by the regional government that passes through their farmland. Both groups cultivate, on average, an area of 0.68 ha (0.87 ha after matching) using either water source. The estimation results show that the mean income difference in the two groups cannot be statistically different from zero.
Irrigation promotes land-intensive agriculture that creates opportunities to use the large labor force in the sector intensively [35]. Irrigation non-users are dependent on natural rainfall and only produce once per year. These farmers adjust their cropping schedule based on the raining season. As such, any production plan that does not consider the rainy season is not expected to have a positive impact on production size and productivity unless using an alternative water source. Assuming other factors of production and activities are constant, the availability of an irrigation water source creates opportunities to use the land more intensively. Therefore, the availability of an irrigation water source allows farmers to increase production and productivity using available resources. First, by making decisions irrespective of the raining season, farmers can plan and produce independently from the natural rain cycle and other farmers’ production schedules based on the market demand and home consumption. However, creating an additional production cycle demands more labor. When using the natural rainfall cycle, seasonal unemployment is a problem, as extra labor is only needed during the land preparation period. Nonetheless, because of the favorable environmental conditions in the study area, using irrigation is expected to increase work opportunities and production throughout the year. Therefore, access to irrigation promotes land-, labor-, and capital-intensive agriculture that boosts the quantity of production over a year [8,28].
An increase in production size increases subsistence farmers’ HH income. As income inequality and a relatively higher poverty prevalence are current challenges in Ethiopia, an improvement in rural HH income narrows the income inequality between rural and urban HHs and also decreases the rural poverty level [16,36].
Furthermore, drought and low rainfall have been affecting the agriculture sector negatively by reducing HH production to nearly zero production in some years. In this case, small-scale farmers living on subsistence production are expected to avail the compulsory food aid. As such, access to irrigation creates a constant alternative water source, meaning that small-scale farmers can create climate-resilient agriculture with minimum environmental risks [11,37].
However, access to irrigation may create income inequality among small-scale farmers. If irrigation access does not benefit all farmers, inequality will surface in rural areas [13]. Currently, in the study area, there are many alternative types of SSITs available to all farmers to access irrigation water in each plot, namely motor pumps, pedal pumps, treadle pumps, and geomembranes. Therefore, farmers can choose the type of technology depending on the type of water source they can access. Thus, the availability of these technologies minimizes income inequality across small-scale farmers and creates a pull factor that motivates non-irrigation farmers to adopt irrigation technologies.

4. Conclusions

This study furthered the understanding of the expanded application of experimental methods using two treated groups instead of the conventionally used treated and non-treated groups. Moreover, it contributed to filling the knowledge gap on the comparative advantage of using irrigation motor pumps, which serve as alternative irrigation water sources. A quasi-experiment approach was applied to understand the impact of using SSIMP on farmers’ HH incomes in cases where SSCIS is not applicable. The treatment effect estimation results show that the mean income difference between SSIMP users and SSCIS users is not statistically significantly different from zero. This means that the introduction of SSIMPs can have a positive impact by improving the livelihood of farm HHs, similar to SSCISs. Therefore, household-level alternative irrigation motor pumps can be adopted in low-income countries, where capital is binding, to invest in large-scale irrigation dams.
Additionally, irrigation promotes land-intensive agriculture that creates opportunities to use the large labor force in the sector more intensively. It enhances production quantity and labor productivity, which further improves HH income. It also helps decrease poverty and narrows down the income inequality between rural and urban HHs.
Furthermore, as the agriculture sector has been affected by drought and low rainfall, access to irrigation creates an alternative water source that small-scale farmers can use to create climate-resilient agriculture with minimal risks. However, while it creates income inequality within rural HH with non-irrigation users, it can also be a pull factor for non-irrigation users, as there are many household-level SSITs that can easily be adopted by small-scale farmers.
In summary, the findings of this study show that SSIMPs and SSCISs can be used alternatively depending on the available water sources to improve subsistence farmers’ income.
However, the study considered a moderate sample size due to budget and time constraints. Future investigations with a relatively large sample size and a wide range of variables will enhance our understanding of alternative irrigation motor pumps.

Author Contributions

Conceptualization, W.A.W. and S.M.; methodology, W.A.W., S.M.; software, W.A.W., J.T. and S.M.; validation, W.A.W., J.T. and S.M.; formal analysis, W.A.W. and S.M.; investigation, W.A.W., J.T. and S.M.; resources, W.A.W., J.T. and S.M.; data curation, W.A.W. and S.M.; writing—original draft preparation, W.A.W.; writing—review and editing, W.A.W. and S.M.; visualization, W.A.W.; supervision, S.M.; project administration, W.W. and S.M. All authors have read and agreed to the published version of the manuscript.

Funding

This research was funded by JSPS KAKENHI, grant number JP19H00960 and JP16H02572.

Acknowledgments

We are grateful to the staff of the Agriculture office in Debre Eliyas district. Especially to Endazeze Godie, who has assigned and coordinated the enumerators. We are also indebted to Ayalew Beyene and Melaku Alemayehu for their support during our stay in Debre Eliyas district.

Conflicts of Interest

The authors declare no conflict of interest.

References

  1. National Bank of Ethiopia (NBE). National Bank of Ethiopia Annual Report; Annual Report 2018/2019; National Bank of Ethiopia: Addis Ababa, Ethiopia, 2019. [Google Scholar]
  2. IMF. Real GDP Growth Annual Percent Change. Available online: https://www.imf.org/external/datamapper/NGDP_RPCH@WEO/OEMDC/ADVEC/WEOWORLD (accessed on 17 June 2020).
  3. Ethiopian Investment Commission (EIC). Ethiopian investment Report; Annual Report 2019; Ethiopian Investment Commission: Addis Ababa, Ethiopia, 2019.
  4. Planning and Development Commission (PDC). Poverty and economic growth in Ethiopia (1995/96–2015/16); Planning and Development Commission: Addis Ababa, Ethiopia, 2018.
  5. UNDP Ethiopia. Ethiopia’s progress towards eradicating poverty. In Implementation of the Third United Nations Decade for the Eradication of Poverty (2018–2027) Discussion Paper; UNDP Ethiopia: Addis Ababa, Ethiopia, 2018. [Google Scholar]
  6. World Bank. World Development Indicators; The World Bank Data Bank: Washington, DC, USA, 2016. [Google Scholar]
  7. Wondimagegnhu, B.A.; Bogale, B.A. Small-scale irrigation and its effect on food security of rural households in North-West Ethiopia: A comparative analysis. Ethiop. J. Sci. Technol. 2020, 13, 31–51. [Google Scholar] [CrossRef]
  8. Yihdego, A.G.; Adera, A.; Gelaye, M.T. The impact of small—Scale irrigation on income of rural farm households: Evidence from ahferom woreda in Tigray, Ethiopia. Int. J. Bus. Econ. Res. 2015, 4, 217. [Google Scholar] [CrossRef]
  9. National Planning Commission (NPC). Growth and Transformation Plan II (GTP II) (2015/16–2019/20); National Planning Commission: Addis Ababa, Ethiopia, 2016; Volume I.
  10. Ali, A.; Rahut, D.B.; Behera, B. Factors influencing farmers’ adoption of energy-based water pumps and impacts on crop productivity and household income in Pakistan. Renew. Sustain. Energy Rev. 2016, 54, 48–57. [Google Scholar] [CrossRef]
  11. Mengistie, D.; Kidane, D. Assessment of the impact of small-scale irrigation on household livelihood improvement at Gubalafto District, North Wollo, Ethiopia. Agriculture 2016, 6, 27. [Google Scholar] [CrossRef] [Green Version]
  12. Tesfaye, A.; Bogale, A.; Namara, R.E.; Bacha, D. The impact of small-scale irrigation on household food security: The case of Filtino and Godino irrigation schemes in Ethiopia. Irrig. Drain. Syst. 2008, 22, 145–158. [Google Scholar] [CrossRef]
  13. Berg, M.V.D.; Ruben, R. Small-Scale irrigation and income distribution in Ethiopia. J. Dev. Stud. 2006, 42, 868–880. [Google Scholar] [CrossRef]
  14. Ahmed, B.; Mume, J.; Kedir, A. Impact of small-scale irrigation on farm income generation and food security status: The case of lowland areas, Oromia, Ethiopia. Int. J. Econ. Empir. Res. (IJEER) 2014, 2, 412–419. [Google Scholar]
  15. Gebregziabher, G.; Namara, R.E. Investment in irrigation as a poverty reduction strategy: Analysis of small-scale irrigation impact on poverty in Tigray, Ethiopia. Asian J. Agric. Dev. 2017. [Google Scholar] [CrossRef]
  16. Adugna, E.; Ermias, A.; Mekonnen, A.; Mihret, D. The role of small scale irrigation in poverty reduction. J. Dev. Agric. Econ. 2014, 6, 12–21. [Google Scholar] [CrossRef] [Green Version]
  17. Lumley, T. Analysis of Complex Survey Samples. J. Stat. Softw. 2004, 9, 1–19. [Google Scholar] [CrossRef] [Green Version]
  18. Lumley, T. Package Survey. Version 4.0. 2020. Available online: http://faculty.washington.edu/tlumley/survey (accessed on 30 May 2020).
  19. Deaton, A.; Zaidi, S. Guidelines for Constructing Consumption Aggregates for Welfare Analysis; World Bank Publications: Washington, DC, USA, 2002; Available online: http://documents.worldbank.org/curated/en/206561468781153320/Guidelines-for-constructing-consumption-aggregates-for-welfare-analysis (accessed on 29 July 2020).
  20. Anguko, A. Livelihoods in Ethiopia: Impact Evaluation of Linking Smallholder Coffee Producers to Sustainable Markets; OXFAM GB: Oxford, UK, 2015. [Google Scholar] [CrossRef]
  21. Diacon, P.-E.; Maha, L.-G. The Relationship between Income, Consumption and GDP: A Time Series, Cross-Country Analysis. Procedia Econ. Finance 2015, 23, 1535–1543. [Google Scholar] [CrossRef] [Green Version]
  22. Viet, Q.V. Measurement of GDP by final expenditure approach: An introduction. In Proceedings of the International Workshop on Measuring GDP by Final Demand Approach, Shenzhen, China, 25–27 April 2011; Available online: https://unstats.un.org/unsd/economic_stat/China/GDPFE/Measuring%20GDP%20by%20final%20expenditure%20approach-an%20introduction.pdf (accessed on 17 June 2020).
  23. Greenlaw, D.S.S.A.; Shapiro, D. Principles of Economics, 2nd ed.; Rice University, OpenStax: Houston, TX, USA, 2017. [Google Scholar]
  24. Khandker, S.; Koolwal, G.B.; Samad, H. Handbook on Impact Evaluation; World Bank: Washington, DC, USA, 2009. [Google Scholar]
  25. Caliendo, M.; Kopeinig, S. Some practical guidance for the implementation of propensity score matching. J. Econ. Surv. 2008, 22, 31–72. [Google Scholar] [CrossRef] [Green Version]
  26. Rosenbaum, P.R.; Rubin, D.B. The central role of the propensity score in observational studies for causal effects. Biometrics 1983, 70, 41–55. [Google Scholar] [CrossRef]
  27. Rosenbaum, P.R.; Rubin, N.B. Constructing a control group using multivariate matched sampling methods that incorporate the propensity score. Am. Stat. 1985, 39, 33. [Google Scholar] [CrossRef]
  28. Zeweld, W.; Van Huylenbroeck, G.; Hidgot, A.; Chandrakanth, M.G.; Speelman, S. Adoption of small-scale irrigation and its livelihood impacts in Northern Ethiopia. Irrig. Drain. 2015, 64, 655–668. [Google Scholar] [CrossRef]
  29. Rubin, N.B. Matching to Remove Bias in Observational Studies. Biometrics 1973, 29, 159. [Google Scholar] [CrossRef]
  30. Ravallion, M. Evaluating anti-poverty programs. In Measuring Aversion to Debt: An Experiment Among Student Loan Candidates; World Bank: Washington, DC, USA, 2005; Volume 4, pp. 3787–3846. [Google Scholar]
  31. Brookhart, M.A.; Schneeweiss, S.; Rothman, K.J.; Glynn, R.J.; Avorn, J.; Stürmer, T. Variable selection for propensity score models. Am. J. Epidemiol. 2006, 163, 1149–1156. [Google Scholar] [CrossRef] [Green Version]
  32. Dehejia, R.H.; Wahba, S. Propensity score-matching methods for nonexperimental causal studies. Rev. Econ. Stat. 2002, 84, 151–161. [Google Scholar] [CrossRef] [Green Version]
  33. Headey, D.; Dereje, M.; Taffesse, A.S. Land constraints and agricultural intensification in Ethiopia: A village-level analysis of high-potential areas. Food Policy 2014, 48, 129–141. [Google Scholar] [CrossRef] [Green Version]
  34. Rapsomanikis, G. The Economic Lives of Smallholder Farmers: An Analysis Based on Household Data from Nine Countries. Food and Agriculture Organization of the United Nations, 2015. Available online: http://www.fao.org/3/a-i5251e.pdf (accessed on 29 July 2020).
  35. Aseyehegu, K.; Yirga, C.; Rajan, S. Effect of Small-Scale Irrigation On The income of rural farm households: The case of Laelay Maichew district, central Tigray, Ethiopia. J. Agric. Sci. Sri Lanka 2012, 7, 43. [Google Scholar] [CrossRef] [Green Version]
  36. Bacha, D.; Namara, R.E.; Bogale, A.; Tesfaye, A. Impact of small-scale irrigation on household poverty: Empirical evidence from the Ambo district in Ethiopia. Irrig. Drain. 2011, 60, 1–10. [Google Scholar] [CrossRef]
  37. Namara, R.; Makombe, G.; Hagos, F.; Awulachew, S.B. Rural Poverty and Inequality in Ethiopia: Does Access to Small-Scale Irrigation Make a Difference? International Water Management: Colombo, Siri Lanka, 2008. [Google Scholar] [CrossRef]
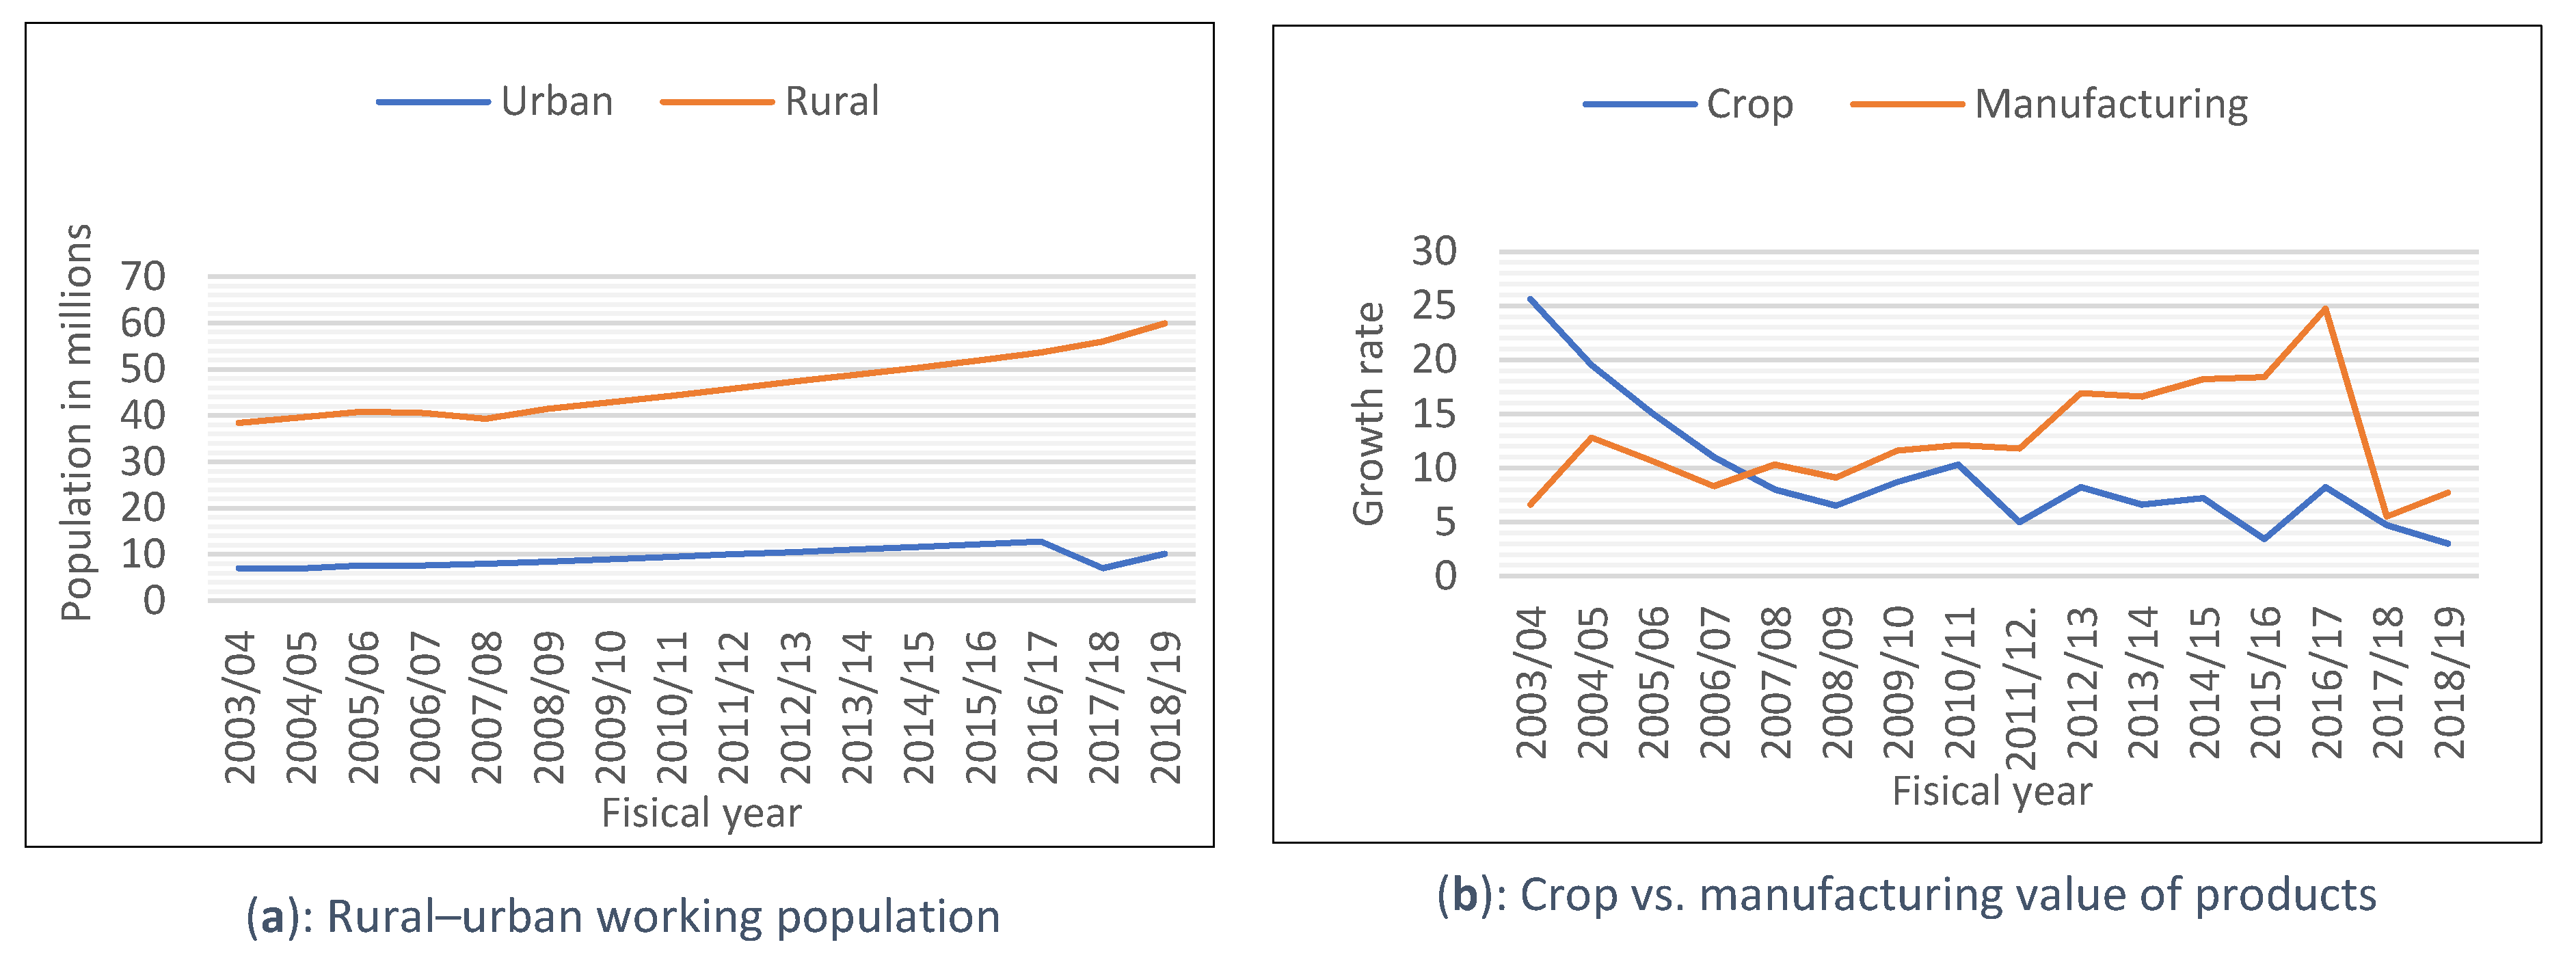
Figure 1. (a) Rural–urban working population; (b) crop vs. manufacturing value of products.
Sustainability 12 08142 g001
Figure 2. Types of small-scale irrigation in the study area.
Sustainability 12 08142 g002
Figure 3. Map of Debre Eliyas district. Source: Debre Eliyas office of chief administration.
Sustainability 12 08142 g003
Figure 4. NNM with 0.1 caliper.
Sustainability 12 08142 g004
Table 1. Labor productivity in Canada, China, and Ethiopia.
Farm Population (000)Gross Income (Billion USD)Gross per Capita Income (USD)
Canada322.7426.5682,283.64
China224,237.85927.884137.95
Ethiopia32,282.6623.28721.28
Source: World Development Indicators (2016).
Table 2. Sample weights.
Target PopulationSampleProbabilityWeight
Motor pump171717/17 = 11/(17/17) = 1
Cana irrigation3247575/324 = 0.231/(75/324) = 4.32
Table 3. Variable definitions.
xDefinitionUnit
HH head genderSex of HH head (0 = female, 1 = male)Dummy
HH head ageAge of HH headNumber
Family sizeNumber of family membersNumber
HH head marital statusMarital status of HH head (1 = married, 0 = single)Dummy
Full-time workersNumber of full-time workers in the familyNumber
Part-time workersNumber of part time workers in the familyNumber
Not workingNumber of family members who are not working either under working age or retiredNumber
HH head educationYears of schoolingNumber
Relation with development agentsThe frequency of visiting farmers training center (1 = strong, 0 = weak)Dummy
Wheat producingMajor product in the HH (1 = Yes, 0 = No)Dummy
Teff producingMajor product in the HH (1 = Yes, 0 = No)Dummy
Corn producingMajor product in the HH (1 = Yes, 0 = No)Dummy
Barely producingMajor product in the HH (1 = Yes, 0 = No)Dummy
Others producingMajor product in the HH (1 = Yes, 0 = No)Dummy
Farm sizeSize of land holdingNumber
Irrigated cereal producingMajor irrigation product (1 = Yes, 0 = No)Dummy
Irrigated others producingMajor irrigation product (1 = Yes, 0 = No)Dummy
Irrigation farm sizeIrrigated land holding sizeNumber
Cattle sizeNumber of cattleNumber
Sheep and goat sizeNumber of number of sheep and goatsNumber
Transporting animalsNumbers of number of donkeys, horses, mulesNumber
Table 4. Descriptive statistics.
FullSSIMPSSDISMean Difference
HH head gender0.16300.00000.2000−0.2000
HH head age45.326146.588245.04001.5482
Family size4.83704.35294.9467−0.5937
HH head marital status0.77171.00000.72000.2800
Full-time workers2.25002.05882.2933−0.2345
Part-time workers1.60871.41181.6533−0.2416
Not working0.97830.88241.0000−0.1176
HH head education1.68482.67651.46001.2165
Model farmer0.48911.00000.37330.6267
Relation with development agents0.93481.00000.92000.0800
Wheat producing0.85870.41180.9600−0.5482
Teff producing0.01090.05880.00000.0588
Corn producing0.11960.52940.02670.5027
Barely producing0.00000.00000.00000.0000
Others producing0.01090.00000.0133−0.0133
Farm size1.71612.31761.57980.7379
Irrigated cereal producing0.06520.23530.02670.2086
Irrigated others producing0.00000.00000.00000.0000
Irrigation farm size0.68520.51180.7246−0.2128
Cattle size6.25008.35295.77332.5796
Sheep and goat size2.95653.35292.86670.4863
Transporting animals0.75001.17650.65330.5231
Source: Authors’ calculations.
Table 5. Logit result with and without weights.
Without WeightsWith Weights
Estimate
(Std. Error)
Pr(>|t|)Estimate
(Std. Error)
Pr(>|z|)
(Intercept)−0.1002
(0.6713)
0.8813−1.6383
(0.6272)
0.0106 *
Working labor−0.2972
(0.1655)
0.07260.2777
(0.1481)
0.0641
Land ownership−17.7833
(1662.8510)
0.9915−17.3596
(0.4539)
<2.0 × 10⁻¹⁶ ***
Note 1: *** and * represents 1% and 10% significance level, respectively.
Table 6. Nearest neighbor matching (NNM) with and without calipers.
PS ValueMatched n
Before matchingMeans Treated0.073717
Means Control0.048675
Std. Mean Diff.0.9639
NNMMeans Treated0.073717
Means Control0.071617
Std. Mean Diff.0.0801
NNM (Caliper = 0.25)Means Treated0.073215
Means Control0.074515
Std. Mean Diff.−0.049
NNM (Caliper = 0.1)Means Treated0.073215
Means Control0.073215
Std. Mean Diff.0
Note 2: 200 bootstrap replications were used to estimate the standard errors.
Table 7. t-test of difference in means.
Before MatchingAfter Matching
Mean TreatedMean ControlMean Diff.p-ValueMean TreatedMean ControlMean Diff.p-Value
PS value0.0737350.0486000.02510.002324 ***0.0731810.07318101
Working labor3.4705883.946667−0.47610.28653.5333333.53333301
Land ownership0.00000.2000−0.20005.119e-05 ***000NA
Note 3: 200 bootstrap replications were used to estimate the standard errors. *** represents 1% significance level, respectively.
Table 8. Estimation result for average treatment effect on the treated (ATT(E)).
Before MatchingAfter Matching
NNMNNM (Caliper = 0.25)NNM (Caliper = 0.10)
ATT−7547.845−6028.5−10,453.63−11,608.63
p0.33650.57540.36270.55
n92343030