Article

Mapping the Recreational Value of Coppices’ Management Systems in Tuscany

1
Department of Veterinary Science—Rural Economics Section, University of Pisa, Viale Delle Piagge 2, 56124 Pisa, Italy
2
Department of Agricultural, Food, Environmental and Forestry Sciences and Technologies, University of Florence, Piazzale delle Cascine 18, 50144 Firenze, Italy
3
School of Agricultural, Forestry, Food and Environmental Sciences, University of Basilicata, 85100 Potenza, Italy
4
Department of Biological, Geological and Environmental Sciences, University of Bologna, Via Zamboni, 33-40126 Bologna, Italy
5
Institute for Sustainable Tourism and Sustainable Economic Development, ULPGC, 35001 Las Palmas de Gran Canaria, Las Palmas, Spain
*
Author to whom correspondence should be addressed.
Sustainability 2020, 12(19), 8039; https://doi.org/10.3390/su12198039
Submission received: 22 August 2020 / Revised: 26 September 2020 / Accepted: 28 September 2020 / Published: 29 September 2020

Abstract

:
In recent decades the growing interest in forested areas has led to a higher level of appreciation and consideration regarding the various benefits and services provided by forests. Despite this, when it comes to acknowledging their economic value and their capacity to produce income, the production of timber seems to be the main or even the only function that is considered. However, by adopting a sustainable forest management approach, the value related to non-market forest functions could also be considered. The present paper aims to quantify the potential income related to the recreational value of coppice forest by considering three different management systems: traditional coppice, active conversion to high forest and the natural evolution of forest. In order to do so, a contingent valuation method was used, and 248 forest users were surveyed in the region of Tuscany, Italy. The surveys included a revised price-list method, and the results obtained showed the existence of willingness to pay (WTP) for the maintenance of forests. Users showed a strong preference for conversion to high forest, while natural evolution was the least preferred management option. People’s perception on this matter was also assessed based on their specific location, by georeferencing all of the respondents’ answers: considering this, it was observed that belonging to a municipality located in or close to the mountains (i.e., mountain and natural municipalities) influenced the users’ WTP to maintain natural evolution.

1. Introduction

The interest in the community in the ecosystem services (ES) offered by forests is increasing over the years. As argued by Kubiszevski et al. [1] and Costanza et al. [2,3,4], ecosystems provide a range of goods and services that are important for human well-being and environmental health, which are collectively called ecosystem services.
In the literature it is common to find references to other forest functions, such as soil protection, maintenance of biodiversity, carbon storage, recreational activities, etc. [5,6,7,8,9,10]. In general, traditional forest management approaches (option and approach will be use as synonyms in the article) are aimed mainly at maximizing wood production and enhancing some environmental functions. Both their effectiveness in supporting timber production and their impact on the environmental functions of forests (such as soil protection, water regeneration and maintenance of biodiversity) are widely described in the literature [8,11,12,13,14,15,16]. However, the impact these functions have on other important activities in the forest, like those related to the recreational use, has received little attention [17].
Recreational functions play an important role in contemporary societies and rural economies, as confirmed by the State of Europe’s Forests Report [18]. In this report, about 90% of forests and other rural areas are reported to be important for recreational activities.
Although some authors have already reported the importance of forests’ recreational functions in the literature (see, among others, [19,20,21,22]), they do not provide data with a high level of detail from a spatial point of view, and the different methods they apply to calculate tourism benefits, such as the hedonic price, travel cost method and contingent valuations, generally refer to large forest areas [23,24,25]. Furthermore, the high cost of applying these procedures has often hindered their application on some relatively small forest areas that are considered to be of high value.
In recent years, the so-called “spatialization” of the value of social utility has started to receive more attention in the international literature. This is partly due to the fact that spatial analysis allows the geographical distribution of environmental values to be appreciated and enables these values to be overlaid with other geographically relevant information, such as project data, risk maps, etc. One of the first studies proposed in which the potential applicability of this approach was discussed was conducted by van der Horst [26], although only at a theoretical-methodological level. Later, Baerenklau et al. [22] realized a first application of the spatial allocation of use values for hiking, where the only variable considered at the territorial level was the width of the panoramic view.
Several studies have proposed maps depicting the value of ecosystem services [27,28,29], but most authors focused on evergreen or alpine forests [30,31,32]. Respondents’ perception of forests was considered by De Meo et al. [33] in a study about the attractiveness of alpine forests, but such perception was not spatialized. One of the few examples in which the preferences of the interviewees were spatialized is found in the research of Behr et al. [34]. These authors produced a map depicting the human acceptance of the wolf, based on their location.
In order to enrich the previous literature, and starting from a previous study by Riccioli et al. [35], the present paper focuses on the recreational value of broadleaved forests under coppice management (which have received less attention in terms of recreational assessments) and the analysis of people’s perception thereof by using a spatially explicit approach. Specifically, our work intends to test the hypothesis according to which belonging to a municipality located in or close to the mountains can influence the willingness to pay (WTP) of residents.
Thanks to highly detailed spatialization, it is possible to analyse possible correlations between the recreational value allocated by a random sample of potential users (WTP for maintaining the recreational use of forests) and the territorial or geographical characteristics of the municipalities in which they reside.
Having spatialized the answers of the users, the innovative part of this research is represented by the possibility of investigating the WTP according to the characteristics of the users derived from the social context in which they live (represented by the characteristics of their territory). In particular, a territory with a strong forest element is represented by municipalities located in or close to the mountains, in which not only recreational activities, but also economic activities, are closely linked to the forest component.
This paper is organized as follows. In Section 2 the materials and method are described; in Section 3 results are presented; in Section 4 a discussion is provided; Section 5 is dedicated to conclusions.

2. Materials and Methods

2.1. Case Study

Tuscany is a region located in the centre of Italy. It is mainly hilly (66.5%) with some plains (about 8.4% of the territory), while major mountain ranges cover about 25.1% of the region. The climate is characterized by an average annual temperature of around 16 °C, with annual rainfall of around 600–700 mm.
As reported by the National Forest Inventory [36], about 1,151,000 ha are covered by forest (50% of the total area of the region). Forests are largely composed of oak species, i.e., Turkey oak (Quercus cerris L.), Pubescent oak (Q. pubescens Willd.) and evergreen oaks. Broadleaf species represent 38% of the total forest area (about 414,000 ha). The most popular forest management option is coppice management, that is an ancient form of forest management developed and maintained to efficiently provide rural communities with wood, mainly firewood. Coppice is still abundant throughout Europe today: it covers over 23 million hectares [37], with nine countries having a coppice area forest cover exceeding 1,000,000 ha.
In Tuscany the coppice is applied to 725,000 ha (63% of the total forest area), a substantial difference with high forest, which covers 207,000 ha (18% of the total broadleaf forest area).
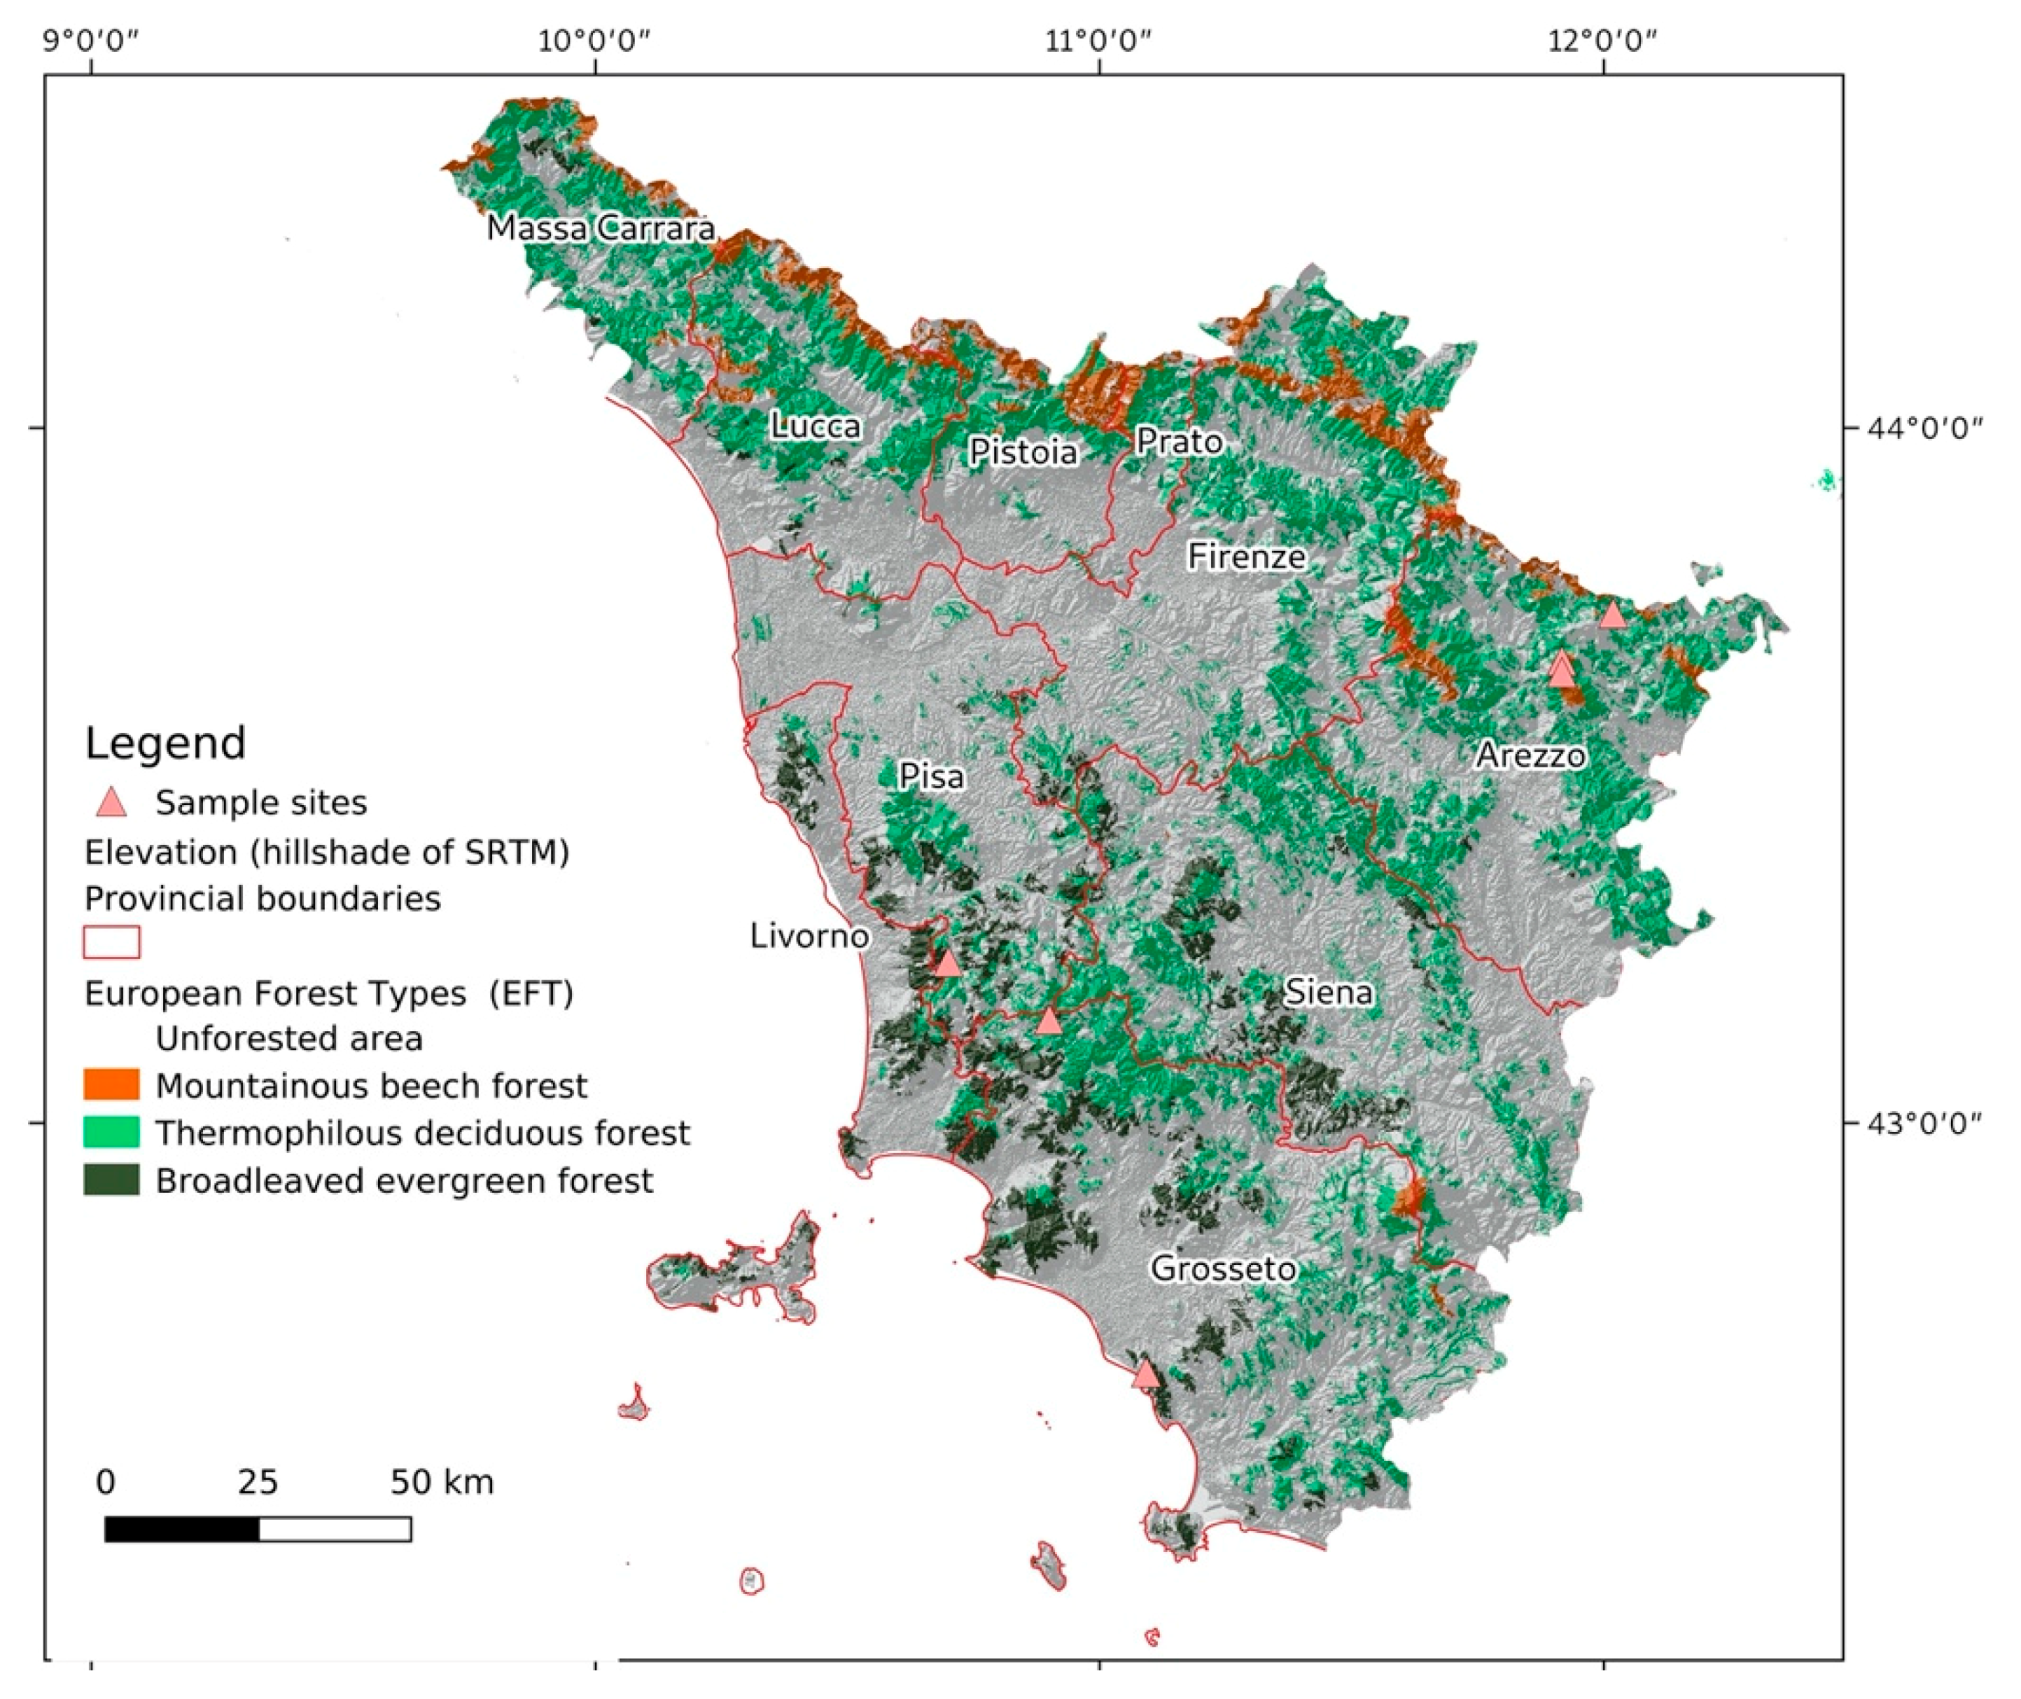
The data required for the analysis were collected in five sample areas (Figure 1 and Figure 2), belonging to three provinces that make part of the European project FutureForCoppiceS LIFE14 ENV/IT/000514: the districts of Alpe di Catenaia and Alto Tevere, in the province of Arezzo; the Caselli forests in the province of Pisa; the districts of Colline Metallifere and Alberese, in the province of Grosseto.
The area related to the district of Alpe di Catenaia is approximately 2340 ha. Its forest species are mainly represented by beech, Turkey oak and mixed broadleaved mesophyll species.
The Alta Valle del Tevere District covers an area of 4321 ha; forest species mainly include deciduous oaks (Turkey oak) and black hornbeam.
The area of Colline Metallifere District is approximately 15,230 ha, with deciduous oaks (Turkey oak), hornbeams and Holm oaks (Q. ilex L.) as the most representative forest species.
The Alberese District is located in the southern part of Tuscany and covers an area of 9000 ha. Its main forest species are evergreen broadleaves (Holm oak).
The area of Caselli District is approximately 1370 ha, and forest species are mainly represented by deciduous oaks (Turkey oak).

2.2. Evaluation Method for Willingness to Pay

Taking a previous study of Riccioli et al. [35] as a starting point, a new set of data was collected regarding people’s WTP for maintaining the recreational use of forests under different management options. This was done by using a questionnaire (see Section 1 of the Supplementary Materials) in which respondents were asked about their WTP for the maintenance of the recreational function of forests under three management options: coppice, active conversion to high forest and natural evolution of forest.
The concept of the questionnaire is a relevant phase and needs to be analysed in depth.
Development work typically includes focus groups and in-depth interviews to help determine the plausibility and understandability both of the description of the good provided and the context in which it is being provided. The survey was developed with the assistance of experts of the Forest Research Institute of the CREA (Council for Agricultural Research and Agricultural Economy Analysis) and professors of the Department of Agricultural, Food, Environmental and Forestry Sciences (University of Florence).
In order to organize an effective and efficient questionnaire, we followed some suggestions from the literature. As argued by Green and Tunstall [38] and Rodriguez et al. [39], the introduction needs to describe the knowledge of respondents’ perceptions about goods and services to be valued. At the same time, the survey may ask the questions to explore the knowledge of individual preference for the goods [39]. It is important that the hypothetical scenario corresponds as closely as possible to a real-world situation [40]. In a second part, the survey needs to explain the goods and services in more detail.
Considering what was mentioned above, our questionnaire was structured in two main sections. The first part aimed to elicit some basic information about the respondents (age, gender, educational degree, occupation, type of accommodation). In the second part, after providing the respondents with some information and photos about the three different forest management approaches, they were asked to answer whether they were willing to pay for the maintenance of forests. The hypothetical scenario included a supplement to the regional income tax, i.e., the payment method by which we expected respondents to pay for the maintenance of the recreational value of the forest area.
The core of questionnaires was represented by the elicitation method. Here, respondents are asked to state their willingness to pay (WTP) for environmental goods and services. The choice of the elicitation method is one of the major exercises in Contingent Valuation studies.
Many authors have explored the recreational function provided by a forest from an economic and social point of view, using various methodologies both in a quantitative/qualitative way and with monetary/non-monetary outcomes (e.g., Travel cost, Choice experiment, Contingent valuation MultiCriteria Analysis, Life Satisfaction Approach, etc.) [8,24,41,42,43,44,45]. In this study, the contingent valuation method (CVM) was used. This is widely adopted in the literature for estimating the economic value of forest ecosystem services. Molina et al. [43] analysed the value of the landscape in an area in the south of Spain, Voltaire et al. [46] determined the WTP for the conservation of a salt marsh in France, [47] applied CVM to estimate the value of nature conservation in Finland and [12] estimated the economic value of forest ecosystem services in three counties in China.
A recent study by Kniivilä [47] states that in CVM, through the use of interviews and questionnaires, “individuals are placed in a realistic, credible, but hypothetical market transaction situation, in which they are asked about their willingness to pay for a change in the availability of a given commodity”.
Various types of elicitation techniques have been used [48,49], such as the bidding game, the single- or double-bounded dichotomous choice approaches, the price list and the payment card. Based on a combination of these techniques [50,51], the method used in this study will consist of a revised multiple price list, adopting a payment card (PC) in the second stage.
Using the payment card for the elicitation of the WTP, the values of the card are related to the explanatory variables. An in-depth study conducted by Cameron and James [52] has shown that this approach is not efficient because it ignores the important notion that the values of the chosen cards only reflect the lower limit of a respondent’s WTP.
In this work, the WTP has been adapted in relation to a random-effects interval data regression model. This allows us to take into account that the data are recorded in intervals; and the true WTP of the unobserved respondents is in the known interval.
As already observed by Riccioli et al. [35], “the general assumption behind this model, as noted by Tian et al [53] and Cameron and Trivedi [54], is that a respondent’s WTP is located randomly between the chosen value and the next larger value on the payment card. Moreover, a random-effects analysis allows for inference about the population from which the sample is drawn”.
The respondents provided their maximum WTP for each forest management option using a monetary interval for the WTP with 12 price ranges. A pre-test survey was used to examine the bounds of the payment card: the WTP bid range was fixed between € 0.00 (no WTP) and € 22.00. Each interval was € 2.00. This range was also compared with the work of Bernetti et al. [55] and Sacchelli et al. [56].
The WTPs were provided at the same time for each management option by each respondent, so that they could be compared, and the respondent’s preferences extracted.
By using monetary intervals, the WTP could be estimated using an interval data regression model. The model is shown in Equation (1), with C standing for coppice (set as the baseline), H for conversion to high forest and E for natural evolution.
WTP ij = α + γ 1 E + γ 2 H + ε ij
where WTPij is the dependent variable (WTP) of the i-th respondent related to the j-th forest management option, α is the intercept and γ1 and γ2 are the estimated coefficients, i.e., the WTP differences between the three forest management options. E and H are effect-coded dummy variables representing natural evolution and high forest management options, respectively, while εij is the error term.
A pre-test was performed to ensure that the questionnaire was clearly and properly worded. It was conducted between May and June 2016 at the University of Florence during degree courses of Forest Science. Thirty students were selected to participate in the pre-test survey.
The final survey was conducted between July and September 2016: the full questionnaire was provided along with pictures of the forest management options (see Section 1 of the Supplementary Materials) which were taken at five sample areas belonging to the LIFE project. The survey was randomly applied to forest users or people with certain knowledge about forests (tourists, members of environmental associations, students of the Faculty of Agriculture, etc.).
Out of a total of 251 respondents, 248 questionnaires were used in the final analysis. The descriptive statistics of respondents are displayed in Table 1.
In a second phase, we investigated which territorial characteristics of the respondents’ municipalities influenced the WTP for forest management options.
Therefore, a second model was used to test the relationship between WTP and the territorial characteristics of the municipalities of the respondents (Equation (2)). Introducing the territorial variables, Equation (1) is reformulated as follows:
WTP ij = α + γ 1 E + γ 2 H + c = 1 C β ec ( d ic ) E ij + c = 1 C β hc ( d ic ) H ij + ε ij      
where dic is the c-th territorial explanatory variable of the i-th municipality of the respondent, dicEij and dicHij are the interaction variables between territorial variables and forest management options and βec and βhc are the coefficients of the interaction terms.
Territorial variables are represented by the classification of municipalities into mountain and natural municipalities, which was obtained as follows.
Mountainous municipalities are considered those that have at least 80% of their surface area over 600 metres above sea level (art. 1, National Law 991/1952).
Natural municipalities are considered those that have at least 50% of their surface in natural areas classified via the Recreation Opportunity Spectrum (ROS), which is a Canadian methodology aiming to classify territories [57,58,59]. This methodology has been found useful for defining natural municipalities. However, as suggested by Riccioli et al. [60], it was adapted to the characteristics of the Italian peninsula (which is geographically different from the Canadian territory). Therefore, some variables considered inapplicable to the Italian territory were disregarded. Natural municipalities are areas with a high percentage of forests, at least 1 km from both urban areas and road networks. See Section 2 of the Supplementary Materials for more details.
The research hypothesis this study intends to test is that people living in mountain or natural municipalities are more familiar with forest management options, and therefore tend to value them more than people living in urban or rural areas. Additionally, the hypothesis assumes that certain characteristics related to the location of the municipalities may influence the WTP of their residents, which in turn may have an impact in their environmental footprint levels, depending on their forest use preferences (i.e., people who perceive the forest as a resource to be cut would have a higher environmental footprint than people who perceive it as a good for recreational purposes).
In order to carry out this type of analysis, the data has been spatially analysed as follows (Section 2.3).

2.3. Identification of Management Options and Spatialization of Data

The study was conducted on a state-owned forest, considering three forest management: (i) traditional coppice; (ii) natural evolution of forest; (iii) conversion to high forest.
The total forested area in Tuscany, including privately owned forests, encompasses 339,188 ha, whereas the State-owned forest covers just 61,507 ha. Therefore, the spatial simulations presented in this section account for about 20% of the total forested area in Tuscany.
The regional polygon maps (1:250,000) provided by the Tuscany Forest Inventory [61] contained information regarding management options with a level of detail that presented more options than those needed in the work. For this reason, it was necessary to reclassify the map as follows: (i) coppice: all forests classified as coppice according to their declared management or described as coppice; (ii) natural evolution: all forests classified as old coppices or abandoned; (iii) conversion: all forests classified as conversion and labelled as high forest, transition to high forest or coppice under conversion.
Finally, we obtained 1733 parcels of coppice, 2452 parcels of natural evolution and 3131 parcels of conversion to high forest.
There are several approaches for mapping ecosystem services, depending on the environment (aquatic or terrestrial), the scale of representation, the type of service and the source of the data [62,63,64]. However, mapping cultural ecosystem services (CES), such as recreation, is particularly challenging because the service provided depends not only on environmental factors [65] but also on people’s preferences.
Quantitative mapping may not be fully suited for CES [66,67], but it is possible to achieve mapping by combining quantitative and qualitative methods from environmental and other social sciences in a multidisciplinary approach.
In this study we used a land-use-based mapping technique sensu [67] for mapping the recreational value of the different sustainable forest management (SFM) options [68], linking the mode value of each management type obtained by the survey to the corresponding forest parcel in Tuscany [61]. The results of the questionnaire were also aggregated according to a different spatial reference. The aggregate value represents the most preferred value over a distinct set of respondents’ choices, divided by postal code of belonging (zip code). Instead of a recreational value map, a map of preferences was developed. See Section 3 of the supplementary materials for more details.
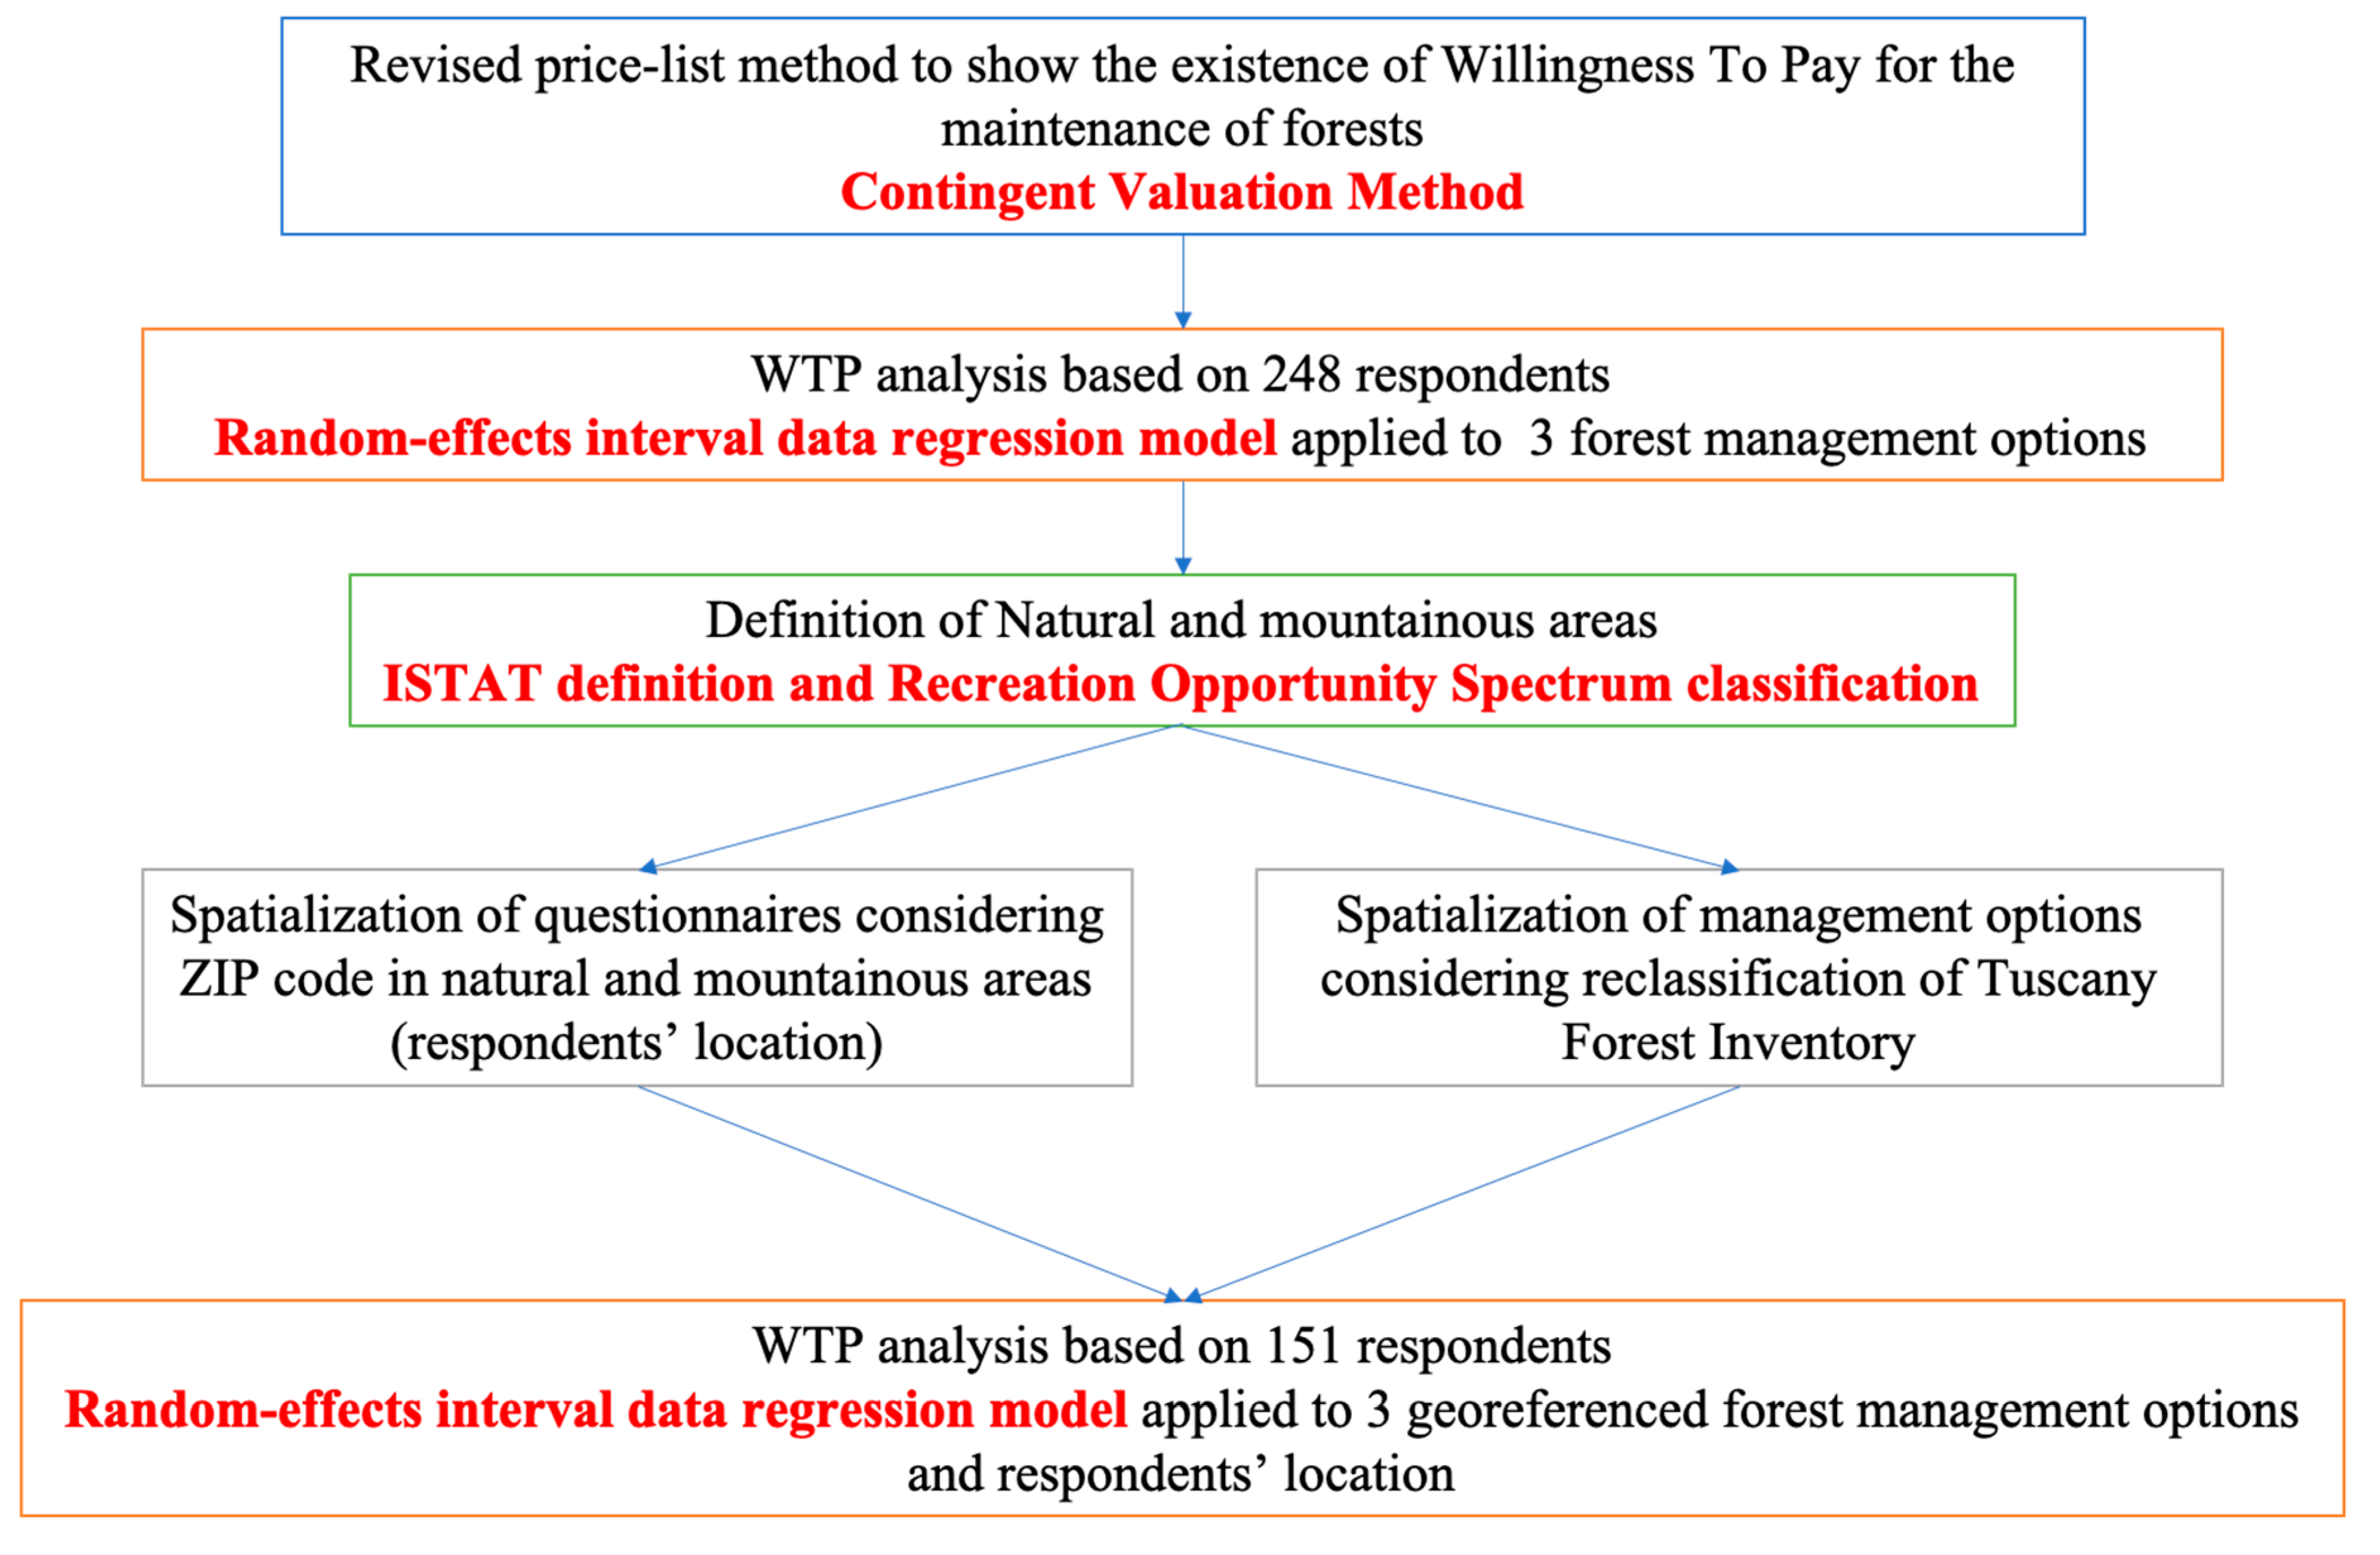
Figure 3 shows the flowchart with all the steps performed in the analysis to estimate recreational values (methods and models are in bold and typed in red).

3. Results

Recreational Value of Forests According to Different Management Options

Concerning the analysis of socio-demographic variables, the sample of 248 respondents was composed of 46% males and 54% females. The maximum education levels were mainly high among the respondents: 66% had a high school degree, and 18% had a Master of Science degree. 15% had a secondary school degree, and 2% had a primary school degree. Regarding the age variable, 40% of the sample was represented by young people (18–35 years old), 27% were aged between 35 and 50, 24% were people aged between 50 and 65, and the remaining 9% were people over 65 years old. The occupation variable showed that the highest percentage belonged to employed people (30%), followed by students (29%). Retired people and freelancers were equal to 12%, while homemakers and unemployed people represented 9% and 8%, respectively.
A general analysis of WTP for the three forest management options has been obtained by considering the simple means of the respondents’ WTP: conversion to high forest was shown to be the favourite management option (WTP equal to 8.64 euro per person per year), followed by coppice (WTP equal to 7.44 euro per person per year) and natural evolution (WTP equal to 6.52 euro per person per year).
By using the frequencies of WTP elicited from the respondents, Table 2 shows that conversion to high forest is the favourite management option, with higher levels of WTP, while natural evolution received the largest number of 0 values for WTP.
In order to test the differences in WTP for the forest recreational function under different management options, an interval data regression was performed, following the model in Equation (1). Results are given in Table 3.
In this model, we used 248 respondents and three different management options (744 observations). The overall analysis of the model was explained by Prob > Chi2 number: it was less than 0.05, which reveals how coefficients in the model are different than zero. t-values test the hypothesis that each coefficient is different from 0. The values lower than –2.58 and higher 2.58 (99% confidence level) reveal that the conversion and natural evolution have a significant influence on coppice. Indeed, the results show significant differences (p < 0.01) for the WTP values between coppice and conversion to high forest and between coppice and natural evolution of forest. The highest WTP was allocated to conversion to high forest (€ 7.60 per year), followed by coppice with a WTP of € 6.37 and natural conversion with a WTP of about € 5.18 per year.
These results could indicate that the WTP value for coppices is penalized by forest maintenance activities (i.e., thinning), while the value for natural evolution is penalized by non-utilization, contributing to creating an impenetrable scrub that is not adequate for recreational activities.
In the literature, the relationship between the WTP for natural resources and the socio-demographic characteristics of the sample is widely explored [12,35,47,62,69,70,71,72,73].
The innovative part of this study is based on investigating whether the respondents’ WTP, regarding the perception of forest, is influenced by the place where they live. We selected territories where the forest is an important determinant of life quality (i.e., mountain and natural municipalities).
The recreational values obtained for each forest parcel of the forests owned by the state in Tuscany were overlapped with the map postcodes. A total of 151 questionnaires from respondents were georeferenced. Postcodes did not always overlap with the boundaries of the municipalities, since bigger cities are divided into more than one postal area. Therefore, the postcodes provide a finer scale for representing where people live, compared to municipalities.
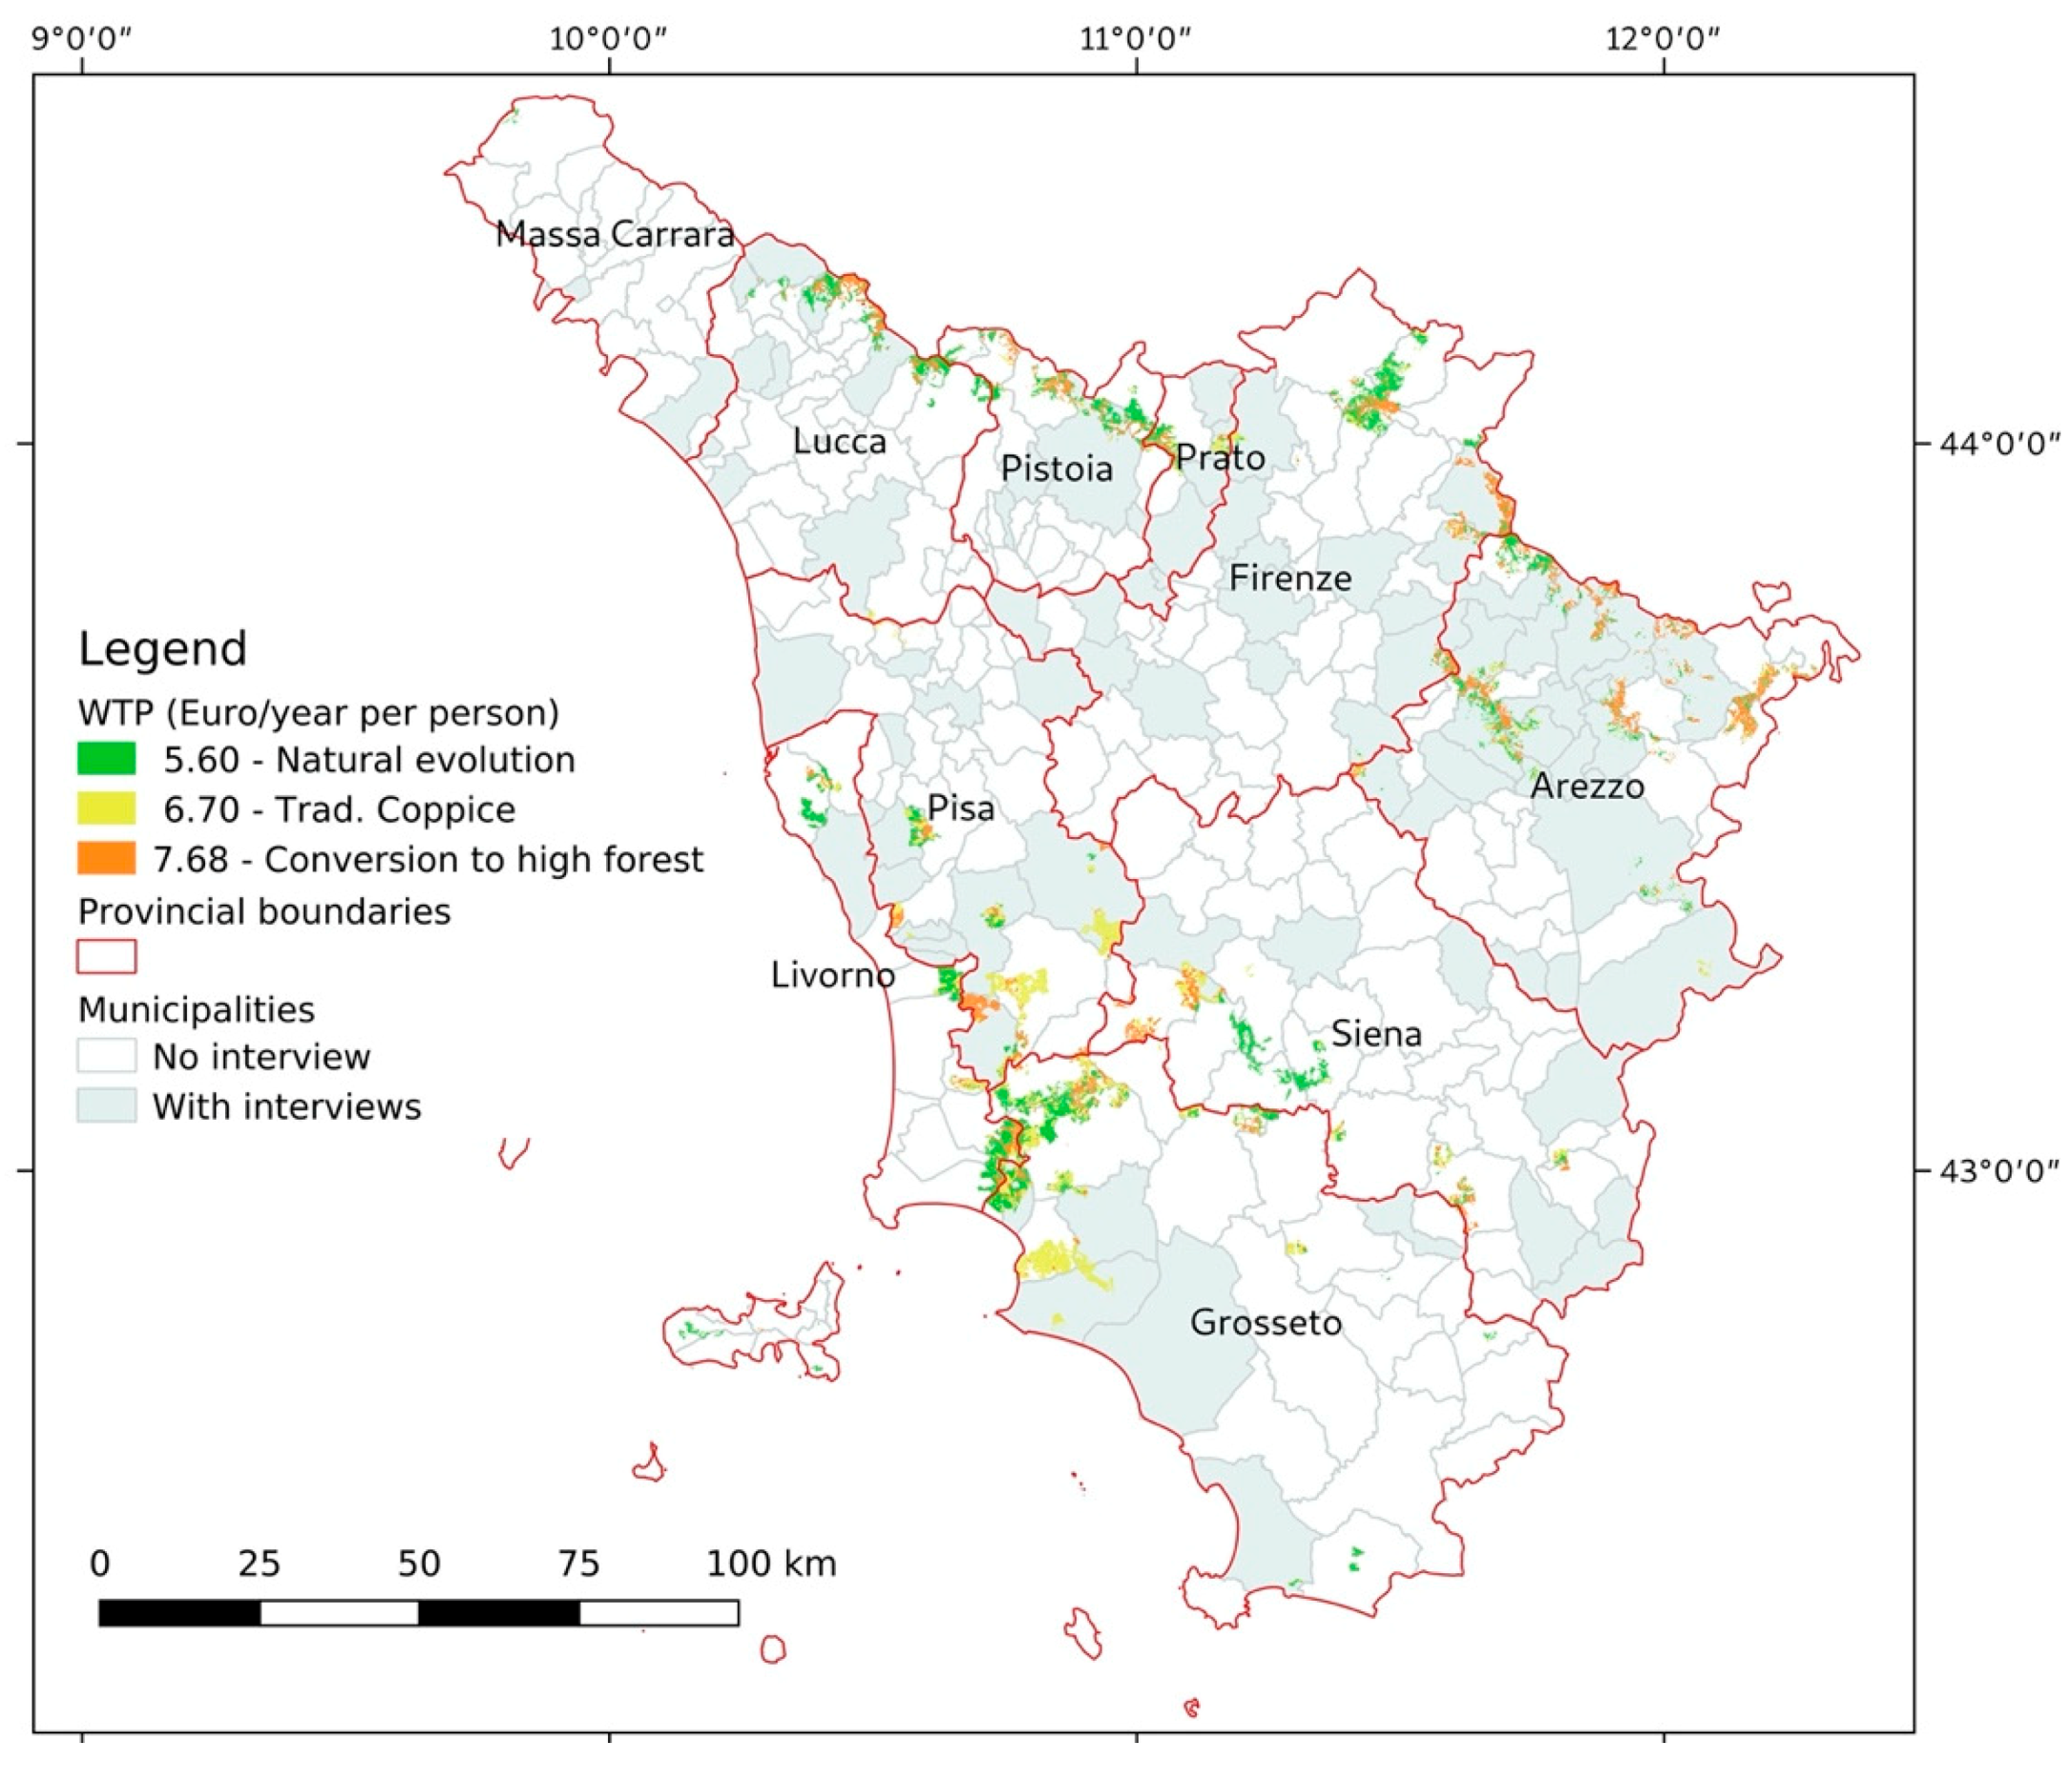
The map in Figure 4 shows the recreational value of each parcel of state-owned forests in Tuscany, overlapped with the map postcodes. It is important to note that the interviews covered the region evenly, and in particular both areas with forests and areas without forests, thus capturing the opinions of people living in different environments.
Figure 4 also shows the WTP considering territorial variables. Significant differences can be observed between the WTP values related to the observed management approaches. The WTP related to the baseline approach (traditional coppice) was € 6.70 per year. The highest value of WTP was observed for the evolution to high forest (€ 7.68 per year), while the lowest WTP was obtained for natural evolution (about € 5.60 per year). The results are shown in Table 4.
Four combinations were tested: two territorial variables, i.e., mountain municipalities (Mountain) and natural municipalities (Natural) and two forest management options (the coppice was set as the baseline), i.e., conversion to high forest (Conversion) and natural evolution (N_evolution).
In this model, we used 151 georeferenced questionnaires and three different management options (453 observations). Like the previous analysis, shown in Table 3, the model fitted well: Prob > Chi2 number was less than 0.05, which reveals how coefficients in the model are different from zero. t-values were lower than –2.58 and higher than 2.58 (confidence level equal to 99%), and they reveal that the conversion and natural evolution have a significant influence on coppice: these results show significant differences for the WTP values between coppice and conversion to high forest and between coppice and natural evolution of forest (p < 0.01).
By observing the four combinations tested, only one was shown to be a significant predictor of WTP: belonging to a mountain municipality influences the WTP for maintaining natural evolution: t-test was higher than 1.96 (p > 0.05).
The rho values (interclass correlation), shown in Table 3 and Table 4, are above 50%. This value relates the standard deviations of individual effects (between respondents) and the standard deviation of residuals (between management approaches). We can argue that despite a great heterogeneity of respondents, the differences across panels (i.e., the management systems) produced a large part of the variance results. This confirms the existence of differences in users’ WTP for forest recreational value according to the management systems.

4. Discussion

Forests provide multiple benefits: they influence environmental and climate conditions, provide different kinds of resources, intervene in the health of the environment, influence landscape and favour recreational activities [74]. Ecosystem services provided by forests should be analysed and quantified in order to make the actual forest management sustainable.
This study contributes to this effort by providing a spatial analysis of recreational values and exploring the WTP for state-owned forest under coppice management, in the region of Tuscany.
It has been possible to understand the perceptions of people using an explicit spatial approach. By taking into account the location of the respondents’ municipalities in our analysis, it has been possible to give a particular interpretation of WTP. We tested our initial hypothesis, according to which belonging to a municipality located in or close to the mountains can influence the WTP of residents. In particular, it has been observed that the WTP for conversion to high forest is higher than WTP for coppice and natural evolution, and the people who live in mountain communities have a greater understanding of what natural evolution means.
Natural evolution is probably a misunderstood management option, only comprehensible for those who make use the of forests every day or who have adapted their lifestyles according to the characteristics of their natural environment. From this perspective, it makes sense that the WTP values differ between these types of respondents (i.e., residents in mountain and natural municipalities) and other forest users.
This could be due to the different perceptions that people have about the forest: some users consider it as an abandoned place that has no value for recreation (and described it as an impenetrable deep forest where it is not possible to carry out recreational activities such as mushroom picking, hiking, mountain biking, picnicking, etc.). For others, natural evolution represents a “self-managed” system where there is no need to pay for its maintenance, as forms of intervention are not planned: this aspect is demonstrated by the negative coefficient between people living in more mountainous areas and WTP for natural evolution (Table 4). This could also be related to the fact that they prefer the familiar land use of traditional coppice and would rather have it transformed into high forest than see this coppice be abandoned to natural succession.
The results we have achieved are supported by some authors. De Meo et al. [33] showed that the perception of the forest in the Italian Alps is affected both by the respondents’ geographical location and by their social background: people belonging to communities located in the mountains are more familiar with, and thus place more value upon, services linked to forest exploitation (logging and grazing), compared to urban dwellers who place more value upon the aesthetic and recreational use of the forest. Age also affects such perceptions, which is reflected in the values assigned to forests, as young people tend to be less linked to the traditional and cultural context of the natural environment [75]. Moreover, in Italy, young people nowadays are used to the current extension of forested areas, which is different compared to the coverage extension of the previous century, when the pastures were kept clear of the forest, especially in mountain areas [76].
One limitation of our work is related to the typical distortions of contingent valuation: they represent several ongoing issues concerning the respondents’ answers and the description of a hypothetical scenario. These issues can lead to misunderstandings, with the result that respondents attribute generic value to the good by overestimating or underestimating the WTP [48,77,78]. Indeed, it was difficult to explain or discuss which recreational values might be associated with the forest types, which recreation actually takes place, which recreation might be pursued and which problems related to recreational values might occur if the forest it not maintained and runs wild.
It is also important to consider the subjectivity of the answers. Respondents may indicate a WTP that is not only related to the recreational value of forest: their WTPs could contain a value for protecting biodiversity, legacy values to the next generations or cultural aspects related to the type of landscape they feel connected with. Furthermore, some of these respondents may prefer some type of management because it provides more jobs in their area or because they consider that a particular forest structure reduces wildfire risk.
Another issue is related to the fact that these results must be interpreted carefully at the regional scale, because they are limited to state-owned forests and do not cover privately-owned forests, which may be managed in a different way.
Another element to take into account is the possible evolution of the results collected in 2016 to the present date (2020). It should be considered that the forest landscape evolves slowly (turnover is 50 years, on average) and perceptions do not change considerably in a short time (under 10 years).
Another issue to be taken into consideration could be a greater environmental awareness acquired especially with regard to air pollution (i.e., due to the effects of COVID) [79,80,81,82]. This could lead to a reformulation of the outcomes, focusing on the fact that coppice represents an efficient form of forest management in all its forms (simple, compound, in conversion) and is therefore able to decrease CO2 levels in the environment.
In addition, in this period (2016-2020) the inflation rate could also be taken into consideration. According to the ISTAT (National Institute of Statistics), it has increased from −0.1% to 0.5% [83]. Nevertheless, the change in inflation has little effect on WTP values (for example, considering a real rate of 2% out of 6 euros in 2016, inflation would change the value in 2020 by a few cents).
Despite the previous considerations, our results lead to interesting scenarios and should be considered by stakeholders when planning their strategies, in order to better manage the coppices. In Tuscany, the current forest management policies tend to favour the production of timber over other goods and services (Measure 8 and other sub-measures [84]). Even though in several areas the current trend is focused on the conversion of coppice into high forest, in some other areas, people appreciate and value the coppice, since it has become important for social and traditional reasons. For this reason, although conversion is the most valued management option, every management option must be analysed from different points of view.
Conversion to high forest combines high values of standing biomass and the possibility of wood exploitation by means of processes like thinning. This scenarios has a high degree of influence on forest management, and even though it has been characterized by long turnovers and income delays over time, it shows positive effects on aspects related to the environment (e.g., species diversity) and socio-economics (e.g., net revenue), particularly on those related to recreation. This scenario also reveals higher values of recreation, that are related, as argued by Riccioli et al. [85], “to the perception that people have of the forest. In this case, conversion is the option that most resembles a high forest, therefore it is pleasing to visitors. This treatment is preferred with respect to coppice that is more influenced by the cuts and to natural evolution, which can represent a form of abandonment less suitable for recreational activity”.
Contrastingly, as argued by Fabbio et al. [86] and Ciccarese et al. [87], traditional coppice promotes higher productivity in terms of wood provision and periodic felling, both of which are linked to a maximization of productivity and the improvement of socio-economic aspects, especially those derived from the use and commercialization of wood and non-wood products. On the other hand, they lead to a reduced standing biomass and a lower carbon stock.
From a socio-economic point of view, natural evolution is more likely to lead to a loss of income, since wood and other resources are not used. Natural evolution is perceived as a form of abandonment of the land that represents a management option less suitable for recreational activities. However, a significant WTP for its maintenance was observed. This is probably due to the fact that users tend to interpret the word “natural” as a synonym for wilderness or naturalness, which has been widely documented in the literature [88,89,90,91,92,93]. Despite this, it is important to point out that these scenarios also have advantages because they enhance the contribution to the carbon cycle and the health and vitality of forest ecosystems [8,85]. Natural evolution also allows the restoration of natural ecological dynamics and an increase in biodiversity.
For the above-discussed reasons, the planning strategies should consider the maintenance of all three forms of management options in order to guarantee high levels of sustainability in terms of income, employment and resources. To this end, the following considerations could be also addressed.

5. Conclusions

The aim of this study is to test whether the perceptions of respondents towards forests, which affect their WTP, are related to the place where they live. This way, policy makers and other stakeholders involved will be able to use this evidence as a tool and an important component in forest management and planning scenarios.
By getting to know the different perceptions of the forest in a territory, local decision makers will be able to understand and attend more efficiently to the social demands relating to forest usage, which will enable them to improve the forest management processes relating to the needs of the different groups of stakeholders.
More specifically, the following outcomes have been achieved. The WTP for conversion to high forest is higher than the WTP for both coppice and natural evolution. Despite this, each management option deserves attention when strategies are planned. In fact, (i) conversion to high forest provides high values of standing biomass and, at the same time, the thinning ensures some wood production; (ii) traditional coppice promotes higher productivity in terms of wood provision and felling not delayed over time; (iii) natural evolution is important in terms of biodiversity and carbon sequestration. As mentioned above, all three forms of management should be maintained, taking into account their socio-economic and environmental implications.
The lesson learned is that it is crucial to convey all the relevant information about ecosystem services and forest management systems, taking into account the background of the people involved. Identifying the most effective way to do this is a challenge for future studies, requiring a multidisciplinary approach involving foresters and social scientists.
Thanks to highly detailed spatialization, it was possible to analyse possible correlations between the recreational value and the place where users live. Future implementations could be aimed at increasing the sample of interviews, especially if stratified on several social groups. Moreover, the photos could be integrated by high-resolution satellite images with the possibility of implementing different scenarios through Artificial Intelligence capable of recreating the three management options through augmented reality. In this regard, several studies have been conducted involving sophisticated reality simulation technologies [94,95,96,97]. This can lead to better answers to respond to the main hypothesis raised in the manuscript.

Supplementary Materials

The following are available online at https://www.mdpi.com/2071-1050/12/19/8039/s1.

Author Contributions

F.R.: conceptualization, methodology, software, writing—original draft preparation, writing—reviewing and editing, supervision. R.F.: reviewing and editing. C.F.: data curation. M.C.: methodology, data curation. M.V.: investigation. S.R.: investigation. D.R.: software. S.E.D.: reviewing and editing. C.T.: conceptualization, methodology, software, writing—original draft preparation, writing—reviewing and editing, validation. All authors have read and agreed to the published version of the manuscript.

Funding

This research was funded by the LIFE Programme of the European Commission, under the Grant Agreement LIFE14 ENV/IT/000514 (LIFE FutureForCoppiceS, “Shaping future forestry for sustainable coppices in Southern Europe: the legacy of past management trials”).

Acknowledgments

Thanks are due to Fabio Boncinelli for his precious help with econometric model definition.

Conflicts of Interest

The authors declare no conflict of interest.

References

  1. Kubiszewski, I.; Costanza, R.; Anderson, S.; Sutton, P. The future value of ecosystem services: Global scenarios and national implications. Ecosyst. Serv. 2017, 26, 289–301. [Google Scholar] [CrossRef]
  2. Costanza, R.; D’Arge, R.; De Groot, R.; Farber, S.; Grasso, M.; Hannon, B.; Limburg, K.; Naeem, S.; O’Neill, R.V.; Paruelo, J.; et al. The value of the world’s ecosystem services and natural capital. Nature 1997, 387, 253–260. [Google Scholar] [CrossRef]
  3. Costanza, R.; de Groot, R.; Braat, L.; Kubiszewski, I.; Fioramonti, L.; Sutton, P.; Farber, S.; Grasso, M. Twenty years of ecosystem services: How far have we come and how far do we still need to go? Ecosyst. Serv. 2017, 28, 1–16. [Google Scholar] [CrossRef]
  4. Costanza, R. Valuing natural capital and ecosystem services toward the goals of efficiency, fairness, and sustainability. Ecosyst. Serv. 2020, 43, 101096. [Google Scholar] [CrossRef]
  5. Pearce, D.; Turner, K.; Bateman, I. Economia Ambientale; Mulino: Bologna, Italy, 2003. [Google Scholar]
  6. Ciccarese, L.; Mattsson, A.; Pettenella, D. Ecosystem services from forest restoration: Thinking ahead. New For. 2012, 43, 543–560. [Google Scholar] [CrossRef]
  7. Stanturf, J.A. Future landscapes: Opportunities and challenges. New For. 2015, 46, 615–644. [Google Scholar] [CrossRef]
  8. Bottalico, F.; Pesola, L.; Vizzarri, M.; Antonello, L.; Barbati, A.; Chirici, G.; Corona, P.; Cullotta, S.; Garfì, V.; Giannico, V.; et al. Modeling the influence of alternative forest management scenarios on wood production and carbon storage: A case study in the Mediterranean region. Environ. Res. 2016, 144, 72–87. [Google Scholar] [CrossRef] [Green Version]
  9. Blattert, C.; Lemm, R.; Thees, O.; Lexer, M.J.; Hanewinkel, M. Management of ecosystem services in mountain forests: Review of indicators and value functions for model based multi-criteria decision analysis. Ecol. Indic. 2017, 79, 391–409. [Google Scholar] [CrossRef]
  10. Viccaro, M.; Cozzi, M.; Fanelli, L.; Romano, S. Spatial modelling approach to evaluate the economic impacts of climate change on forests at a local scale. Ecol. Indic. 2019, 106, 105523. [Google Scholar] [CrossRef]
  11. Mahieu, P.A.; Riera, P.; Giergiczny, M. Determinants of willingness-to-pay for water pollution abatement: A point and interval data payment card application. J. Environ. Manag. 2012, 108, 49–53. [Google Scholar] [CrossRef]
  12. Tao, Z.; Yan, H.; Zhan, J. Economic Valuation of Forest Ecosystem Services in Heshui Watershed using Contingent Valuation Method. Procedia Environ. Sci. 2012, 13, 2445–2450. [Google Scholar] [CrossRef] [Green Version]
  13. Backéus, S.; Wikström, P. Modeling Carbon Sequestration and Timber Production in a Regional Case Study. Silva Fenn. 2006, 40, 619–629. [Google Scholar] [CrossRef] [Green Version]
  14. Viccaro, M.; Cozzi, M.; Caniani, D.; Masi, S.; Mancini, I.; Caivano, M.; Romano, S.; Viccaro, M.; Cozzi, M.; Caniani, D.; et al. Wastewater Reuse: An Economic Perspective to Identify Suitable Areas for Poplar Vegetation Filter Systems for Energy Production. Sustainability 2017, 9, 2161. [Google Scholar] [CrossRef] [Green Version]
  15. Cozzi, M.; Viccaro, M.; Di Napoli, F.; Fagarazzi, C.; Tirinnanzi, A.; Romano, S. A spatial analysis model to assess the feasibility of short rotation forestry fertigated with urban wastewater: Basilicata region case study. Agric. Water Manag. 2015, 159, 185–196. [Google Scholar] [CrossRef] [Green Version]
  16. Viccaro, M.; Caniani, D. Forest, Agriculture, and Environmental Protection as Path to Sustainable Development. Nat. Resour. Res. 2019, 28, 1–4. [Google Scholar] [CrossRef] [Green Version]
  17. Vallecillo, S.; La Notte, A.; Zulian, G.; Ferrini, S.; Maes, J. Ecosystem services accounts: Valuing the actual flow of nature-based recreation from ecosystems to people. Ecol. Modell. 2019, 392, 196–211. [Google Scholar] [CrossRef]
  18. Forest Europe State of Europe’s Forests. 2015. Available online: http://foresteurope.org/state-europes-forests-2015-report (accessed on 7 December 2018).
  19. Loomis, J.B. Updated Outdoor Recreation Use Values on National Forests and Other Public Lands; U.S. Department of Agriculture, Forest Service, Pacific Northwest Research Station: Corvallis, OR, USA, 2005.
  20. Zandersen, M.; Tol, R.S.J. A meta-analysis of forest recreation values in Europe. J. For. Econ. 2009, 15, 109–130. [Google Scholar] [CrossRef]
  21. Voces González, R.; Díaz Balteiro, L.; López-Peredo Martínez, E. Spatial valuation of recreation activities in forest systems: Application to province of Segovia (Spain). For. Syst. 2010, 19, 36. [Google Scholar] [CrossRef] [Green Version]
  22. Baerenklau, K.A.; González-Cabán, A.; Paez, C.; Chavez, E. Spatial allocation of forest recreation value. J. For. Econ. 2010, 16, 113–126. [Google Scholar] [CrossRef]
  23. Bishop, R.C.; Romano, D. Environmental Resource Valuation; Studies in Risk and Uncertainty; Springer: Boston, MA, USA, 1998; Volume 11, ISBN 978-1-4613-7630-9. [Google Scholar]
  24. Sgroi, F.; Foderà, M.; Dana, L.P.; Mangiapane, G.; Tudisca, S.; Di Trapani, A.M.; Testa, R. Evaluation of payment for ecosystem services in Mediterranean forest: An empirical survey. Ecol. Eng. 2016, 90, 399–404. [Google Scholar] [CrossRef]
  25. Barroso, F.L.; Pinto-Correia, T.; Ramos, I.L.; Surová, D.; Menezes, H. Dealing with landscape fuzziness in user preference studies: Photo-based questionnaires in the Mediterranean context. Landsc. Urban Plan. 2012, 104, 329–342. [Google Scholar] [CrossRef] [Green Version]
  26. Van der Horst, D. Spatial cost–benefit thinking in multi-functional forestry; towards a framework for spatial targeting of policy interventions. Ecol. Econ. 2006, 59, 171–180. [Google Scholar] [CrossRef]
  27. Egarter Vigl, L.; Tasser, E.; Schirpke, U.; Tappeiner, U. Using land use/land cover trajectories to uncover ecosystem service patterns across the Alps. Reg. Environ. Chang. 2017, 17, 2237–2250. [Google Scholar] [CrossRef] [PubMed] [Green Version]
  28. Schirpke, U.; Meisch, C.; Tappeiner, U. Symbolic species as a cultural ecosystem service in the European Alps: Insights and open issues. Landsc. Ecol. 2018, 33, 711–730. [Google Scholar] [CrossRef] [Green Version]
  29. Schirpke, U.; Scolozzi, R.; De Marco, C.; Tappeiner, U. Mapping beneficiaries of ecosystem services flows from Natura 2000 sites. Ecosyst. Serv. 2014, 9, 170–179. [Google Scholar] [CrossRef]
  30. Häyhä, T.; Franzese, P.P.; Paletto, A.; Fath, B.D. Assessing, valuing, and mapping ecosystem services in Alpine forests. Ecosyst. Serv. 2015, 14, 12–23. [Google Scholar] [CrossRef]
  31. Grilli, G.; Paletto, A.; De Meo, I. Economic valuation of forest recreation in an alpine valley. Balt. For. 2014, 20, 167–175. [Google Scholar]
  32. Cantiani, M.; Geitner, C.; Haida, C.; Maino, F.; Tattoni, C.; Vettorato, D.; Ciolli, M. Balancing Economic Development and Environmental Conservation for a New Governance of Alpine Areas. Sustainability 2016, 8, 802. [Google Scholar] [CrossRef] [Green Version]
  33. De Meo, I.; Paletto, A.; Cantiani, M.G. The attractiveness of forests: Preferences and perceptions in a mountain community in Italy. Ann. For. Res. 2015, 58, 145–156. [Google Scholar] [CrossRef]
  34. Behr, D.M.; Ozgul, A.; Cozzi, G. Combining human acceptance and habitat suitability in a unified socio-ecological suitability model: A case study of the wolf in Switzerland. J. Appl. Ecol. 2017, 54, 1919–1929. [Google Scholar] [CrossRef]
  35. Riccioli, F.; Marone, E.; Boncinelli, F.; Tattoni, C.; Rocchini, D.; Fratini, R. The recreational value of forests under different management systems. New For. 2019, 50, 345–360. [Google Scholar] [CrossRef] [Green Version]
  36. IFNC. Third National Forest Inventory, 2015. Inventario Nazionale delle Foreste e dei Serbatoi Forestali di Carbonio. Ministero delle Politiche Agricole Alimentari e Forestali, Ispettorato Generale-Corpo Forestale dello Stato. Consiglio per la Ricerca e Speri; Ministero delle Politiche Agricole, Alimentari e Forestali: Rome, Italy, 2015.
  37. Unrau, A.; Becker, G.; Spinelli, R.; Lazdina, D.; Magagnotti, N.; Nicolescu, V.; Buckley, P.; Bartlett, D.; Kofman, P.D. Coppice Forests in Europe; University Freiburg: Freiburg im Breisgau, Germany, 2018; ISBN 9783981734027. [Google Scholar]
  38. Green, C.H.; Tunstall, S.M. The evaluation of river water quality improvements by the contingent valuation method. Appl. Econ. 1991, 23, 1135–1146. [Google Scholar] [CrossRef]
  39. Rodríguez, E.; Lacaze, V.; Lupín, B. Contingent Valuation of Consumers’ Willingness-to-Pay for Organic Food in Argentina. AgEcon Search 2008. [Google Scholar] [CrossRef]
  40. Wertenbroch, K.; Skiera, B. Measuring Consumers’ Willingness to Pay at the Point of Purchase. J. Mark. Res. 2002, 39, 228–241. [Google Scholar] [CrossRef]
  41. Tyrväinen, L.; Mäntymaa, E.; Juutinen, A.; Kurttila, M.; Ovaskainen, V. Private landowners’ preferences for trading forest landscape and recreational values: A choice experiment application in Kuusamo, Finland. Land Use Policy 2020, 104478. [Google Scholar] [CrossRef]
  42. Tuffery, L. The recreational services value of the nearby periurban forest versus the regional forest environment. J. For. Econ. 2017, 28, 33–41. [Google Scholar] [CrossRef]
  43. Molina, J.R.; Silva, F.R.Y.; Herrera, M.Á. Integrating economic landscape valuation into Mediterranean territorial planning. Environ. Sci. Policy 2016, 56, 120–128. [Google Scholar] [CrossRef]
  44. González, A.; Ortigoza, E.; Llamosas, C.; Blanco, G.; Amarilla, R. Multi-criteria analysis of economic complexity transition in emerging economies: The case of Paraguay. Socio-Econ. Plan. Sci. 2019, 68, 100617. [Google Scholar] [CrossRef]
  45. Grima, N.; Singh, S.J.; Smetschka, B. Improving payments for ecosystem services (PES) outcomes through the use of Multi-Criteria Evaluation (MCE) and the software OPTamos. Ecosyst. Serv. 2018, 29, 47–55. [Google Scholar] [CrossRef]
  46. Voltaire, L.; Donfouet, H.P.P.; Pirrone, C.; Larzillière, A. Respondent Uncertainty and Ordering Effect on Willingness to Pay for Salt Marsh Conservation in the Brest Roadstead (France). Ecol. Econ. 2017, 137, 47–55. [Google Scholar] [CrossRef]
  47. Kniivilä, M. Users and non-users of conservation areas: Are there differences in WTP, motives and the validity of responses in CVM surveys? Ecol. Econ. 2006, 59, 530–539. [Google Scholar] [CrossRef]
  48. Venkatachalam, L. The contingent valuation method: A review. Environ. Impact Assess. Rev. 2004, 24, 89–124. [Google Scholar] [CrossRef]
  49. Boyle, K.J.; Johnson, F.R.; McCollum, D.W.; Desvousges, W.H.; Dunford, R.W.; Hudson, S.P. Valuing Public Goods: Discrete versus Continuous Contingent-Valuation Responses. Land Econ. 1996, 72, 381. [Google Scholar] [CrossRef]
  50. Alphonce, R.; Alfnes, F.; Sharma, A. Consumer vs. citizen willingness to pay for restaurant food safety. Food Policy 2014, 49, 160–166. [Google Scholar] [CrossRef]
  51. Andersen, S.; Harrison, G.W.; Lau, M.I.; Rutström, E.E. Elicitation using multiple price list formats. Exp. Econ. 2006, 9, 383–405. [Google Scholar] [CrossRef]
  52. Cameron, T.A.; James, M.D. Efficient Estimation Methods for “Closed-Ended” Contingent Valuation Surveys. Rev. Econ. Stat. 1987, 69, 269. [Google Scholar] [CrossRef]
  53. Tian, X.; Yu, X.; Holst, R. Applying the Payment Card Approach to Estimate the WTP for Green Food in China; Publisher ZBW – Leibniz Information Centre for Economics: Kiel, Germany, 2011. [Google Scholar]
  54. Cameron, A.C.; Trivedi, P.K. Microeconometrics: Methods and Applications; Cambridge University Press: New York, NY, USA, 2005. [Google Scholar]
  55. Bernetti, I.; Ciampi, C.; Fagarazzi, C.; Sacchelli, S. I comparti forestale e di prima trasformazione del legno. In Stima della Potenzialità Produttiva delle Agrienergie in Toscana; ARSIA: Firenze, Italy, 2009; pp. 43–70. [Google Scholar]
  56. Sacchelli, S.; Fagarazzi, C.; Bernetti, I. Economic evaluation of forest biomass production in central Italy: A scenario assessment based on spatial analysis tool. Biomass Bioenergy 2013, 53, 1–10. [Google Scholar] [CrossRef] [Green Version]
  57. Clark, R.N.; Stankey, G.H. The Recreation Opportunity Spectrum: A Framework for Planning, Management, and Research; Gen. Tech. Rep. PNW-GTR-098; U.S. Department of Agriculture, Forest Service, Pacific Northwest Research Station: Portland, OR, USA, 1979; Volume 98, 32p.
  58. Blocker, L.; Slider, T.; Ruchman, J.; Mosier, J.; Kok, L.; Silbemagle, J.; Beard, J.; Wagner, D.; Brogan, D.; Jones, D.; et al. Landscape Aesthetics (AH 701-l)-Recreation Opportunity Spectrum; U.S. Department of Agriculture (USDA): Washingthon, DC, USA, 1995.
  59. Perez-Verdin, G.; Lee, M.E. Use of the recreation opportunity spectrum in natural protected area planning and management. In Recreation Visitor Research: Studies of Diversity; Gen. Tech. Rep., PSW-GTR-210; Chavez Deborah, J., Winter Patricia, L., Absher James, D., Eds.; U.S. Department of Agriculture, Forest Service, Pacific Southwest Research Station: Albany, CA, USA, 2008; Chapters 23–28; pp. 23–38. [Google Scholar]
  60. Riccioli, F.; Pierre, J.; Asmar, E.; El Asmar, T.; El Asmar, J.P.; El Asmar, T. Rete natura 2000 reviewed through territorial GIS Zoning. In Proceedings of the 5th International Conference on Information and Communication Technologies in Agriculture, Food and Environment (HAICTA 2011), Skiathos Island, Greece, 8–11 September 2011; Volume 1152. [Google Scholar]
  61. Toscana, R. Inventario Forestale Toscano; Regione Toscana: Florence, Italy, 2009. [Google Scholar]
  62. Brown, K.M.; Taylor, L.O. Do as You Say, Say as You Do: Evidence on Gender Differences in Actual and Stated Contributions to Public Goods. J. Econ. Behav. Organ. 2000, 43, 127–139. [Google Scholar] [CrossRef]
  63. Burkhard, B.; Maes, J. Mapping Ecosystem Services on Different Scales; Pensoft Publishers: Sofia, Bulgaria, 2017; ISBN 9789546428295. [Google Scholar]
  64. Logsdon, R.A.; Chaubey, I. A quantitative approach to evaluating ecosystem services. Ecol. Modell. 2013, 257, 57–65. [Google Scholar] [CrossRef]
  65. Cimini, D.; Portoghesi, L.; Madonna, S.; Grimaldi, S.; Corona, P. Multifactor empirical mapping of the protective function of forests against landslide occurrence: Statistical approaches and a case study. IForest 2016, 9, 383–393. [Google Scholar] [CrossRef] [Green Version]
  66. Jacobs, S.; Burkhard, B.; Van Daele, T.; Staes, J.; Schneiders, A. “The Matrix Reloaded”: A review of expert knowledge use for mapping ecosystem services. Ecol. Modell. 2015, 295, 21–30. [Google Scholar] [CrossRef]
  67. Kopperoinen, L.; Luque, S.; Tenerelli, P.; Zulian, G.; Viinikka, A. Introduction Chapter: Mapping cultural ecosystem services. In Mapping Ecosystem Services on Different Scales; Pensoft Publishers: Sofia, Bulgaria, 2017. [Google Scholar]
  68. Barbati, A.; Marchetti, M.; Chirici, G.; Corona, P. Forest Ecology and Management European Forest Types and Forest Europe SFM indicators: Tools for monitoring progress on forest biodiversity conservation. For. Ecol. Manag. 2014, 321, 145–157. [Google Scholar] [CrossRef] [Green Version]
  69. Ressurreição, A.; Gibbons, J.; Dentinho, T.P.; Kaiser, M.; Santos, R.S.; Edwards-Jones, G. Economic valuation of species loss in the open sea. Ecol. Econ. 2011, 70, 729–739. [Google Scholar] [CrossRef]
  70. Berrens, R.P.; Bohara, A.K.; Kerkvliet, J. A Randomized Response Approach to Dichotomous Choice Contingent Valuation. Am. J. Agric. Econ. 1997, 79, 252–266. [Google Scholar] [CrossRef]
  71. Bord, R.J.; O’Connor, R.E. The Gender Gap in Environmental Attitudes: The Case of Perceived Vulnerability to Risk. Soc. Sci. Q. 1997, 78, 830–840. [Google Scholar]
  72. Birol, E.; Karousakis, K.; Koundouri, P. Using economic valuation techniques to inform water resources management: A survey and critical appraisal of available techniques and an application. Sci. Total Environ. 2006, 365, 105–122. [Google Scholar] [CrossRef]
  73. Tempesta, T.; Thiene, M. Percezione e Valore del Paesaggio; Angeli, F., Ed.; Franco: Angeli, Finland, 2006; ISBN 9788846479136. [Google Scholar]
  74. Pawar, K.V.; Rothkar, R.V. Forest Conservation & Environmental Awareness. Procedia Earth Planet. Sci. 2015, 11, 212–215. [Google Scholar] [CrossRef] [Green Version]
  75. Tattoni, C.; Ianni, E.; Geneletti, D.; Zatelli, P.; Ciolli, M. Landscape changes, traditional ecological knowledge and future scenarios in the Alps: A holistic ecological approach. Sci. Total Environ. 2017, 579, 27–36. [Google Scholar] [CrossRef]
  76. Ferretti, F.; Sboarina, C.; Tattoni, C.; Vitti, A.; Zatelli, P.; Geri, F.; Pompei, E.; Ciolli, M.; Ferretti, F.; Sboarina, C.; et al. The 1936 Italian Kingdom Forest Map reviewed: A dataset for landscape and ecological research. Ann. Silvic. Res. 2018, 42, 3–19. [Google Scholar] [CrossRef]
  77. Hu, W. Comparing consumers’ preferences and willingness to pay for non-GM oil using a contingent valuation approach. Empir. Econ. 2006, 31, 143–150. [Google Scholar] [CrossRef]
  78. Kula, E. Economics of Natural Resources, the Environment and Policies; Springer: Dordrecht, The Netherlands, 1994. [Google Scholar]
  79. Azuma, K.; Kagi, N.; Kim, H.; Hayashi, M. Impact of climate and ambient air pollution on the epidemic growth during COVID-19 outbreak in Japan. Environ. Res. 2020, 190, 110042. [Google Scholar] [CrossRef] [PubMed]
  80. Wang, Q.; Su, M. A preliminary assessment of the impact of COVID-19 on environment—A case study of China. Sci. Total Environ. 2020, 728, 138915. [Google Scholar] [CrossRef] [PubMed]
  81. Rugani, B.; Caro, D. Impact of COVID-19 outbreak measures of lockdown on the Italian Carbon Footprint. Sci. Total Environ. 2020, 737, 139806. [Google Scholar] [CrossRef] [PubMed]
  82. Somani, M.; Srivastava, A.N.; Gummadivalli, S.K.; Sharma, A. Indirect implications of COVID-19 towards sustainable environment: An investigation in Indian context. Bioresour. Technol. Rep. 2020, 11, 100491. [Google Scholar] [CrossRef]
  83. ISTAT Inflazione Per il 2020 in Italia. Analisi e Tabelle con Indici. Available online: https://www.rivaluta.it/inflazione/inflazione-2020.asp (accessed on 16 September 2020).
  84. Regione Toscana Psr 2014–2020 della Toscana: Misure, Sottomisure e Operazioni-Notizie-Regione Toscana. Available online: http://www.regione.toscana.it/-/psr-2014-2020-della-toscana-misure-sottomisure-e-operazioni (accessed on 20 May 2019).
  85. Riccioli, F.; Fratini, R.; Marone, E.; Fagarazzi, C.; Calderisi, M.; Brunialti, G. Indicators of sustainable forest management to evaluate the socio-economic functions of coppice in Tuscany, Italy. Socio-Econ. Plan. Sci. 2019, 100732. [Google Scholar] [CrossRef]
  86. Fabbio, G.; Cutini, A. Coppice today: Which management beyond definitions? For. -Riv. Selvic. Ecol. For. 2017, 14, 257–274. [Google Scholar] [CrossRef]
  87. Ciccarese, L.; Crosti, R.; Cascone, C.; Cipollaro, S.; Ballarin Denti, A.; Fontanarosa, E.; Masiero, M.; Pizzuto Antinoro, M.; Veca, L.M.D. Status Report of Forest Biomass Use in the Mediterranean Region; Proforbiomed Report; Case-study; ISPRA: Varese, Italy, 2012.
  88. Machado, A. An index of naturalness. J. Nat. Conserv. 2004, 12, 95–110. [Google Scholar] [CrossRef]
  89. Lienhoop, N.; MacMillan, D. Valuing wilderness in Iceland: Estimation of WTA and WTP using the market stall approach to contingent valuation. Land Use Policy 2007, 24, 289–295. [Google Scholar] [CrossRef]
  90. Orsi, F.; Geneletti, D.; Borsdorf, A. Mapping wildness for protected area management: A methodological approach and application to the Dolomites UNESCO World Heritage Site (Italy). Landsc. Urban Plan. 2013, 120, 1–15. [Google Scholar] [CrossRef]
  91. Carver, S.J.; Fritz, S. Mapping Wilderness; Concepts, Techniques and Applications; Springer: Berlin/Heidelberg, Germany, 2016; pp. 1–204. [Google Scholar] [CrossRef]
  92. Kelson, A.R. Integrating wilderness within broader landscapes: The U.S. public land experience. Land Use Policy 1998, 15, 181–189. [Google Scholar] [CrossRef]
  93. Lupp, G.; Höchtl, F.; Wende, W. “Wilderness”—A designation for Central European landscapes? Land Use Policy 2011, 28, 594–603. [Google Scholar] [CrossRef]
  94. Palonen, T.; Hyyti, H.; Visala, A. Augmented Reality in Forest Machine Cabin. IFAC-PapersOnLine 2017, 50, 5410–5417. [Google Scholar] [CrossRef]
  95. Sacchelli, S.; Grilli, G.; Capecchi, I.; Bambi, L.; Barbierato, E.; Borghini, T. Neuroscience Application for the Analysis of Cultural Ecosystem Services Related to Stress Relief in Forest. Forests 2020, 11, 190. [Google Scholar] [CrossRef] [Green Version]
  96. Sacchelli, S.; Favaro, M. A Virtual-Reality and Soundscape-Based Approach for Assessment and Management of Cultural Ecosystem Services in Urban Forest. Forests 2019, 10, 731. [Google Scholar] [CrossRef] [Green Version]
  97. Mattila, O.; Korhonen, A.; Pöyry, E.; Hauru, K.; Holopainen, J.; Parvinen, P. Restoration in a virtual reality forest environment. Comput. Hum. Behav. 2020, 107, 106295. [Google Scholar] [CrossRef]
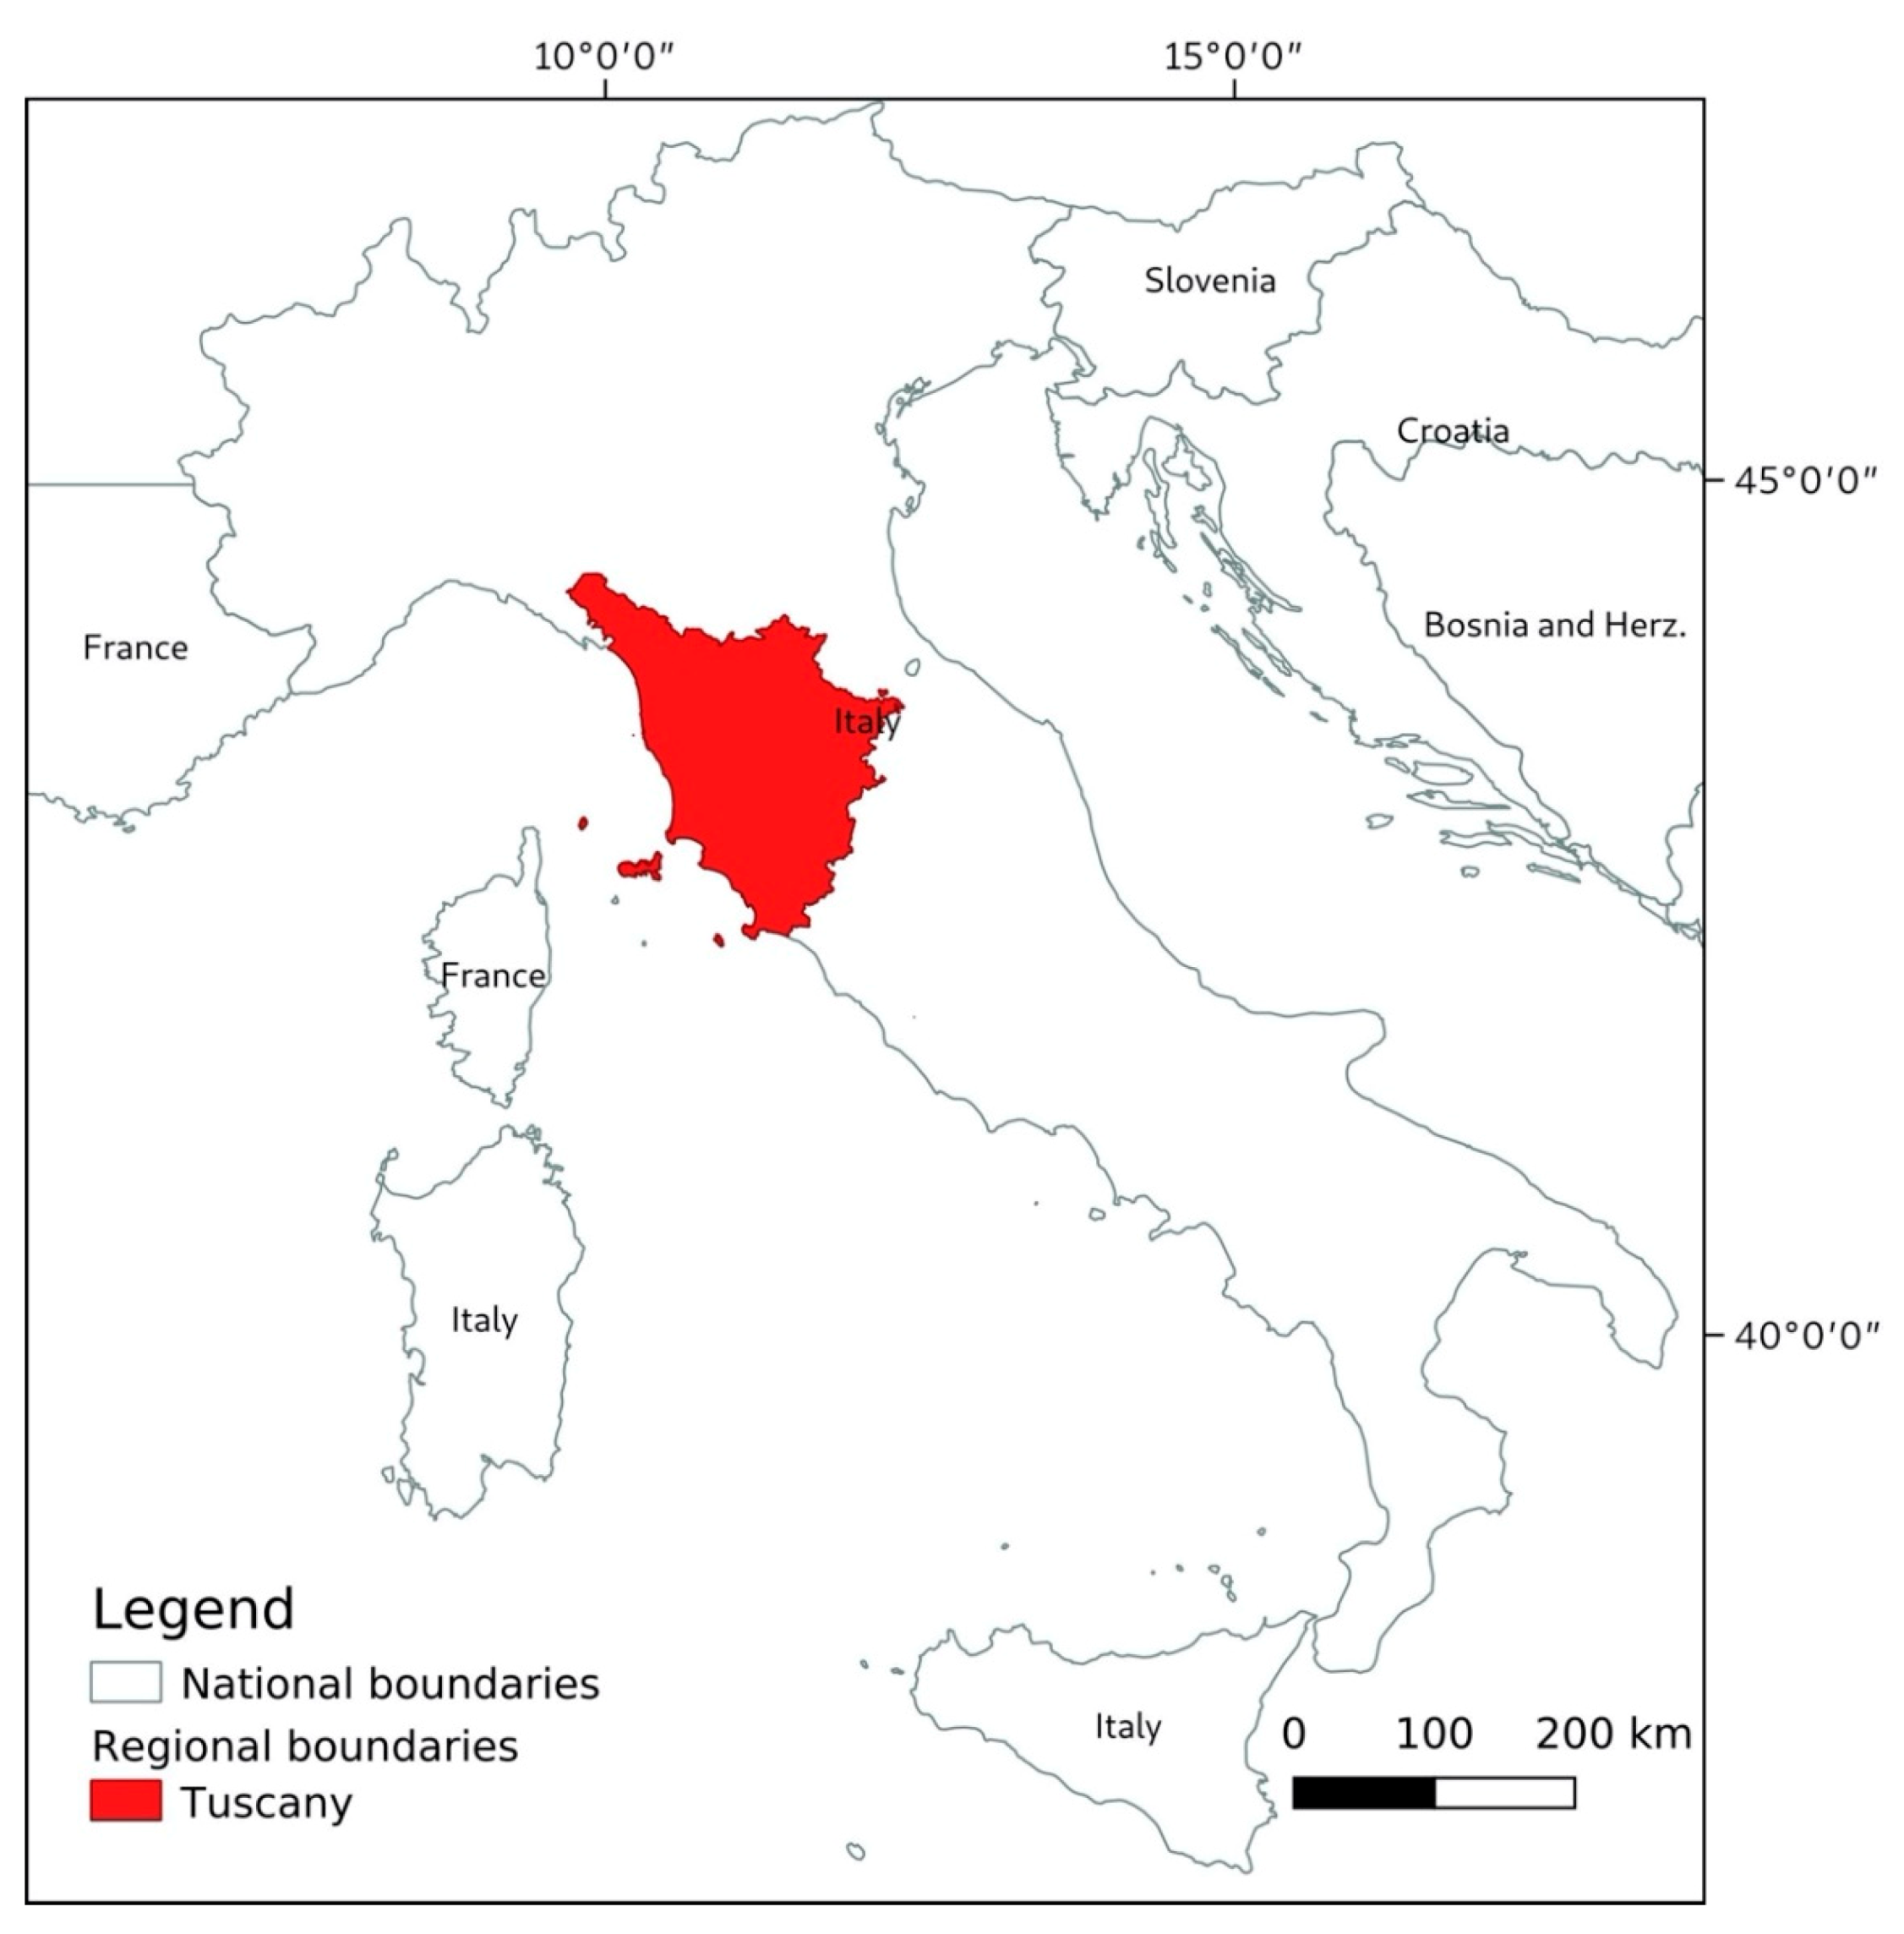
Figure 1. Location of Tuscany region in Italy.
Sustainability 12 08039 g001
Figure 2. Detail of the study area, location of the sample sites, provinces, coverage of the European Forest Types (Reclassification of CLC 2012) and elevation.
Sustainability 12 08039 g002
Figure 3. Flowchart with all steps performed in the analysis.
Sustainability 12 08039 g003
Figure 4. WTP for each management approach and spatialization of the sampled data.
Sustainability 12 08039 g004
Table 1. Descriptive statistics of respondents.
Variable.DescriptionMeanSD
Age1 = 18–35 years old; 2 = 36–50; 3 = 51–65; 4 = >652.021.01
GenderDummy variable 1 = female; 0 = male0.540.50
Educational
degree
1 = primary school; 2 = secondary school; 3 = high school; 4 = Master of Science or above 3.010.64
Occupation1 = student; 2 = retired; 3 = housekeeper; 4 = employee; 5 = freelance; 6 = unemployed3.081.66
WTPValues in the payment card (interval values from 0 to 22 euros per year)(1) Coppice7.445.13
(2) Conversion to high forest8.645.31
(3) Natural evolution6.525.66
Table 2. Frequencies of WTP.
Euros/year0 €2 €4 €6 €8 €10 €12 €14 €16 €18 €20 €22 €Total
Coppice153938364026181311255248
Conversion5323734334113141512102248
Nat. Evolution49342744192418114864248
Table 3. Interval data regression for forest management approaches.
VariablesCoef.Std. Err.tp > |t|
Conversion1.230.206.060.000 **
N_evolution−1.190.21−5.780.000 **
Constant6.370.3021.480.000
σu a4.080.2516.600.000
σe b3.840.1624.630.000
ρ0.530.04
Log likelihood−1644.28
Wald Chi2(10)46.70
Prob > Chi20.000
Observation744
Groups248
a Standard deviation of individual effect. b Standard deviation of residual.** p < 0.01.
Table 4. Interval data regression with selected municipality-related explanatory variables.
VariablesCoef.Std. Err.tp > |t|
Conversion0.980.313.160.0020 **
N_evolution−1.100.31−3.490.0000 **
Natural*Conversion−0.680.94−0.720.4710
Natural*N_evolution0.930.950.990.3240
Mountain*Conversion1.240.881.410.1580
Mountain*N_evo−1.840.88−2.090.0370 *
Constant6.700.37180.0000
σu a3.940.3112.70.0000
σe b3.910.1722.550.0000
ρ0.500.05
Log likelihood−1008.54
Wald Chi2(10)35.58
Prob > Chi20.000
Observation453
Groups151
a Standard deviation of individual effect. b Standard deviation of residual. ** p < 0.01, * p < 0.05.