5.1. Thematic Area 1: Outcome. What Are the Expected Outcomes of Successfully Using the SDG Measurement Mechanism?
The “Outcome” section is the first of three thematic areas that focuses on the broader organisational ambitions of sustainability, sustainable development and SDGs. The results are collated under the following headings: the challenge/problem, the opportunities and the imperative for change. This thematic collected the second highest (out of 23 nodes and sub-nodes) number of references (n = 81) in NVivo for business views on the expected outcomes.
5.1.1. The Challenge/Problem
The essence of the problem was articulated by participant 10: “The weaknesses of the impact measures relate to some of the quantification of it in that there is no standard way of doing it and therefore quantifying impact is very difficult…. The leadership is not fully bought into it. It could be you have not got good sufficient tools for learning and education behind it. There is a lack of consistency in the data of how you measure it and the people measure it in different ways and people will have different perspectives of what good looks like”. These views are similar to those of participant 26, who also noted the level of complexity, especially when positioned in a global context with the inherent cultural variations, which is potentially why so many participants only claimed to measure the SDGs at a high level: “This is so complex and it is so different if we are doing things in different countries with different organisations across different environments”.
5.1.2. Overarching Opportunity
There were many participants that identified opportunities for improvement, and these are mostly captured under section three on “Contexts”. The ambition, noted by many, was summed up by participant 26, who was from an international organisation and who gave this insight into his global organisation’s aim: “In three years’ time we would like to be in a position to have enough information based on evidence and frameworks in place so that we can have better conversations earlier on with clients about what the potential benefits are for the project and why we should be doing projects possibly in a different way than given to us by donors and others.” He continued by anticipating the broader causal impacts of having this mechanism in place: “So, if we understand the linkages contribution projects can have across several SDGs, and how that impact could be measured, then we can have better conversations to understand where people should be investing their money and how, and what other aspects to bring into our project to ensure long-term sustainability”. This places emphasis on using the SDGs to make better investment decisions, which becomes one of the critical success factors of the employment of this mechanism.
5.1.3. Imperative for Change and Commitment to Measure SDGs
Participant 13 explained the key part that SDGs contribute to the company’s approach to the broader sustainability agenda: “The SDGs and our impacts on them are of huge relevance to our industry. We are already fully committed to measuring our impact across the triage of economic, social and environmental sustainability themes. Our leadership is fully committed to owning delivery success against these targets, which we jointly assess with our tier 1 contractors. It is now considered core business to ensure the right levels of scrutiny and governance to manage sustainable development performance. In future, this will include measurement against SDG targets but, for now, we need to find a practical method for doing this well.” The final comment in the extract highlights the difficulty of moving from “knowing to doing”.
Many commented on the link between SDG measurement and their company’s values. For example, participant 5: “because our purpose is far more than simply generating revenues for shareholders… for us, it is about influencing those solutions to provide the right long-term infrastructure for society. So, we provide jobs and the right training and we provide the infrastructure we need to connect life together; everything we do depends on it—to try to capture the way we go about doing that in more modern ways for future societies”. Although many were better able to relate progress stories with their sustainability measurement, there were others, such as participant 28: “the whole world has decided how it can be rapidly made better, so the 169 SDG targets are a compass for humanity”.
The theme of creating shared value [
59,
60] was commented on by a number of participants (2, 5, 8, 10, 11, 13 and 19), one of whom, a CEO, commented, “Since becoming Responsible Business of the Year, we have been working hard to show others how sustainability makes good business sense.” This quote emphasises that the notion of creating shared value (CSV) [
59,
60], whilst not always using the specific language of CSV, is a growing reason to engage with SDGs and sustainability more generally.
The global context and the relationship of the global SDG goals to businesses was a common theme, as indicated by participant 24, head of infrastructure for his company, who said “in a world where populations are increasing, cities are expanding and the effect on our environment is more apparent than ever before, the need for infrastructure that is affordable, sustainable and effective is vital. Engineers have a pivotal role to play in designing infrastructure that is not only effective but does not harm the environment in which we live”.
The first major finding derived from this analysis is as follows.
Findings #1: to achieve the outcomes of measuring SDG impacts at subnational level, business priorities can be aligned across economic, environment and society ambitions, and it can make good business sense to do this.
5.2. Thematic Area 2: Mechanism. What Mechanism (for Measuring SDG Impacts) Is in Place to Achieve the Outcomes?
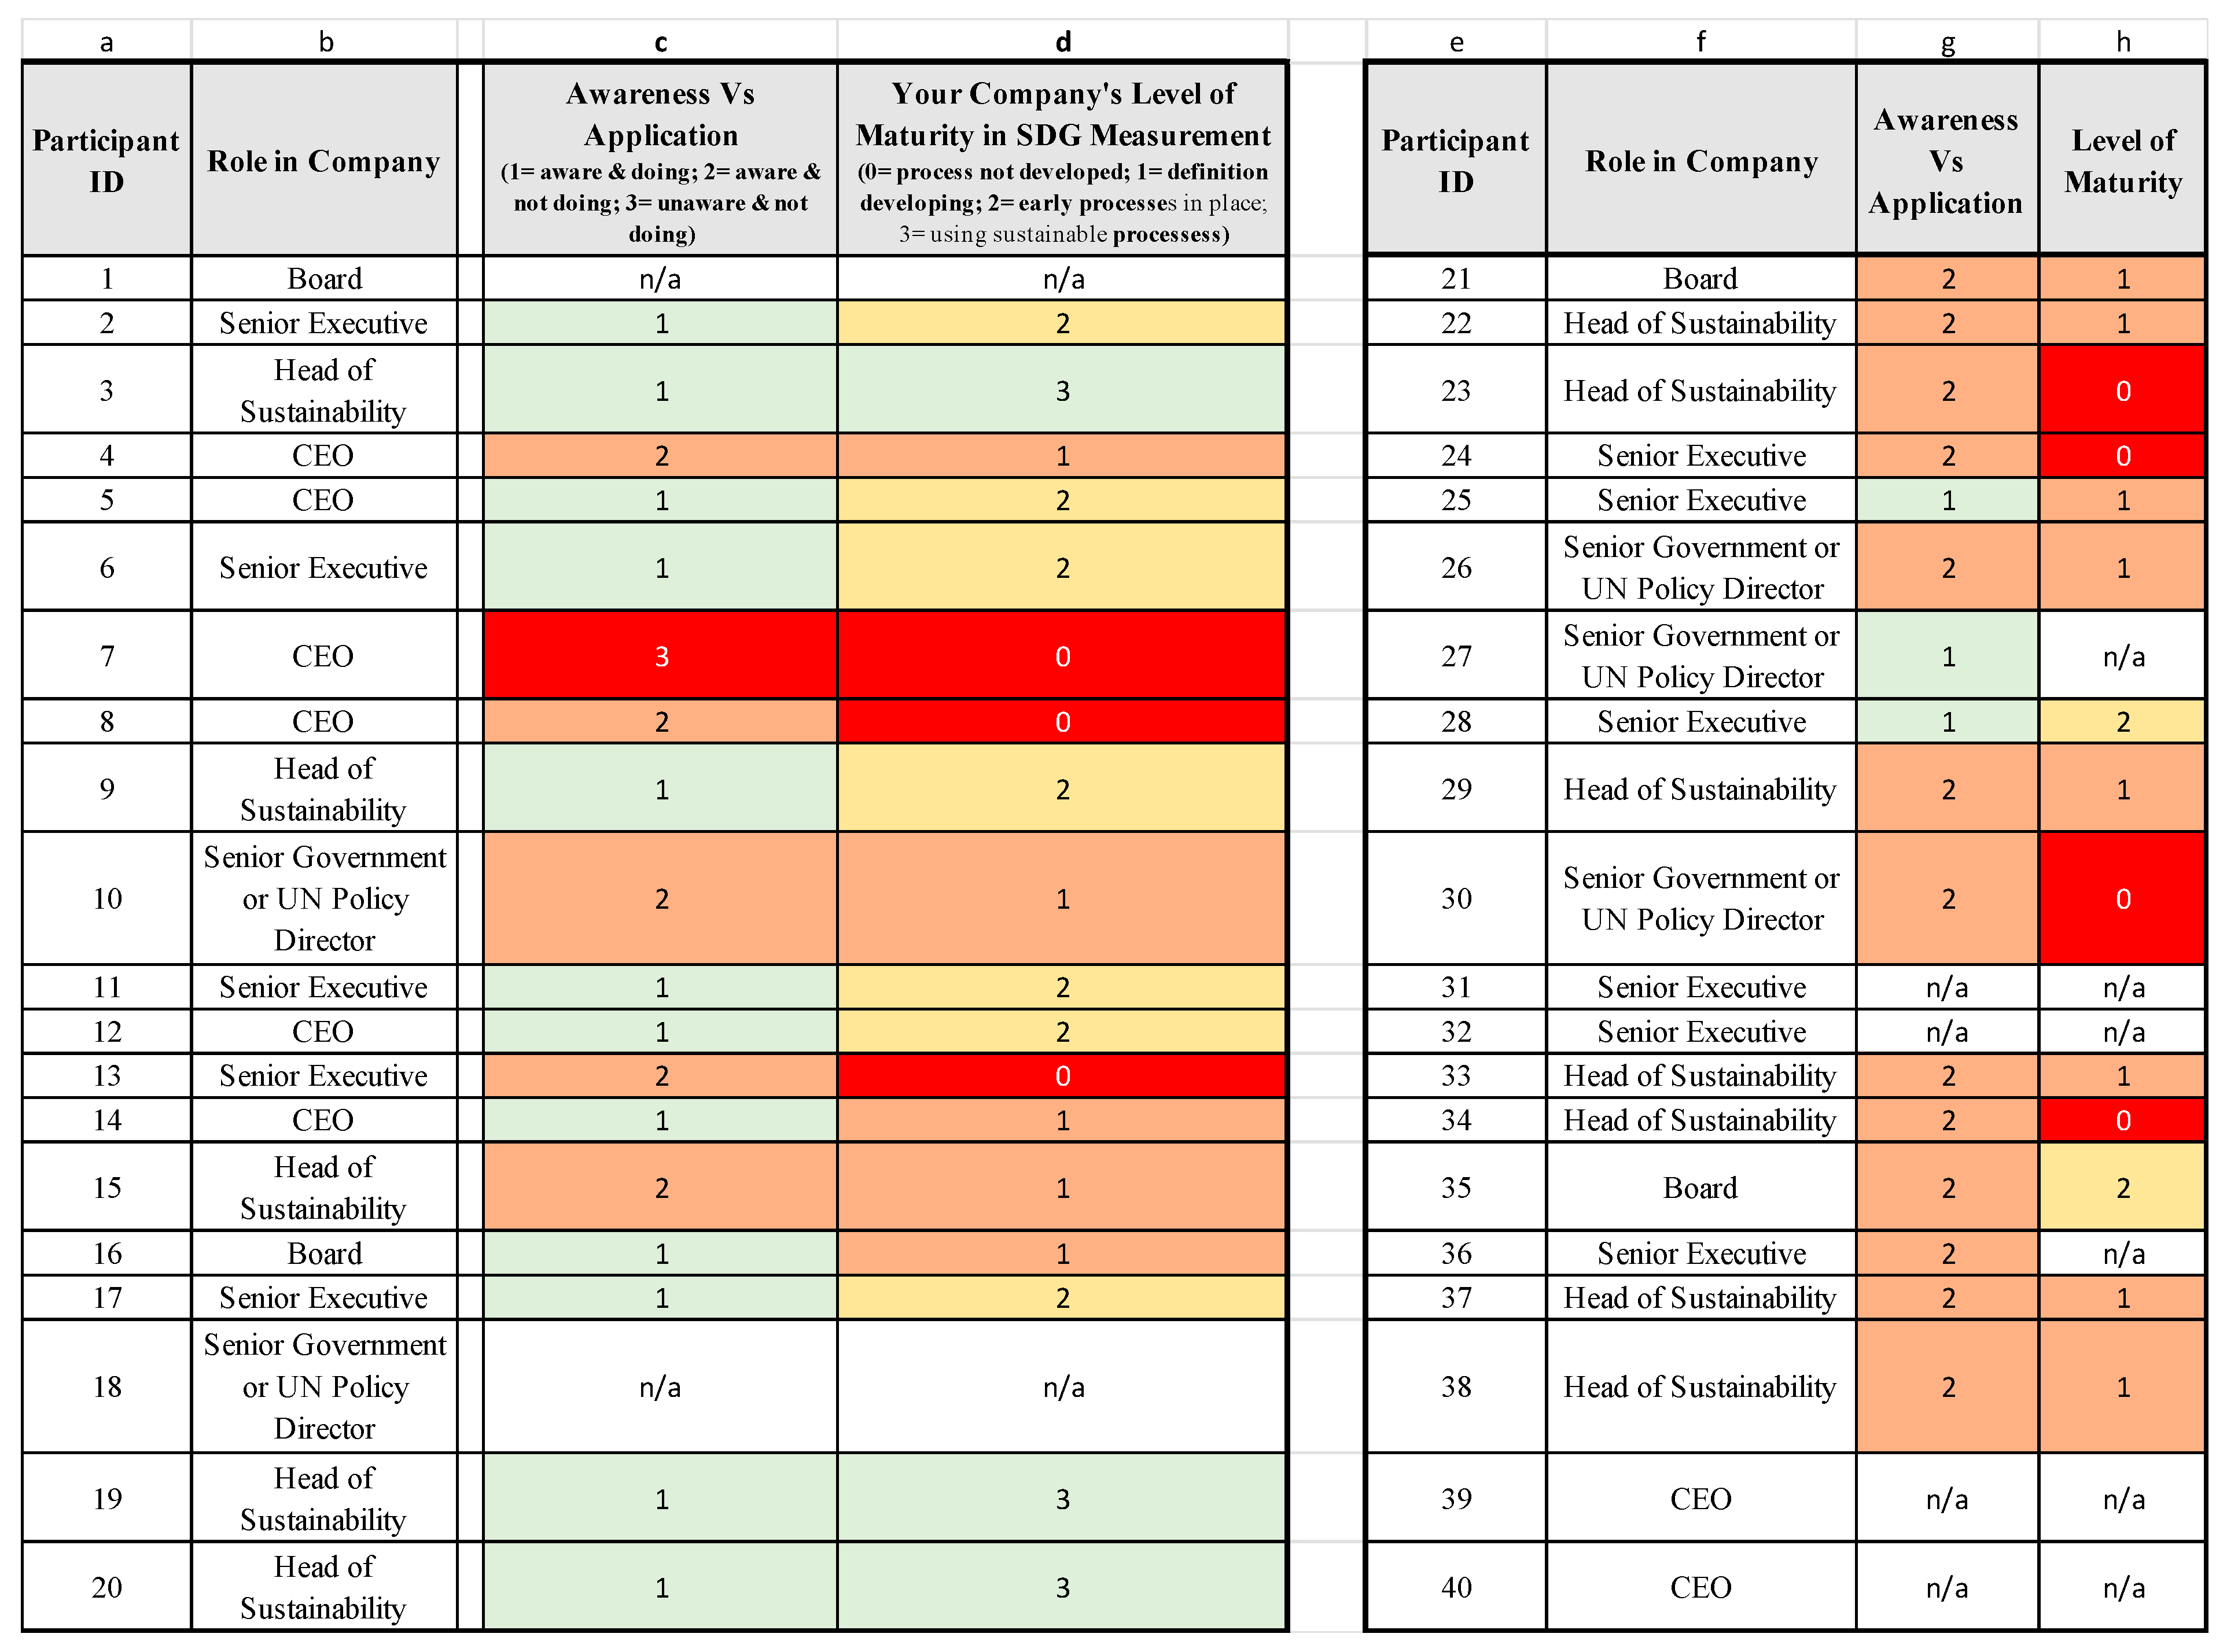
The second area of discussion was for the participant to self-assess their company’s “awareness and application” and also, if they were applying SDGs, what the level of process maturity of their SDG measurement was. The data in
Figure 8 show the feedback from the participants when they were asked to score themselves against a Likert-style scale, as shown in the first row in columns c and d.
5.2.1. Company’s “Awareness and Application” of SDG Measurement in Construction Projects
As part of the interviews, all participants were asked to describe their awareness of sustainability, sustainable development and SDGs. They were then asked to describe their current level of SDG measurement maturity. The data on these are shown in
Figure 9.
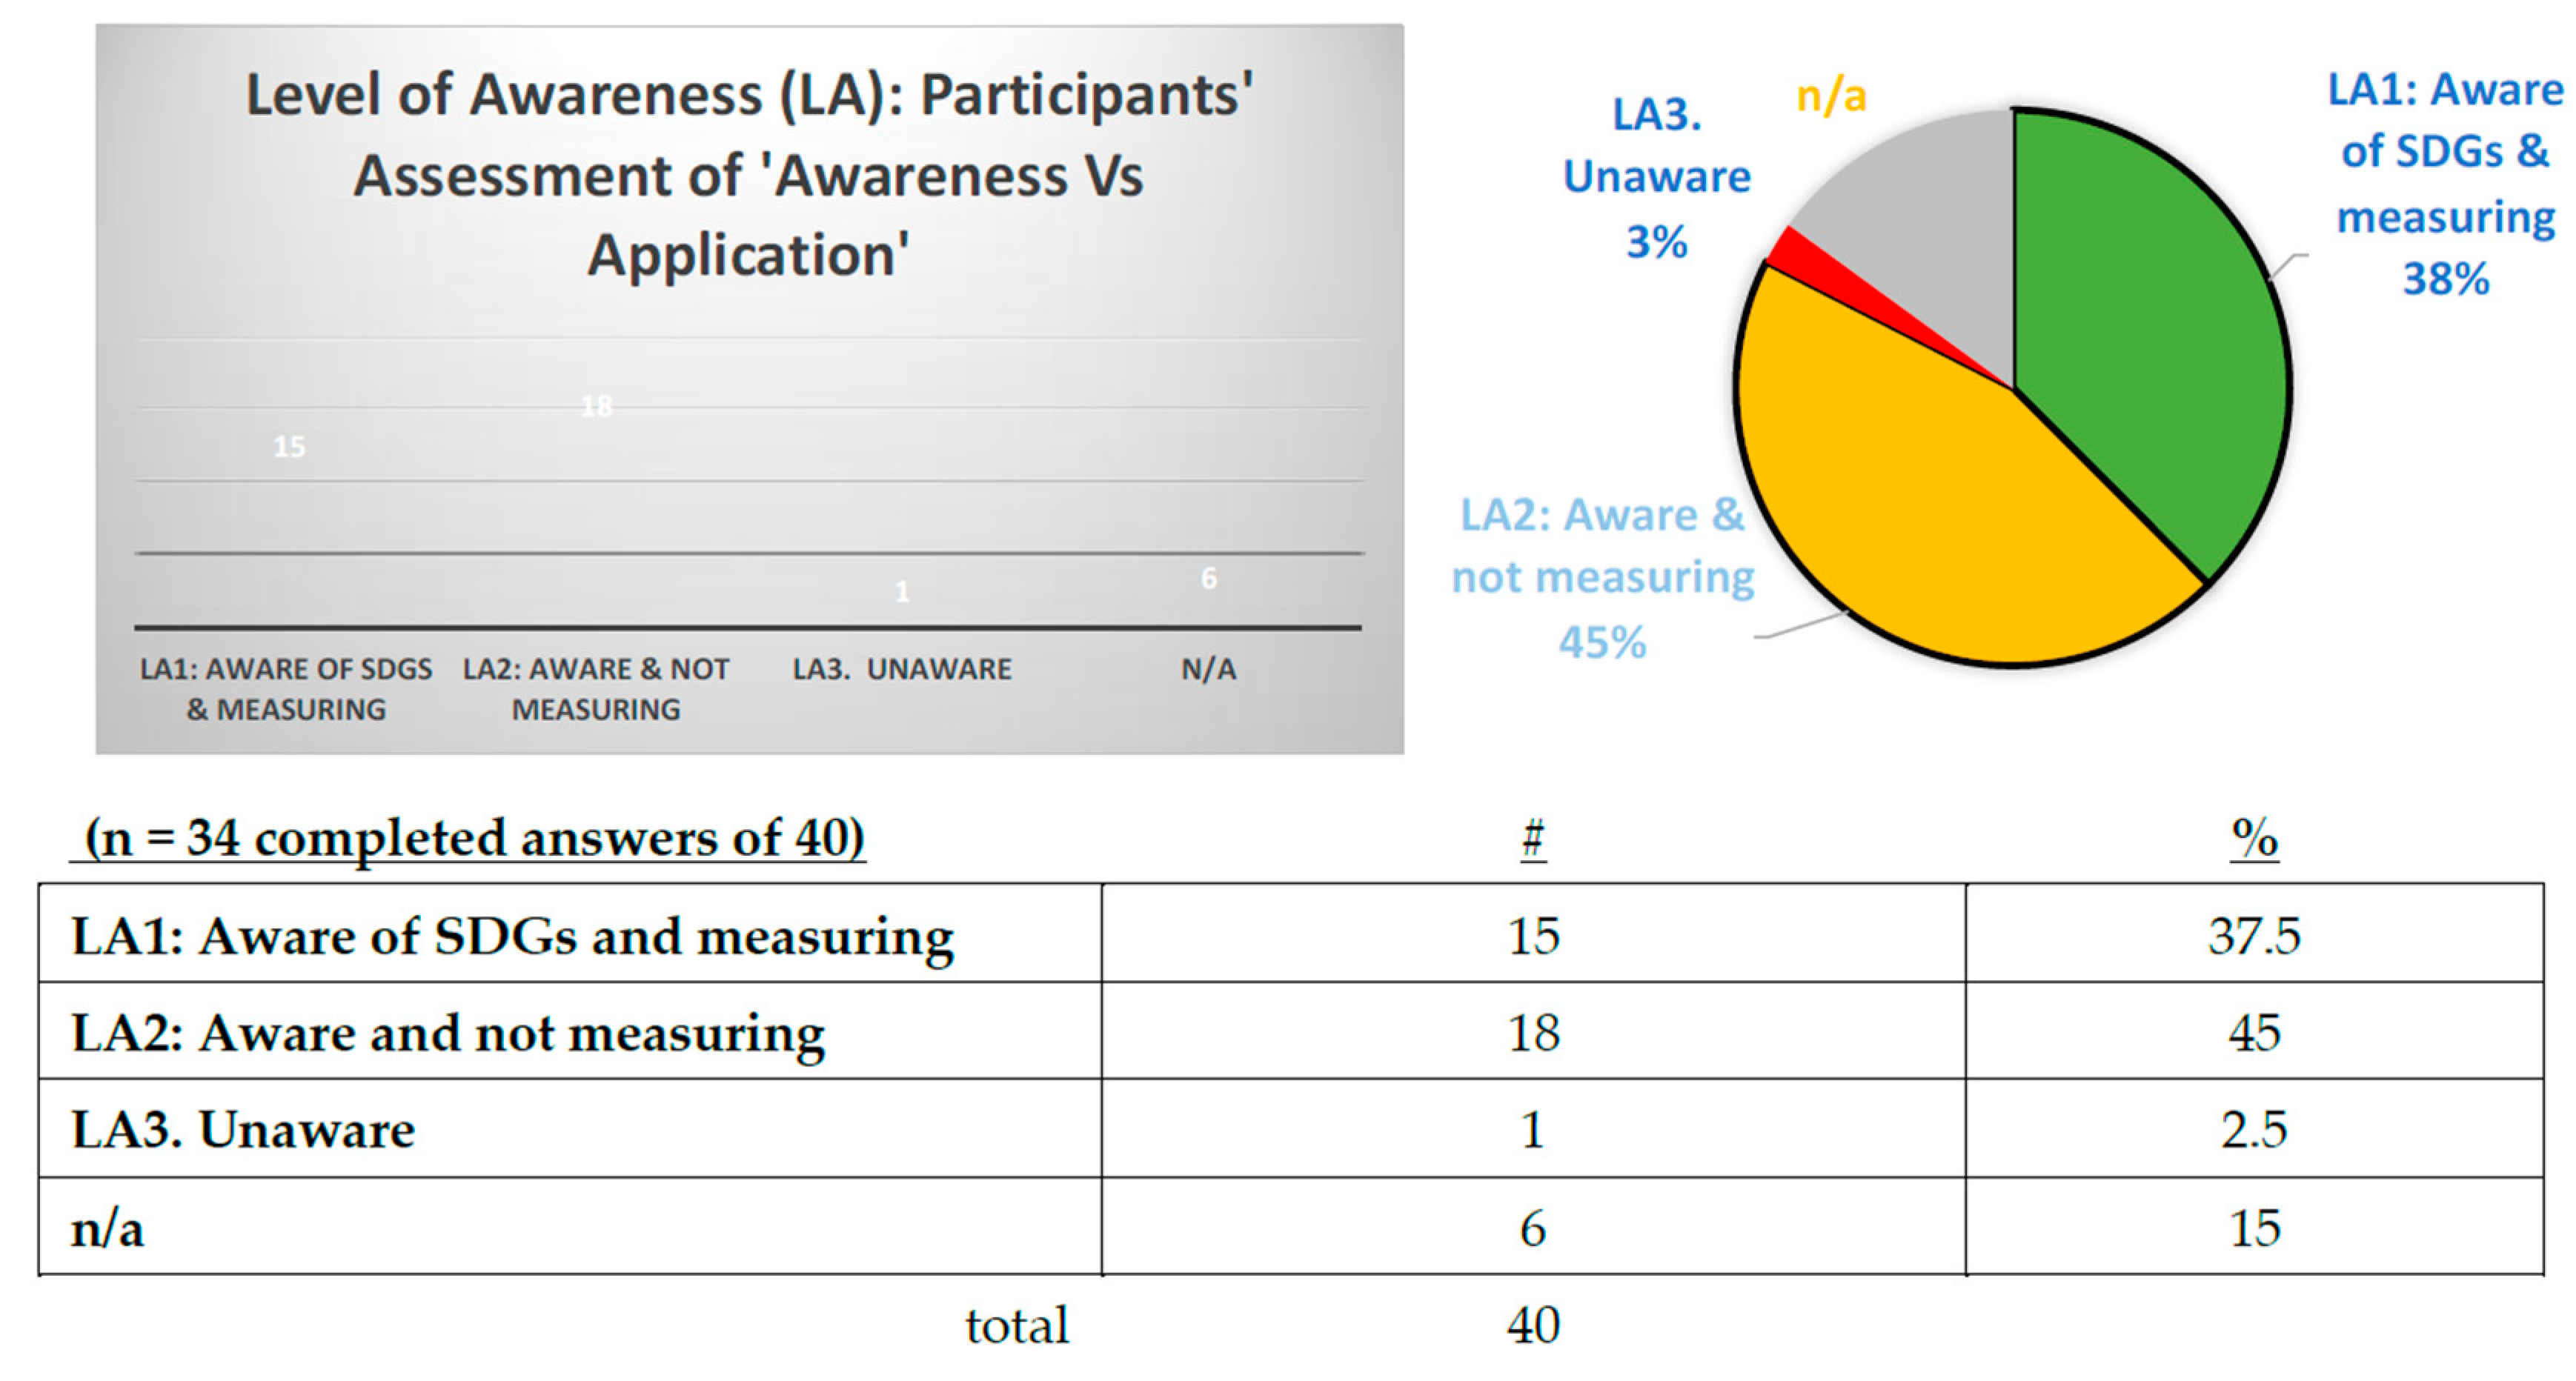
At the lower end of the spectrum (level 3 = unaware and not doing it), participant 37 admitted that, regarding “the United Nations Sustainable Development Goals, I had never heard of them—a request for an interview came through and [name withheld] only heard of them through a bid we were working on that included an SDG question. The SDGs have no current place in our business”. As this was a board member, this was surprising because it was expected that senior staff would have some level of SDG knowledge.
In the middle range, which was “aware and not doing”, representing 47% of the participants, participant 4′s answer was typical: “Awareness is that we are doing some discrete things but not in any depth”. The reasons for this varied, but a common theme was that there was not a requirement from governments or clients, as participant 21 shares: “We do not have a demand from our clients or from our communities that we work to measure against the SDGs. Like many in our industry, these are not common terms that we use… we do not have as much benefit from embedding them as much as a large global company that perhaps needs to demonstrate SDG impact more visibly. A lot of the things we do implicitly encompass the SDGs, but we are not explicitly measuring against them”.
In the higher range, which was “aware and measuring”, represented by 38% of the participants, there were some examples of significant progress, such as that shared by participant 7: “Every single project in the organisation will feed into SDG number 11—‘sustainable cities and communities’—and every project in the organisation will address at least 4–5 of the SDGs”.
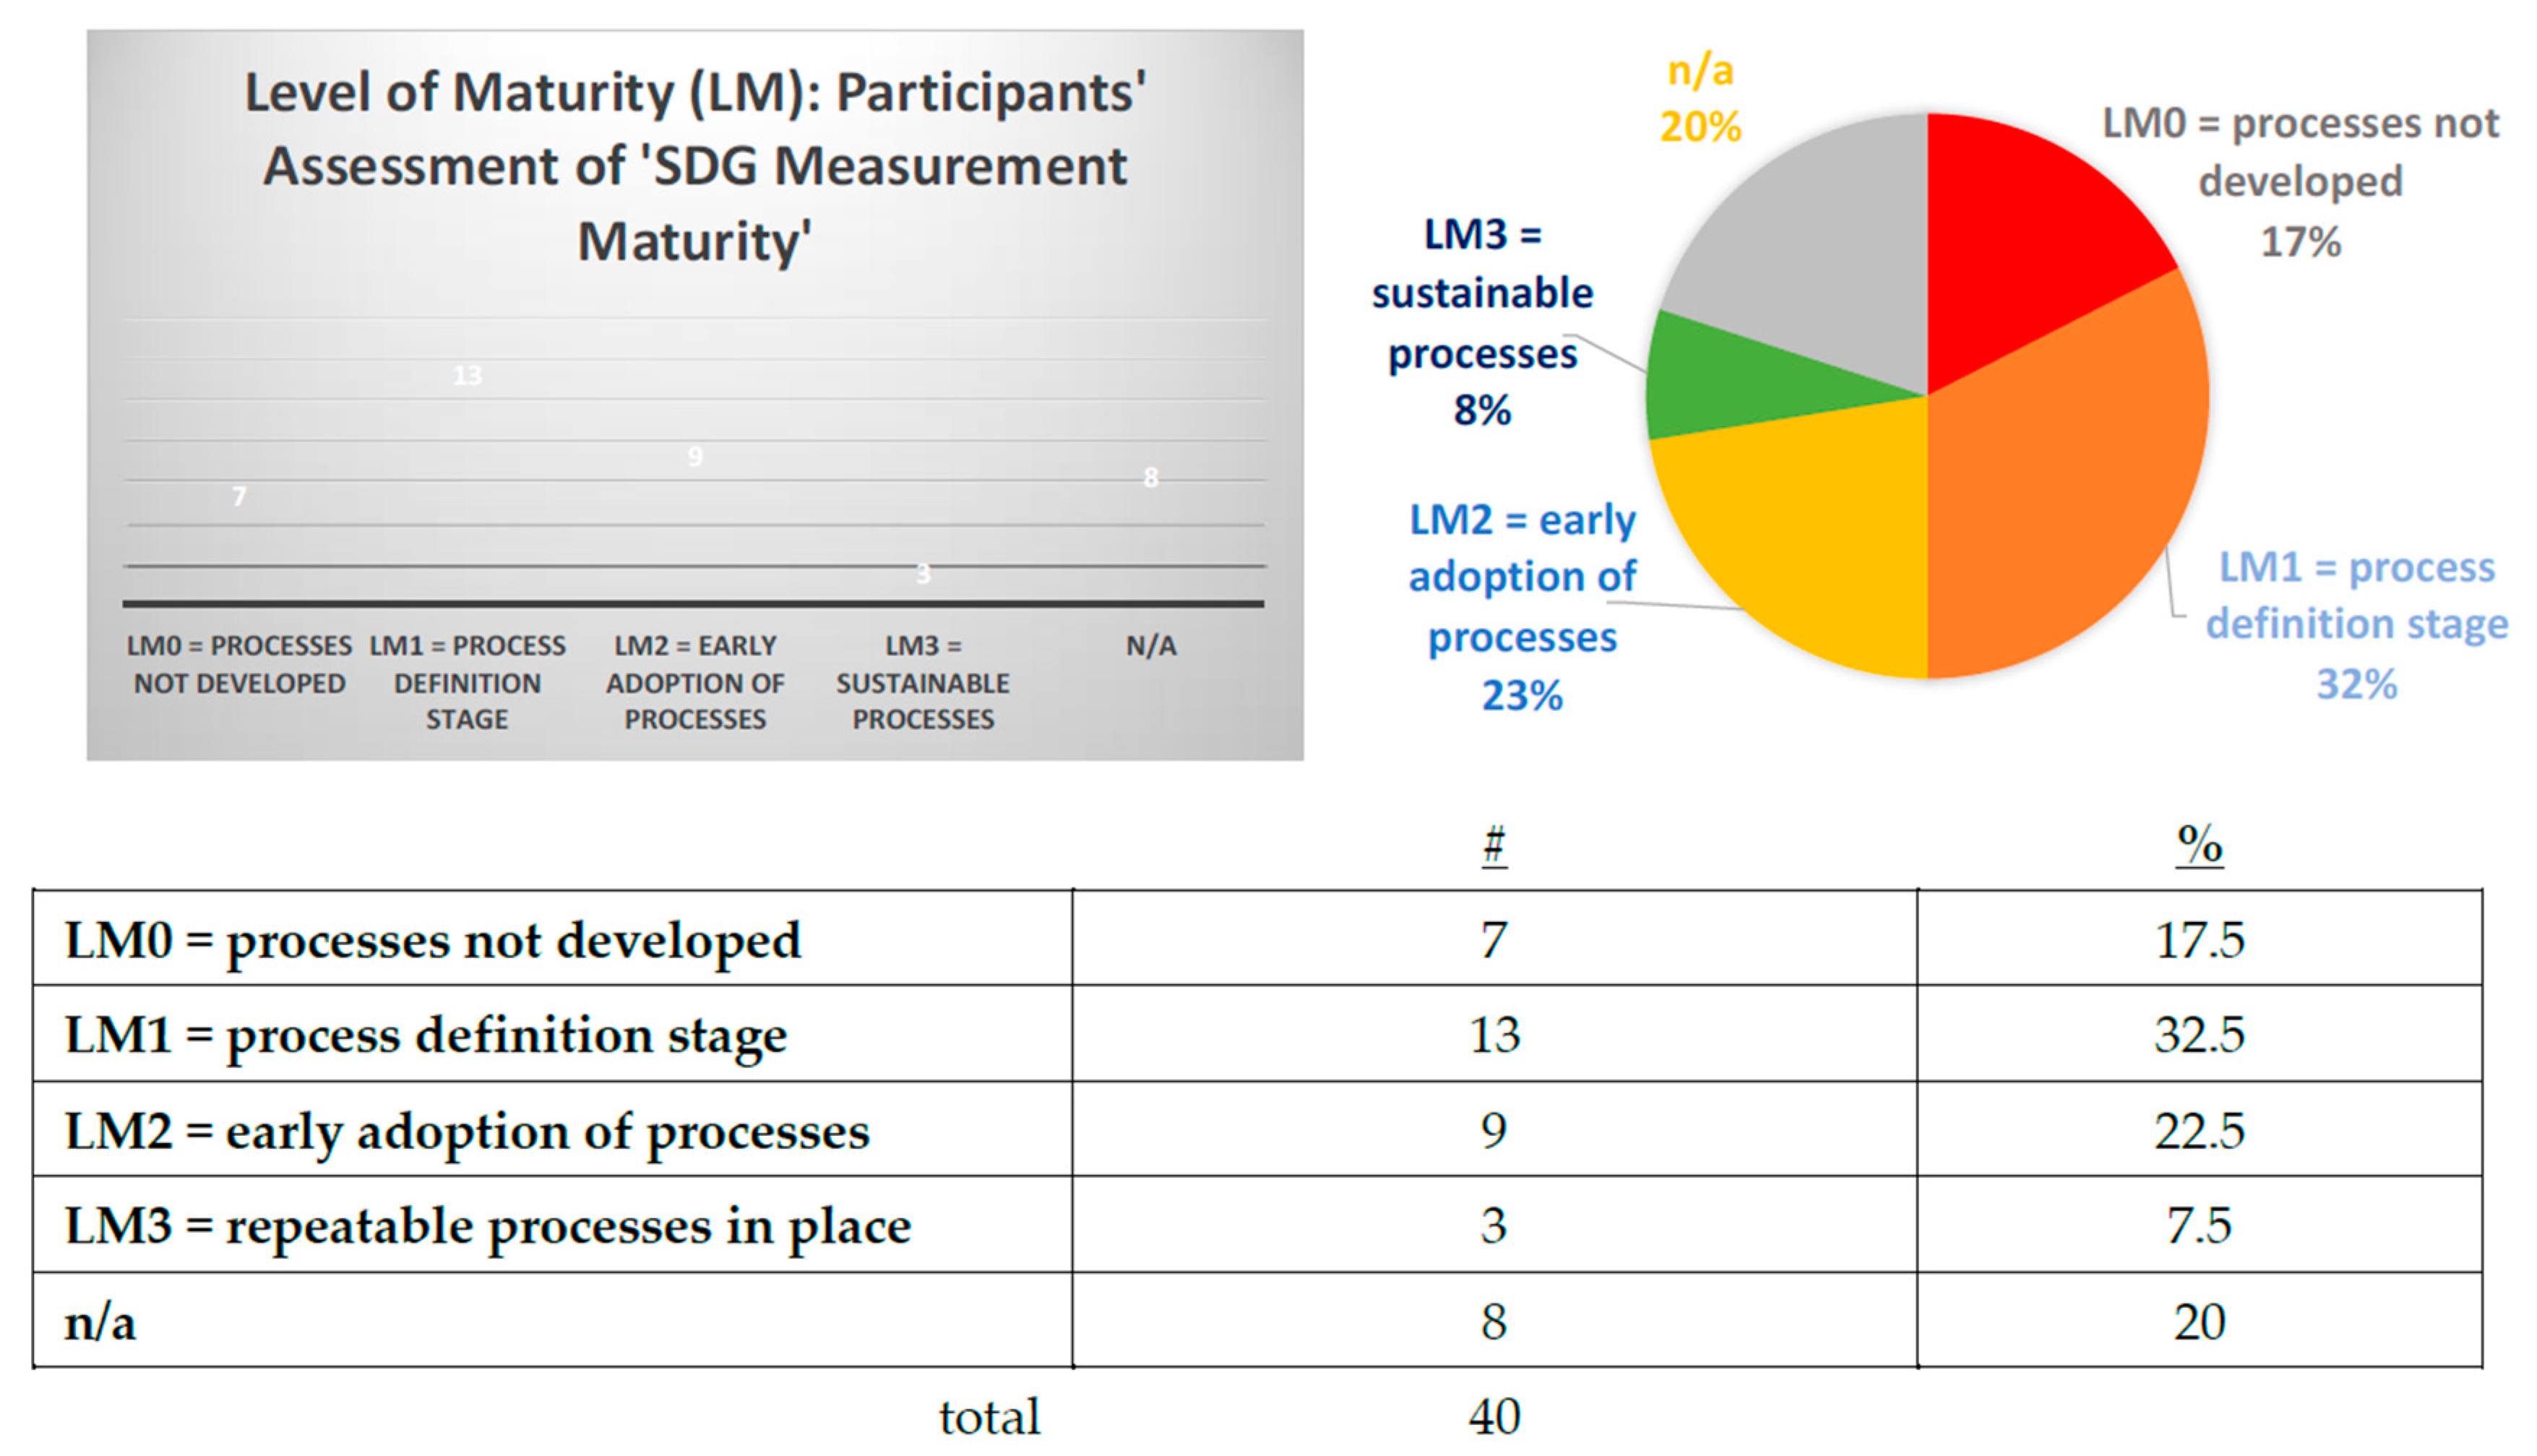
5.2.2. Company’s Level of SDG Measurement Process Maturity
As part of the interviews, the second quantitative question all participants were asked was to describe their current level of SDG measurement maturity. The data on these are shown in
Figure 10. The banding levels for this question were: 0 = no SDG processes, 1 = currently defining processes, 2 = early processes in place and 3 = sustainable SDG processes. Overall, the quantitative data showed that nearly half (49%) were at level 0 or level 1, which meant that no effective processes were in operational use. Only 23% stated that they were at level 2, the early adoption stage of processes, with a very small group (8%) stating that they had repeatable processes in place.
One of the best, participant 13, stated: “We are at Level 3, we have managed processes, metrics and quality management”, which was similar to participant 23: “we have some consistent ways we do things that are aligned to SDGs, but we do not look at every SDG and answer how they contribute to the goals. But we do cover a lot of the issues at project level.”
In reality, many of the participants only conducted measurement at a high level, such as participant 34: “In the past we have done a review to see how our strategy fits with the SDGs. We found that the SDGs were impacted by our work, some more than others, in terms of the goals and targets; they are not particularly relevant to the work that we do so our priorities have been elsewhere and therefore our resources have been focused elsewhere”. About a third of the participants said that they could, at a high level, link their SDG priorities to the formal sustainability reporting that they did on the Global Reporting Index (GRI), such as participant 26, who stated: “Well, we are all aware and starting to do it. We started using the Global Reporting Index framework on sustainability three years ago and we started reporting on our corporate results yearly on that but, at the project level, we have been a bit slower pushing up to that”. Amongst the lowest performers was participant 9, who stated: “in terms of SDG reporting processes we are close to 1. Our maturity is still low, although our sustainability reporting is much higher. We have not yet made it integrated to SDGs and have not yet generated a report against them. That is what we are talking about now and what we want to achieve”.
The second major finding derived from this analysis is as follows.
Findings #2: only a small percentage of companies have a repeatable process as an operational “mechanism” for measuring SDG impacts at company and project levels. Most have an aspiration to do so but believe that the government and their clients need to require its implementation.
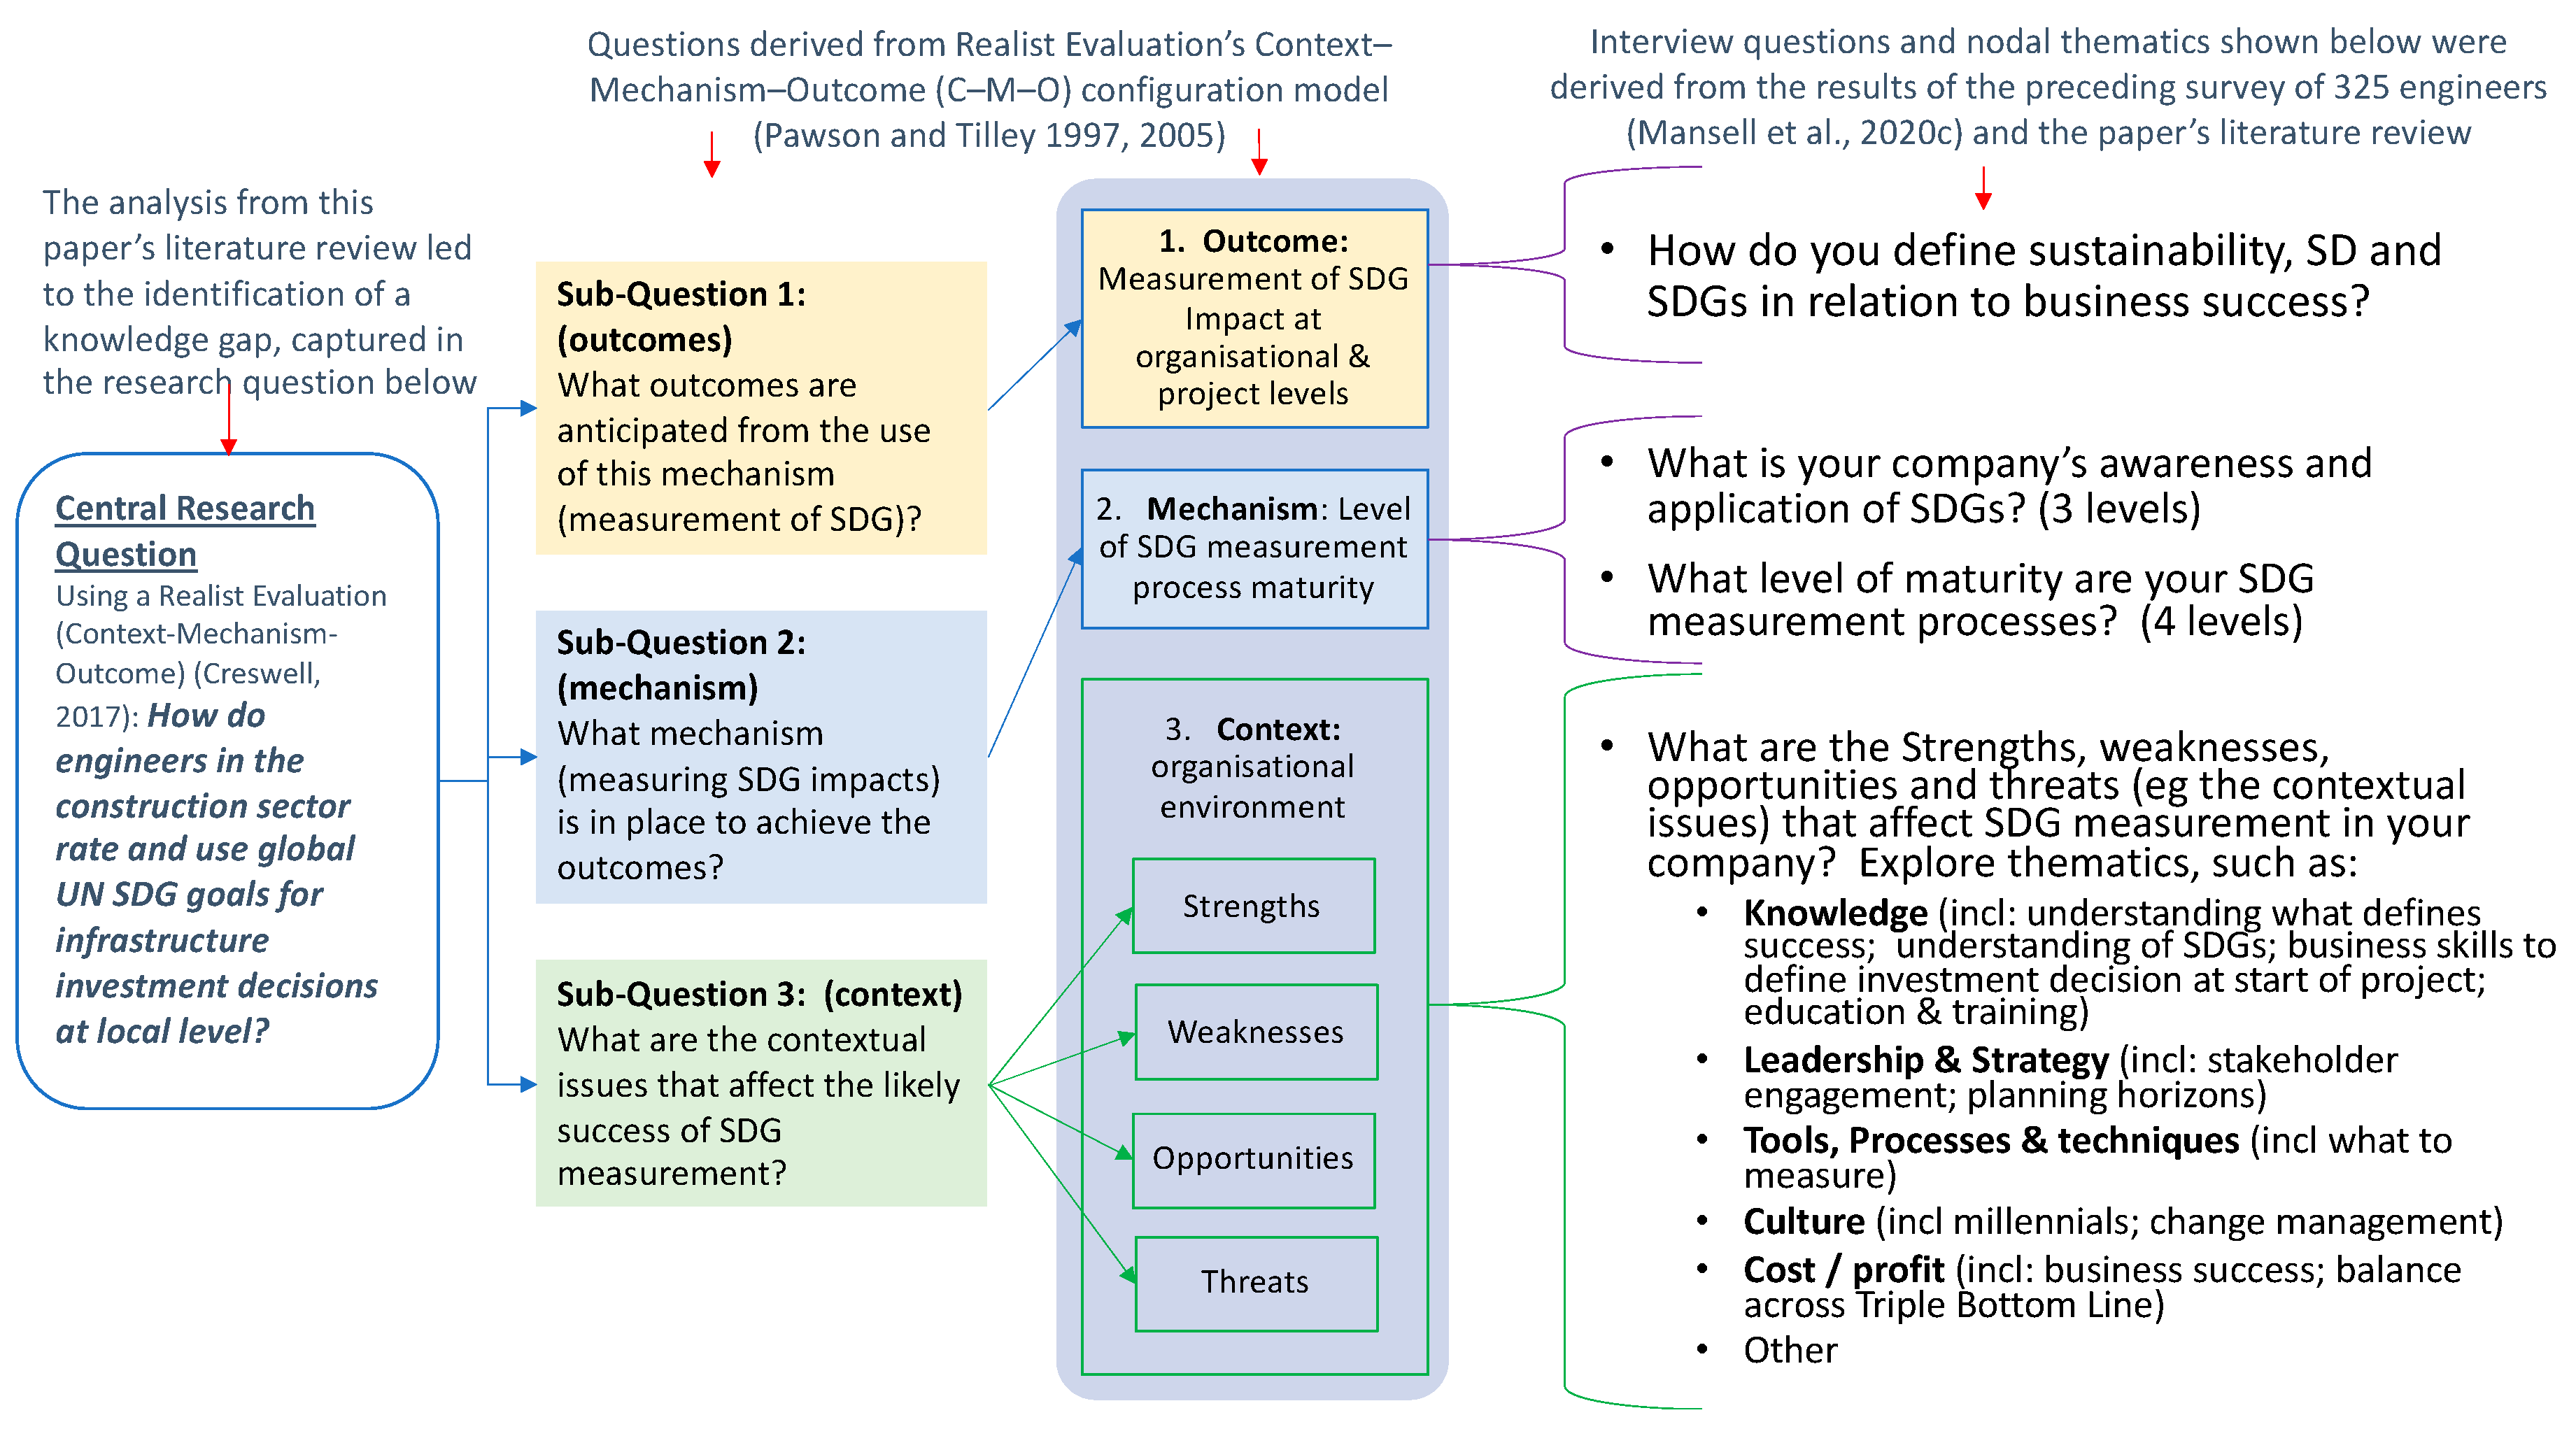
5.3. Thematic Area 3: Context. What Issues Influence the Successful Use of an SDG Measurement Mechanism to Achieve the Desired Outcomes?
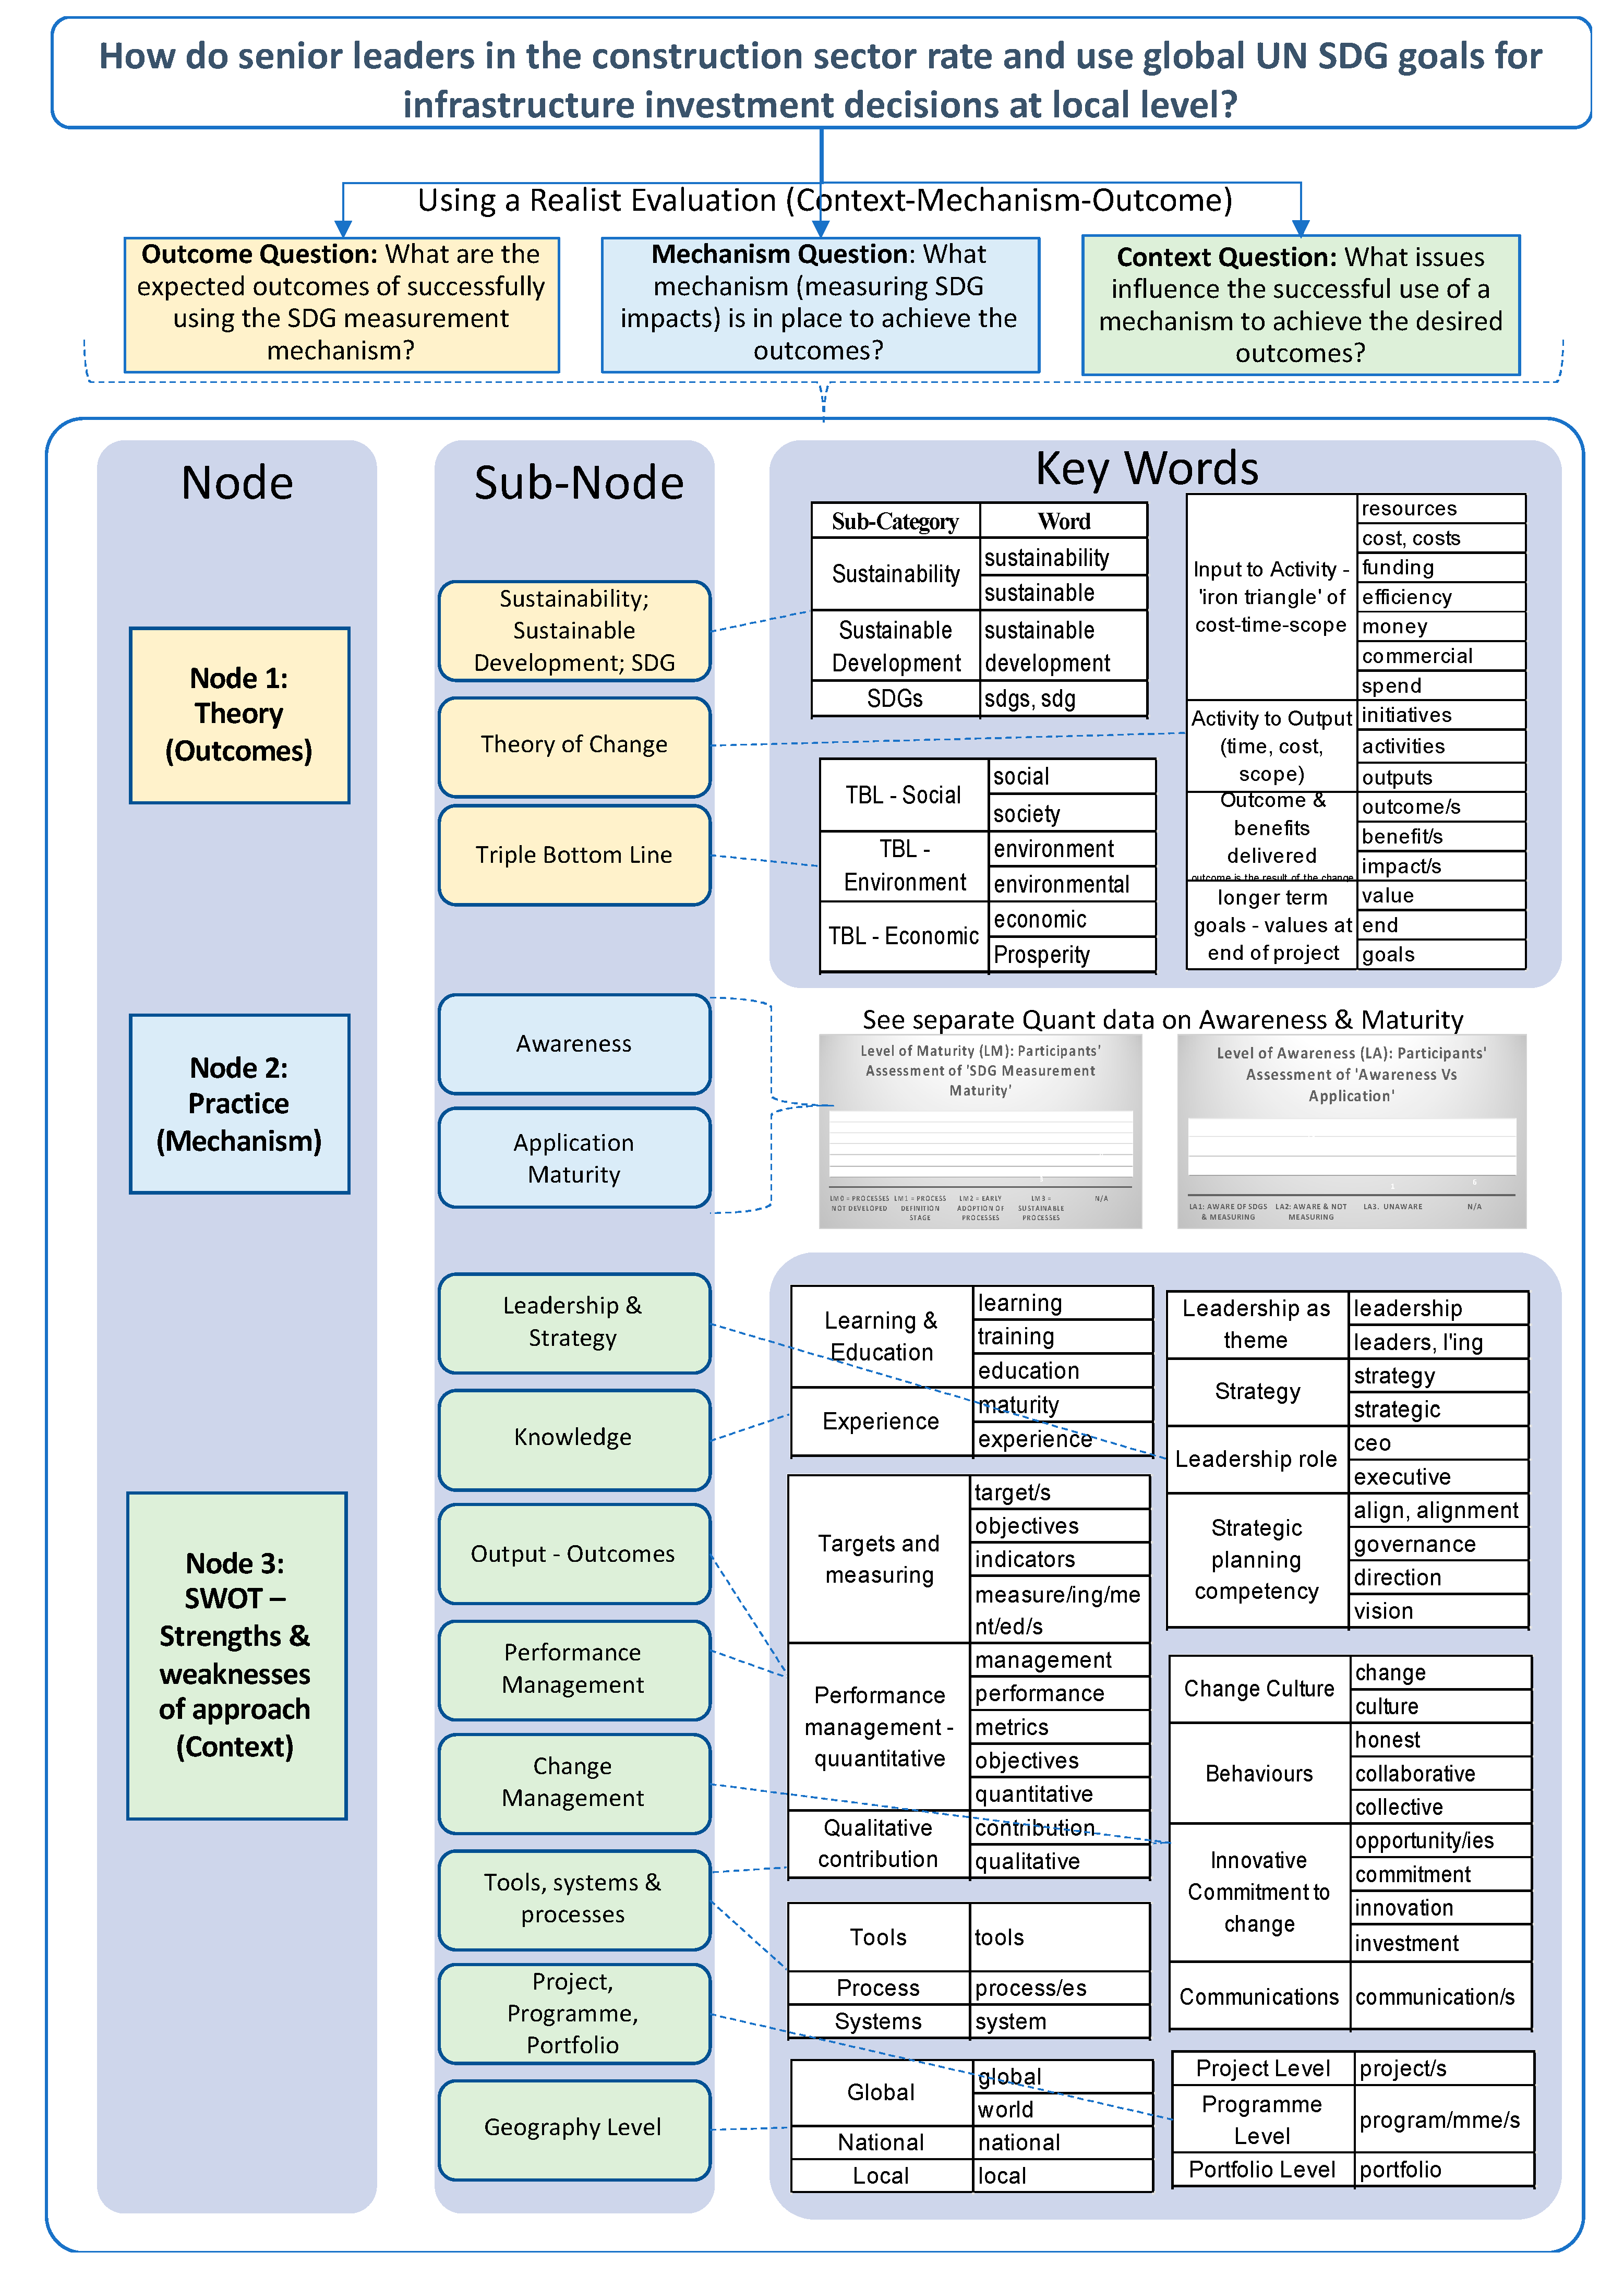
The analysis of the contextual issues that affect companies’ ability to measure SDG impacts successfully were captured using a strength, weakness, opportunity and threat (SWOT) approach. The eight themes are shown in the nodal framework in
Figure 7 and include: leadership and strategy; knowledge; outputs-to-outcomes; tools, processes and systems; change management; performance management; project-to-portfolio levels; and geographic issues. These were all derived from the preceding survey of 325 engineers, as shown in
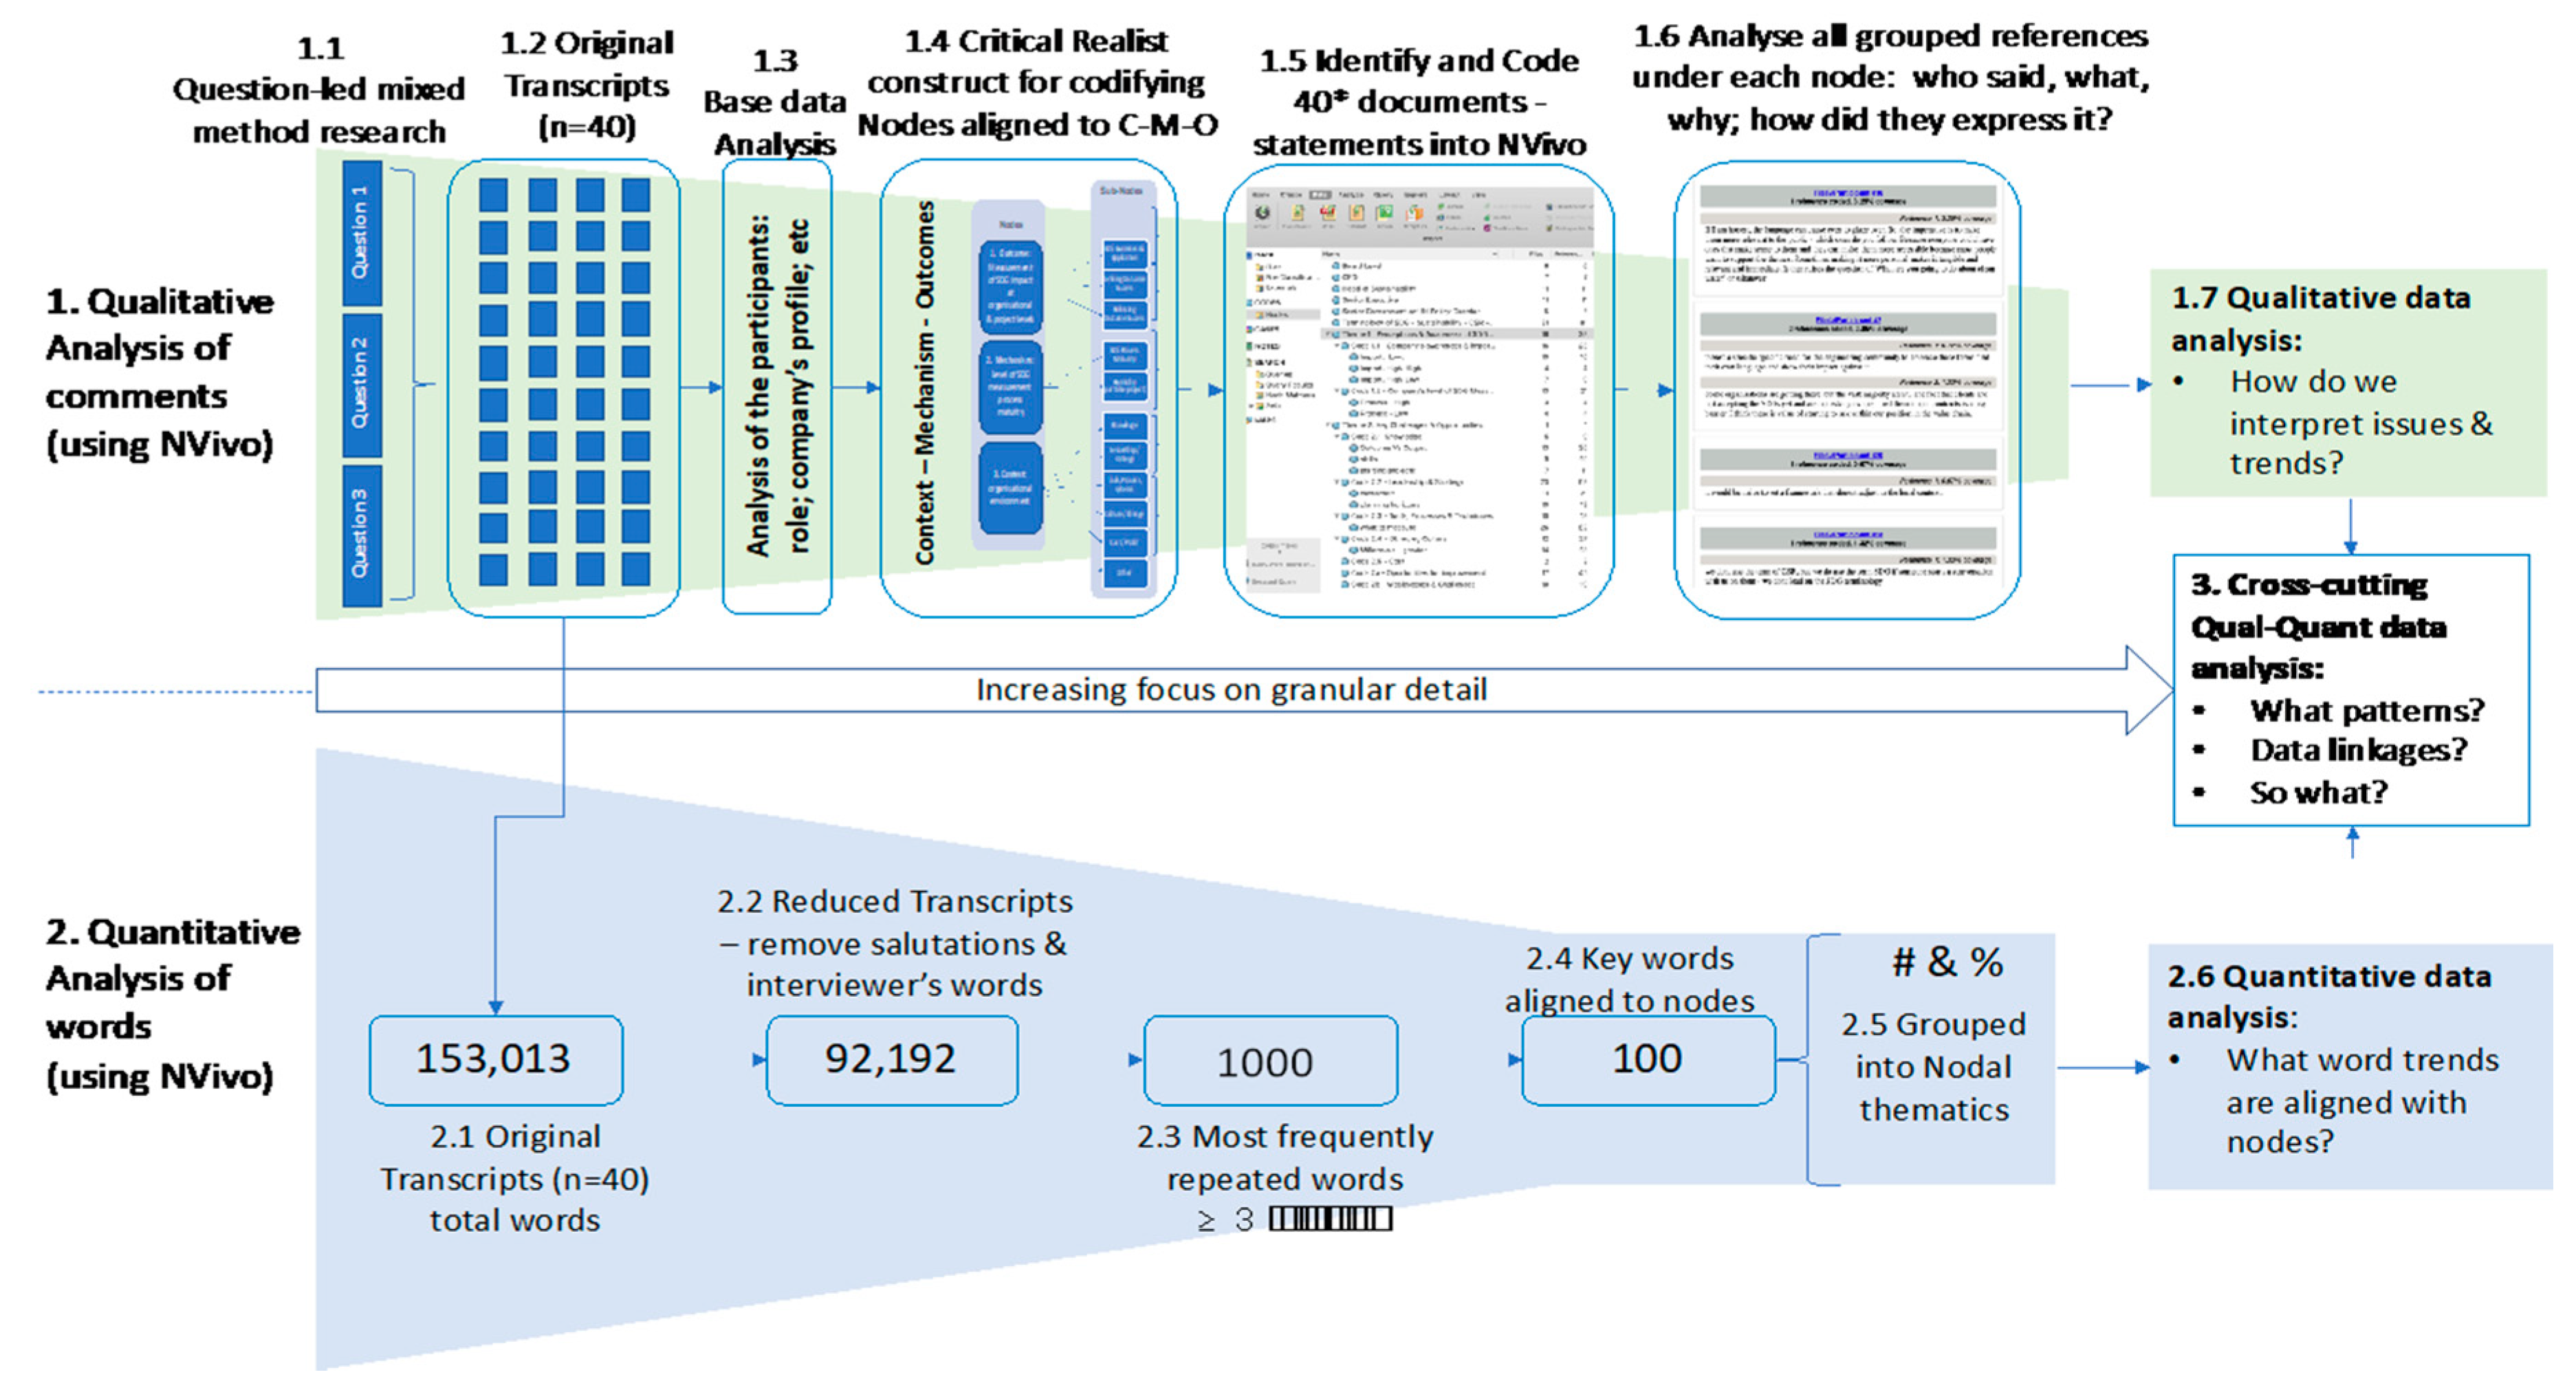
Figure 3. The qualitative analysis shared below is complemented by using the twin-track approach described in
Figure 6, which includes the text-analysis software-enabled word-count data. The approach was to identify key words and relate their frequency of use to the qualitative findings to assist the understanding of the emerging issues. For example, in this first context thematic, “leadership and strategy”, as shown in
Table 2, the key words associated with this thematic are: leadership (and its derivatives, such as leader), strategy, CEO/executive and align/governance/direction/vision, which are all words associated with leadership capabilities and actions.
5.3.1. Leadership and Strategy
For the leadership and strategy node, there were high levels of relevant statements coded (n = 63) from the 40 participants (using the NVivo software), reflecting the importance of this thematic. In terms of key word usage, this thematic was the fifth most frequently used (n = 584) across the 40 interviews, which equates to once every 120 words. Within this category, the frequency of use of “align”, “governance”, “direction” and “vision” were noted since these words are all associated with leadership capabilities.
The most impactful statements collected were the frequent references to a “greater value” beyond profit. This sentiment sits well with creating shared value and the triple bottom line discussed earlier. This viewpoint was personified by participant 11: “a key part of leadership is doing the right thing because it is the right thing to do, not because of a box-ticking exercise”. The same participant also focused on the difficulty of making the change stick: “It is 50% belief and 50% belligerence when you start something like this; that is, holding yourself and others to account. That is what I mean by belligerence. In other words, ‘seeing it through’ and what we wrote down as a mantra: ‘Don’t you understand’”. In his view, as a senior executive, he stressed the important role of his CEO and board: “Leadership is the most important critical success factor, both internally and externally, to align and galvanise our employees, our communities and the supply chain. It was about getting us all to be more collaborative in finding novel, innovative ways of delivering sustainable solutions. It is about the leaders capturing the hearts and minds of the stakeholders to champion changed behaviours to achieve big, bold strategic outcomes.”
In terms of strategy, one organisation noted the importance of the “ends, ways, means” logic similar to the Theory of Change concept [
38,
39,
40,
41,
42]. Participant 9 stated: “you must start with the end in mind, even if you have not got a detailed route map to deliver at every stage of the journey. Part of the mantra is to set big audacious goals and then adopt an attitude of ‘I have started so I will finish’ and, by the way, you never actually finish, because the end goal is moving, it is like you achieve one peak but realise it is a false horizon, and so you continue your climb to the next summit”. The value of having clarity of the strategic ends is noted, albeit with a caution that the identification of targets for tracking performance must not become a “box-ticking” exercise that distorts clarity of outcomes. Participant 11 stated: “if you actually begin with the end in mind of the outcome you are seeking and how you wire your DNA to achieve that, you are far more likely to achieve those outcomes and, in so doing, the boxes get ticked. But if you predicate your thinking with thoughts about just filling the boxes, you have constrained yourself”.
Finding #3: strong leadership plays a significant part in inculcating SDG measurement as an ambition and core value into an organisation.
Finding #4: the more advanced businesses in SDG measurement noted the need to have a clearly defined strategy that can guide the prioritisation of SDG goals using the “ends, ways, means” model. This requires clarity of the “ends” prior to defining project success (in-project and post-project).
5.3.2. Knowledge
For the “knowledge” node there was a relatively smaller incidence (n = 19) of relevant statements coded from the 40 participants (using the NVivo software). In terms of key word usage, as shown in
Table 3, this thematic was also one of the least frequently used, with “learning”, “education” and “experience” being used only 140 times across the 40 interviews, which equates to once every 400 words.
The qualitative analysis identified a strong preference for using education and training to improve their staff’s SDG impact skills and business skills, especially in the wider definition of success, which is related to the later discussion of outputs-to-outcomes. An indication of the importance of this was provided by the CEO of one global engineering company, participant 7: “So, how do we galvanise our community, how do we tell our story better against the SDGs and how do we galvanise our community to be able to share best practices, and what does that mean for education and training?”
Skills covered a number of areas, including the skills to be able to define success definitions, business skills to be able to build performance frameworks and sustainability/SDG skills that helped understand the SDG framework and how they relate at sub global-national levels and at organisational and project levels. Participant 3 stressed its import: “I think the skills piece is the second most important area because we cannot expect our people to deliver on these KPIs if they do not know what they mean and if they do not know how to measure them and improve them, so investing in how to calculate social value and improve upon them and investing in training in social value RoI is very important; it gives us an opportunity to benchmark and improve on it”.
Overall, participants seemed to accept that, despite the current supposed level of SDG measurement awareness, there is also a shortage of trained personnel to support the implementation of SDG measurement on their construction projects. The closing of this gap reflects the views of Reffat [
61] on the insufficient number of human resources with the required skills to perform sustainable development on construction operations.
Finding #5: learning and education plays a critical role in increasing capability and, specifically, in understanding how to better share lessons on SDG measurement for the good of all.
5.3.3. Outputs-to-Outcomes
The “outputs-to-outcomes” node had the fifth highest incidence (n = 30) of relevant statements coded from the 40 participants (using the NVivo software). In terms of key word usage, this thematic was also one of the most frequently used (shown in the “Theory of Change” key word table,
Table 4), with the first half of the causal chain (input, activities and outputs) being cited as frequently as the second half of the value chain (outcome to impacts). This was significantly less than the general reference to longer-term benefits that were synonymous with key words such as “value”, “ends” and “goals”, which were used only 339 times across the 40 interviews, equating to once every 175 words.
Within this subcode, most recognised the challenge of differentiating between outputs and outcomes. Too few knew how to do this well and, as a result, the wrong “targets indicators” were sometimes being used to measure success. Participant 8, a CEO of one of the UK’s largest infrastructure programmes, said: “programme and project people are sometimes less aware of how we are doing strategically if you are not careful. So, they can often have a bias for cost and schedule focus and lose focus on other priorities we have set”. Another way of expressing the inappropriate focus on outputs came from participant 3: “we know that, if we just design to code, we end up with projects that are great for today but absolutely do not meet the future that we are expecting”.
Some organisations have fully embraced the strategic aim of better aligning with outcomes, such as participant 11: “So we thought long and hard not just about the goals that we created but about how they fitted with a set of outcomes in our region and what that would look like in terms of implementation. This was our way of meaningfully connecting the strategy with outcomes that our stakeholders recognised.” The same person described the need to look at the end first to better understand ambitions: “you must start with the end in mind, even if you have not got a detailed route map to deliver at every stage of the journey”. One of the most common reasons for the overemphasis on “outputs” was shared by participant 26: “So, the measurables are very weak in terms of linking the engineering and the infrastructure impacts to the higher programme. It is just about ‘have you built the hospital’ as an output”.
Finding #6: the use of the log-frame and Theory of Change provides a means to link outputs to outcomes and better identify SDG impacts.
5.3.4. Tools, Processes and Systems
The “tools, processes and systems” node had one of the lowest incidences (n = 18) of relevant statements coded from the 40 participants (using the NVivo software). This suggests that senior executives and CEOs have less interest in, or place lower value on, specific tools or methodologies, which might indicate why this is an underinvested area. In terms of key word usage, this thematic was also one of the least frequently used, shown at
Table 5, with “processes” being cited twice as frequently as “tools” and “systems”. In total, they were used only 177 times across the 40 interviews, which equates to once every 300 words.
The survey [
14] that preceded these interviews had identified a common reference to the lack of tools, systems and methodologies. This was not proven in the interviews, although a number of the heads of sustainability (3, 9, 15, 20 and 29) were more likely to mention this as a factor. On the ability of the sector to galvanise and align with a consistent approach, participant 18 highlighted that there were bigger issues to deal with prior to designing a tool: “I think it is essential. I have very little confidence in our ability to do it now. Even if you had a decent methodology now, I suspect very few people would use it and you probably have a number of competing methodologies, which is typical in this sector.”
However, others, such as participant 20, said: “for me the tools and processes underpin the delivery because, without them, you cannot possibly know where you are or where you need to go”. But a key element of the design of a tool was to get the balance right between being too complex and being at the other end of the scale—being too high level and therefore superficial—as noted by participant 10: “I think, in most cases, a consistent framework or reporting approach would be helpful; that gets the balance right between having something that is consistent but watered down to such a high level that it loses meaning, versus having too much detail that is too granular, loses the users in too much complexity and is difficult to fit with your business model and the way you report things into that”.
Finding #7: the use of tools, systems and processes to measure SDGs is not a priority for CEOs and board members but it is for senior executives and heads of sustainability. These tools need to be simple enough to understand but robust enough to capture detailed evidence that leads to improved performance.
5.3.5. Change Management
The “change management” node had an average level of incidence (n = 27) of relevant statements coded from the 40 participants (using the NVivo software). In terms of key word usage, this thematic (shown in
Table 6) tracked “change culture”, “behaviours”, “innovation” and “communications”, all of which provided a large number of insights from participants. In total, they were used 410 times across the 40 interviews. However, the quantification of the data does little to indicate that this contextual issue was one of the best sources of insightful knowledge.
There was general recognition from the participants that the single most important area for ensuring SDG measurement success is having a successful change programme that ensures a practical approach is made to work for the “users”, with the added value of what they are doing. The starting point for this approach was ensuring the right culture in the organisation, characterised by openness and honesty about the difficulties of measuring SDGs and also closing the gap between superficial statements of intent without having the evidence to back up what they say they do. For example, participant 15 stated: “[name of company removed] say that they measure against SDGs, but there is a gap between what they say they do and what they actually do”.
Innovation was a frequently referenced benefit of getting the change culture right and, in doing so, having the means to address the SDG targets more effectively. For example, participant 11 noted the effect of building long-term supplier relationships that enabled more innovative solutions to be developed: “We wanted to establish meaningful change across the supply chain, and we recognised that, to do this, we had to develop long-term relationships; hence, we contracted on a five, plus five, plus five-year basis. This built longevity into our thinking and allowed true innovation to develop solutions to the bigger sustainable development issues across the environment, driving efficiency and effectiveness.”
Communication was also a dominant theme of culture change. Participant 1 noted: “you do not communicate it once, you communicate it nearly every day through many, many different vehicles. You bring people in”. Participant 24, a leader of a North American national civil engineers institution, highlighted the value of leaders who can tell stories that resonated with stakeholders: “people with success stories become your spokespeople and they start to influence others, saying ‘hey, you know this works for us’ rather than just trying to sell the methodology. It is more, you know, encouraging peers, e.g., peer-to-peer”. The main focus for this stakeholder engagement for participant 11 was: “Our starting point is understanding what is important to our clients, who want to see us make improvements, and where our staff and employees want to make a difference”.
An unexpected but often-quoted issue was on the context of gender influence on SDG measurement. Eight participants (1, 5, 10, 17, 21, 24, 31 and 37) made specific reference to gender impact: “the younger generation really do want to change the world. Interestingly, particularly the female part of that [company name removed] has more than 50% of its membership as female and I pondered why that should be, and I think it is because it appeals to the values of certainly the younger, but actually to the female, side of our institution, who really want to make a difference to the world that they live in. Probably, they are more driven by that than they are by financial reward”.
There were nearly half the participants that promoted the positive effects of harnessing the power of the millennial generation to promote change and thereby help champion the uptake of SDG measurement, which was shared by participant 1: “So, if we can find a way of linking into the power of the younger generation”. This attitude was further explored by participant 10, who noted the obvious fact that millennials are tomorrow’s leaders: “I think millennials have a role here as new project leaders where often they are the people who are most energised”.
Finding #8: change management. One of the largest positive impacts for SDG measurement is about engaging, communicating and energising the delivery teams. This involves the internal teams and suppliers. The millennials have a key role to help build and sustain this change momentum.
5.3.6. Performance Management
The “performance management” node had the highest level of incidence (n = 82) of relevant statements coded from the 40 participants (using the NVivo software). In terms of key word usage, this thematic, shown in
Table 7, tracked “targets”, “measuring”, “performance management”, “quantitative”, “metrics”, “qualitative” and “contribution”. In total, they were used 1003 times across the 40 interviews, which equates to once every 50 words and represents the most referenced thematic.
The highest frequency of coding on NVivo was using the node for “what to measure”, reflecting the importance of this thematic. There were many references to what is measured, and the general theme was that the selection of targets becomes critical in a business environment that is already awash with data collection. Many asked whether they should collect quantitative data or qualitative and also asked what the balance between too little data collection and too much is. Almost all participants accepted that this was an extremely difficult area to resolve and that there were no easy answers. For example, participant 34 stated: “I think we are quite confused. It sounds like we are much more advanced than we are in the way we monitor, report and evaluate. Most of our work is about getting the basics right and ensuring we are complying with legal requirements—getting stuff done. We know we need to do more work on understanding sustainability outcomes and how we can develop detailed KPIs that feed into that for measuring our impact. We do not have outcome frameworks in place yet”.
There was a consistent recognition amongst those that had more advanced levels of SDG measurement process maturity (participants 3, 19 and 20) that you had to start by selecting a manageable number of goals (from 17) and targets (from 169). This was explained by participant 31, who said: “It is an enormous challenge. I think, out of those 232, the fact that you found 20 that can be measured is actually pretty good if I think about the magnitude of the problem”. Amongst the nine participants that were at the “early processes in place” stage, most were trying to establish hard metrics that could be quantified, such as participant 15: “We want hard targets to test our performance. Generally, as a business, qualitative is not very compelling. When we set up our strategy, we did some serious baselining to get some better referenced data.”
One of the key problems, mentioned earlier, is the level of complexity in measuring 169 SDG targets. It was frequently explained that this was too complicated for the construction sector, as stated by participant 2: “But the indicators are far too detailed and big and sometimes not applicable as well. Therefore, it is better to work at a higher level for the projects. I have more interest in the goals and not the indicators”.
The emphasis on quantifiable targets was countered by participant 25: “telling the story of the success against the sustainable development goals, as an example; a lot of the time, it cannot be quantified very easily and therefore telling the story around an outcome perhaps provides more impact and value than just putting a meaningless quantitative score against something”. This viewpoint was backed by participant 2: “In the beginning, I wanted quantification to have numbers that I can use to understand the measurement data. This created a big pushback because engineers tend to want perfect solutions. The assessment was causing some culture issues, so the qualitative aspects have been preserved but not the quantitative. So, we still look for the holy grail but, at this stage, we are going to produce stories. In future we would like more quantitative that can be assessed at corporate level.”
Finding #9: select a few targets relevant to the construction organisation or project. Keep it simple and build knowledge progressively.
5.3.7. Project-to-Portfolio Levels
The “project-to-portfolio” node had the eighth highest level of incidence (n = 21) of relevant statements coded from the 40 participants (using the NVivo software). In terms of key word usage, this thematic (shown in
Table 8) tracked “projects”, “programmes” and “portfolios”. In total, they were used 677 times across the 40 interviews, which equates to once every 80 words. There was wide recognition that the approach needed to be adapted but linked across the project, programme and portfolio levels, as noted by participant 27: “I think there is no ‘one size fits all’. So, I think it will vary from programme to programme and be dependent on the country as well”.
Special interest and importance were aligned with the node on “starting projects”. The preceding survey [
14] had not highlighted the importance of “starting projects well”. This node was added during the interviews stage because it was often referred to as the need to use the SDG lens at the “key investment decision point”, as noted by participant 26: “based on evidence frameworks, you can frame your project in a much better way to make sure the impact you get is maximized.” The emphasis of getting stakeholder alignment was also mentioned by participant 19: “They want to demonstrate that their projects contribute to sustainability development goals and develop tools that make sure projects embed sustainability development at the outset, e.g., at their project inception phase”.
There were some, such as participant 9, the head of sustainability for a utility company, who suggested that the SDG measurement had more relevance at the larger scale of programmes and at the organisational strategic level, represented by the portfolio office: “Thus we do it more at programme and portfolio level and less at project level. So, we have a mapping process at the portfolio level and align across project and programme SDG targets”.
Finding #10: there was evidence that SDGs can be measured at all three levels: projects, programmes and portfolios. There was special value in using the SDG lens at the start of the project to help align stakeholders around the longer-term outcomes and impacts.


