Article

Smart Specialisation as a Strategy for Implementing the Regional Innovation Development Policy—Poland Case Study

by
Magdalena Kogut-Jaworska
1 and
Elżbieta Ociepa-Kicińska
2,*
1
Institute of Management, University of Szczecin, 70-453 Szczecin, Poland
2
Institute of Spatial Management and Socio-Economic Geography, University of Szczecin, 70-453 Szczecin, Poland
*
Author to whom correspondence should be addressed.
Sustainability 2020, 12(19), 7986; https://doi.org/10.3390/su12197986
Submission received: 27 August 2020 / Revised: 22 September 2020 / Accepted: 27 September 2020 / Published: 27 September 2020
(This article belongs to the Special Issue Entrepreneurship and Innovation in Regional Economic Development)

Abstract

:
Regional Innovation and Smart Specialisation Strategies (RIS3) are treated as one of the key tools in implementing the concept of smart and sustainable growth. The strategies make it possible to focus investments on research, development and innovation (RD & I) in the areas showing the greatest economic and competitive potential of the regions. The article is based on the assumption that innovativeness on the one hand determines and on the other hand is determined by smart and sustainable growth. The aim of the analysis is to present new research assumptions and the results of the regional benchmarking based on a synthetic measure of development, and verification of the relationships between the level of innovative development and the economic development in the regions. This article presents the results of a research study covering all the sixteen regions of Poland, the outcome of which is an indicator of regional innovativeness based on 17 features, which means that the study considered a total of 2992 features. The methods applied in the study included the zero unitarisation method, the linear ordering method, and the Pearson correlation coefficient. The completed research study has shown the stability of positions held by the individual regions and the considerable, persisting disproportions in the innovation development between the regions taking the positions at both ends of the ranking. Moreover, a moderate positive correlation was identified between the GDP per capita level and the value of the synthetic measure of regional innovation development in 2009. The completed analyses made it possible to formulate the conclusions that show the benefits, weaknesses and dilemmas related to the introduction of smart specialisations for sustainable and innovative regional development in Poland over the past decade.

1. Introduction

Regional strategies for smart specialisation function under the Regulation (EU) no. 1301/2013 of the European Parliament and of Council dated 17 December 2013, according to which they are aimed at achieving a competitive advantage via developing and combining strengths in the area of scientific research and innovations with business needs, in order to meet any arising opportunities and to develop the market in a coherent manner, at the same time avoiding any doubling or fragmentation of efforts [1]. Pursuant to the assumptions of the smart specialisation strategies, each region has specific resources which, incorporated into global processes, become the key success factors. Taking into consideration the endogenous capabilities of the region, its resources, key competences and competitive advantages in the course of identifying the priority areas should ensure a bigger growth of the regions’ competitiveness and their faster development. Regional specialisations are to reflect the specific nature, uniqueness and economic originality of each region, which as a result should lead to establishing some areas and niches that enable sustainable and dynamic development, eliminating emulation of investments and at the same time enhancing the inter-regional co-operation.
The Europe 2020 strategy requires that the member state legislators should consider how the different aspects of smart, sustainable, and inclusive growth are interconnected, and how the smart specialisation strategies meet the complex, development-related challenges by adjusting the policy to the regional context [1]. In this approach, it is necessary to properly understand the interactions between the policies and their outcomes [2]. In the changing social and economic conditions, it is important for the EU economy to become smart, sustainable and inclusive. The three complementary priorities should assist the EU member states in achieving a high level of employment, efficiency and social cohesion [1]. We can state that currently innovation strategies for smart specialisation with the new framework for organising innovation support in European regions and states [3] have become the reality [4], and smart growth means enhancing the role of knowledge and innovation as a driving force for economic development [5].
Pursuant to the assumptions of the Cohesion Policy, in the years 2014–2020 the smart specialisation concept should be particularly important in the process of regional growth. On that basis, each of the voivodeships in Poland developed a regional innovation strategy (RIS3—Regional Innovation and Smart Specialisation Strategies), whereby they identified and outlined the directions of development of smart specialisations within the given region. McCann and Ortega-Argilés stressed that RIS3 posed tough requirements for the brittle or limited institutional framework, but at the same time they also offered actual possibilities of institutional learning and improvement of management capabilities. They also indicated that the previous understanding of innovations focused solely on academic aspects and those connected with research and development, whereas now we understand that many aspects of innovation are basically of a both local (Hughes, 2012; Moretti, 2012; World Bank, 2010), and social nature, involving the society, civic society entities and private sector entities [6].
The literature review has shown various interpretations and methods of assessing the results of the smart specialisation strategies’ implementation. It is not uncommon to encounter analyses of the European Commission’s legislation and initiatives as well as other documents regarding smart specialisation at the EU, national or local level, and also some comparative analyses of experiences gained by some countries or regions with a particular focus on impediments in implementing any smart specialisations [7,8,9,10]. Midtkandal, Periañez Forte and Nauwelaers analysed the typology of innovation policy instruments by policy objectives and policy interactions; they also explored the gap between RIS3 design and RIS3 implementation [11]. Lopes, Ferreira and Farinha indicated that RIS3, being a recent concept and still little explored by researchers, was important to understand how, when and where the interest in this topic arose. The articles published on RIS3, as a rule, focus on the RIS3 design process or its implementation (Camagni & Capello, 2013; McCann et al., 2014; Morgan, 2016). Lopes et al. analysed 51 publications, indicating their distribution over time, issues addressed therein, country of publication, authors’ names and number of citations. Summing up, they stated that the theme under analysis remained fairly recent and more research was necessary [12]. In addition to the analyses of agendas and documents at the regional, macroregional and national level, Piątkowski, Szuba and Wolszczak assessed the research and development strategies, focusing on the methods of their implementation, defined the problems and the recommended ways of solving them.
Fitjar, Benneworth and Asheim focused on the question of how responsible research and innovation (RRI) and RIS3 approaches can usefully be combined in an integrated innovation policy framework [13]. Kleibrink, Gianelle and Doussineau examined how decision-makers perceived monitoring in the context of the current European territorial and innovation policy, conceptualised the logic of a smart specialisation intervention, and then presented the findings of a survey taken among decision-makers with regard to their perception of the logic of intervention and monitoring [3]. Marinelli, Guzzo and Gianelle verified the way in which the entities responsible for innovation studies and strategies for smart specialisation in EU regions and member states developed the systems of monitoring the strategies, and what expectations and hindrances were encountered in the process [14]. Kleibrink, Gianelle and Doussineau assumed that in order to monitor a smart specialisation, the key is to track the development of the priority activities, their relative growth and related structural changes in the regional economic structure, as well as the dynamics in each of them. For example, if a given region takes priority in relation to some specific elements of health and e-health, a good monitoring system should be able to demonstrate an annual growth of the area of activity in terms of research and commercial results, organisational development of companies, research institutions, etc. [3]. Angelidou, Komninos, Passas, Psaltoglou and Tsarchopoulos described the sections and selected indicators for the M3 platform: Measure, Monitor, Mobilise, which is part of the Greek–Bulgarian cooperation programme in the area of smart specialisation, and it is addressed to policy makers and experts that conduct these types of analyses in the context of RIS3 development and implementation [15].
Another group of publications includes original research studies. Gemma and Bulderberga relied on the RIS3 Assessment Wheel method—a synthetic tool that enables assessment of RIS3 in a given region and the positioning of it among other regions, described in the RIS3 Guide [16]. Their studies were aimed at identifying the main differences between RIS3 development in the Baltic states; to that end, they compared the existing RIS3 assessment wheel in Latvia and created an original version of the RIS3 Assessment Wheel of Latvia, then proceeded to develop RIS3 assessment wheels of Lithuania and Estonia. The research studies are mainly based on desk research using content analysis and the monograph method [17]. Gianelle and Kleibrink suggested verification of expected changes and indicators of results within the framework of strategic priorities (e.g., % of Small and medium-sized enterprises - SMEs introducing process innovation for fresh product preservation, collaborations between SMEs and R&D centres, new patents in this priority field, new R&D staff in sectors relevant for this priority field, % of firms using integrated web-based services, % of firms with social network profiles) and specification of instruments implemented in the policy mix, adequate to each priority [18]. Fuster, Marinelli, Plaud, Quinquilla and Massucci indicated the significance of combining open data, open science and open innovation (ODSI), analysing each of the issues (definitions, legal frameworks), identifying challenges and building related roadmaps on that basis. They also specified priority instruments and indicators for S3 monitoring: grants for business R&D and innovation, technology transfers and business advisory services, clusters and other networking and collaborative platforms [19].
It is also possible to identify articles focused on concrete aspects of smart growth. Duque Estrada Santos analysed the patent results as an assessing factor for RIS3 strategies (case study of northern Portugal) [20]. David, Foray and Hall suggested that patent data and co-patenting could be indicators to track the process of technology specialisation [21]. Kangas and Aarrevaara analysed the role of knowledge brokers (Higher Education Institutions) in Smart Specialisation [22]. Weidenfeld verified the concept of tourism diversification and its unrealised relevance to smart specialisation [23]. Rodríguez-Pose, Cataldo and Rainoldi proposed the measure of effectiveness of the RIS3 investments [24]. Faller, Steen and Fyhn examined the potential to promote sustainable energy with RIS3 (depth analyses of three regional cases from different European countries). This is how they concluded their studies: “rather than provide clear-cut answers, the aim of this article is to initiate a debate about the potentials and contribution of RIS3 to the technological development and deployment of sustainable Energy” [25]. Trillo also focused on aspects related to sustainable growth, analysing the Multidisciplinary Approach to Plan Smart specialisation strategies for Local Economic Development (MAPS-LED) programme financed by Research and Innovation Staff Exchange (RISE)-Horizon 2020 [26].
Based on the literature review, we noted that the RIS3 are commonly found and they are analysed on many levels, however, the unique conditions found in each country or region determine various methods of introducing and evaluating the strategy. This customised approach is coherent with the basic assumptions of smart specialisation, which rely on unique resources and which support countries and regions in developing their own methods of generating economic growth, however, it entails the problem of objective evaluation of outcomes of its implementation. It can certainly be asserted that smart growth is a continuous process, and the evolution of the approach to smart specialisation more and more often inclines towards the multi-dimensional approach—which includes more than technological innovations and innovative research. Smart growth is a multi-dimensional phenomenon which should be interpreted in accordance with the assumptions of the Europe 2020 strategy: smart, sustainable, and inclusive growth translates into living conditions, from innovativeness level, through environmental protection, to social inclusion [27].
Smart specialisation constitutes a key element of the EU measures focused on supporting the countries and regions in working out their own paths to economic growth [8]. Each region in Poland (voivodeship, NUTS2) has developed a regional innovation strategy and runs the RIS3 evaluation in accordance with its own concept. We propose to make an assumption that the totality of the regions’ activities functioning on the basis of RIS3 is coherent. A regional economy constitutes a whole and it should be viewed as a whole. Naturally, it is possible to analyse single innovation initiatives being examples to others; still, we prefer to take an assumption that the innovativeness of regions covers the social sphere, the sphere of technology, the entrepreneurship level as well as R&D and innovation-related aspects in industrial and service sectors. To that end, we completed some analyses to see what changes took place in Polish regions in the level of innovative development before and after introducing the smart specialisation strategy. The approach relies on the assumption that innovativeness on the one hand determines and on the other hand is determined by smart and sustainable growth (Figure 1), which will be described further on in this paper.
The aim of this study is to explore the process of smart specialisation and its role in innovative development of regions in Poland. Based on an extensive analysis of documents and existing reports on monitoring the RIS3 implementation, we constructed a synthetic indicator of regional innovation development showing the dynamics of development of individual Polish regions in 2008–2019, i.e., before introducing RIS3, in the course of and several years after their implementation. The analyses were based on 2992 input data. The study applied the zero unitarisation method (to standardise the values) and the linear ordering method, checked the span of the studied variables and the change in their values over time, and also calculated the Pearson correlation coefficient to assess the relationship between GDP per capita and the level of innovative regional growth.
The main outcome of the analysis is the presentation of new research assumptions and the results of the regional benchmarking based on a synthetic measure of development, and verification of the relationships between the level of innovative development and the economic development in the regions. The proposed method of verification of these dependencies allows for an objective analysis of the effects of introducing smart specialisation. This is important because a review of the international literature shows that researchers most often limit themselves to conducting desk research or verifying individual variables. Thus, this paper constitutes an original contribution to the literature on the subject, providing a framework that may help decision-makers to develop and implement RIS3 which not only promote smart but also sustainable regional economic growth.
The rest of the paper is organised as follows: the next section discusses the concept of smart specialisation and RIS3, its objectives and basic assumptions in the context of innovative development. Next, we present the process of implementing smart specialisations in Polish regions and identify the categories and features (factors) that make up innovative development. Section 5 contains a description of the research methods applied, and Section 6 presents the results of the study. In the final section, we conclude with a summary of our results.

2. The Concept of Smart Specialisations in the Context of Innovative Development

The framework for the current innovation policy conducted and implemented in Europe under the 2014–2020 financial perspective was based on the concept of smart specialisation devised by Foray, Foray and Goenag [28] and Foray et al. [29,30]. In addition, some previous studies had a significant impact on the idea of smart specialisation, e.g., those by Rodrik [31] and Hausmann [32]. The studies to a large extent created a framework for the idea of smart specialisation which from 2014 was deemed to be one of the key elements aimed at implementing the Europe 2020 strategy that promotes smart, sustainable and inclusive growth [33]. Currently, the role of smart specialisations in concentrating the resources for smart and sustainable growth is enhanced. Business support focuses more and more on the priority areas of the EU cohesion policy for 2021–2027, which are important from the point of view of the future of the economy, as well as the social and environmental challenges. The main purpose of new, smart frameworks of innovation is maximisation of the contribution of innovations in economic development and social well-being, while protecting the environment. As Makkonen pointed out, it is often argued that innovation plays a key role in the economic growth of regions [34]. According to McCann and Ortega-Argilés, it is possible to assume that, from a regional policy perspective, the smart specialisation approach offers some potential advantages for both understanding the evolutionary nature of regional economies, and also for the design of appropriate policy-making [35]. In this approach, the smart specialisation policy does not consist of choosing priorities on a top-down basis, but in stimulating the ongoing dynamic entrepreneurial process, discovering in the regions, on a bottom-up basis, new specialisation areas that might be productively supported by the public sector in order to dynamise smart and sustainable growth.
What distinguishes a smart specialisation strategy from typical innovation strategies is reliance on facts. In view of the stage of creating the strategies in the regions, an important element is the process of entrepreneurial discovery, and also taking into account, in any diagnoses and research analyses that lead to qualifying any specialisations, all the available resources, i.e., geographical location, population structure, climate, natural resources, and demand, e.g., social needs, potential customers, innovations in the public sector. However, in view of the impact of the strategy effects on the regions’ development, the aspects are subject to modification meaning that the effects of innovation policies based on smart specialisation are visible in a broader perspective, covering such categories as human resources, level of entrepreneurship, the sphere of technology, innovative activities (in particular R&D), economic growth, productivity and consumption.
According to World Bank experts, smart specialisation is a new form of industrial policy, which builds on the idea of economic specialisation and the ability of a region to build a competitive advantage on unique, locally based expertise that can be applied in a new and innovative manner [36]. In this approach, the World Bank experts stress that smart specialisation is a dynamic process, where the regional specialisations are selected from among many potential economic activities identified in an ongoing process of entrepreneurial discovery. The smart specialisations are constantly monitored and evaluated: some specialisations are constantly developed, while others are allowed to die [36]. The logic of creating an innovation policy based on smart specialisation was shown by Argiles et al. who enumerated two important elements:
  • regions cannot do everything in science, technology and innovation;
  • they need to promote what makes their knowledge base unique and superior to others [37].
The key challenge for regions is how to identify those activities or domains where new R&D and innovation projects will create future domestic capability and interregional comparative advantage [37].
An important issue in smart specialisations is going beyond the boundaries of regions and business sectors. As noted by Stawicki et al., according to the smart specialisation concept, one should not thoughtlessly duplicate any solutions coming from other territories, as it may lead to fragmentation of the European innovation system and prevent achievement of the critical mass in individual specialisations [38]. According to the above mentioned authors, supraregional cooperation should be undertaken when similarities and complementarities are found between regions, while the choice of specialisations should be based on qualitative and quantitative data. The main criteria for choosing the economy sector include [38]:
  • presence of key resources and capabilities (e.g., specialised labour force), and in particular their original (intersectoral) combination;
  • a potential for diversification of the sectors via intersectoral ties, or ties between knowledge domains;
  • critical mass/critical potential within the given sector;
  • international position of the region in global value chains in a given specialisation.
Smart specialisation is a concept that catalyses sources of financing and that concentrates the ways of influencing the innovative potential in the regions. According to Rusu, smart specialisation may be treated as a key solution for avoiding dissipation of the EU research funds and for focusing the research, innovation, human and financial resources on those innovative sectors which are high performing, strategic from a socio-economical perspective, eco-friendly and attractive for investors [39]. An integral element of a smart specialisation strategy is sustainable growth and development [40]. The EU strategic documents and other trends in the literature [41,42,43] exert a significant influence on the contemporary discourse on smart and sustainable growth in Europe, especially in the context of smart specialisation strategies. It was already in the Communication from the Commission entitled “EUROPE 2020: A strategy for smart, sustainable and inclusive growth” that three priorities were presented to be the determinants of development for the European countries for the years 2014–2020 under the cohesion policy. These are [40]:
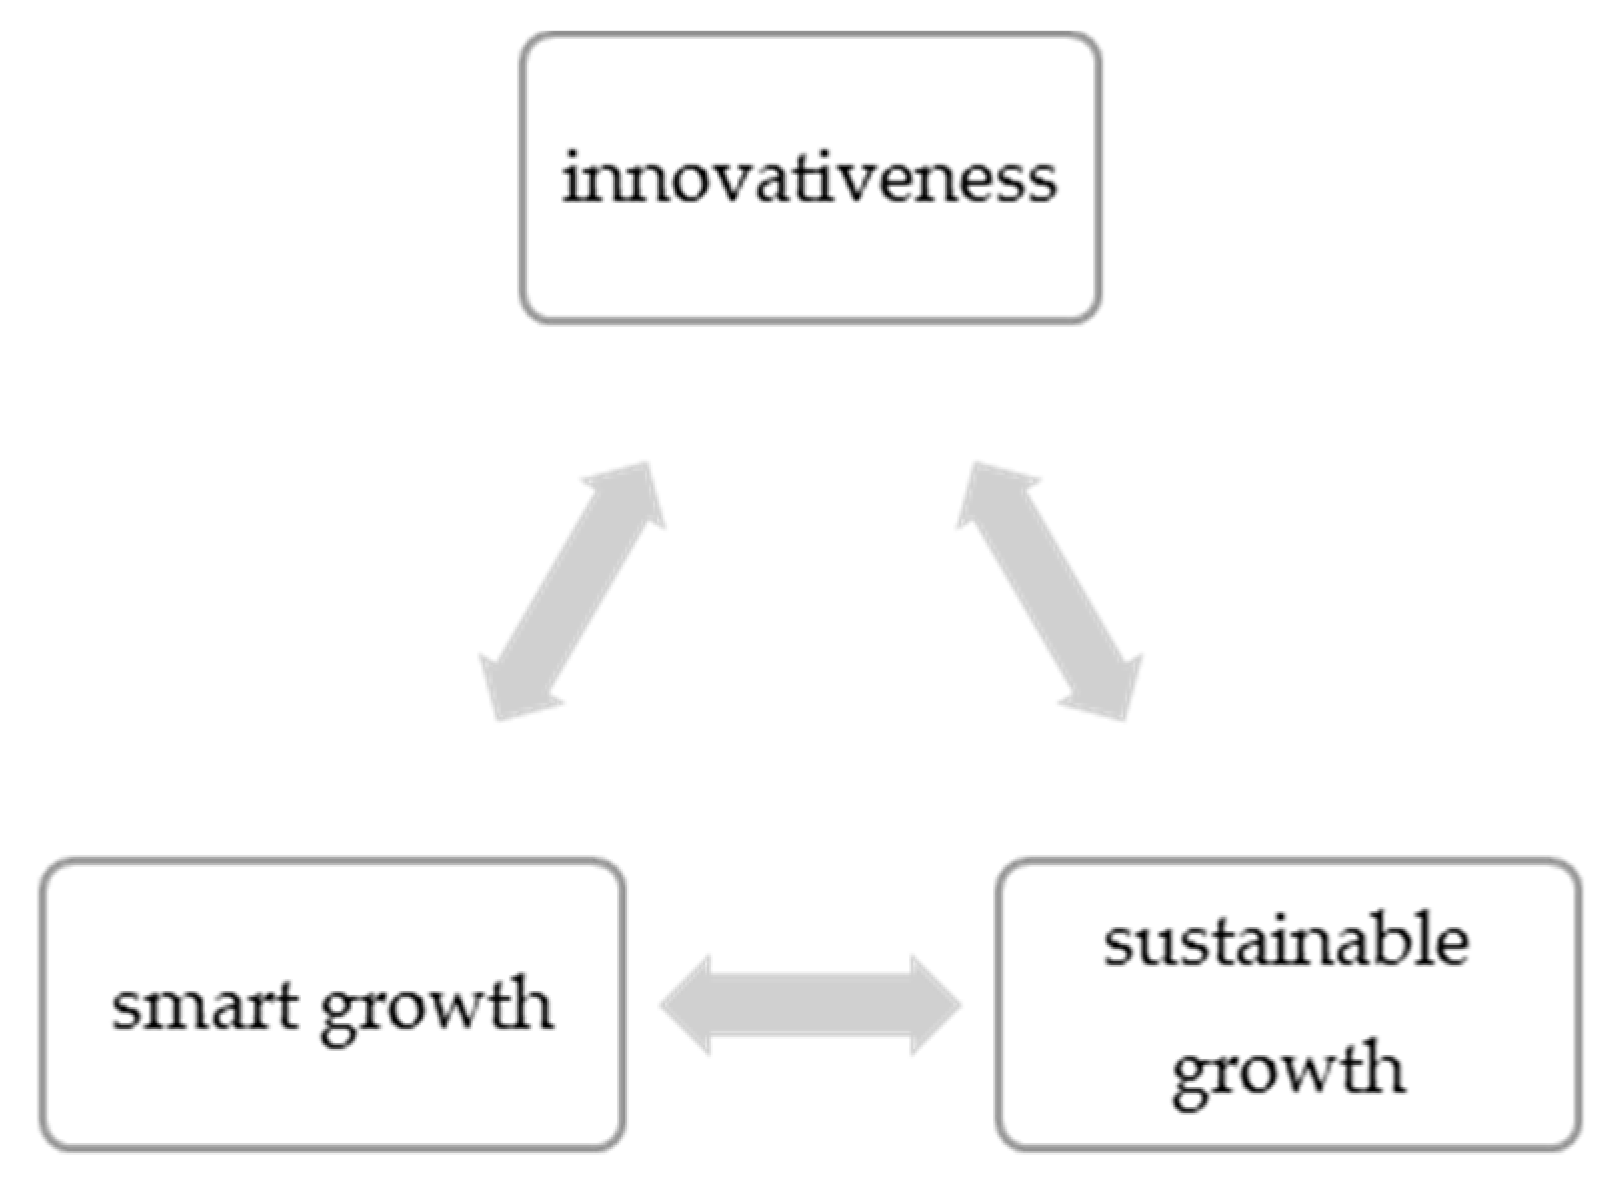
  • Smart growth—developing an economy based on knowledge and innovation.
  • Sustainable growth—promoting a more resource efficient, greener and more competitive economy.
  • Inclusive growth—fostering a high-employment economy delivering economic, social and territorial cohesion.
At this point it should be noted that the above mentioned relevant aspects related to a sustainability framework based on equally important pillars constitute the acknowledgement that although each of them maintains its own autonomy, identity and value, they are interdependent [44].
The concept of smart growth, which comprises the notions of both smart specialisations and smart city development, indicates the direction of development of the EU economies and the adopted priorities, aiming at fully sustainable growth. In the Europe 2020 strategy, smart specialisation is shown as a major recommendation for the economies of the EU member states. In addition to the fact that the very idea of smart specialisation is treated as a priority, playing a vital function in the cohesion policy, it is also possible to note the major assumption that innovativeness on the one hand determines, and on the other hand is determined by, smart and sustainable growth. Smart and sustainable growth are directly correlated, while the concept of innovation is a factor that integrates them [10]. According to Dziedzic et al., the support provided by public entities is especially important, as under national and regional innovation systems they may combine their efforts in order to support scientific research and technology development, and to bridge the world of science with the world of business, assisting in commercialisation of knowledge and technology [10]. This approach does not focus on innovation and technology as such but is aimed at specifying how the transition to sustainable growth relates to the general changes in the economy and society, and especially to the role of the public policy.
The issues of the public policy understood as considerable socio-economic challenges and a mission-oriented policy prove that major social challenges—such as sustainable growth, an ageing society, healthcare, climate changes, energy and poverty—will require the adoption of new ways of cooperation between public and private entities [45]. Moreover, it is considered that innovativeness and new technologies contribute to achieving goals in the area of sustainable growth only when additional technologies and institutions become available in that bigger socio-technical system [46]. The current knowledge about how to achieve such goals is insufficient, therefore it will be necessary to invest in development of new technologies and new scientific knowledge [47], including those based in the concept of smart specialisation. The need to prioritise development and to assign a precise framework for it is in full compliance with the concept of sustainable growth. Smart, sustainable and inclusive growth, being at the same time a model of a resource efficient, low-emission economy, is an example of the possible relationships between smart specialisation and sustainable growth [10]. A measurable, tangible effect of this combination is the Regional Innovation Strategy (RIS3), establishing priorities in order to achieve a competitive advantage by developing and combining strengths in the area of scientific research and innovations with business needs, in order to meet any arising opportunities and to develop the market in a coherent manner, at the same time avoiding any doubling or fragmentation of the efforts [48]. The Research and Innovation Strategies for smart specialisations (RIS3) are integrated, place-based economic transformation agendas, showing five characteristics [49]:
  • They focus policy support and investments on key national/regional priorities, challenges and needs for knowledge-based development, including ICT-related measures.
  • They build on each country’s/region’s strengths, competitive advantages and potential for excellence.
  • They support technological as well as practice-based innovation and aim to stimulate private sector investment.
  • They fully involve stakeholders and encourage innovation and experimentation.
  • They are evidence-based and include sound monitoring and evaluation systems.
The goal of RIS3 is economic development via regional priorities which correspond to efficiency, research and innovations of a knowledge-based economy. According to Kangas and Aarrevaar, the main point is to allocate the resources for research and innovation in order to enhance priority areas of regional funding, governance and regulation, forming a regional policy mix [22]. RIS3 correspond to the probably the greatest attempt so far at an organised, supranational strategy of innovation, which according to Grillitsch and Asheim, stimulates economic growth via economic diversification and developing a new path, e.g., diversification of the economy to technologically more advanced activities which make progress towards more complex knowledge compared to its current level in the region [50]. Moreover, quoting Jucevičius, it is necessary to assume that the absorption capacity is here considered to be the basic assumption for the innovativeness of the Regional Innovation Strategy RIS3, in which all the participants (persons or institutions, innovators or observers) operate as a network and have appropriate capabilities to operate, maintain and develop [51].
Regions all over the European Union (and beyond) have worked out their own regional research and innovation strategies for smart specialisations (RIS3), which because of the European Commission that established RIS3 as a prerequisite for accessing some financial facilities under the EU structural funds for regional growth [52] have become of key importance for the pro-innovation activities. According to the data of the Joint Research Centre (JRC-IPTS), over the past several years over 180 smart specialisation and similar economic transformation agendas have been designed and implemented, offering over EUR 67 bn available under European structural and investment funds (2014–2020 programming period) [53].
To conclude, it is necessary to assume that the contemporary approach to stimulating the innovation potential relies on “the logic of regional innovation systems”, RIS3 [23] and focuses on the mutual relationships and complementarity between the industries and sectors, i.e., on what Asheim et al. call “diversified specialisation” [52,54]. RIS3 consist of a subsystem for knowledge generation and dissemination, including R&D organisations, educational institutions and technology transfer agencies, as well as a subsystem for knowledge application and utilisation, which comprises companies and clusters located in the region. An intensive flow of knowledge, resources and human capital is observed here, which is of key importance and which constitutes a foundation of system innovations [55].

3. Implementation of Smart Specialisations in Polish Regions—Background for Analyses

As has already been mentioned, a smart specialisation constitutes a key element of the EU measures focused on supporting the countries and regions in working out their own paths to economic growth. Moreover, RIS3 are commonly found and they are analysed on multiple levels; due to unique conditions there are various methods by means of which they are established, implemented or evaluated. This customised approach to RIS3 in regions is consistent with the basic assumptions of smart specialisation, but unfortunately it also entails the problem of the lack of objective, context-based (comparative) assessment of implementation effects on a bigger scale. For the purposes of the main research objective, which is exploration of the process of smart specialisation and its role in the innovative development of regions in Poland, it seems necessary to outline the specific nature and short description of the model functioning mechanism of RIS3 in Polish regions, as this is important to ensure the comparability of results and coordinating the assessments, and finally it constitutes a justification for the constructed synthetic measure of regional innovation development (SMRID).
Although it is not the Authors’ intention to provide any detailed presentation or characteristics of smart specialisations identified by 16 Polish regions, on the basis of strategic regional documents as well as their own experience it is possible to identify several most vital facts in this context. Firstly, due to the aforementioned requirement set by the European Union and the period of preparations for the 2014–2020 financial perspective, all the regions (voivodeships) in Poland declared they would set out to identify smart specialisations pursuant to their own concepts and an autonomous process of entrepreneurial discovery. The table in Appendix A presents the effects of the identification, based first and foremost on the information available on the S3 Platform site [56] and then in the studies prepared for the Ministry of Regional Development in Poland (e.g., [57]).
It should be noted that the selection of smart specialisations in Polish regions involved works completed in different sequences, by means of varied methods of determination, showing diverse characters and levels of detail of the identified specialisation areas. The obtained results were also different (from general and broadly understood slogans such as “green growth” to literally understood, specific industries such as “glass industry”). Identification of the specialisation was mainly based on statistical data, predominantly on the level of GDP generated by a given sector, employment level and human resources with a given education profile. Another important element covered the comparative analyses performed in order to show the potential of key industries. Social consultations were also carried out in the regions, among the public, entrepreneurs, business environment institutions, and non-governmental organisations. Moreover, while previous regional innovation strategies (now replaced by RIS3) were developed most often in addition to regional development strategies, supplementing the general strategy that covered more aspects of life in the region, i.e., the social sphere, the environment, etc., the smart specialisations identified at the regional level were included in the general development strategies of voivodeships or in regional development strategies.
Looking at the general characteristics of the indicated smart specialisations in the Polish regions, it is possible to note that the most popular specialisations—ICT and multimedia—were chosen by the voivodeships: Dolnośląskie and Wielkopolskie. Medicine and health tourism were identified as part of the regional innovation policy in: Dolnośląskie, Lubuskie and Zachodniopomorskie. Smart specialisations within the scope of healthy food were indicated in the voivodeships: Dolnośląskie, Lubuskie and Opolskie. In turn, bioeconomy was chosen in Dolnośląskie, Lubuskie, and Zachodniopomorskie. Opolskie focused its regional policy on power engineering, including renewable energy sources. Mechanical engineering and the metal industry was another popular specialisation chosen by: Dolnośląskie, Lubuskie, Opolskie, and Zachodniopomorskie. Business services, logistics and water engineering were provided with assistance in Zachodniopomorskie, whereas smart specialisations in chemical and mining industries were selected by Dolnośląskie.
Just a glimpse of the results of smart specialisation selections in Polish regions is enough to see that in the case of many processes they were unable to avoid the imitation approach, i.e., some regions were imitated by others, and the areas to be promoted were merely the ones that had been identified earlier. The regions followed the safe path that brought success to others but failed to use their own innovative potential. It is also hard to notice a basic assumption for smart specialisation such as regions becoming leaders in unique specialisations; simultaneously it is possible to see that the chosen activities concentrated on the most popular smart specialisations (e.g., ICT, nanotechnology, biotechnology).

4. Methods of Measurement of Regions’ Innovation Development

The literature on the subject provides numerous studies describing innovativeness indicators along with their differentiation depending on the stage of the innovation process [58]. In this aspect, the fact of key importance is that innovativeness of enterprises [59,60], products [61] or processes [62] is specified and measured in different ways. One of the most commonly used indicators that describes innovative development is the Innovation Union Scoreboard (IUS)—an instrument that enables assessment of implementation of the flagship initiative of the Europe 2020 Strategy—Innovation Union, which makes it possible to compare and evaluate the innovativeness level of the individual EU member states and effectiveness of their innovation policies. It is also used in analysing strengths and weaknesses of their research and innovation systems [63]. It should be noted that the indicator evolves over time (it replaced the former indicator: European Innovation Scoreboard, for more details please refer to: [64]). Data regarding innovativeness on the country level can also be found in “The Global Innovation Index” report which relies on the factors that describe the political environment, education, infrastructure and business sophistication). In turn, the report published by OECD (Organisation for Economic Co-operation and Development) —the Science, Technology and Industry Scoreboard 2017—shows how digital transformation is affecting science, innovation, the economy, and the way people work and live [65]. It is possible to list many other similar studies; however, this is not the purpose of this paper which focuses on the role of RIS3 in regional innovation growth. Moreover, the undoubted drawback of any international studies is that they are limited by data availability in all the analysed countries; furthermore, part of the data found at the national level is not available on the regional level. An interesting conclusion was drawn by Kubiczek [66] who emphasised that not all countries were interested in standardising the measures of development; as such indexes often demonstrated a lower level of the given country’s development and adversely affected its image. In the context of analysing the situation in Poland, we should refer to the study prepared by the Polish Central Statistical Office, entitled Wskaźniki zrównoważonego rozwoju Polski 2015 (Indicators of Sustainable Growth of Poland 2015) [67], which distinguishes four governances: social, economic, environmental, institutional political, among which some thematic areas have been specified, comprising specific characteristics (Appendix B).
Based on the literature review, it was found that, as assumed in the introduction, the following categories comprise innovative development, when considering a regional economy as a whole [34,59,60,68,69]:
  • human resources (human capital);
  • level of entrepreneurship;
  • sphere of technology;
  • innovation activity, R&D;
  • economic development;
  • production and consumption patterns.
Each of the above listed categories may be assigned from several to more than a dozen characteristics. In the Authors’ opinion, it is most advisable to take into account the key areas described by a specific feature that is most relevant for the context and the purpose of the study, therefore, the methodology section proposes a set of variables that are the most convergent with the study objectives.

5. Methodological Aspects of Measuring the Innovative Development of Regions/Innovativeness of Regional Development

Studies of regional development are of an interdisciplinary nature and are described with numerous definitions which may be formulated differently, depending on the context and the area of science they derive from. Most often, such studies rely on methods of ranking some specific variables or values of synthetic measures of development, constructed in order to present a given phenomenon. The stages of the procedure leading the attainment of a synthetic variable comprise: selection of diagnostic variables that are factually connected with the overarching criterion, eliminating the individual denominations of the variables and standardising their orders of magnitude to make them comparable and additive, assigning to the individual variables the weights that specify their significance for the general criterion compared to other features, selection of the aggregation formula as the basis for determining the value of the synthetic measure of development. The proposed research method is consistent with the one presented by Walesiak [70], Hartigan [71], Everit, Landau, Lees and Stahl [72].
Based on the conclusions drawn from the literature review, the key measures of regional innovation development in Poland were selected. The input data used in the computations come from Bank Danych Lokalnych GUS (Local Data Bank of the Polish Central Statistics Office) [73] and pertain to the years 2009–2019. The period is determined by the time of introducing the RIS3 (2014) and availability of the latest data (2019). Additionally, to show the rate of changes over time, it was decided that the analysis should cover the 5-year period from the moment of introducing the RIS3 and the 5-year period preceding that introduction (2009). The analyses covered all the 16 regions (voivodeships) in Poland, and the indicator of regional innovativeness was predicated on 17 variables, which means that the study involved a total of 2992 features. Where occasionally data were missing for a given year, interpolation methods were used to supplement them.
The features describing the level of innovativeness of individual regions were assigned to 6 categories. Table 1 presents the features applied in the study.
The enumerated diagnostic variables were expressed in different units of measurement, which made any direct comparison impossible. In order to make them comparable and additive, they were transformed by means of the zero unitarisation method based on the span between the maximum and minimum values of the feature in question. Obtained values of the variables are positive and fall within the range of 0 to 1 (“1” stands for the most beneficial, and “0” for the least beneficial value of the examined variable). It is assumed that when a high value of the diagnostic variable for a given phenomenon is associated with beneficial growth, the feature is considered Larger-the-better (LTB), whereas in a situation where a low value of the variable is beneficial for the phenomenon in question, it is deemed Smaller-the-better (STB). The standardisation was carried out with the use of the following formulas [74]:
LTB:
Z ij = x ij min x ij max x ij min x ij
STB:
Z ij = max x ij x ij max x ij min x ij
where: Zij—diagnostic variable, falling within the range from 0 to 1; xij—the feature value for a given region; min xij—the lowest value of the feature among the examined regions; max xij—the highest value of the feature among the examined regions.
Based on the analysis of the selected diagnostic variables, equal weights were attached to them, which is a commonly applied practice, consistent with, inter alia, Grabiński [75], Sokołowski [76], Klóska et al. [77] In the next step, a relative coefficient of regional innovation development was computed, by means of the following formula:
SMRID i = 100 k j = 1 k α j z ij
where: SMRIDi—synthetic measure of regional innovation development; k—quantity of variables considered in the study; αj—weight of the jth variable; zij—values of the statistical features xij considered in the study, standardised by means of the zero unitarisation method.
It was assumed that a higher value of the aggregate formula was associated with a higher level of socio-economic development.
The level of economic growth was measured by per-capita-GDP which, despite its imperfections, still happens to be the basic and universally applied measure of economic growth. In the studies on the effects of the EU financial assistance policies and programmes, it is common to analyse the value of GDP per capita and its changes over time. It is understandable, as the value is currently a criterion of granting funds by the EU. This is confirmed by the conclusions drawn by Pieńkowski & Berkowitz [78] who analysed 23 studies regarding the Cohesion Policy growth effects, out of which 20 relied on GDP growth per capita. Moreover, Misiąg et al. [79] and other authors conducted their analyses on the basis of that value. To assess the relationship between the level of regional economic development measured by means of per-capita-GDP and the SMRID, we used the Pearson correlation coefficient rjl, which is a measure of linear correlation between the variables. It is expressed by the following formula [80]:
r jl = Cov jl s j s l
where: Covjl—covariance between variables Xj and Xl; sj—standard deviation of variable Xj; sl—standard deviation of variable Xl.
This coefficient is a synthetic measure and its values fall within the range <−1, 1>, informing about the strength and direction of the linear correlation between the variables. When its value is 0, it means that there is no linear correlation between the studied variables. When the value is other than 0, this shows a correlation between the features. A value above 0 means there is a positive correlation, i.e., an increase in the value of one variable is accompanied by an increase in the conditional mean of the other variable. In the case of a value below 0 there is a negative correlation, i.e., an increase in the value of one variable is accompanied by a decrease in the conditional mean of the other variable. When the coefficient equals 1 or −1, there is a linear functional correlation [81]. The coefficient is widely applied in analyses regarding regions, inter alia by: Capello and Dentinho [82], Pawlewicz and Pawlewicz [83], Standar and Kozera [84] and Rokicki [85].

6. Results and Discussion

In the context of the above mentioned findings and analyses of the rate of development of the innovation potential of Polish regions based on the constructed SMRID indicator, general relationships were identified in the periods before and after the introduction of smart specialisation strategies (RIS) at the regional level. The analysis of the synthetic measure of regional innovation development (SMRID), which was computed for the regions in Poland for the years 2009, 2014, 2019 (Figure 2) indicates stability of positions taken by individual regions, as well as considerable and persisting disproportions in innovation development between regions taking the positions at both ends of the ranking. The Mazowieckie voivodeship is a leader, holding the top position in all the studied periods, whereas the other places in the top three were held alternately by the Małopolskie, Dolnośląskie and Pomorskie regions. Furthermore, there is a significant difference between the SMRID value for the Mazowieckie region (0.85 in 2019) and the second highest value obtained by Małopolskie (0.65 in 2019). A puzzling finding is also the decrease in the SMRID value in the years 2014–2019 in the two top regions (by 0.01 in Mazowieckie, and 0.07 in Dolnośląskie). The regions showing the lowest values of the SMRID in each of the analysed periods are: Świętokrzyskie (0.3 in 2009, 0.22 in 2014 and 0.2 in 2019), Warmińsko-mazurskie (0.27 in 2009, 0.24 in 2014 and 0.22 in 2019) and Lubuskie (0.24 in 2009, 0.26 in 2014 and 0.26 in 2019), whereas the SMRID values for the Świętokrzyskie and Warmińsko-mazurskie regions have been falling since 2009. The biggest increase in the SMRID value was observed before the introduction of RIS3 and was identified in Opolskie (0.08) Dolnośląskie (0.07), Łódzkie and Zachodniopomorskie (0.05). In the years 2014–2019 it was possible to observe an increase in the SMRID in Małopolskie (0.05), Pomorskie (0.03) and Podlaskie (0.01), in the other regions the value was unchanged or fell compared to the level of 2014.
On that basis, it was possible to distinguish four groups of regions:
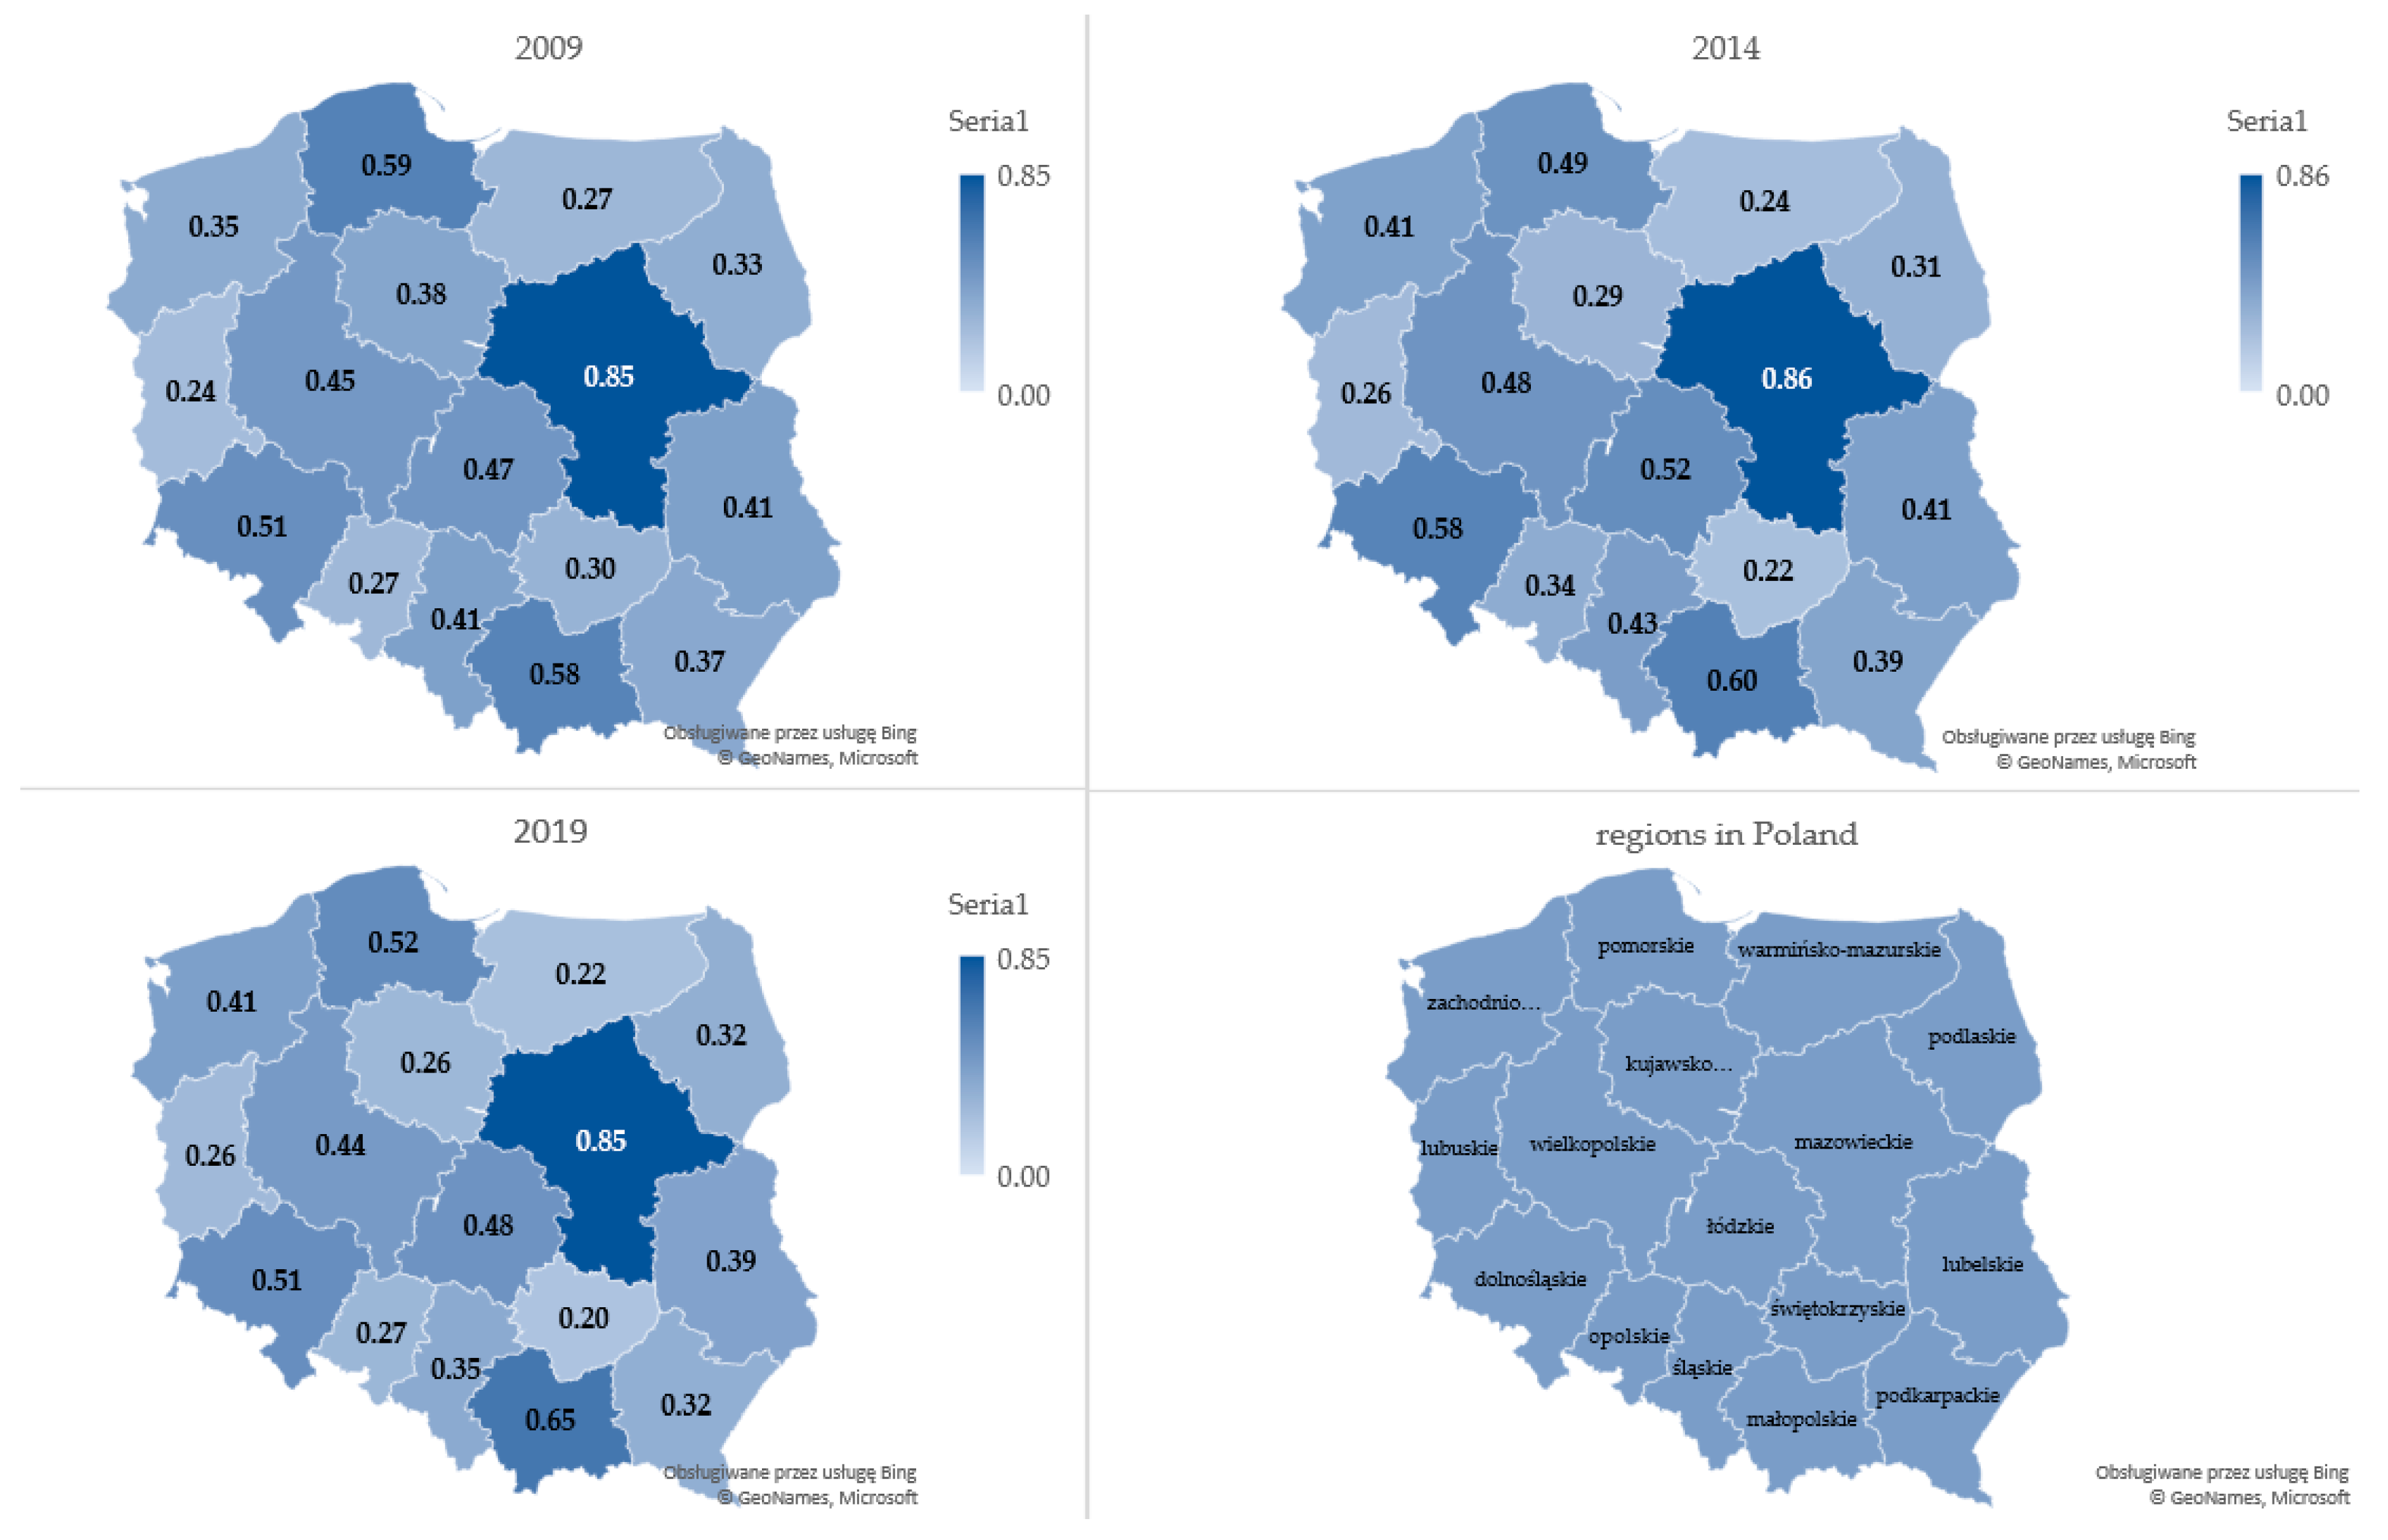
  • the ranking leader—Mazowieckie;
  • three regions which, in different configurations, in each period took positions that ranged from the second to the fourth place (Małopolskie, Dolnośląskie and Pomorskie);
  • three regions which alternately took the last three places in the ranking (Świętokrzyskie, Łódzkie, and Lubelskie);
  • the remaining nine regions which were placed in the middle of the ranking.
The analysis of the changing values of individual features underlying the SMRID has shown that the number of patents granted by the Polish Patent Office per 100,000 inhabitants on a national scale doubled in 2019 (110.9) compared to 2009 (53.6); however, the biggest number of patents was reported in 2016 (117.5). In the years 2009–2019, the biggest number of patents per 100,000 inhabitants was granted in Mazowieckie (102), and the smallest in Lubuskie (23). The share of people employed in R&D in each of the analysed 11 years was the biggest in Mazowieckie, the runner-up was Małopolskie, and the smallest share was found in Lubuskie and Świętokrzyskie. In each analysed year, investment outlays per inhabitant were the highest in Mazowieckie, as was the occupational activity rate. Similar conclusions can be drawn when analysing how each individual feature changed over time. Mixed results can be found in the middle of the ranking, and the highest ranked regions dominate over the others in most of the verified aspects. The analysis of the Pearson coefficient of correlation has shown a moderate, positive correlation between the per-capita-GDP level and the SMRID value in 2009, and a quite strong positive correlation between the variables in the years 2014 and 2019 (Table 2).
This confirms, on the one hand, the fact that as a rule the more innovative regions are characterised by a higher level of economic growth, on the other hand the obtained values of the Pearson correlation coefficient indicate that there are regions which despite a high value of SMRID do not generate a proportionate increase in per-capita-GDP. This could be to some extent explained by non-measurable (subjective) aspects connected with e.g., life quality of the inhabitants, which might be an area that should be subject to further research studies and analyses. The analyses performed were the closest to the approach of Gianelle and Kleibrink, who suggested verification of expected changes and indicators of results within the framework of strategic priorities and analyse many instruments implemented in the policy mix adequate to each priority [18]. It can also be concluded that the structure of the SMRID complements studies focused on specific aspects of intelligent development, such as Duque Estrada Santos [20] or David, Foray and Hall [21]. According to the authors, only an analysis based on a complex indicator enables an objective assessment of the effects of introducing smart specialisation. The unquestioned benefits related to smart specialisation should not overshadow the drawbacks connected with the process of implementing the concept in Poland. The problematic issues concerning the idea of smart specialisation pertain to the concept itself, as well as the possible effects of its introduction. As regards to latter, it is possible to note that there is a risk that the “smart specialisation” denotation may be extended to some areas of business characterised by relatively low productivity, which should disqualify them as a potential growth engine. In the context of sustainable and innovative development, relying on relatively unproductive business sectors may lead to increasing the gap between the given region and the regions showing a high growth rate and a strong development impulse.
Even though the analysis of the value of the synthetic measure of regional innovation development calculated for the periods before and after the introduction of smart specialisation strategies has shown stable and persisting disproportions between the regions, one cannot deny that the concept provides a cure for the pathological rivalry among the regions, the so called “competition of all against all and in every field”. Nevertheless, based on the results of the SMRID value analysis one could ponder to what extent the selected smart specialisation among the ranking leaders (the regions of Mazowieckie, Małopolskie, Dolnośląskie and Pomorskie) strengthened their development potential in the area of innovation, and to what extent the potential would have developed without using that concept. Still, taking into account the positive phenomena and processes that facilitate the development of innovativeness in the regions, one can conclude that the implementation of smart specialisations must have contributed to the interregional and sublocal cooperation and collaboration, which consequently enables implementation of numerous shared innovation-oriented projects.

7. Conclusions

Based on the results of analyses of the SMRID values it is possible to assume that smart specialisations in highly developed Polish regions more often rely on innovative business sectors and on increasing their competitiveness via innovation growth, compared to the poorer regions with the so called traditional industries. Additionally, dependence on single smart specialisations (even though they have been ideally selected) may prove dangerous for the weaker regions where the economic potential is small. In this context, there is a noticeable risk that one of the fundamental goals of the EU cohesion policy may not be achieved due to a weak influence of smart specialisations on innovation growth and convergence in the regions. Based on the results of the presented analysis it was found that in the case of the voivodeships with the lowest SMRID values (Warmińsko-mazurskie and Lubuskie) there was a much higher risk of supporting the solutions that may finally turn out to be ineffective. Such regions might show a slower growth rate of its innovation potential than others. This is due to the fact that some specialisations to a large extent rely on innovations connected with using the natural environment (including eco-innovations), which are often characterised by lack of yield from investment.
Furthermore, selection and implementation followed by measurement of the implementation results is connected with the process of selecting the so called “winners” and “losers”. Concentrating the development of state-of-the-art technologies in the best developed regions, with concurrent marginalisation of less developed regions, may lead not only to regional polarisation, but also to catalysing the funds aimed at supporting any innovation-oriented activities in one direction. This is particularly important both in the case of EU funds and other tools of regional intervention (e.g., cooperation with institutions of higher education in the region). Regional strategies for smart specialisation in Poland have been implemented as a concept of influencing the innovation potential, which in turn is to lead to sustainable and innovative growth. Analysing the innovative potential in Poland, it should be stressed that there is a number of social, economic and spatial factors which affect the level of innovativeness. This is because the innovation processes on the one hand are heavily determined by the society wealth level and human capital resources, which are often manifested by open attitudes to innovative products. On the other hand, innovation development depends on the economy’s technological capacity—understood in a broad sense as a level of technological advancement of industry and service sectors, the academic sphere that introduces innovations to the economy.

Author Contributions

Conceptualization, E.O.-K. and M.K.-J.; methodology, E.O.-K.; validation, E.O.-K. and M.KJ., formal analysis, E.O.-K. and M.K.-J.; investigation, E.O.-K. and M.K.-J.; resources, E.O.-K. and M.K.-J.; data curation, E.O.-K.; writing—original draft preparation, E.O.-K. and M.K.-J.; writing—review and editing, E.O.-K. and M.K.-J.; visualization, E.O.-K. and M.K.-J.; supervision, E.O.-K. and M.K.-J.; project administration, E.O.-K. and M.K.-J.; funding acquisition, E.O.-K. and M.K.-J. All authors have read and agreed to the published version of the manuscript.

Funding

This research was funded by the program of the Minister of Science and Higher Education under the name “Regional Excellence Initiative” in the years 2019–2022; project number 001/RID/2018/19; the amount of financing: PLN 10,684,000.00.

Conflicts of Interest

The authors declare no conflict of interest.

Appendix A

Table A1. Regional smart specialisations of Polish regions.
VoivodeshipSmart Specialisations
DolnośląskieChemical and pharmaceutical industries
Spatial mobility
High quality foods
Natural and recycled materials
Manufacturing of machines and equipment, materials processing
ICT
Kujawsko-pomorskieSafe foods
Processing, fertilisers and packaging
Medicine, medical services and health tourism
Automotive industry, transport devices and industrial automation
Tools, injection moulding, plastic products
Information processing, multimedia, programming
ICT services
Lubelskie Bioeconomy
Medicine and health
Low-carbon power engineering
IT and automatic control
LubuskieGreen economy
Health and life quality in the region
Innovative (modern) traditional industry
Business cooperation
ŁódzkieModern textile and fashion industry (including design)
Advanced building materials
Medicine, pharmaceuticals, cosmetics
Power engineering, including renewable energy sources
Innovative agriculture and food processing
Information technology and telecommunications
MałopolskieLife sciences
Sustainable energy
ICT
Chemicals
Production of metals and products from metal and mineral non-metallic resources
Electrical and mechanical engineering
Creative and leisure industries
MazowieckieSafe foods
Smart management systems
Modern business services
High quality of life
OpolskieChemical (sustainable) technologies
Sustainable construction and wood-processing technologies
Metal and mechanical engineering technologies
Power engineering technologies (including renewable energy sources improving the energy efficiency)
Agricultural and food processing technologies, healthy food
PodkarpackieAviation and astronautics
High quality of life
ICT
PodlaskieAgricultural and food sector
Medical services sector
Ecoinnovation sector
Mechanical engineering
PomorskieOff-shore and port logistics technologies
Interactive technologies in an information saturated society
Eco-effective technologies in production, transmission, distribution and consumption of energy and fuels and in construction industry
Medical technologies within the scope of civilisation diseases and ageing
ŚląskiePower engineering
Medicine
ICT
Emerging industries
Green economy
ŚwiętokrzyskieResource-saving construction industry
Metal and foundry industry
Modern agriculture and food processing
Health and pro-health tourism
ICT
Exhibition and trade fair business
Sustainable energy development
Warmińsko-mazurskieWater economy
High quality foods
Wood and furniture
WielkopolskieBioresources and food for conscious consumers
Interiors of the future
Industry of tomorrow
Specialised logistic processes
ICT-based development
Modern medical technologies
ZachodniopomorskieBioeconomy (based on the region’s natural resources and its economic and R&D potential)
Maritime activities and logistics (including maritime technology—the industry which is nested in the region, but which must respond to current challenges)
Metal and mechanical engineering industry (there are more and more companies operating in this sector in the region, there are more and more industrial parks, an additional advantage is the precious experience connected with the shipyard industry)
Services of the future (the fast-growing ICT, IT knowledge process outsourcing and creative industries
Tourism and health (making use of natural resources and cultural heritage)
Source: Own study based on the regional strategies of the 16 voivodeships in Poland.

Appendix B

Figure A1. Thematic areas of indicators of Poland’s sustainable development, according to the Central Statistical Office of Poland. Source: own study based on [67].
Sustainability 12 07986 g0a1

References

  1. Komisja Europejska. Strategie innowacji krajowych/regionalnych na rzecz inteligentnej specjalizacji (RIS3). Polityka Spójności 2014. Available online: https://ec.europa.eu/regional_policy/sources/docgener/informat/2014/smart_specialisation_pl.pdf (accessed on 7 July 2020).
  2. Valdaliso, J.M.; Wilson, J.R. Strategies for Shaping Territorial Competitiveness; Routledge: London, UK, 2015; ISBN 978-1-317-67846-5. [Google Scholar]
  3. Kleibrink, A.; Gianelle, C.; Doussineau, M. Monitoring innovation and territorial development in Europe: Emergent strategic management. Eur. Plan. Stud. 2016, 24, 1438–1458. [Google Scholar] [CrossRef] [Green Version]
  4. Capello, R.; Kroll, H. Regional Innovation Strategies 3 (RIS3); Routledge: London, UK, 2018; ISBN 978-1-351-71809-7. [Google Scholar]
  5. Murzyn, D. Financing of smart growth in less developed regions on the example of poland. e-Finanse 2018, 14, 8–20. [Google Scholar] [CrossRef] [Green Version]
  6. McCann, P.; Ortega-Argilés, R. The early experience of smart specialization implementation in EU cohesion policy. Eur. Plan. Stud. 2016, 24, 1407–1427. [Google Scholar] [CrossRef] [Green Version]
  7. Aranguren, M.J.; Navarro, M.; Wilson, J.R. From Plan to Process: Exploring the Leadership Implications of RIS3. Available online: https://www.orkestra.deusto.es/en/research/publications/scientific-articles/orkestra-working-papers/306-plan-process-exploring-leadership-implications-ris3 (accessed on 7 July 2020).
  8. Godlewska, S. Strategie na rzecz inteligentnej specjalizacji (RIS3)–instrument realizacji polityki rozwoju vs. warunek pozyskiwania funduszy unijnych. Przegląd Eur. 2013, 4, 78–93. [Google Scholar]
  9. Territorial Patterns of Innovation and Economic Growth in European Regions-Capello-2013-Growth and Change-Wiley Online Library. Available online: https://onlinelibrary.wiley.com/doi/abs/10.1111/grow.12009 (accessed on 7 July 2020).
  10. Dziedzic, S.; Woźniak, L.; Chrzanowski, M. Inteligentna specjalizacja jako droga do zrównoważonego rozwoju. Pr. Nauk. Uniw. Ekon. Wrocławiu 2015, 267–279. [Google Scholar] [CrossRef] [Green Version]
  11. Midtkandal, I.; Periañez Forte, I.; Nauwelaers, C. RIS3 Implementation and Policy Mixes. S3 Policy Brief Ser. 2014. Available online: https://core.ac.uk/download/pdf/38628832.pdf (accessed on 8 July 2020).
  12. Lopes, J.; Ferreira, J.J.; Farinha, L. Innovation strategies for smart specialisation (RIS3): Past, present and future research. Growth Chang. 2019, 50, 38–68. [Google Scholar] [CrossRef] [Green Version]
  13. Fitjar, R.D.; Benneworth, P.; Asheim, B.T. Towards regional responsible research and innovation? Integrating RRI and RIS3 in European innovation policy. Sci. Public Policy 2019, 46, 772–783. [Google Scholar] [CrossRef] [Green Version]
  14. Marinelli, E.; Guzzo, F.; Gianelle, C. Building Smart Specialisation Strategies Monitoring Systems: Evidence from the EU. Available online: https://www.researchgate.net/publication/339385560_Building_Smart_Specialisation_Strategies_Monitoring_Systems_Evidence_from_the_EU (accessed on 7 July 2020).
  15. Angelidou, M.; Komninos, N.; Passas, I.; Psaltoglou, A.; Tsarchopoulos, P. Monitoring the impact of smart specialisation strategies across EU regions. In Proceedings of the 10th International Conference for Entrepreneurship, Innovation and Regional, Thessaloniki, Greece, 31 August–1 September 2017. [Google Scholar]
  16. RIS3 Guide-Smart Specialisation Platform. Available online: https://s3platform.jrc.ec.europa.eu/s3-guide (accessed on 7 July 2020).
  17. Gemma, S.; Bulderberga, Z. Smart specialisation strategy assessment in Baltic States. Res. Rural Dev. 2017, 2, 135–141. [Google Scholar]
  18. Gianelle, C.; Kleibrink, A. Monitoring mechanisms for smart specialisation strategies. JRC Tech. Rep. Eur. Comm. 2015, 24. [Google Scholar]
  19. Fuster Martí, E.; Marinelli, E.; Plaud, S.; Quinquilla, A.; Massucci, F. Open Data Open Science & Open Innovation for Smart Specialisation Monitoring; Publications Office of the European Union: Luxembourg, 2020. [Google Scholar]
  20. Duque Estrada Santos, R.A. Patent Output as an Evaluating Factor for RIS3 Strategies: A Case Study of North of Portugal. Available online: https://repositorio-aberto.up.pt/bitstream/10216/114212/2/278146.pdf (accessed on 7 July 2020).
  21. David, P.; Foray, D.; Hall, B. Measuring Smart Specialisation: The Concept and the Need for Indicators Entrepreneurship Innovation. Available online: https://www.scribd.com/document/80115599/Measuring-Smart-Specialisation-The-concept-and-the-need-for-indicators (accessed on 7 July 2020).
  22. Kangas, R.; Aarrevaara, T. Higher Education Institutions as Knowledge Brokers in Smart Specialisation. Sustainability 2020, 12, 3044. [Google Scholar] [CrossRef] [Green Version]
  23. Weidenfeld, A. Tourism Diversification and Its Implications for Smart Specialisation. Sustainability 2018, 10, 319. [Google Scholar] [CrossRef] [Green Version]
  24. Rodríguez-Pose, A.; di Cataldo, M.; Rainoldi, A. The role of government institutions for smart specialisation and regional development. S3 Policy Brief Ser. 2014. Available online: https://s3platform.jrc.ec.europa.eu/documents/20182/114990/JRC88935_Role_GovInstitutions_S3_RegDev.pdf/282978d5-0c4d-448a-be21-62ab16fe19a2 (accessed on 10 July 2020).
  25. Faller, F.; Steen, M.; Fyhn Ullern, E. The Role of Regions in Promoting Sustainable Energy with Smart Specialisation Strategies; Centre for Sustainable Energy Studies: Kiel, Germany, 2016; Available online: https://www.ntnu.no/documents/7414984/1273060557/The+role+of+regions+in+promoting+sustainable+energy+through+smart+specialisation+strategies_v2.pdf/8b98bd86-4ae6-445f-9ef4-ae12c6901302 (accessed on 9 July 2020).
  26. Trillo, C. Smart Specialisation Strategies as Drivers for (Smart) Sustainable Urban Development. Sustain. Urban. 2016. [Google Scholar] [CrossRef] [Green Version]
  27. Foray, D.; Goddard, J.; Goenaga Beldarrain, X.; Landabaso, M.; McCann, P.; Morgan, K.; Nauwelaers, C.; Ortega-Argilés, R. Przewodnik Strategii Badań i Innowacji na rzecz inteligentnej specjalizacji (RIS 3). 2012. Available online: http://www.innowacje.kujawsko-pomorskie.pl/wp-content/uploads/2013/04/RIS3_guide_PL_20130412.pdf (accessed on 9 July 2020).
  28. Foray, D.; Goenaga, X. The goals of Smart Specialisation; Joint Research Centre (Seville site): Ispra, Italy, 2013. [Google Scholar]
  29. Foray, D.; David, P.A.; Hall, B.H. Smart specialisation From Academic Idea to Political Instrument, the Surprising Career of a Concept and the Difficulties Involved in its Implementation. Available online: https://infoscience.epfl.ch/record/170252 (accessed on 9 July 2020).
  30. Foray, D.; Mowery, D.C.; Nelson, R.R. Public R&D and social challenges: What lessons from mission R&D programs? Res. Policy 2012, 41, 1697–1702. [Google Scholar] [CrossRef]
  31. Rodrik, D. Industrial Policy for the Twenty-First Century; Social Science Research Network: Rochester, NY, USA, 2004. [Google Scholar]
  32. Hausmann, R.; Rodrik, D. Economic development as self-discovery. J. Dev. Econ. 2003, 72, 603–633. [Google Scholar] [CrossRef] [Green Version]
  33. COM(2010) 2020 Final. Europe 2020: A Strategy for Smart, Sustainable and Inclusive Growth—European Environment Agency. Available online: https://www.eea.europa.eu/policy-documents/com-2010-2020-europe-2020 (accessed on 9 July 2020).
  34. Makkonen, T. Innovation and regional socio-economic development-evidence from the finnish local administrative units (1). Bull. Geogr. Socio Econ. Ser. 2011, 15, 27–42. [Google Scholar] [CrossRef] [Green Version]
  35. McCann, P.; Ortega-Argilés, R. Smart specialization, regional growth and applications to european union cohesion policy. Reg. Stud. 2015, 49, 1291–1302. [Google Scholar] [CrossRef]
  36. Toward an Innovative Poland: The Entrepreneurial Discovery Process and Business Needs Analysis. Available online: https://www.worldbank.org/en/country/poland/publication/entrepreneurial-discovery-process-poland (accessed on 10 July 2020).
  37. Argiles, R.O.; McCann, P.; Perianez-Forte, I.; Cervantes, M.; Larosse, J.; Sanchez, L. Innovation-driven growth in regions: The role of smart specialisation. Organ. Econ. Co Oper. Dev. 2013. Available online: https://www.oecd.org/sti/inno/smart-specialisation.pdf (accessed on 10 July 2020).
  38. Stawicki, M.; Wojnicka-Sycz, E.; Pander, W. Wyznaczanie, Monitoring i Ewaluacja Inteligentnych Specjalizacji; Maciej Stawicki: Warszawa, Poland, 2014; ISBN 978-83-930108-2-0. [Google Scholar]
  39. Rusu, M. Smart Specialization a Possible Solution to the New Global Challenges. Procedia Econ. Financ. 2013, 6, 128–136. [Google Scholar] [CrossRef] [Green Version]
  40. Europe 2020: A Strategy for Smart, Sustainable and Inclusive Growth VOCEDplus, the International Tertiary Education and Research Database. Available online: https://www.voced.edu.au/content/ngv:22040 (accessed on 10 July 2020).
  41. Statistical Office of the European Communities. Sustainable Development in the European Union: Overview of Progress Towards the SDGs in an EU Context, 2019 ed.; Statistical Office of the European Communities: Brussels, Belgium, 2019; ISBN 978-92-76-00779-1. [Google Scholar]
  42. Better Policies for Sustainable Development 2016: A New Framework for Policy Coherence en OECD. Available online: https://www.oecd.org/publications/better-policies-for-sustainable-development-2016-9789264256996-en.htm (accessed on 10 July 2020).
  43. Schot, J.; Steinmueller, W.E. Three frames for innovation policy: R&D, systems of innovation and transformative change. Res. Policy 2018, 47, 1554–1567. [Google Scholar] [CrossRef]
  44. Errichiello, L.; Micera, R. Leveraging Smart Open Innovation for Achieving Cultural Sustainability: Learning from a New City Museum Project. Sustainability 2018, 10, 1964. [Google Scholar] [CrossRef] [Green Version]
  45. Elzen, B.; Geels, F.W.; Green, K. System Innovation and the Transition to Sustainability: Theory, Evidence and Policy; Edward Elgar Publishing: Cheltenham, UK; Northampton, MA, USA, 2004; ISBN 978-1-84542-342-1. [Google Scholar]
  46. Köhler, J.; Geels, F.W.; Kern, F.; Markard, J.; Onsongo, E.; Wieczorek, A.; Alkemade, F.; Avelino, F.; Bergek, A.; Boons, F.; et al. An agenda for sustainability transitions research: State of the art and future directions. Environ. Innov. Soc. Transit. 2019, 31, 1–32. [Google Scholar] [CrossRef] [Green Version]
  47. Gifford, E.; McKelvey, M. Knowledge-Intensive Entrepreneurship and S3: Conceptualizing Strategies for Sustainability. Sustainability 2019, 11, 4824. [Google Scholar] [CrossRef] [Green Version]
  48. Smart specialisation: Networking excellence for a sound Cohesion Policy European. Parliament resolution of 14 January 2014 on smart specialisation: Networking excellence for a sound Cohesion Policy (2013/2094(INI)). Off. J. Eur. Union 2016, 482, 2–8. [Google Scholar]
  49. PART I-Interactive RIS3 Guide-Smart Specialisation Platform. Available online: https://s3platform.jrc.ec.europa.eu/interactive-ris3-guide/-/wiki/Main/PART+I (accessed on 16 July 2020).
  50. Grillitsch, M.; Asheim, B. Place-based innovation policy for industrial diversification in regions. Eur. Plan. Stud. 2018, 26, 1638–1662. [Google Scholar] [CrossRef]
  51. Jucevičius, R.; Juknevičienė, V.; Mikolaitytė, J.; Šaparnienė, D. Assessing the regional innovation system’s absorptive capacity: The approach of a smart region in a small country. Systems 2017, 5, 27. [Google Scholar] [CrossRef] [Green Version]
  52. Benner, M. From Clusters to smart specialization: Tourism in institution-sensitive regional development policies. Economies 2017, 5, 26. [Google Scholar] [CrossRef] [Green Version]
  53. Implementation-Smart Specialisation Platform. Available online: https://s3platform.jrc.ec.europa.eu/s3-implementation (accessed on 16 July 2020).
  54. Asheim, B.; Grillitsch, M.; Trippl, M. Smart specialization as an innovation-driven strategy for economic diversification: Examples from scandinavian regions. In Advances in the Theory and Practice of Smart Specialization; Elsevier: Amsterdam, The Netherlands, 2017; pp. 73–97. ISBN 978-0-12-804137-6. [Google Scholar]
  55. Lundquist, K.-J.; Trippl, M. Distance, Proximity and types of cross-border innovation systems: A conceptual analysis. Reg. Stud. 2013, 47, 450–460. [Google Scholar] [CrossRef] [Green Version]
  56. S3 Beyond EU-Smart Specialisation Platform. Available online: https://s3platform.jrc.ec.europa.eu/s3-beyond-eu (accessed on 20 July 2020).
  57. Dziemianowicz, W.; Szlachta, J.; Peszat, K. Potencjały Rozwoju i Specjalizacje Polskich Województw; Ministerstwo Infrastruktury i Rozwoju: Warsaw, Poland, 2014. [Google Scholar]
  58. Dziallas, M.; Blind, K. Innovation indicators throughout the innovation process: An extensive literature analysis. Technovation 2019, 80–81, 3–29. [Google Scholar] [CrossRef]
  59. Becheikh, N.; Landry, R.; Amara, N. Lessons from innovation empirical studies in the manufacturing sector: A systematic review of the literature from 1993–2003. Technovation 2006, 26, 644–664. [Google Scholar] [CrossRef]
  60. Fabrowska, P.; Mackiewicz, M.; Skrobol, M.; Śliwka, A. Wpływ Dofinansowania prac B+R na Poziom Wdrażania ich Wyników w MŚP-PARP-Centrum Rozwoju MŚP. Available online: https://www.parp.gov.pl/component/publications/publication/wplyw-dofinansowania-prac-br-na-poziom-wdrazania-ich-wynikow-w-msp (accessed on 9 July 2020).
  61. Dewangan, V.; Godse, M. Towards a holistic enterprise innovation performance measurement system. Technovation 2014, 34, 536–545. [Google Scholar] [CrossRef]
  62. De Felice, F.; Petrillo, A. Key Success factors for organizational innovation in the fashion industry. Int. J. Eng. Bus. Manag. 2013, 5, 5–27. [Google Scholar] [CrossRef]
  63. Polityka innowacyjności | Noty tematyczne o Unii Europejskiej Parlament Europejski. Available online: https://www.europarl.europa.eu/factsheets/pl/sheet/67/polityka-innowacyjnosci (accessed on 9 July 2020).
  64. Hollanders, H.; Es-Sadki, N.; Merkelbach, I. Regional Innovation Scoreboard 2019. Methodology Report. 2019. Available online: https://ec.europa.eu/docsroom/documents/37783 (accessed on 1 July 2020).
  65. OECD. OECD Science, technology and industry scoreboard 2017: The digital transformation. In OECD Science, Technology and Industry Scoreboard; OECD: Paris, France, 2017; ISBN 978-92-64-26880-7. [Google Scholar]
  66. Kubiczek, A. Jak mierzyć dziś rozwój społeczno-gospodarczy krajów? Nierówności Społeczne Wzrost Gospodarczy 2014, 38, 40–56. [Google Scholar]
  67. GUS. Wskaźniki zrównoważonego rozwoju Polski; Urząd Statystyczny w Katowicach: Katowice, Poland, 2015. Available online: https://stat.gov.pl/obszary-tematyczne/inne-opracowania/inne-opracowania-zbiorcze/wskazniki-zrownowazonego-rozwoju-polski-2015,5,2.html (accessed on 2 July 2020).
  68. Makieła, Z.J. Znaczenie innowacyjności w gospodarce regionów. Przedsiębiorczość Eduk. Rola Przedsiębiorczości Rozw. społeczno Gospod. 2018, 14, 40–48. [Google Scholar] [CrossRef]
  69. Śpionek, A. Innowacyjność-definicja, ogólne informacje o innowacyjności w regionie. In Urząd Marszałkowski w Łodzi, Departament Infrastruktury. Wydział ds; Społeczeństwa Informacyjnego: Łódź, Poland, 2010. [Google Scholar]
  70. Walesiak, M. Zagadnienie oceny podobieństwa zbioru obiektów w czasie w syntetycznych badaniach porównawczych. Przegląd Stat. 1993, 1, 95–102. [Google Scholar]
  71. Hartigan, J.A. Clustering Algorithms; Wiley: New York, NY, USA, 1975. [Google Scholar]
  72. Everit, B.S.; Landau, S.; Lees, M.; Stahl, D. Cluster Analysis, 5th ed.; Jahn Wiley&Sons: London, UK, 2011. [Google Scholar]
  73. Bank Danych Lokalnych. Available online: https://bdl.stat.gov.pl/BDL/start (accessed on 18 February 2020).
  74. Grabiński, T. Metody taksonometrii; Wydawnictwo Akademii Ekonomicznej w Krakowie: Kraków, Poland, 1992. [Google Scholar]
  75. Sokołowski, A. Wybrane zagadnienia pomiaru i ważenia cech w taksonomii. Zesz. Nauk. Akad. Ekon. Krakowie 1985, 43, 41–53. [Google Scholar]
  76. Klóska, R.; Ociepa-Kicińska, E.; Czyżycki, R.; Szklarz, P. Regional development in poland in taxonomic terms. Sustainability 2020, 12, 4780. [Google Scholar] [CrossRef]
  77. Ziemiańczyk, U. Ocena poziomu rozwoju społeczno-gospodarczego gmin wiejskich i miejsko-wiejskich w województwie małopolskim. Infrastrukt. Ekol. Teren. Wiej. 2010, 14, 31–40. [Google Scholar]
  78. Pieńkowski, J.; Berkowitz, P. Econometric assessments of Cohesion Policy growth effects: How to make them more relevant for policy makers? Eur. Com. Work. Pap. 2015. Working paper 02/2015. [Google Scholar]
  79. Misiąg, J.; Misiąg, W.; Tomalak, M. Wyższa Szkoła Informatyki i Zarządzania (Rzeszów). In Ocena Efektywności Wykorzystania Pomocy Finansowej Unii Europejskiej Jako Instrumentu Polityki Spójności Społeczno-Gospodarczej Oraz Poprawy Warunków Życia; Wyższa Szkoła Informatyki i Zarządzania: Rzeszów, Poland, 2013; ISBN 978-83-937166-3-0. [Google Scholar]
  80. Dziechciarz, J. Ekonometria. metody, przykłady, zadania. In Wydawnictwo Akademii Ekonomicznej IM; Oskara Langego we Wrocławiu: Wrocław, Poland, 2003. [Google Scholar]
  81. Witkowska, D. Podstawy Ekonometrii i Teorii Prognozowania. Podręcznik z Przykładami i Zadaniami; Oficyna ekonomiczn: Kraków, Poland, 2005. [Google Scholar]
  82. Capello, R.; Dentinho, T.P. Globalization Trends and Regional Development: Dynamics of FDI and Human Capital Flows; Edward Elgar Publishing: Cheltenham, UK; Northampton, MA, USA, 2012; ISBN 978-1-78100-304-6. [Google Scholar]
  83. Pawlewicz, K.; Pawlewicz, A. Interregional Diversity of Social Capital in the Context of Sustainable Development—A Case Study of Polish Voivodeships. Sustainability 2020, 12, 5583. [Google Scholar] [CrossRef]
  84. Standar, A.; Kozera, A. The role of local finance in overcoming socioeconomic inequalities in polish rural areas. Sustainability 2019, 11, 5848. [Google Scholar] [CrossRef] [Green Version]
  85. Rokicki, T. Zróżnicowanie rozwoju społeczno-gospodarczego województw w Polsce. Econ. Reg. Stud. 2018, 9, 39–52. [Google Scholar]
Figure 1. The relationship between innovativeness, smart growth and sustainable growth of regions. Source: own work.
Sustainability 12 07986 g001
Figure 2. The value of the synthetic measure of regional innovation development in the years 2009, 2014, 2019, and the regions in Poland. Source: own work.
Sustainability 12 07986 g002
Table 1. Features describing innovativeness of regions in Poland.
CategoryFeatureLTB/STB *
social capitalpopulation density in built-up and urbanised area (persons/km2)LTB
share of post-working age population in total populationSTB
occupational activity coefficient LTB
graduates of tertiary education institutions per 10,000 populationLTB
PhD studentsLTB
level of entrepreneurshipnumber of national businesses per 10,000 of the working age populationLTB
sphere of technologypatents granted by the Polish Patent Office—per 100,000 inhabitantsLTB
innovation activity, R&Dindustrial innovative enterprises (%)LTB
expenditure on innovative activities in enterprises in relation to GDPLTB
expenditure on innovation activities in enterprises per person in paid employmentLTB
share of persons employed in R&D in the economically active populationLTB
internal expenditure on R&D in relation to GDPLTB
economic developmentGDP dynamics per capitaLTB
investment outlays per inhabitantLTB
production and consumption patternspercentage of certified ecological farms in total cultivated landLTB
total PM emissions per km2STB
electric power consumption per inhabitantLTB
Source: own work. * LTB—Larger-the-better, STB—Smaller-the-better.
Table 2. Values of Pearson coefficient of correlation between GDP per capita and synthetic measure of regional innovation development (SMRID) in the years 2009, 2014, 2019.
Year200920142019
Pearson correlation coefficient0.670.710.70
Source: own work.

