Abstract
Gasification under steam excess of the residual from mechanical treatment of municipal solid waste (RMT-MSW, refuse derived fuel (RDF)-type) was investigated in a laboratory batch reactor, equipped with a section for high-temperature gas equilibration. Experiments were performed with recirculation of the condensate and residual tars/oils, for closing of the process loop. Gas emissions were registered at 300–500 °C (pyrolysis; maximum at 390 °C) and 650–800 °C (gasification; maximum at 740 °C). Peak areas, equivalent to the gas volume, were in a general proportion of 55:45. Mass of tars and oils collected together with condensing steam was only equal to 0.15% of the average weight loss of the RMT-MSW. Ninety-seven percent of organic compounds, mainly naphthalene, phenanthrene and derivatives, was separable by a simple filtration. Concentration of metals in aqueous condensate was equal to 135 mg/dm3, 98.5% by mass was potassium and sodium ions. Concentration of NH4+ was equal to 2.49 g/dm3 (mostly carbonate). According to the thermodynamic evaluation, volume of the process gas was equal to 2.11 m3 (dry, 25 °C, 1 bar) per 1 kg of the dry waste. Standard enthalpy of the gas combustion was 24.6 MJ/kg of the dry waste; approximately 16% of this energy was due to endothermicity of the process.
1. Introduction
Considering gasification, a variety of processes may be applied for municipal solid waste (MSW) treatment; they are usually classified in view of the gasifying agent, reactor design, heat supply, pressure, temperature and form of solid residue [1]. However, majority of gasification-based plants, e.g., listed in [2], use air, not steam, as a gasifying agent, presumably due to negative energy balance of the process and specific technical problems of the such units. On the other hand, there were reported pilot, demonstration or industrial pyrolysis plants using indirect heating, some of them combining pyrolysis, gasification and melting operations [3]. Combination of two processes, i.e., thermolysis (pyrolysis) and steam gasification, was suggested in 1998 as a method of upgrading of the waste-derived solid fuel [4]. Based on laboratory experiments, authors of the paper demonstrated that the process enables trapping of some heavy metals by admixture of the kaolinite to gasified material and recovery of the gas composed mainly of H2 (more than 50 vol.%) and carbon oxides CO/CO2. At the same time, there was a paper published presenting in detail the possible development of RDF (refuse derived fuel) gasification with the O2/steam mixture in the circulating bed gasifier, developed up to the industrial scale [5]. However, some years later, in 2004, T. Malkow wrote in an extensive paper [6] that “pyrolysis and gasification stand-alone applications … are in Europe still in a premature stage and expected not to play a major role in the near future” (T. Malkow presented in the same paper a large diversity of these technologies—investigated, tested or in use). A classical approach to the steam gasification of MSW has been presented in a set of papers of Chinese authors that were started in 2009. The series was opened with discussion of results of gasifying experiments performed in the laboratory-scale in the two-stage fixed bed reactor with samples of original MSW and natural dolomite as catalyst for cracking of tars [7,8]. Similar experiments were also performed in modified reactors for the evaluation of the catalyst, temperature, steam-to-MSW ratio and space velocity effect on the produced gas volume and composition [9,10,11,12,13]. Moreover, there are also papers comparing gasification of MSW with gasification of tires, poplar, RDF [14] or rubber, plastic and wood waste [15]. It seems that interest in steam gasification of MSW gradually increases now, and there are new papers being presented with a more general insight into the process, e.g., into a route for energy recovery [16], analysis of the process performance [17] or exergy [18]. This last one was based on the results of experiments in a semi-industrial fluidized bed gasifier, or conversion of MSW to SNG (Synthetic Natural Gas) [19]. Generally, researchers’ attention was paid especially (but not only) to the gas quality, e.g., the syngas for methanol synthesis [2] or concentration of hydrogen [9,10,12,20,21,22]. It should be noted that thermodynamic modeling and simulation plays an important role in the analysis and technological assessments of gasification processing of waste, as was presented in papers on the syngas production from MSW in a bubbling fluidized bed [23], on the mathematical modeling of the MSW gasifier [24], in the CFD model (Computational Fluid Dynamics) of syngas production in a semi-industrial MSW gasification facility [25] and related CFD modeling of hydrogen production from MSW in comparison to biomass [26]. Usefulness of different forms of gasification for agro-waste should also be mentioned [27,28,29,30].
The Aim of the Investigation—Replacement of Incineration by Steam Gasification
Incineration, including MSW incineration, is a widely used process used for transformation, with energy recovery, of waste into mineralized material (ash). The process is performed in a reactor of a relatively small volume (on grates, in fluidized beds); however, it is followed by a complex sequence of physical and chemical treatments before emission of the flue gas to the atmosphere. Incineration requires the use of a large volume of air, which is transformed into an equivalent stream of flue gases. Chemical energy of the waste is converted to heat, but the gaseous stream is a “trade-mark” of incineration and determines the facility layout. The use of steam in excess definitely changes the process. Now the steam is the oxidation reagent for hydrocarbons from the pyrolytic step of the waste transformation, as well as for the carbonaceous residue from the pyrolysis itself. The gaseous stream at high temperature is a mixture of non-reacted steam and other reaction gases (mainly of hydrogen and carbon oxide). Condensation of steam during cooling is an efficient way of gas cleaning, from both inorganic contaminants as well as non-converted tars and oils. The condensate with contaminants should be returned to the reactor, closing the loop of reagents. As a consequence, allothermal steam gasification of the wastes enables elimination of the direct use of atmospheric oxygen (air) in the incineration/mineralization processes. We have demonstrated it in our earlier papers on the processing of electronic wastes [31,32,33].
We believe that the replacement of incineration by steam gasification transforms this traditional method of waste elimination in the “atmospheric open” flow reactor into a more advanced process of chemical refining of the waste to mineral/metal solid residue and producer gas (syngas). In the course of the experiments presented below, we gasified the residual from mechanical treatment of the municipal solid waste (RMT-MSW), which is an equivalent of the RDF-type material. We present the temperature dependence of the gas evolution intensity, quality of the recirculated condensate and thermodynamic assessment of the process enthalpy. However, in order to gain a more comprehensive picture of the waste transformation, it is necessary to take into account the properties of ashes (the solid residue) from gasification. We tried to present them in a separate paper [34] by giving details of acidic leachability of metals and comparing it with leachability from the ash prepared by incineration with oxygen. Furthermore, we recently discussed thermochemical cycles for some wastes, demonstrating equivalency of the initial and final states of both incineration and steam gasification [35].
2. Materials and Methods
2.1. Residual from Mechanical Treatment of Municipal Solid Waste (RMT-MSW)
Investigated material of the RDF-type (RMT-MSW) was supplied by the local company owned by the group of small municipalities (Lower Silesia, Poland) operating the landfill and waste treatment facility. Mixed MSW as well as the waste collected selectively, delivered to the company by communities, are processed by sieving with rotary drum, separation of ferrous and nonferrous metals, optical/pneumatic separation and manual sorting. Recovered recyclables (metals, glass, plastics, multilayer packaging, carton and paper as well as RDF) are sold accordingly to demand. Processing of the mixed waste generates up to 30 wt.% of so-called ballast fraction 60–340 mm, classified by a code 19 12 12 (other wastes (including mixtures of materials) from mechanical treatment of wastes other than those mentioned in 19 12 11 in the EC Waste Catalogue [36]. The company determined composition of this waste (by manual sorting and weighting) and found the following content: carton + paper—24 wt.%, food + garden—12%, plastics—15%, textiles—7%, multilayer—7%, inert—4%, wood—2%, metals—1%, other (not classified)—6% and below 20 mm (not classified)—22%. The lower heating value (LHV) was found equal to 5.2 MJ/kg (Polish Standard: PN-EN 15400:2011), at the moisture content of 41.2% (Polish Standard: PN-EN 15934:2013-02).
For the purpose of our laboratory experiments, the company cleaned the “ballast fraction” from large pieces of bricks, concrete and stones, and shredded to below 3 cm. Portions of the supplied batch were immediately dried in the laboratory at 105 °C for 24 h to stop the biodegradation process. Typical weight losses during drying were between 39–44 wt.%. Thermal processing of the fraction may be an alternative utilization way, for example as typical RDF [37,38], in view of the waste hierarchy implemented by the EU Directive on waste [39]. Taking into account discussion on MSW characteristics in [40,41], investigated fraction is defined here as the residual from mechanical municipal waste treatment (RMT-MSW).
2.2. Reactor
Experiments of gasification were performed in the reactor presented in Figure 1. The reactor was a simple quartz tube of 125 cm length with an inner diameter of 31 mm and wall thickness of 2 mm. The reactor was placed in a set of four autonomous tube furnaces, establishing four sections for: (a) equilibration of gases, (b + b) gasifying and (c) generation of steam. Each experiment had been started by placing a sample of approximately 50 g of RMT-MSW in sections (b + b) and ceramic granules in section (a). Ceramic granules for enhancing gas equilibration were prepared from local clay doped by magnesium oxide [27] in experiments 3–5, or non-doped local clay in experiment 1 and dolomite granulated to 5–8 mm in the experiment 2. The dependence of the catalytic properties of granules on their composition were not investigated in the experiments, because the whole condensate as well as not-converted tars and oils were recirculated to the reactor (however, we are aware that it should be performed in the independent research). Only the condensate from the final experiment (not recirculated) was investigated for the content of organic compounds in order to illustrate the efficiency of the gas equilibration.
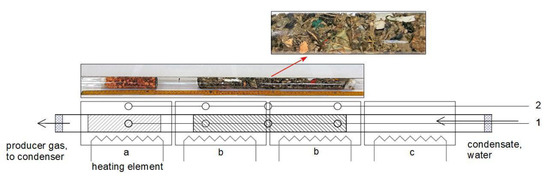
Figure 1.
The quartz reactor used in gasification experiments: a—section for catalytic granules, b—two sections for gasified RMT-MSW, c—section of the steam generation. Position of thermocouples: 1—the 1st experiment and 2—other experiments. Above the drawing—the photograph of the completed reactor and enlarged fragment with RMT-MSW.
The loaded reactor was placed in furnaces and sealed with temperature-resistant siloxane layers (SOUDAL Ltd., Cząstków Mazowiecki, Poland) on both sides. During sealing, inserted in the siloxane layers were the quartz capillary for water/condensate supply (on the right side in Figure 1) and the quartz tube with a joint to the Liebig condenser, as the gases outlet (on the left side in Figure 1). Furnaces were powered by electronic controllers RE31 or RE15 with SSR (solid-state relay) units (LUMEL S.A., Zielona Góra, Poland), and were equipped with K-type thermocouples. The thermocouples were placed as presented in Figure 1: position 1—for the first experiment, and 2—for the other experiments. Temperatures were registered by recorder AR 206/8 (Apar, Raszyn, Poland). Water/condensate for the steam generation was fed by a peristaltic pump (201.SMA.150.050, Williamson Manufacturing Company Ltd., Southwick, West Sussex, UK) at the rate of 1.8 g/min. The gas leaving the reactor was immediately cooled down in the Liebig condenser. Excess of steam and non-converted tars and oils were condensed and collected in the glass receiver. The gas was washed by bubbling in 50 cm3 of 0.1 M NaOH, then moved through the glass pressure buffer of 1 dm3, flowmeter TSI 41211A (TSI Inc., Shoreview, MN, USA), and finally was combusted in a micro-flare. Data from the flowmeter were also registered by the AR 206/8 recorder.
2.3. Gasification Procedure
Experiments of gasification were performed according to the following procedure: (1) gasified material and granules of catalyst were placed in the quartz reactor; (2) reactor was placed in furnaces and sealed, then other elements of the experimental arrangement were completed; (3) reactor was heated overnight at temperature of 60–80 °C, then (4) the section with catalyst and the section for steam generation were heated up to 850 °C at the rate of 20 °C/min; (5) as soon as temperature of the section with catalyst exceeded 700 °C, heating of the sections containing gasified material was started and proceeding up to 850 °C at the heating rate of 3 °C/min; (6) peristaltic pump was turned on when the temperature of edges of gasified material (heated also by radiation from adjacent sections) exceeded 120 °C; (7) once the temperature of all furnaces reached 850 °C, heating of the reactor was continued for two hours, then (8) the furnaces were cooled, initially at a rate of 20 °C/min then according to thermal inertia, to slightly below 100 °C; (9) steam generation was stopped once the temperature of furnaces dropped to 700–750 °C; finally, (10) a slightly hot reactor was removed from furnaces, opened and carefully emptied.
Because condensation of the steam excess efficiently cleaned the gas from non-volatile components (collected together with aqueous condensate), the water was used for steam generation only in the first experiment. Starting from the second experiment, organic sediments were separated from the aqueous condensate by filtration, and the cellulose filter with the small amount of organic residue was placed in the reactor with the next portion of RMT-MSW. The filtrate was used for steam generation in the same experiment. Due to such recirculation, only RMT-MSW was in the input, whereas two products, the gas and the ash, were received at the output.
2.4. Analytical Methods
2.4.1. Gas Chromatography—Mass Spectrometry (GC-MS)
GC-MS analysis was performed for: (a) filtered condensate from the final experiment, (b) sediments from filtration of condensate, (c) sediments removed mechanically with small pieces of cotton wool from the Liebig condenser and (d) solution from the alkaline scrubber. Aqueous solutions as well as sediments were extracted with diethyl ether. A HP6890 gas chromatograph (Hewlett Packard, USA) with HP5973 mass detector was used for analysis. Chromatography parameters were the following: capillary column DB1701 (30 m × 0.25 mm × 0.25 μm), sample volume 1 μL, initial temperature 40 °C (4 min), heating rate 10 °C/min., final temperature 260 °C (16 min), carrier gas—helium (99.999%) at 0.7 mL/min, ionization energy 70 eV and mass range m/z 15–350. Identification of compounds was performed with the NIST electronic library. External calibrations with solutions of the commercial PAHs standards (grade: analytical standards, supplied by Sigma-Aldrich): Acenaphthene, Acenaphthylene, Anthracene, Benz[a]anthracene, Benzo[a]pyrene, Benzo[k]fluoranthene, Chrysene, Fluoranthene, Fluorene, Naphthalene, Phenanthrene, Pyrene (0–40 mg of compound/100 mL of solvent) were performed in triplicate (average values were used for the calibration curve determination).
2.4.2. Inductively Coupled Plasma Optical Emission Spectrometry (ICP-OES)
ICP-OES analysis was performed for filtered condensate from the final experiment, after extraction with the diethyl ether. It was also performed for deposits removed from the inner wall of the reactor, close to the high-temperature section on the gas outlet side. The deposit was digested in aqua regia with the DigiPREP Jr digestion block (SCP SCIENCE, Quebec, QC, Canada), at a solid-to-liquid ratio of 1:30 (g:cm3), at 120 °C, for 6 h, to near-dryness state. After cooling, the suspension was diluted with distilled water and filtered. An Agilent (Santa Clara, CA, USA) benchtop optical emission spectrometer with an axially viewed Ar-ICP (model 720) was used to determine concentrations of elements. A Merck Certipur multi-elemental stock (1000 μg mL−1) ICP standard solution IV was used to prepare solutions for calibration of the ICP-OES instrument. In the case of As, Hg, Sb, Se, Mo, Ti, V and Sn, standard solution was prepared from the respective, single element solution (Merck Certipur).
2.4.3. Analysis of Cl− and NH4+
The Mohr method was used for the determination of Cl− content in filtered condensate from the final experiment, after extraction with the diethyl ether, as well as in alkaline solution from the scrubber. Before titration, samples were neutralized with 2M NaOH or 2M HNO3, and 0.2 cm3 of 10 wt.% K2CrO4 was added as an indicator. Each sample was titrated twice with a standard solution of AgNO3 (0.01282 M). To determine ammonium concentration in the condensate, the Kjeldahl method was used, without mineralization of the sample (due to very low concentration of organic compounds). Determination was performed with the automatic steam distilling unit UDK 130 A (Velp Scientifica, Inc., Bohemia, NY, USA), absorption in 0.1 M HCl and titration with 0.1 M NaOH, using the methyl red as an indicator.
3. Results and Discussion
3.1. Intensity of the Gas Emission
The waste, supplied by the local company, although prepared for laboratory use, was not homogenized enough to ensure good repeatability of experiments. Therefore, a series of five experiments of gasification (G1–G5) with similar masses of the waste were carried out in order to compensate, to some extent, the differences between the waste batches. Two-peaks curves of the gas emission, with a very characteristic dependence on temperature, were typical for all experiments—they are presented in Figure 2. Open circles in Figure 2 represent immediate data of the gas flow, registered every 30 s. Because the flowmeter was not calibrated on the process gas and there was a baseline drift during experiments, the voltage signal of the flowmeter was normalized to the expected baseline and expressed in arbitrary units (expected volume of the gas may be evaluated separately and is given below). The data for the G1 part of the figure was collected during experiment with thermocouples placed in position 1, while the data for G2–G5 graphs were registered with thermocouples placed in position 2 (cf. Figure 1). The later configuration enabled more uniform compacting of the waste in the reactor tube and was accepted as a better arrangement for gasification experiments.
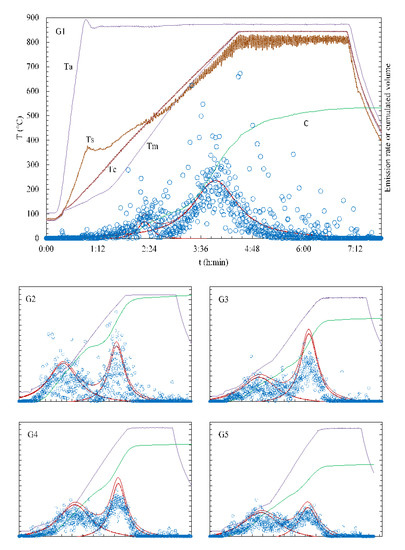
Figure 2.
Temperatures in the quartz reactor during gasification experiments and respective gas emission profiles. Left scale: Ta—temperature of the equilibration section; Tm, Tc, Ts—temperatures of the middle as well as “catalytic” and “steam” sides of the gasified RMT-MSW (residual from mechanical treatment of municipal solid waste) bed, respectively. Unmarked (relative, details in the Section 3.1) right scale: C—cumulated volume of the gas; dashed and solid red lines—intensity of the gas emission; circles—immediate intensity. G1—experiment with thermocouples placed in position 1 (Figure 1), other experiments—thermocouples in position 2. The scale of figures G2—G5 is identical with figure G1 (however Ta, Tc and Ts are not presented).
After each experiment started, the section with ceramic granules and the section for steam generation were heated much faster than the ones with gasified RMT-MSW material, so the temperature gradient in the bed of the gasified waste was created along the reactor tube. This gradient may be observed by comparison of Ts (temperature of the “steam” side of the RMT-MSW bed), Tc (temperature of the “catalytic” side of the RMT-MSW bed) and Tm (temperature of the middle of the RMT-MSW bed) in Figure 2/G1. However, with the temperature increase, this gradient systematically decreased and became negligible from approximately 500 °C. Very characteristic was oscillation of the Ts curve; this was a result of a nonuniform generation of steam in the c section of the reactor (fluctuations of the pressure in the reactor and scrubber).
Experimental data presented in Figure 2 were approximated by the Lorenz curves, and optimized with the Levenberg-Marquardt optimization algorithm [42]. This enabled separation of experimental points into two peaks, presented in figures G1–G5 by dotted lines. Solid red lines above these peaks are the sum of these emissions. The additional solid line, marked by C, represents a cumulative emission. The peaks in Figure 2 may be characterized by the temperature of the peak maximum and the peak area. Temperature of the peak’s maximum is a convenient parameter for characterizing dependence of the gas emission intensity on temperature. The second parameter, peak’s area, should be related to the amount of gasified waste fraction and its composition. Specificity of experiments, i.e., temperature gradient and positioning of thermocouples (positions 1 and 2, Figure 1), caused respective variations of measured temperatures, formally collected in Table 1. The most meaningful are temperatures Tm registered during experiment G1 (with thermocouples in position 1). It may be noticed that the average temperature of peak 1 (the “low temperature” peak) for experiments G2–G5 is only 246 ± 12 °C in comparison with 391 °C from experiment G1. Contrary to this, the average temperature of peak 2 (the “high temperature” peak) for experiments G2–G5 is 736 ± 23 °C and is very close to 741 °C from experiment G1. Therefore, analyzing the intensity of gas emission, temperatures of 390 °C for the first peak and 740 °C for the second peak should be considered as the representative ones.

Table 1.
Temperatures of maxima of gas emission peaks during steam gasification of RMT-MSW. Ts, Tm, Tc—as in Figure 2.
During the experiments, only instantaneous relative intensity of the process gas emission (after condensation of the steam excess) had been measured/calculated. However, theoretical total gas volume may be evaluated assuming thermodynamic equilibrium, as discussed later in Section 3.2. According to these calculations, normalized volume of 2.11 dm3 of the dry gas (p = 1 bar, T = 25 °C) was generated per 1 g of the waste. This enables calculation of the expected gas volume per arbitrary unit (AR) for each experiment—the respective values are given in the last row of Table 2. Taking this into account, it would be possible to use defined units (e.g., cm3/s and dm3) for emission rate and cumulated volume in Figure 2. However, it is equivalent to assume that all the samples had exactly the same composition. We would like to avoid such simplification.
Table 2.
Percentage of the process gas emission correlated with peaks in Figure 2, and the gas volume per unit of the peak area (on the basis of expected volume of the gas emission—Section 3.2).
It may be noticed from Figure 2 that experiments G1–G5, even if generally similar, differed in some details. First, there was relatively low emission in experiment G1 at lower temperatures (peak 1), which represented 8% of the sum of the both peaks (1 + 2) area (Table 2). In the case of other experiments (G2–G5), the average area was equal to 55% for the first peak, with standard deviation of 6%. Second, analyzing calculated standard gas volume per arbitrary unit, this volume was clearly higher for experiment G5 (61.8 dm3/AR), whereas the average for other experiments (G1–G4) was equal to 46.0 dm3/AR (with a standard deviation of 3.6 dm3/AR). Both of these differences seem to be a result of lower content of substances that underwent pyrolysis with high emission of gas in experiment G1 (e.g., the lack of plastics) and somewhat higher content of inert inorganic matter in experiment G5 (e.g., fine grit or scrap).
The results discussed above, i.e., intensity of the gas emission and temperatures of peaks, may be compared with results of thermogravimetric analysis (TG) of decomposition of some MSW components under the steam [43]. According to TG curves, decomposition of the lignin, printing paper, cotton and cabbage proceeds in two stages (this is not observed for rubber and PVC). For obvious reasons, authors described the first stage as pyrolysis and the second as gasification. They found that temperatures of the weight loss maxima for the pyrolysis stage were between 261 °C (PVC) and 356 °C (rubber), whereas the respective temperatures for the gasification stage were between 721 °C (lignin) and 795 °C (cabbage). Results of a similar investigation, gasification of MSW under CO2 (or a mixture of CO2 with N2), were presented in another paper [44]. For experiments performed at different heating rates, very similar curves were registered, with 45% of the weight loss between 300 and 400 °C for the first peak (maximum at 350 °C) and 10% of the weight loss between 800 and 900 °C for the second one (maximum at approximately 890 °C). An interesting comparison of DTG curves of pyrolysis and gasification of poplar wood under CO2 was presented in the paper [45]. In general, there were two peaks in both types of thermograms—the first one with maximum at exactly the same temperature of 345 °C for pyrolysis and gasification, and the second with maximum at 701 °C for pyrolysis and 830 °C for gasification. Moreover, the second peak for gasification was evidently stronger than for pyrolysis. There is also more data on pyrolysis and gasification under CO2 of different components of municipal solid wastes [46,47,48], which reveal that, below 600 °C, CO2 behaves as an inert gas, while above this temperature, it becomes a reagent. Considering these remarks, the results in Figure 2 may be summarized as follows. (1) In the range of 300–500 °C, organic substances (e.g., plastics, bio-waste) undergo thermal degradation to carbonaceous residue, with emission of pyrolytic gas. The solid residue of this process is therefore a mixture of carbonaceous phase plus mineral and metallic particles. This process is not dependent on the reactor atmosphere, and may be described as a pyrolytic stage. (2) Volatile products from pyrolysis are mixed with steam and equilibrated in the section a of the reactor. (3) In the range of 650–800 °C, the carbonaceous residue reacts with steam and volatilizes, giving the second peak of the gas emission. This is a gasification stage. Pyrolytic and gasification stages are separated by a 200–300 °C gap.
3.2. Thermodynamic Assessment
Weight losses during experiments may be in the first place ascribed to elimination of organic substances from the waste. Due to a relatively small quantity of tars/oils in the condensate, almost complete equilibration of the process gas in the a section of the reactor may be assumed. This enables calculation of the gas composition and the gas volume at thermodynamic equilibrium. Calculations were performed with HSC software (Outotec, Pori, Finland) [49], assuming that elemental composition of the waste was identical with the waste stream given by [50], which, in our opinion is representative for the RMT-MSW. This assumption allows us to calculate the stoichiometry of the organic fraction as C468H748O161N16S (dry basis, ash free). It was also assumed that the following species formed the gaseous phase: H2, CO, CO2, CH4, C2H4, C2H6 (similarly to assumption of [8]), and N2, NH3, S2, H2S, SO2, O2, H2O. The elemental carbon (graphite) was in the solid phase. Calculations were performed for the temperature of 850 °C (temperature of the section a as well as final temperature of the gasified waste) and molar proportions of steam to carbon (S/C) increasing up to 20 (the ratio of the total steam used in the process to total organic carbon in the waste). Results of modeling are presented in Figure 3 (solid lines). According to the calculations, elemental carbon should vanish at the S/C ratio equal to 0.69.
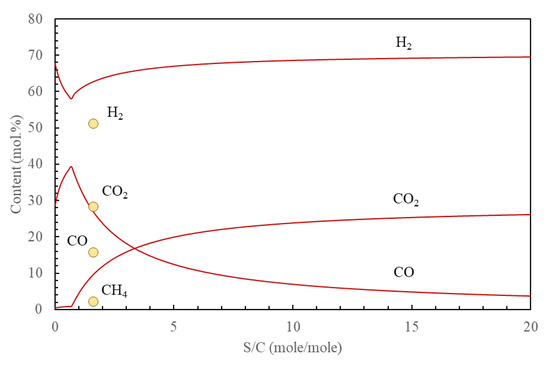
Figure 3.
Composition of the process gas according to thermodynamic equilibrium at 850 °C. S/C—the ratio of moles of steam to moles of carbon. Solid lines—calculated concentration of the main components (H2, CO2, CO). Circles—literature data [8] for the same components plus CH4.
The results of calculations given in Figure 3 represent a “static” variant of equilibrium model, i.e., equilibrium of the total batch of the waste with the increasing volume of steam. In the course of each experiment, the equilibrium was rather “dynamic,” i.e., alternating stream of gases from pyrolysis then from the gasification stage was mixed with steam of a relatively stable flow. As a result, the unified gas composition (in the total volume from the whole process) may be somewhat different from calculated by this “static” variant. A similar experiment of the municipal waste gasification under steam in a fixed-bed reactor with additional equilibration of gases in a separate unit was described in the literature [8]. The differences between this experiment and that presented here are that (1) the waste was fed into the reactor at high temperature in the experiment of [8], contrary to gradual heating to the final temperature in our experiments, (2) conversion of char was relatively low in the experiment of [8], equal to 70.5% at 850 °C, contrary to the complete elimination of char and vanishing of the gas emission in our experiments. These differences, especially incomplete conversion of char, seem to be responsible for somewhat lower concentration of H2 in the experiment of [8] in comparison to calculated now, as well as inversion of CO and CO2 concentrations (i.e., calculated now and found by [8]).
Obviously, concentration of H2, CO and CO2 in the gas depends on S/C, steam-to-carbon ratio—Figure 3 (assuming chemical equilibrium). It may be noticed that at the point of carbon vanishing, there is a minimum hydrogen concentration (at S/C = 0.69). The respective concentrations of gases are following: 57.9 vol.% of H2, 39.4% of CO, 1.0% of CH4, 0.9% of CO, 0.7% of N2, 0.09% of H2S and traces of other species. The standardized (at 25 °C and 1 bar) volume of the dry gas is equal to 2.11 m3/kg of the dry waste. The water demand necessary for this equilibrium equals 0.44 kg/kg of the dry waste (95% of steam is reacted, the rest is in equilibrium at 850 °C). It is worth noticing that this amount represents only 61% of the water content in the original RMT-MSW (before drying).
Taking into account the final equilibrium state of the process products, incineration and steam gasification are equivalent processes from the point of view of thermodynamics. This equivalency may be presented in the simplest way by the thermodynamic cycle (Figure 4), assuming stoichiometry of the waste (ash free) as CaHbOcNdS. Reaction of oxidation by oxygen (incineration) is written as (1) in Figure 4, with the respective enthalpy ΔHr,1. The same result may be achieved by two successive steps: (2) gasification with enthalpy ΔHr,2 and (3) combustion of the gas with enthalpy ΔHr,3. The difference between route (1) and route (2) + (3) in Figure 4 consists in (a–c) moles of H2O consumed during gasification, which are released during combustion of the gas. Additional energy recovered during combustion of the gas must be therefore supplied during gasification, and ΔHr,2 = ΔHr,1 − ΔHr,3.
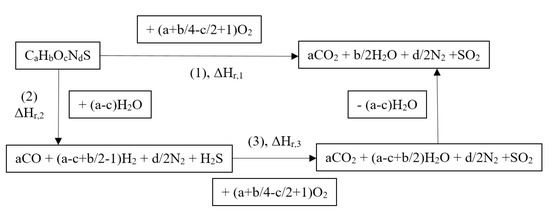
Figure 4.
Formalized routes of the direct waste oxidation—reaction (1) and via steam gasification followed by the gas combustion—reactions (2) + (3).
Considering the balance of elements during gasification, H2O is transformed into carbon monoxide and hydrogen, according to reaction H2O + C = H2 + CO. Enthalpy of this reaction at standard temperature of 25 °C equals to 175.29 kJ/mole (calculations performed with [49]). Because the steam demand is equal to (a-c) = (468 − 161) = 307 moles, the enthalpy is equal to 53.8 MJ per 1 mole of C468H748O161N16S or 5.84 MJ per 1 kg of C468H748O161N16S. Taking into account the ash content of 30.7 wt.% (Section 3.4.), this energy is equal to 4.05 MJ/kg of the dry waste. On the other hand, the standard enthalpy of combustion of the gas produced from 1 kg of the dry waste equals to 24.6 MJ (also calculated with [49]). Thus, enthalpy of the waste incineration, ΔHr,1, may be calculated as equal to 24.6 − 4.0 = 20.6 MJ/kg dry waste. There are countless literature data dealing with the calorific value of MSW and the waste fractions. Numerous papers give correlations between calorific value of the waste and their elemental composition; e.g., [51] with 18.8 MJ/kg, [52] with 17.6 MJ/kg or [53] with 19.3 MJ/kg of the waste. The difference of approximately 10% between literature data and calculated above incineration enthalpy of RMT-MSW seems acceptable, taking into account the very simplified and formal character of this evaluation.
3.3. Non-Gaseous Substances from Cooling Line
Lowering of the gas temperature inside the reactor (out of furnaces) led to the formation of a small amount of solid deposit on the quartz tube wall. Subsequent gas cooling in the Liebig condenser led to condensation of steam and some amounts of tars and oils, not converted in the process. The condensates were recirculated to the reactor and supplemented by approximately 6% of the distilled water. The final cleaning of the gas proceeded in the scrubber with alkaline solution. The results of the analysis, presented below, refers to the final condensate, after the 5th experiment.
3.3.1. Organic Compounds in Condensate
Organic compounds in sediments removed from the Liebig cooler, in sediments separated by filtration from condensate, in ether extracts from aqueous solution (filtrate) after experiment G5 as well as from alkaline solution from the scrubber, were analyzed by GC-MS method. The results are presented in Table 3. The total amount of 50.4 mg of organic compounds were distributed as follows: 80.8% (by mass) was in SF sediments (separated by filtration), 16.2% in SL sediments (removed from the Liebig cooler), 2.8% in AF (aqueous filtrate) and 0.24% in AS solution (from scrubber). The results may be summarized as follows. (1) Almost 97% of organic compounds was collected as sediments and less than 3% was found as dissolved in aqueous filtrate, both forms were returned to gasification. (2) Mass of the sum of organic compounds detected by GC-MS was only 0.15% of the average weight loss of the processed waste. (3) Sediments that were deposited in the Liebig condenser were systematically washed down by condensing steam. Presumably due to this rinsing, compositions of SL and SF sediments were similar: naphthalene was a major component (35% and 21%, respectively), the next was phenanthrene (15% and 20%) and ethenyl (11%) plus phenyl (13%) derivatives of naphthalene. Also, naphthalene appeared to be the major component (48%) in the case of aqueous filtrate, accompanied by 1H-indene (17%) and ethenylbenzene (12%). Only five compounds were detected at a very low level in the scrubber solution.
Table 3.
The content of organic compounds, determined by GC-MS, in sediments removed from the Liebig condenser (SL), in sediments separated by filtration (SF) from condensate after experiment G5, in aqueous filtrate (AF) and in alkaline solution from scrubber (AS). RT—retention time. RSDs (relative standard deviations) were in the range of 0.48%–1.21%.
3.3.2. Metals, Chlorides and Ammonium in the Aqueous Filtrate (AF)
The content of selected elements (metals) was analyzed in the aqueous filtrate (AF), after the final (5th) experiment. Results are presented in Table 4. Total concentration of these elements was found as relatively low and equal to only 135 mg/dm3. Two alkali metals, i.e., potassium and sodium, dominated this set, with contributions of 75.0% and 23.8%, respectively. Contribution of the next two elements, Ca and Mg, were only 0.93% and 0.16%, respectively, whereas other analyzed metals constituted 0.29%.
Table 4.
Masses of selected elements in the aqueous filtrate, AF (mean value ± standard deviation, n = 3), after the final (5th) experiment. The volume of the filtrate was 577 dm3. Concentration of Ag, As, Bi, Cd, Co, Ga, Hg, In, Mo, Ni, Pb, Sb, Se, Sn, Tl, V, Zn was below the limit of detection.
On the other hand, there was 291 mg of Cl− ions in the filtrate, but only 28.5% of them were necessary to balance with metals. The excess was ascribed to NH4+ ions with concentration of 2.49 g/dm3. However, most of the NH4+ ions were present in the carbonate form, and the release of CO2 gas could be noticed during acidification of the filtrate. Chloride ions were also detected in the alkaline solution from the scrubber (AS), in the total mass of 10.2 mg. Metals were not detected in the AS solution.
3.3.3. Metals in the Solid Deposit in the Reactor Outlet
A thin ring of the solid yellow-brownish deposit was formed on the wall of the reactor quartz tube during gasification experiments. The mass of substance that accumulated this way was approximately 0.7 g, after the final experiment (G5). The deposit was not recycled to the process (with the waste) because the reactor tube was used during experiments without cleaning. The deposit was analyzed for selected elements (metals), similarly to aqueous filtrate (AF). Results are presented in Table 5. Detected metals may be classified into three groups: K, Ca, Pb, Mg, Al and Na with concentration higher 1000 ppm; Cd, Zn, Bi, Cu, Fe with concentration higher 100 ppm; and other ones with concentration generally below 10 ppm. Formation of the high temperature deposit and its properties need to be investigated separately, due to specificity of the steam gasification. However, it may be noticed that the general trend of the content proportions of elements listed in Table 4 with concentration higher 10 ppm is very similar to that given in literature for typical MSWI (Municipal Solid Waste Incineration) fly ashes, e.g., [54].
Table 5.
Concentration of selected metals in the deposit removed from the quartz reactor outlet (mean value ± standard deviation, n = 3). Concentration of As, Co, Ga, Mo and Ni was below the limit of detection.
3.4. Ashes
All experiments of gasification had been carried out until the vanishing of the gas emission. Ashes from all experiments (i.e., the solid residue from the reactor) were mixed together and the mixture was ground for 3 min in a laboratory roller-ring mill, then sieved with a stack of four sieves into five fractions. The photograph of mixed ashes before grinding is shown in Figure 5. The classified fractions were sequentially leached with H2O, 2M HCl, 2M HNO3 and finally with aqua regia. Detailed description of these investigations and discussion of results are presented in a separate paper [34], together with comparative leaching of ashes prepared by incineration experiments. The most important differences between ashes from incineration and steam gasification are (1) higher leachability of metals by diluted inorganic acids (HCl, HNO3) from the ash prepared by gasification and (2) maintenance of the metallic form of copper during gasification process. Fractioning of ground ashes from gasification enabled accumulation of 63% of leachable Al, 84% of Cu and 80% of Zn in the ash grains with diameter ø > 0.16 mm; these grains represented 14.8% of the total mass of the ash. Moreover, the prevailing part of Cu was accumulated in the fraction 0.16 < ø < 0.50 mm (Cu constituted 8.5% of the fraction mass) and was leached primarily by HNO3.
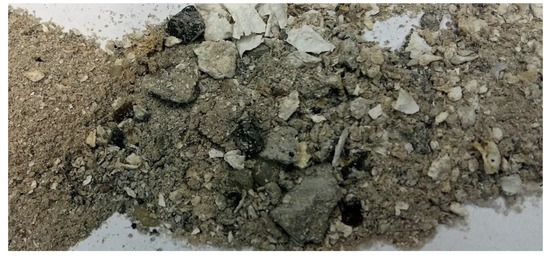
Figure 5.
Mixed ashes from experiments G1–G5 of steam gasification of RMT-MSW.
4. Summary
A series of five allothermal steam gasification experiments of the residual from mechanical treatment of municipal solid waste (RMT-MSW) was performed in a laboratory quartz reactor. It was found that emission of the gas peaked in the two temperature ranges, 300–500 °C and 650–800 °C, which were ascribed to pyrolytic and gasifying mechanisms, respectively. While the temperature ranges of the gas emission were generally reproducible, the intensity of emission varied according to the random composition of the waste. Despite this, areas of peaks (which corresponded to the gas volume) were in a general proportion of 55:45 for pyrolysis and gasification stages, respectively. Passing the gas through the equilibration zone filled with MgO/aluminosilicate granules efficiently minimized the content of tars and oils, gathered later together with condensing steam. These organic condensates consisted only 0.15% of the average weight loss during the waste processing. Organic sediments, as well as aqueous condensates were systematically returned to the reactor. In the final condensate (after the 5th experiment), 97% of all organic compounds, mainly in a form of naphthalene, as well as derivatives of naphthalene and phenanthrene, were found in sediments, which were separated by filtration. Concentration of metals in the final aqueous condensate was equal to 135 mg/dm3 in total, with 98.5% by mass of potassium and sodium ions content. Moreover, a relatively high concentration of NH4+ ions, equal to 2.49 g/dm3, mostly as carbonate, was also found. Additionally, equivalency of the steam gasification and incineration processes from the point of view of thermodynamics was shortly discussed. It was estimated that emission of the gas (at thermodynamic equilibrium) is equal to 2.11 m3 of the dry gas (at 25 °C and 1 bar) per 1 kg of the dry waste, standard enthalpy of the gas combustion is equal to 24.6 MJ/kg of the dry waste, and approximately 16% of this energy is due to endothermicity of the steam gasification process.
Author Contributions
Conceptualization, M.Z.-M. and W.S.; investigation, M.Z.-M., P.R. and W.S.; data curation, M.Z.-M., R.W. and W.S.; writing—original draft preparation, M.Z.-M. and W.S. All authors have read and agreed to the published version of the manuscript.
Funding
The work was financed by statutory activity subsidies from the Polish Ministry of Science and Higher Education for the Faculty of Environmental Engineering and Faculty of Chemistry of Wroclaw University of Science and Technology.
Acknowledgments
The authors thank ZGO Gać Sp. z o. o., Gać 90 for help in acquiring and preparing the research material.
Conflicts of Interest
The authors declare no conflict of interest.
References
- Arena, U. Process and technological aspects of municipal solid waste gasification. A review. Waste Manag. 2012, 32, 625–639. [Google Scholar] [CrossRef]
- Šuhaj, P.; Husár, J.; Haydary, J. Modelling of syngas production from municipal solid waste (MSW) for methanol synthesis. Acta Chim. Slov. 2017, 10, 107–114. [Google Scholar] [CrossRef]
- Chen, D.; Yin, L.; Wang, H.; He, P. Pyrolysis technologies for municipal solid waste: A review. Waste Manag. 2014, 34, 2466–2486. [Google Scholar] [CrossRef] [PubMed]
- Braekman-Danheux, C.; D’haeyere, A.; Fontana, A.; Laurent, P. Upgrading of waste derived solid fuel by steam gasification. Fuel 1998, 77, 55–59. [Google Scholar] [CrossRef]
- Morris, M.; Waldheim, L. Energy recovery from solid waste fuels using advanced gasification technology. Waste Manag. 1998, 18, 557–564. [Google Scholar] [CrossRef]
- Malkow, T. Novel and innovative pyrolysis and gasification technologies for energy efficient and environmentally sound MSW disposal. Waste Manag. 2004, 24, 53–79. [Google Scholar] [CrossRef]
- Guan, Y.; Luo, S.; Liu, S.; Xiao, B.; Cai, L. Steam catalytic gasification of municipal solid waste for producing tar-free fuel gas. Int. J. Hydrogen Energy 2009, 34, 9341–9346. [Google Scholar] [CrossRef]
- Luo, L.; Zhou, Y.; Yi, C. Syngas production by catalytic steam gasification of municipal solid waste in fixed-bed reactor. Energy 2012, 44, 391–395. [Google Scholar] [CrossRef]
- He, M.; Hu, Z.; Xiao, B.; Li, J.; Guo, X.; Luo, S.; Yang, F.; Feng, Y.; Yang, G.; Liu, S. Hydrogen-rich gas from catalytic steam gasification of municipal solid waste (MSW): Influence of catalyst and temperature on yield and product composition. Int. J. Hydrogen Energy 2009, 34, 195–203. [Google Scholar] [CrossRef]
- He, M.; Xiao, B.; Liu, S.; Guo, X.; Luo, S.; Xu, Z.; Feng, Y.; Hu, Z. Hydrogen-rich gas from catalytic steam gasification of municipal solid waste (MSW): Influence of steam to MSW ratios and weight hourly space velocity on gas production and composition. Int. J. Hydrogen Energy 2009, 34, 2174–2183. [Google Scholar] [CrossRef]
- He, M.; Xiao, B.; Liu, S.; Hu, Z.; Guo, X.; Luo, S.; Yang, F. Syngas production from pyrolysis of municipal solid waste (MSW) with dolomite as downstream catalysts. J. Anal. Appl. Pyrol. 2010, 87, 181–187. [Google Scholar] [CrossRef]
- Wang, J.; Cheng, G.; You, Y.; Xiao, B.; Liu, S.; He, P.; Guo, D.; Guo, X.; Zhang, G. Hydrogen-rich gas production by steam gasification of municipal solid waste (MSW) using NiO supported on modified dolomite. Int. J. Hydrogen Energy 2012, 37, 6503–6510. [Google Scholar] [CrossRef]
- Wu, W.; Zhou, X.; Zhang, P.; Liu, W.; Danzeng, D.; Wang, S.; Wang, Y. Study on Characteristics of Synthesis Gas Generation during Catalytic Gasification of Municipal Solid Waste. Procedia Environ. Sci. 2016, 31, 505–513. [Google Scholar] [CrossRef]
- Galvagno, S.; Casciaro, G.; Casu, S.; Martino, M.; Mingazzini, C.; Russo, A.; Portofino, S. Steam gasification of tyre waste, poplar, and refuse-derived fuel: A comparative analysis. Waste Manag. 2009, 29, 678–689. [Google Scholar] [CrossRef]
- Lee, U.; Chung, J.N.; Ingley, H.A. High-Temperature Steam Gasification of Municipal Solid Waste, Rubber, Plastic and Wood. Energy Fuels 2014, 28, 4573–4587. [Google Scholar] [CrossRef]
- Vaish, B.; Sharma, B.; Srivastava, V.; Singh, P.; Ibrahim, M.H.; Singh, R.P. Energy recovery potential and environmental impact of gasification for municipal solid waste. Biofuels 2019, 10, 87–100. [Google Scholar] [CrossRef]
- Xu, P.; Jin, Y.; Cheng, Y. Thermodynamic Analysis of the Gasification of Municipal Solid Waste. Engineering 2017, 3, 416–422. [Google Scholar] [CrossRef]
- Couto, N.; Silva, V.; Monteiro, E.; Rouboa, A. Exergy analysis of Portuguese municipal solid waste treatment via steam gasification. Energy Convers. Manag. 2017, 134, 235–246. [Google Scholar] [CrossRef]
- Lv, L.; Zhang, Z.; Li, H. SNG-electricity cogeneration through MSW gasification integrated with a dual chemical looping process. Chem. Eng. Process. 2019, 145, 107665. [Google Scholar] [CrossRef]
- Hu, M.; Guo, D.; Ma, C.; Hu, Z.; Zhang, B.; Xiao, B.; Luo, S.; Wang, J. Hydrogen-rich gas production by the gasification of wet MSW (municipal solid waste) coupled with carbon dioxide capture. Energy 2015, 90, 857–863. [Google Scholar] [CrossRef]
- Gao, W.; Farahani, M.R.; Rezaei, M.; Hosamani, S.M.; Jamil, M.K.; Imran, M.; Baig, A.Q. Experimental study of steam-gasification of municipal solid wastes (MSW) using Ni-Cu/γ-Al2O3 nano catalysts. Energy Source. Part A 2017, 39, 693–697. [Google Scholar] [CrossRef]
- Xiang, L.Y.; Lin, Q.; Cai, L.; Guan, Y.; Lu, J.; Liu, W. Study of the effect mechanism of municipal solid waste gasification conditions on the production of H2 and CO using modelling technique. J. Environ. Manag. 2019, 230, 301–310. [Google Scholar] [CrossRef] [PubMed]
- Niu, M.; Huang, Y.; Jin, B.; Wang, X. Simulation of syngas production from municipal solid waste gasification in a bubbling fluidized bed using Aspen plus. Ind. Eng. Chem. Res. 2013, 52, 14768–14775. [Google Scholar] [CrossRef]
- Onel, O.; Niziolek, A.M.; Hasan, M.M.F.; Floudas, C.A. Municipal solid waste to liquid transportation fuels e part I: Mathematical modeling of a municipal solid waste gasifier. Comput. Chem. Eng. 2014, 71, 636–647. [Google Scholar] [CrossRef]
- Couto, N.; Silva, V.; Monteiro, E.; Rouboa, A. Assessment of Municipal Solid Wastes Gasification in a Semi-Industrial Gasifier Using Syngas Quality Indices. Energy 2015, 93, 864–873. [Google Scholar] [CrossRef]
- Couto, N.; Monteiro, E.; Silva, V.; Rouboa, A. Hydrogen-rich gas from gasification of Portuguese municipal solid wastes. Int. J. Hydrogen Energy 2016, 41, 10619–10630. [Google Scholar] [CrossRef]
- Zabłocka-Malicka, M.; Szczepaniak, W.; Zielińska, A.; Rutkowski, P. Steam gasification of oat with conversion of tars on clay catalyst and gas cleaning by condensation of steam. Ecol. Chem. Eng. S 2016, 23, 33–48. [Google Scholar] [CrossRef][Green Version]
- Bonazzi, F.A.; Cividino, S.R.S.; Zambon, I.; Mosconi, E.M.; Poponi, S. Building Energy Opportunity with a Supply Chain Based on the Local Fuel-Producing Capacity. Sustainability 2018, 10, 2140. [Google Scholar] [CrossRef]
- Siciliano, A.; Limonti, C.; Mehariya, S.; Molino, A.; Calabrò, V. Biofuel Production and Phosphorus Recovery through an Integrated Treatment of Agro-Industrial Waste. Sustainability 2019, 11, 52. [Google Scholar] [CrossRef]
- Vaskalis, I.; Skoulou, V.; Stavropoulos, G.; Zabaniotou, A. Towards Circular Economy Solutions for The Management of Rice Processing Residues to Bioenergy via Gasification. Sustainability 2019, 11, 6433. [Google Scholar] [CrossRef]
- Zabłocka-Malicka, M.; Rutkowski, P.; Szczepaniak, W. Recovery of copper from PVC multiwire cable waste by steam gasification. Waste Manag. 2015, 46, 488–496. [Google Scholar] [CrossRef]
- Zabłocka-Malicka, M.; Szczepaniak, W.; Rutkowski, P.; Ochromowicz, K.; Leśniewicz, A.; Chęcmanowski, J. Decomposition of the ISA-card under steam for valorized polymetallic raw material. J. Anal. Appl. Pyrol. 2018, 130, 256–268. [Google Scholar] [CrossRef]
- Gurgul, A.; Szczepaniak, W.; Zabłocka-Malicka, M. Incineration and pyrolysis vs. steam gasification of electronic waste. Sci. Total Environ. 2018, 624, 1119–1124. [Google Scholar] [CrossRef] [PubMed]
- Zabłocka-Malicka, M.; Szczepaniak, W.; Szymczycha-Madeja, A. Comparison of leaching of metals from ground ashes prepared by steam gasification and incineration of the 60–340mm MSW fraction. J. Environ. Chem. Eng. 2020, 8, 104029. [Google Scholar] [CrossRef]
- Szczepaniak, W.; Zabłocka-Malicka, M. Equilibrium Thermochemical Cycle for Replacing the Waste Incineration by Steam Gasification. Pers. Manuscr. 2020. Available online: https://www.researchgate.net/publication/342420341 (accessed on 24 June 2020).
- EC-European Commission. 2014/955/EU: Commission Decision of 18 December 2014 amending Decision 2000/532/EC on the list of waste pursuant to Directive 2008/98/EC of the European Parliament and of the Council. 2014. Available online: https://eur-lex.europa.eu/legal-content/EN/TXT/?uri=CELEX%3A32014D0955 (accessed on 25 September 2020).
- Safwat, H.; Motasem, S.; Salam, Al-Zu’bi; Mahmoud, I.; Abdallah, N.; Michael, N. Potential Utilization of RDF as an Alternative Fuel to be Used in Cement Industry in Jordan. Sustainability 2019, 11, 5819. [Google Scholar] [CrossRef]
- Ranieri, E.; Ionescu, G.; Fedele, A.; Palmieri, E.; Ranieri, A.C.; Campanaro, V. Sampling, characterisation and processing of solid recovered fuel production from municipal solid waste: An Italian plant case study. Waste Manag. Res. 2017, 35, 890–898. [Google Scholar] [CrossRef] [PubMed]
- EC Directive. Directive 2008/98/EC Of The European Parliament And Of The Council of 19 November 2008 on waste and repealing certain Directives. 2008. Available online: https://eur-lex.europa.eu/legal-content/EN/TXT/?uri=celex%3A32008L0098 (accessed on 25 September 2020).
- Ionescu, G.; Rada, E.C.; Ragazzi, M.; Mărculescu, C.; Badea, A.; Apostol, T. Integrated municipal solid waste scenario model using advanced pretreatment and waste to energy processes. Energy Convers. Manag. 2013, 76, 1083–1092. [Google Scholar] [CrossRef]
- Rada, E.C.; Cioca, L. Optimizing the Methodology of Characterization of Municipal Solid Waste in EU under a Circular Economy Perspective. Energy Procedia 2017, 119, 72–85. [Google Scholar] [CrossRef]
- Moré, J.J. The Levenberg-Marquardt algorithm: Implementation and theory. Numer. Anal. 1978, 630, 105–116. [Google Scholar]
- Zhang, J.; Chen, T.; Wu, J.; Wu, J. TG-MS analysis and kinetic study for thermal decomposition of six representative components of municipal solid waste under steam atmosphere. Waste Manag. 2015, 43, 152–161. [Google Scholar] [CrossRef]
- Lai, Z.; Ma, X.; Tang, Y.; Lin, H. Thermogravimetric analysis of the thermal decomposition of MSW in N2, CO2 and CO2/N2 atmospheres. Fuel Process. Technol. 2012, 102, 18–23. [Google Scholar] [CrossRef]
- Chen, S.; Meng, A.; Long, Y.; Zhou, H.; Li, Q.; Zhang, Y. TGA pyrolysis and gasification of combustible municipal solid waste. J. Energy Inst. 2015, 88, 332–343. [Google Scholar] [CrossRef]
- Meng, A.; Chen, S.; Long, Y.; Zhou, H.; Zhang, Y.; Li, Q. Pyrolysis and gasification of typical components in wastes with macro-TGA. Waste Manag. 2015, 46, 247–256. [Google Scholar] [CrossRef]
- Meng, A.; Chen, S.; Zhou, H.; Long, Y.; Zhang, Y.; Li, Q. Pyrolysis and simulation of typical components in wastes with macro-TGA. Fuel 2015, 157, 1–8. [Google Scholar] [CrossRef]
- Tang, Y.; Ma, X.; Wang, Z.; Wu, Z.; Yu, Q. A study of the thermal degradation of six typical municipal waste components in CO2 and N2 atmospheres using TGA-FTIR. Thermochim. Acta 2017, 657, 12–19. [Google Scholar] [CrossRef]
- HSC Chemistry®, Version 6.12; Finland Information Service; Outotec Research Center: Pori, Finland, 2007.
- Yang, Y.; Heaven, S.; Venetsaneas, N.; Banks, C.J.; Bridgwater, A.V. Slow pyrolysis of organic fraction of municipal solid waste (OFMSW): Characterisation of products and screening of the aqueous liquid product for anaerobic digestion. Appl. Energ. 2018, 213, 158–168. [Google Scholar] [CrossRef]
- Komilis., D.; Evangelou, A.; Giannakis, G.; Lymperis, C. Revisiting the elemental composition and the calorific value of the organic fraction of municipal solid wastes. Waste Manag. 2012, 32, 372–381. [Google Scholar] [CrossRef] [PubMed]
- Boumanchar, I.; Chhiti, Y.; M’hamdi Alaoui, F.E.; Sahibed-dine, A.; Bentiss, F.; Jama, C.; Bensitel, M. Municipal solid waste higher heating value prediction from ultimate analysis using multiple regression and genetic programming techniques. Waste Manag. Res. 2019, 37, 578–589. [Google Scholar] [CrossRef]
- Bagheri, M.; Esfilar, R.; Golchi, M.S.; Kennedy, C.A. Towards a circular economy: A comprehensive study of higher heat values and emission potential of various municipal solid wastes. Waste Manag. 2020, 101, 210–221. [Google Scholar] [CrossRef]
- Phua, Z.; Giannis, A.; Dong, Z-L.; Liska, G.; Ng, W.J. Characteristics of incineration ash for sustainable treatment and reutilization. Environ. Sci. Pollut. Res. 2019, 26, 16974–16997. [Google Scholar] [CrossRef]
© 2020 by the authors. Licensee MDPI, Basel, Switzerland. This article is an open access article distributed under the terms and conditions of the Creative Commons Attribution (CC BY) license (http://creativecommons.org/licenses/by/4.0/).