An Evaluation of the Impact of Ecological Compensation on the Cross-Section Efficiency Using SFA and DEA: A Case Study of Xin’an River Basin
Abstract
1. Introduction
2. Literature Review
2.1. Ecological Compensation Assessment
2.2. Environmental Efficiency Evaluation
3. Materials and Methods
3.1. Case Background
3.2. Data Description
3.3. Methodology
3.3.1. SFA
3.3.2. DEA
4. Results
4.1. Data Processing
4.2. SFA Efficiency Calculation
5. Discussion
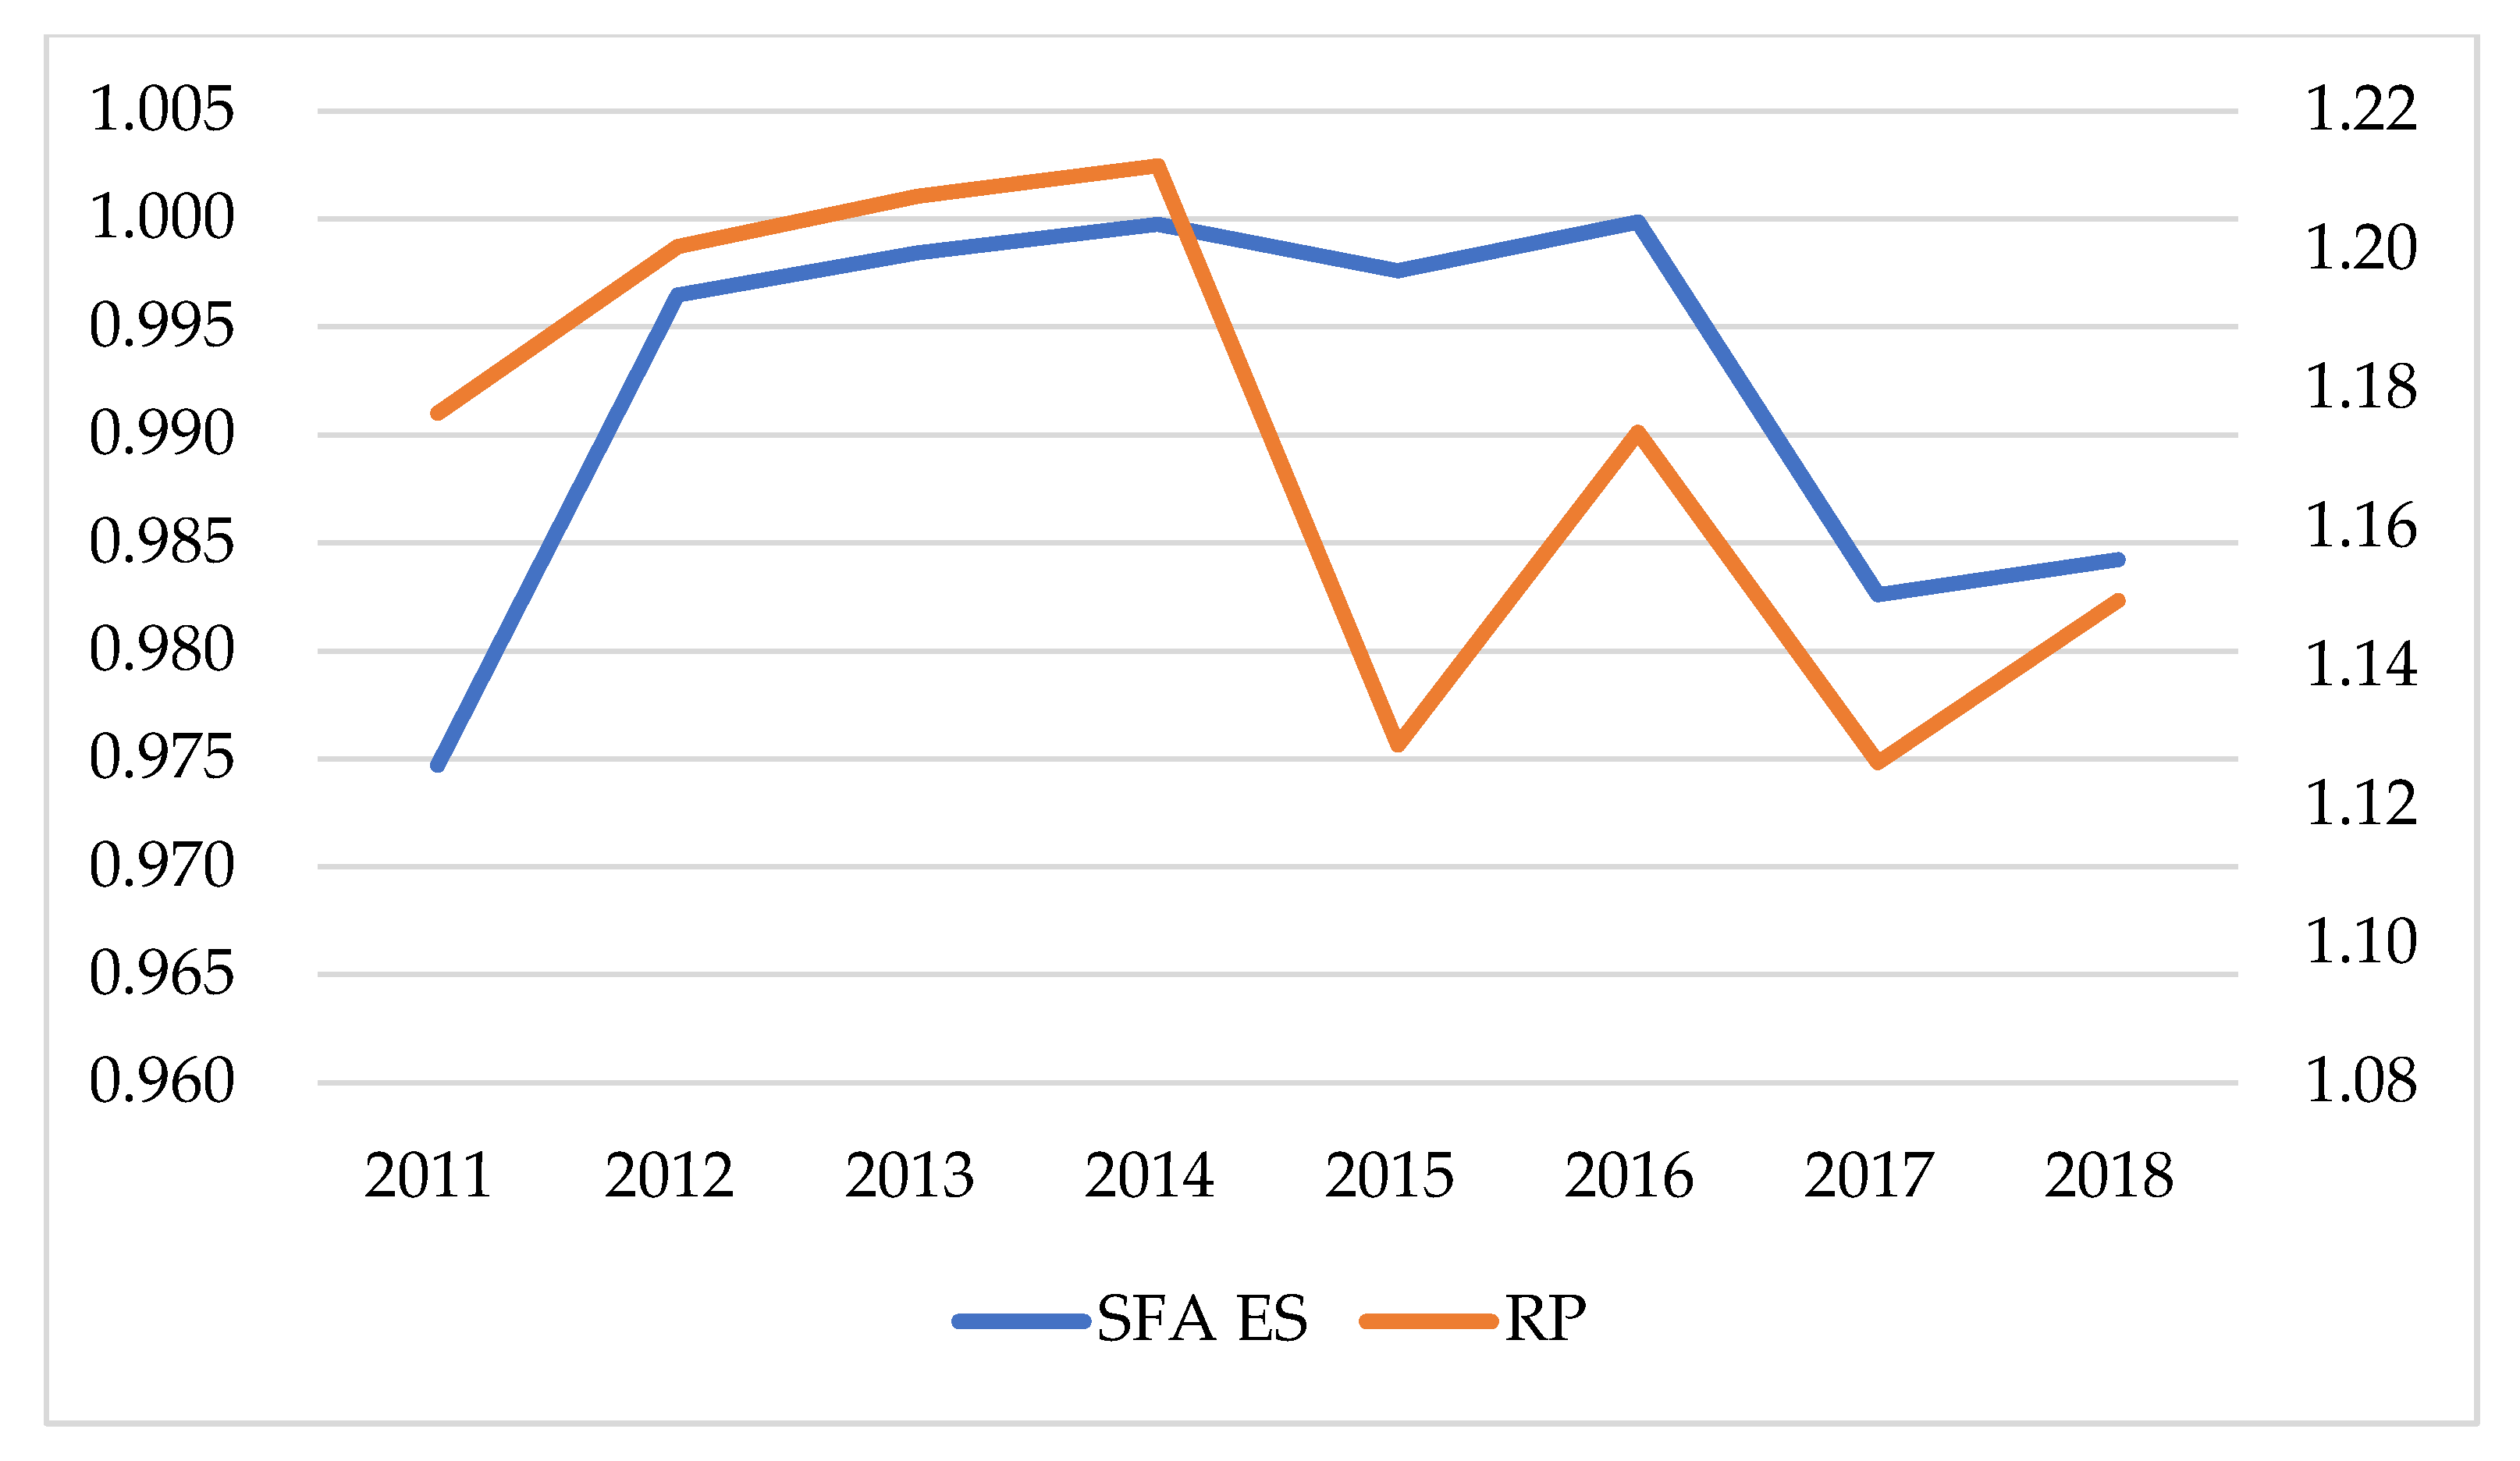
5.1. The First-Round Analysis
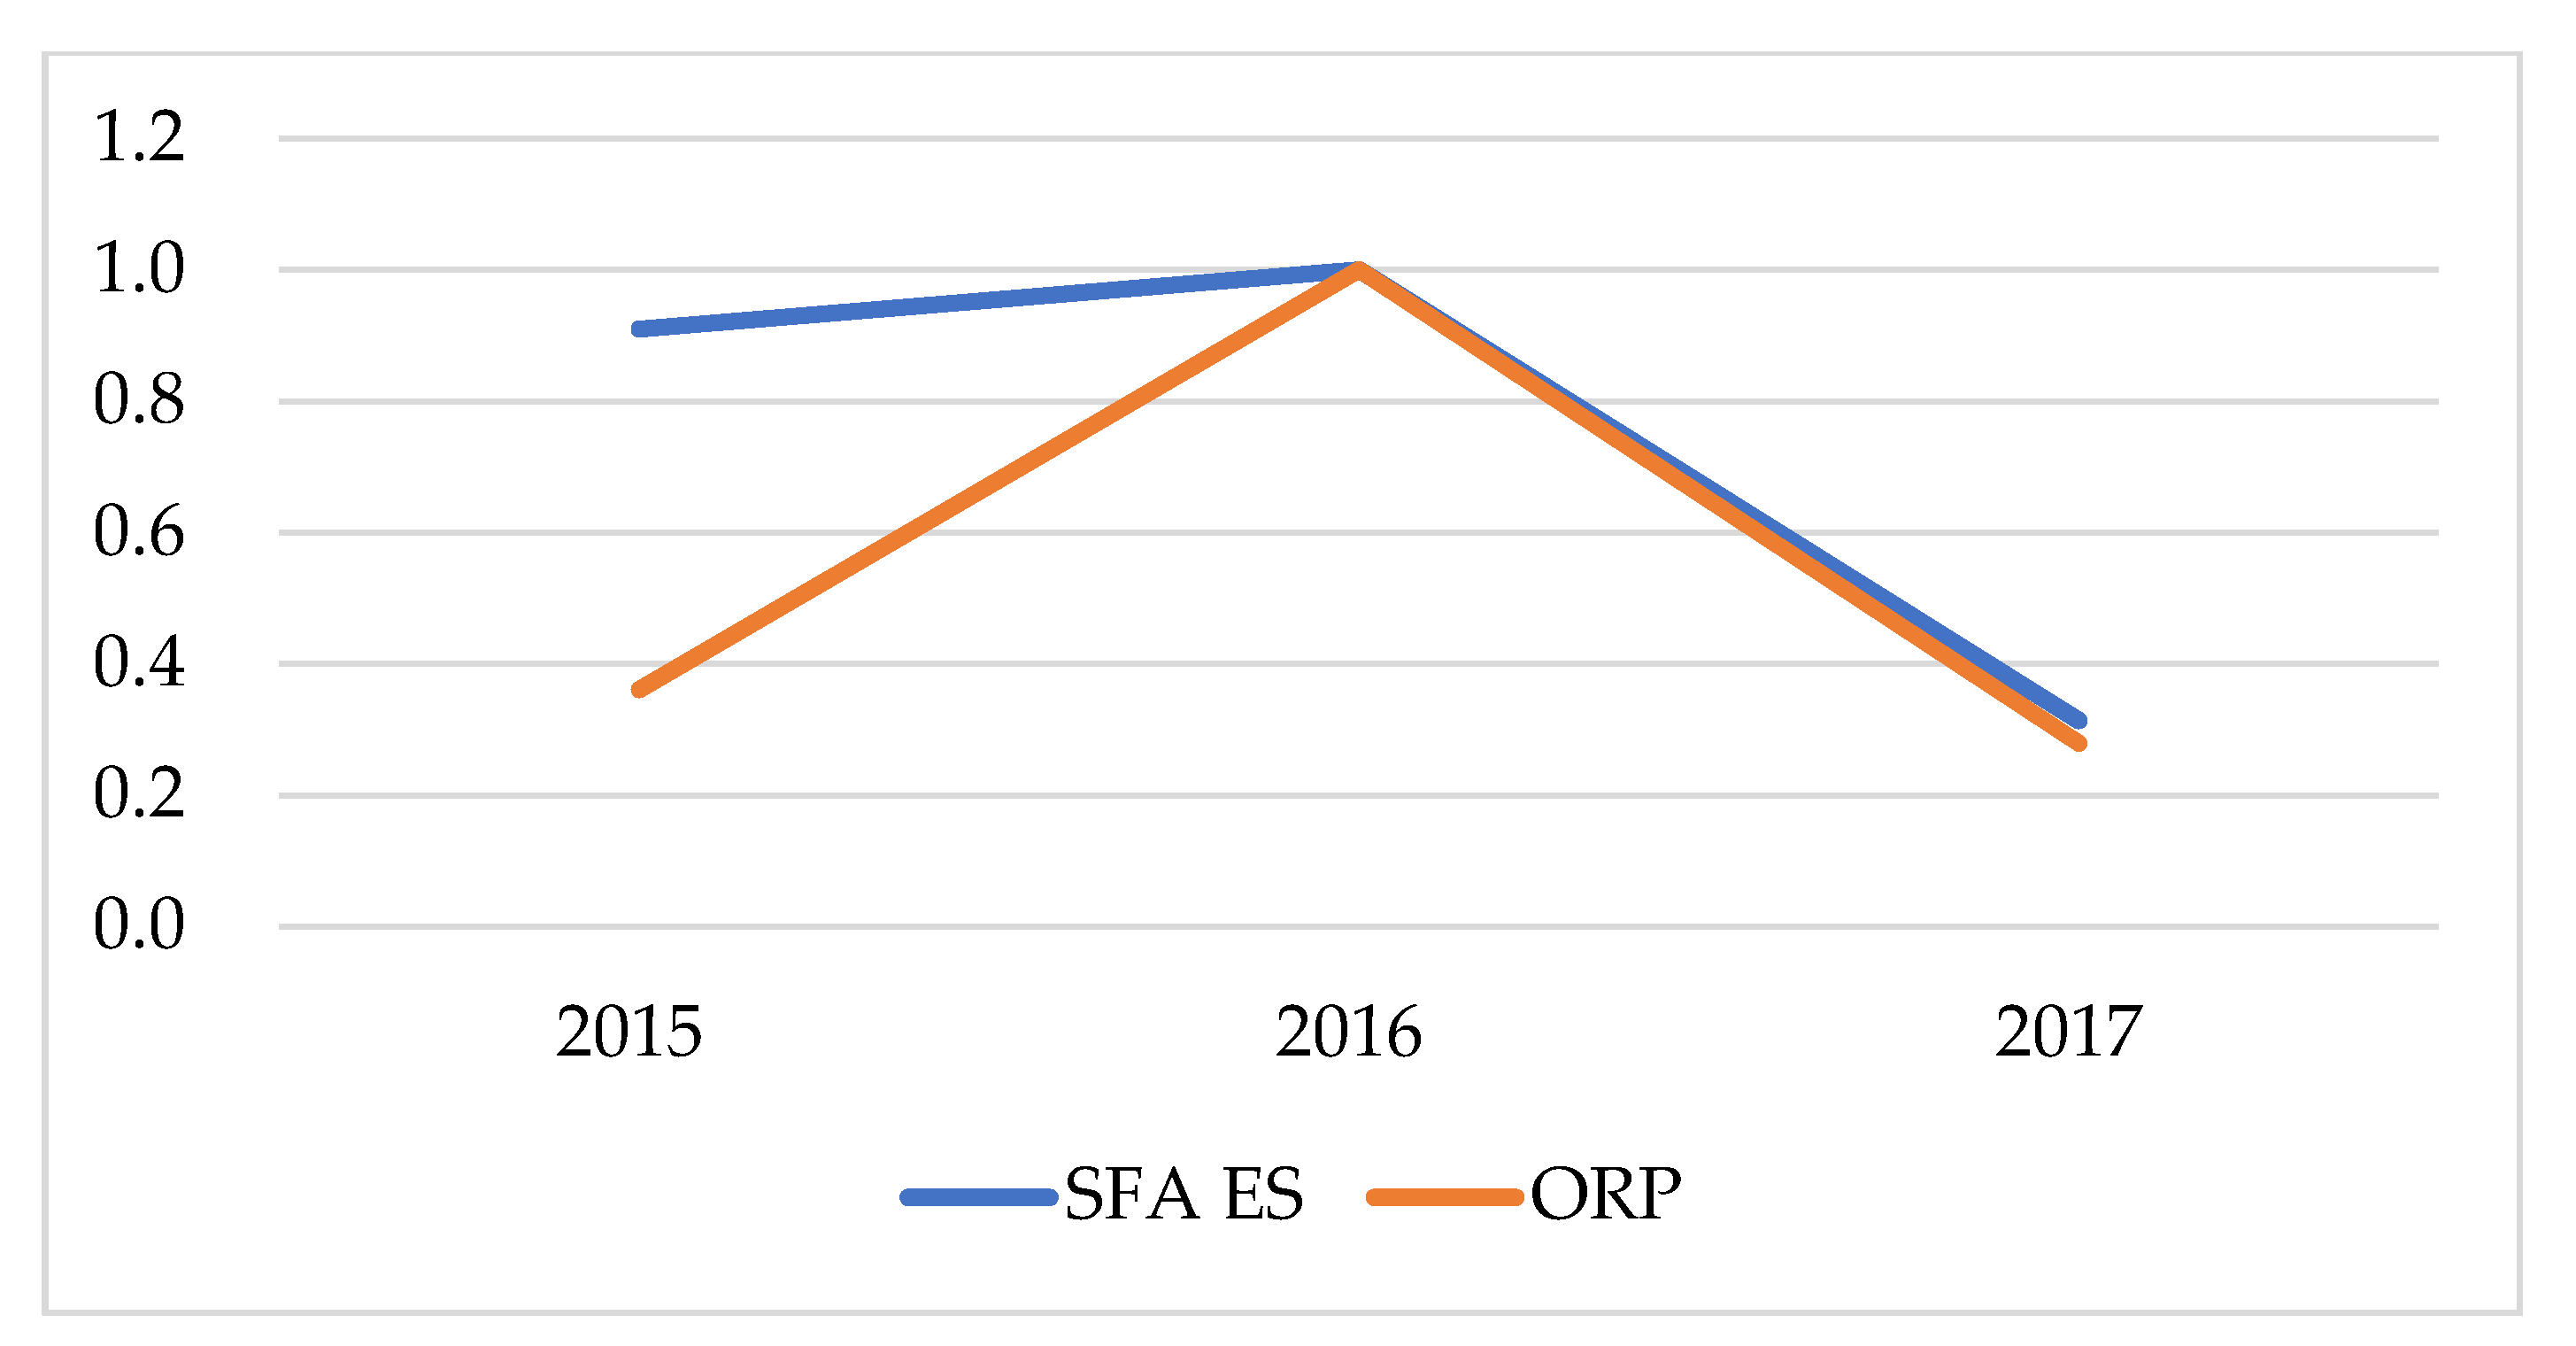
5.2. The Second-Round Analysis
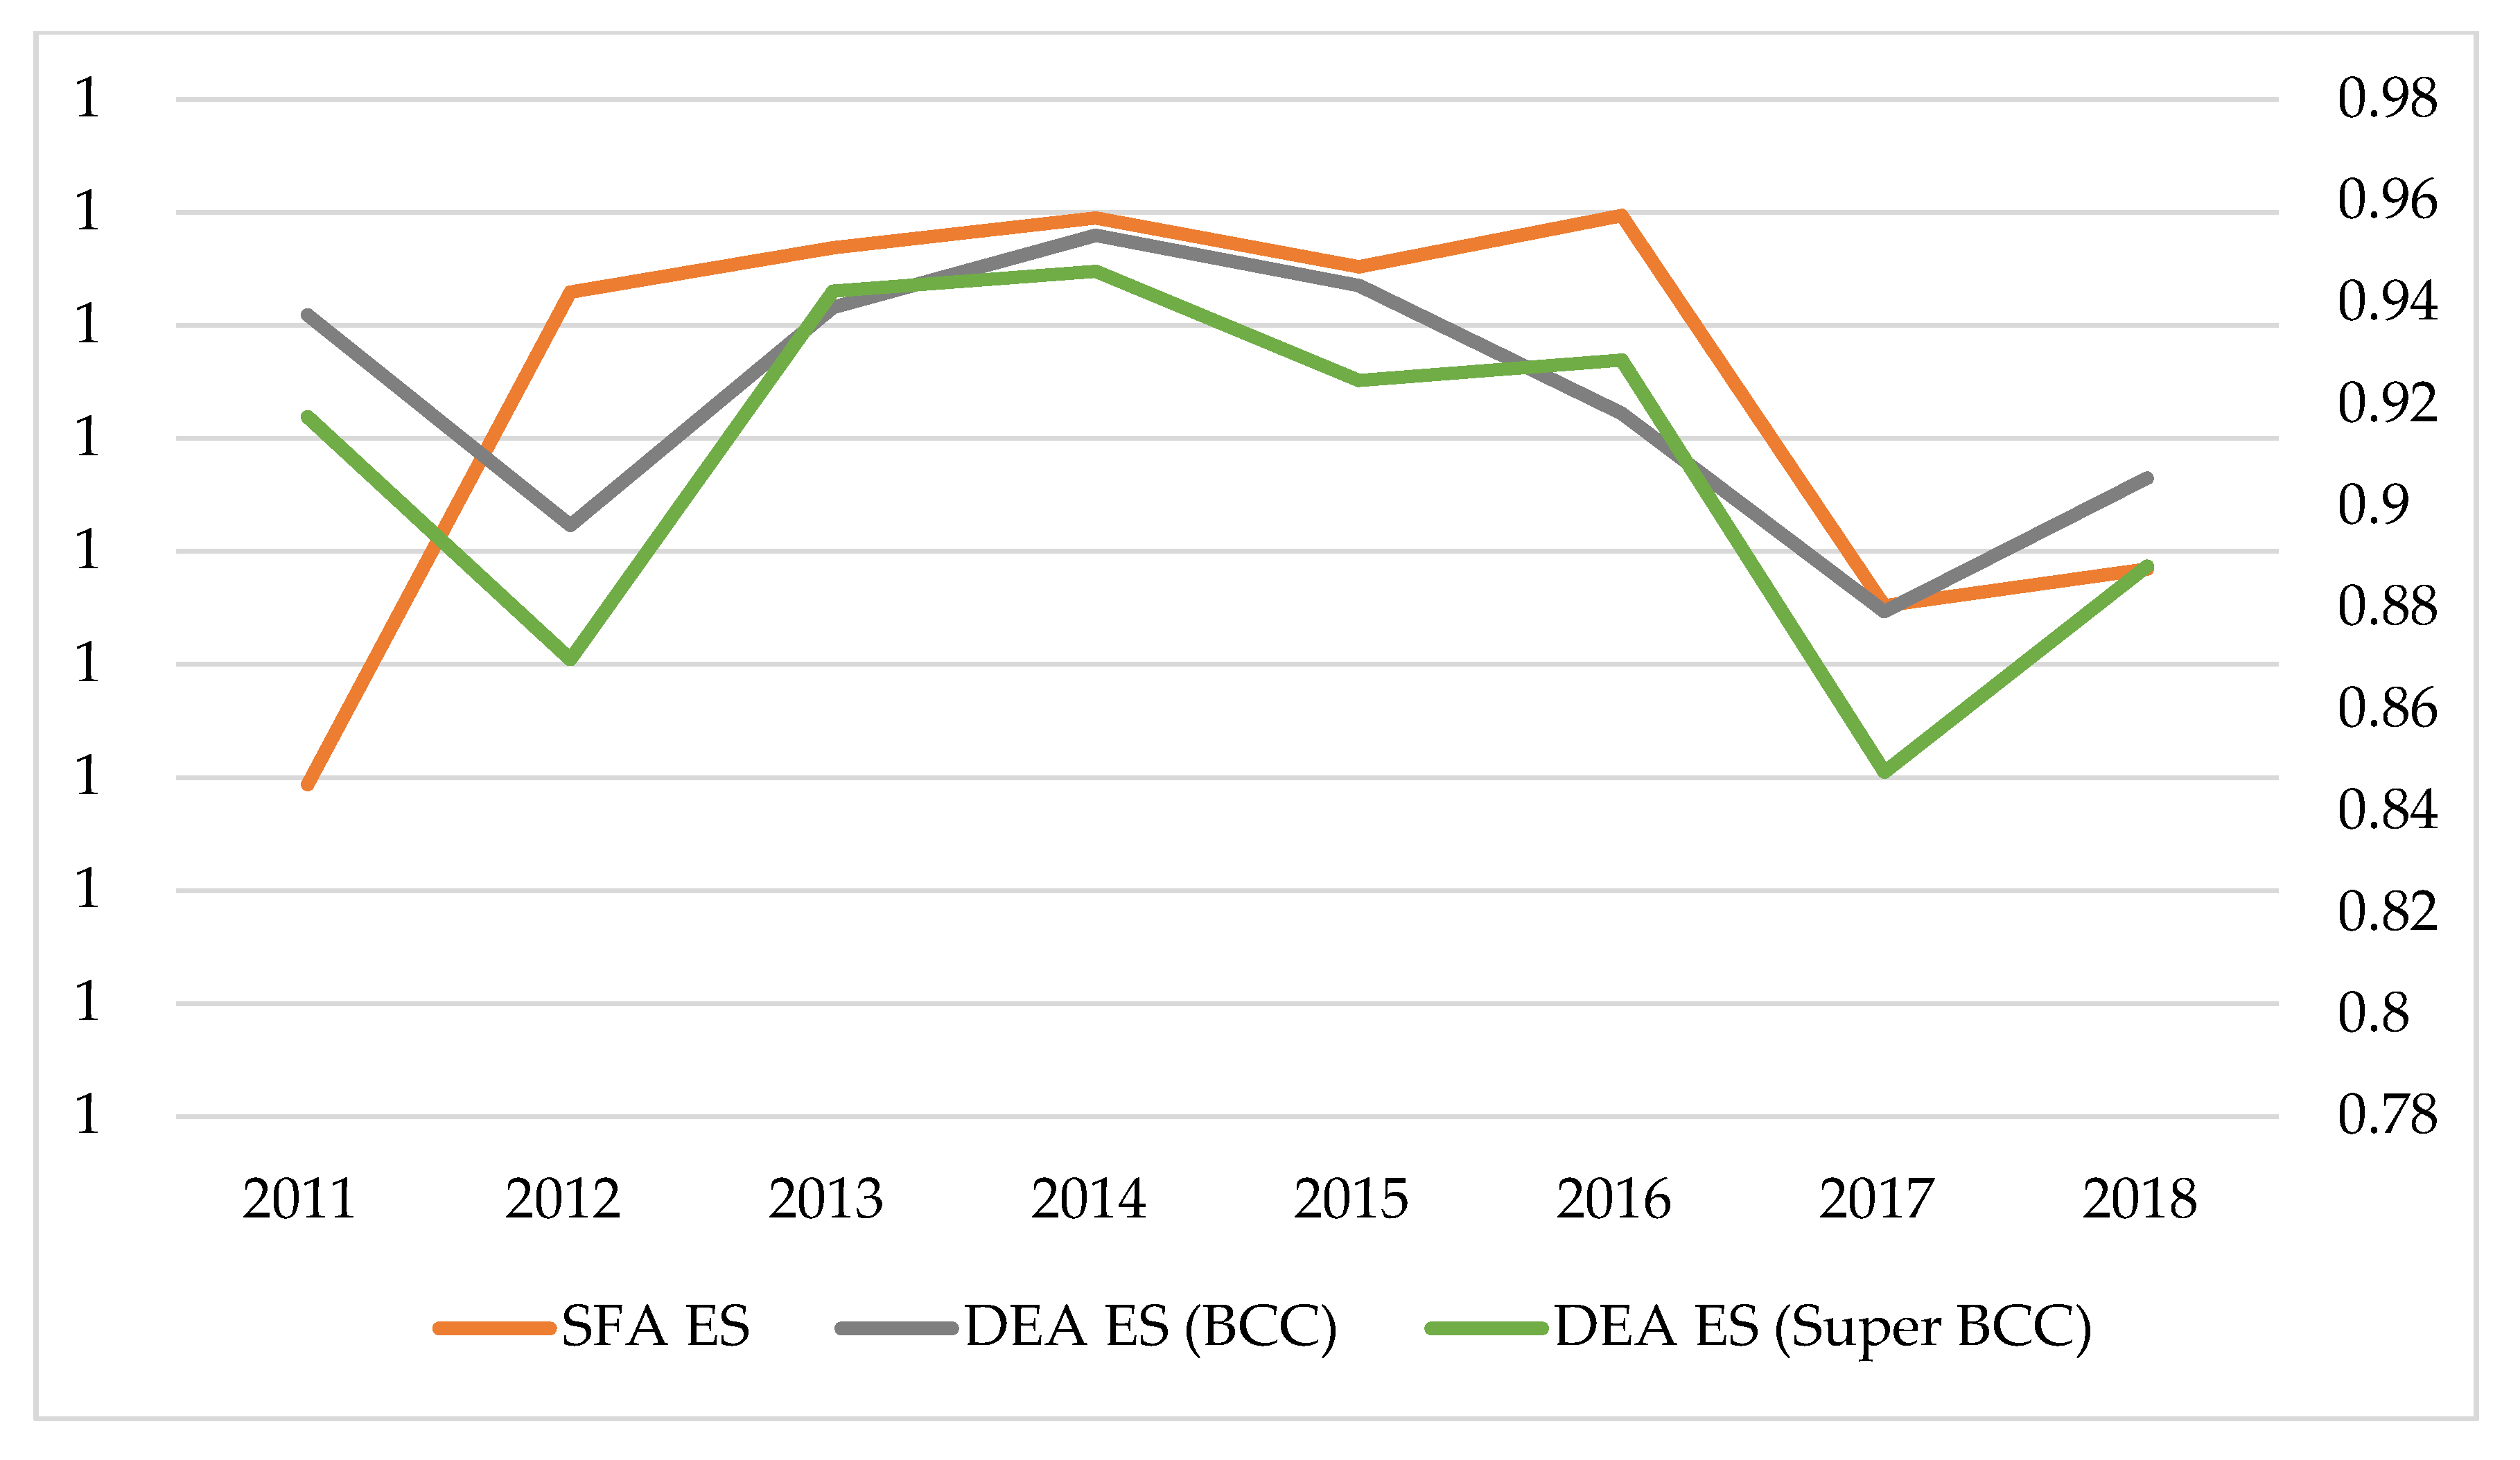
5.3. Comparison with DEA
5.4. Influencing Factors Analysis
5.4.1. Determinants
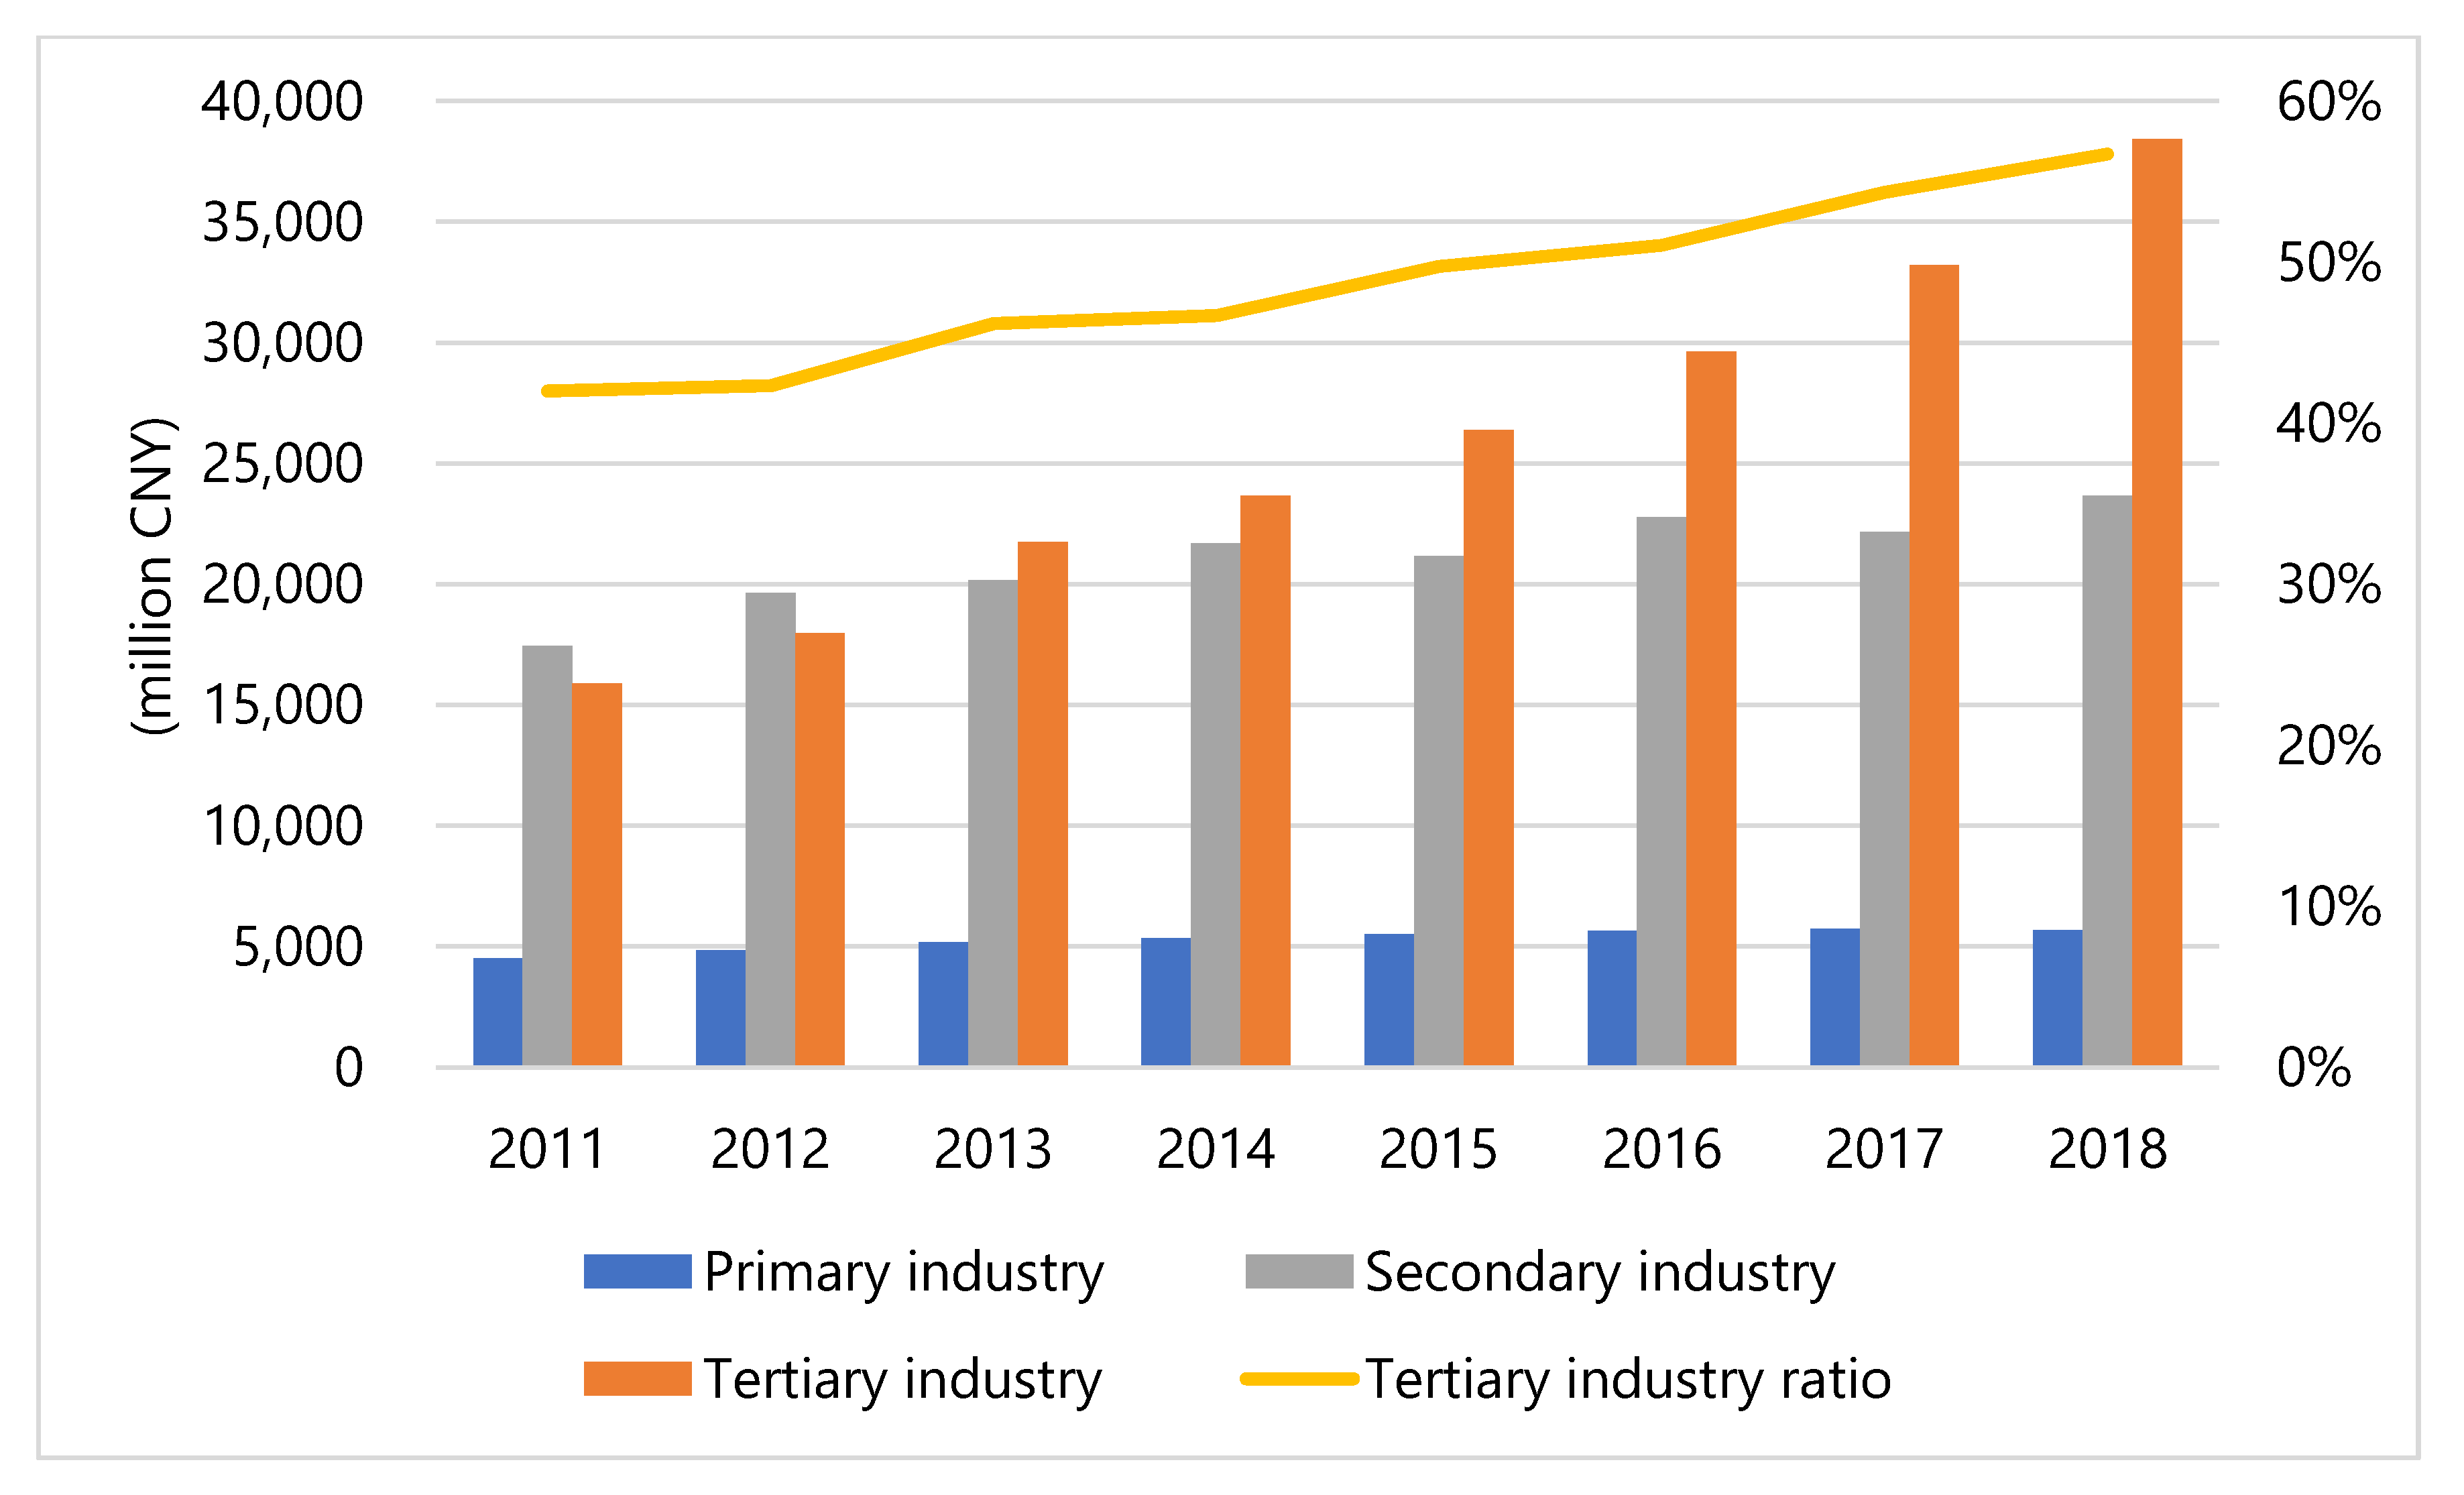
5.4.2. Influencing Factors
6. Conclusions
Author Contributions
Funding
Conflicts of Interest
References
- Sonter, L.J.; Simmonds, J.S.; Watson, J.E.M.; Jones, J.P.G.; Kiesecker, J.M.; Costa, H.M.; Bennun, L.; Edwards, S.; Grantham, H.S.; Griffiths, V.F.; et al. Local conditions and policy design determine whether ecological compensation can achieve No Net Loss goals. Nat. Commun. 2020, 11, 2072. [Google Scholar] [CrossRef]
- Engel, S.; Pagiola, S.; Wunder, S. Designing payments for environmental services in theory and practice: An overview of the issues. Ecol. Econ. 2008, 65, 663–674. [Google Scholar] [CrossRef]
- Wunder, S. Payments for environmental services and the poor: Concepts and preliminary evidence. Environ. Dev. Econ. 2008, 13, 279–297. [Google Scholar] [CrossRef]
- Muradian, R.; Corbera, E.; Pascual, U.; Kosoy, N.; May, P.H. Reconciling theory and practice: An alternative conceptual framework for understanding payments for environmental services. Ecol. Econ. 2010, 69, 1202–1208. [Google Scholar] [CrossRef]
- Tacconi, L. Redefining payments for environmental services. Ecol. Econ. 2012, 73, 29–36. [Google Scholar] [CrossRef]
- MEPC. Eco-Compensation Mechanism and Policies in China; Ministry of Environmental Protection of the People’s Republic of China: Beijing, China, 2006. [Google Scholar]
- NPC. The Environmental Protection Law of the People’s Republic of China; The National People’s Congress of the People’s Republic of China: Beijing, China, 2014.
- Adamowicz, W.; Calderon-Etter, L.; Entem, A.; Fenichel, E.P.; Hall, J.S.; Lloyd-Smith, P.; Ogden, F.L.; Regina, J.A.; Rouhi Rad, M.; Stallard, R.F. Assessing ecological infrastructure investments. Proc. Natl. Acad. Sci. USA 2019, 116, 5254–5261. [Google Scholar] [CrossRef]
- Song, C.H.; Bilsborrow, R.; Jagger, P.; Zhang, Q.; Chen, X.D.; Huang, Q.F. Rural Household Energy Use and Its Determinants in China: How Important Are Influences of Payment for Ecosystem Services vs. Other Factors? Ecol. Econ. 2018, 145, 148–159. [Google Scholar] [CrossRef]
- Blundo-Canto, G.; Bax, V.; Quintero, M.; Cruz-Garcia, G.S.; Groeneveld, R.A.; Perez-Marulanda, L. The Different Dimensions of Livelihood Impacts of Payments for Environmental Services (PES) Schemes: A Systematic Review. Ecol. Econ. 2018, 149, 160–183. [Google Scholar] [CrossRef]
- Andersson, K.P.; Cook, N.J.; Grillos, T.; Lopez, M.C.; Salk, C.F.; Wright, G.D.; Mwangi, E. Experimental evidence on payments for forest commons conservation. Nat. Sustain. 2018, 1, 128–135. [Google Scholar] [CrossRef]
- Alix-Garcia, J.M.; Sims, K.R.E.; Orozco-Olvera, V.H.; Costica, L.E.; Fernandez Medina, J.D.; Romo Monroy, S. Payments for environmental services supported social capital while increasing land management. Proc. Natl. Acad. Sci. USA 2018, 115, 7016–7021. [Google Scholar] [CrossRef]
- Romulo, C.L.; Posner, S.; Cousins, S.; Hoyle Fair, J.; Bennett, D.E.; Huber-Stearns, H.; Richards, R.C.; McDonald, R.I. Global state and potential scope of investments in watershed services for large cities. Nat. Commun. 2018, 9, 4375. [Google Scholar] [CrossRef]
- Lampe, H.W.; Hilgers, D. Trajectories of efficiency measurement: A bibliometric analysis of DEA and SFA. Eur. J. Oper. Res. 2015, 240, 1–21. [Google Scholar] [CrossRef]
- Hoang, V.N.; Nguyen, T.T. Analysis of environmental efficiency variations: A nutrient balance approach. Ecol. Econ. 2013, 86, 37–46. [Google Scholar] [CrossRef]
- Van Meensel, J.; Lauwers, L.; Guido, V.H.; Van Passel, S. Comparing frontier methods for economic-environmental trade-off analysis. Eur. J. Oper. Res. 2010, 207, 1027–1040. [Google Scholar] [CrossRef]
- Reinhard, S.; Lovell, C.A.K.; Thijssen, G.J. Environmental efficiency with multiple environmentally detrimental variables; estimated with SFA and DEA. Eur. J. Oper. Res. 2000, 121, 287–303. [Google Scholar] [CrossRef]
- Lu, J.; Li, B.; Li, H.; Zhang, X. Characteristics, exchange experience, and environmental efficiency of mayors: Evidence from 273 prefecture-level cities in China. J. Environ. Manag. 2020, 255, 109916. [Google Scholar] [CrossRef]
- Qi, C.; Choi, Y. A Study of the Feasibility of International ETS Cooperation between Shanghai and Korea from Environmental Efficiency and CO2 Marginal Abatement Cost Perspectives. Sustainability 2019, 11, 4468. [Google Scholar] [CrossRef]
- Wang, D.; Wan, K.; Yang, J. Measurement and evolution of eco-efficiency of coal industry ecosystem in China. J. Clean. Prod. 2019, 209, 803–818. [Google Scholar] [CrossRef]
- Zheng, J.; Zhang, H.; Xing, Z. Re-Examining Regional Total-Factor Water Efficiency and Its Determinants in China: A Parametric Distance Function Approach. Water 2018, 10, 1286. [Google Scholar] [CrossRef]
- Bai, Y.; Deng, X.; Zhang, Q.; Wang, Z. Measuring environmental performance of industrial sub-sectors in China: A stochastic metafrontier approach. Phys. Chem. Earth 2017, 101, 3–12. [Google Scholar] [CrossRef]
- Robaina-Alves, M.; Moutinho, V.; Macedo, P. A new frontier approach to model the eco-efficiency in European countries. J. Clean. Prod. 2015, 103, 562–573. [Google Scholar] [CrossRef]
- Zhou, Y.H.; Zhang, X.H.; Tian, X.; Geng, X.H.; Zhang, P.; Yan, B.J. Technical and environmental efficiency of hog production in China—A stochastic frontier production function analysis. J. Integr. Agric. 2015, 14, 1069–1080. [Google Scholar] [CrossRef]
- Zhang, Y.; Shen, L.Y.; Shuai, C.Y.; Bian, J.; Zhu, M.C.; Tan, Y.T.; Ye, G. How is the environmental efficiency in the process of dramatic economic development in the Chinese cities? Ecol. Indic. 2019, 98, 349–362. [Google Scholar] [CrossRef]
- Long, X.L.; Wu, C.; Zhang, J.J.; Zhang, J. Environmental efficiency for 192 thermal power plants in the Yangtze River Delta considering heterogeneity: A metafrontier directional slacks-based measure approach. Renew. Sustain. Energy Rev. 2018, 82, 3962–3971. [Google Scholar] [CrossRef]
- Martin-Gamboa, M.; Iribarren, D.; Dufour, J. Environmental impact efficiency of natural gas combined cycle power plants: A combined life cycle assessment and dynamic data envelopment analysis approach. Sci. Total Environ. 2018, 615, 29–37. [Google Scholar] [CrossRef]
- Xing, Z.C.; Wang, J.G.; Zhang, J. Expansion of environmental impact assessment for eco-efficiency evaluation of China’s economic sectors: An economic input-output based frontier approach. Sci. Total Environ. 2018, 635, 284–293. [Google Scholar] [CrossRef]
- Cecchini, L.; Venanzi, S.; Pierri, A.; Chiorri, M. Environmental efficiency analysis and estimation of CO2 abatement costs in dairy cattle farms in Umbria (Italy): A SBM-DEA model with undesirable output. J. Clean. Prod. 2018, 197, 895–907. [Google Scholar] [CrossRef]
- Halkos, G.E.; Polemis, M.L. The impact of economic growth on environmental efficiency of the electricity sector: A hybrid window DEA methodology for the USA. J. Environ. Manag. 2018, 211, 334–346. [Google Scholar] [CrossRef]
- Wang, K.; Wei, Y.M.; Huang, Z.M. Environmental efficiency and abatement efficiency measurements of China’s thermal power industry: A data envelopment analysis based materials balance approach. Eur. J. Oper. Res. 2018, 269, 35–50. [Google Scholar] [CrossRef]
- Chen, L.; Jia, G. Environmental efficiency analysis of China’s regional industry: A data envelopment analysis (DEA) based approach. J. Clean. Prod. 2017, 142, 846–853. [Google Scholar] [CrossRef]
- Sueyoshi, T.; Yuan, Y. China’s regional sustainability and diversified resource allocation: DEA environmental assessment on economic development and air pollution. Energy Econ. 2015, 49, 239–256. [Google Scholar] [CrossRef]
- Yang, L.; Ouyang, H.; Fang, K.; Ye, L.; Zhang, J. Evaluation of regional environmental efficiencies in China based on super-efficiency-DEA. Ecol. Indic. 2015, 51, 13–19. [Google Scholar] [CrossRef]
- Brouwer, R.O.Y.; Tesfaye, A.; Pauw, P. Meta-analysis of institutional-economic factors explaining the environmental performance of payments for watershed services. Environ. Conserv. 2011, 38, 380–392. [Google Scholar] [CrossRef]
- Charnes, A.; Cooper, W.W. Preface to topics in data envelopment analysis. Ann. Oper. Res. 1985, 2, 59–94. [Google Scholar] [CrossRef]
- Grossman, G.M.; Krueger, A.B. Environmental Impacts of a North American Free Trade Agreement; National Bureau of Economic Research: Cambridge, MA, USA, 1991. [Google Scholar]
- Bhattarai, M.; Hammig, M. Institutions and the environmental Kuznets Curve for deforestation: A crosscountry analysis for Latin America, Africa and Asia. World Dev. 2001, 29, 995–1010. [Google Scholar] [CrossRef]
- Dinda, S. Environmental Kuznets Curve hypothesis: A survey. Ecol. Econ. 2004, 49, 431–455. [Google Scholar] [CrossRef]
- Kaika, D.; Zervas, E. The Environmental Kuznets Curve (EKC) theory-Part A: Concept, causes and the CO2 emissions case. Energy Policy 2013, 62, 1392–1402. [Google Scholar] [CrossRef]
- Apergis, N.; Ozturk, I. Testing Environmental Kuznets Curve hypothesis in Asian countries. Ecol. Indic. 2015, 52, 16–22. [Google Scholar] [CrossRef]
- Panayotou, T. Empirical Tests and Policy Analysis of Environmental Degradation at Different Stages of Economic Development; Technology and Employment Programme, International Labor Office: Geneva, Switzerland, 1991. [Google Scholar]


| Component | Initial Eigenvalues | Extraction Sums of Squared Loadings | ||||
|---|---|---|---|---|---|---|
| Total | % of Variance | Cumulative % | Total | % of Variance | Cumulative % | |
| 1 | 10.8 | 51.5 | 51.5 | 10.8 | 51.5 | 51.5 |
| 2 | 3.7 | 17.4 | 68.9 | 3.7 | 17.4 | 68.9 |
| 3 | 2.9 | 13.9 | 82.8 | 2.9 | 13.9 | 82.8 |
| 4 | 1.3 | 6.0 | 88.8 | 1.3 | 6.0 | 88.8 |
| 5 | 0.7 | 3.6 | 92.4 | 0.7 | 3.6 | 92.4 |
| 6 | 0.5 | 2.4 | 94.8 | |||
| 7 | 0.3 | 1.5 | 96.2 | |||
| 8 | 0.3 | 1.3 | 97.6 | |||
| 9 | 0.2 | 1.0 | 98.5 | |||
| 10 | 0.1 | 0.6 | 99.1 | |||
| 11 | 0.1 | 0.3 | 99.4 | |||
| 12 | 0.1 | 0.3 | 99.7 | |||
| 13 | 0.0 | 0.1 | 99.8 | |||
| 14 | 0.0 | 0.1 | 99.9 | |||
| 15 | 0.0 | 0.1 | 100.0 | |||
| 16 | 0.0 | 0.0 | 100.0 | |||
| 17 | 0.0 | 0.0 | 100.0 | |||
| 18 | 0.0 | 0.0 | 100.0 | |||
| 19 | 0.0 | 0.0 | 100.0 | |||
| 20 | 0.0 | 0.0 | 100.0 | |||
| 21 | 0.0 | 0.0 | 100.0 | |||
| Year | Statistics | DO | Fac 1 | Fac 2 | Fac 3 | Fac 4 | Fac 5 |
|---|---|---|---|---|---|---|---|
| 2011 | Mean | 0.6774 | 0.9123 | 0.6229 | 0.8495 | 0.8983 | 0.8342 |
| S.D. | 0.0676 | 0.1667 | 0.0661 | 0.0655 | 0.0841 | 0.0400 | |
| Max | 0.7630 | 0.9795 | 0.6863 | 0.9007 | 1.0000 | 0.8881 | |
| Min | 0.5417 | 0.5000 | 0.5000 | 0.7445 | 0.7322 | 0.7679 | |
| 2012 | Mean | 0.7307 | 0.9830 | 0.7157 | 0.8828 | 0.7993 | 0.7713 |
| S.D. | 0.0708 | 0.0050 | 0.0691 | 0.0792 | 0.0640 | 0.0430 | |
| Max | 0.8306 | 0.9922 | 0.7998 | 1.0000 | 0.9204 | 0.8318 | |
| Min | 0.6380 | 0.9752 | 0.6044 | 0.7475 | 0.7178 | 0.6969 | |
| 2013 | Mean | 0.6748 | 0.9892 | 0.7068 | 0.8419 | 0.7914 | 0.6867 |
| S.D. | 0.1297 | 0.0049 | 0.0729 | 0.0873 | 0.0646 | 0.1232 | |
| Max | 0.8278 | 1.0000 | 0.8199 | 0.9772 | 0.9042 | 0.8744 | |
| Min | 0.5000 | 0.9835 | 0.6202 | 0.6997 | 0.7124 | 0.5000 | |
| 2014 | Mean | 0.7913 | 0.9823 | 0.6872 | 0.8160 | 0.6852 | 0.7456 |
| S.D. | 0.0844 | 0.0030 | 0.0675 | 0.0761 | 0.0492 | 0.0893 | |
| Max | 0.8972 | 0.9864 | 0.8010 | 0.9388 | 0.7607 | 0.9277 | |
| Min | 0.6722 | 0.9777 | 0.5756 | 0.6769 | 0.6184 | 0.6191 | |
| 2015 | Mean | 0.8192 | 0.9747 | 0.7361 | 0.8607 | 0.6047 | 0.8271 |
| S.D. | 0.1185 | 0.0033 | 0.0608 | 0.0769 | 0.0644 | 0.0869 | |
| Max | 1.0000 | 0.9812 | 0.8296 | 0.9681 | 0.7022 | 0.9578 | |
| Min | 0.7204 | 0.9717 | 0.6160 | 0.7066 | 0.5000 | 0.6957 | |
| 2016 | Mean | 0.7945 | 0.9756 | 0.8118 | 0.7605 | 0.7109 | 0.8378 |
| S.D. | 0.1081 | 0.0096 | 0.1014 | 0.1194 | 0.0756 | 0.0900 | |
| Max | 0.9685 | 0.9849 | 1.0000 | 0.8752 | 0.8447 | 1.0000 | |
| Min | 0.6815 | 0.9590 | 0.7060 | 0.5257 | 0.6152 | 0.7107 | |
| 2017 | Mean | 0.7341 | 0.9743 | 0.8667 | 0.7652 | 0.7937 | 0.8611 |
| S.D. | 0.0679 | 0.0081 | 0.0867 | 0.1078 | 0.0801 | 0.0701 | |
| Max | 0.8593 | 0.9852 | 0.9980 | 0.8651 | 0.9122 | 0.9545 | |
| Min | 0.6750 | 0.9621 | 0.7681 | 0.5268 | 0.6670 | 0.7925 | |
| 2018 | Mean | 0.7244 | 0.9758 | 0.8265 | 0.7281 | 0.7793 | 0.8216 |
| S.D. | 0.0683 | 0.0082 | 0.0868 | 0.1023 | 0.0782 | 0.0731 | |
| Max | 0.8111 | 0.9860 | 0.9676 | 0.8005 | 0.8994 | 0.9326 | |
| Min | 0.6204 | 0.9623 | 0.7376 | 0.5000 | 0.6323 | 0.7172 |
| Variable | Mean | Std. Deviation | t stat | Sig. |
|---|---|---|---|---|
| Permanganate Index | 0.790 | 0.118 | −1.662 | 0.104 |
| Biochemical Oxygen Demand | 0.951 | 0.063 | −1.669 | 0.102 |
| Ammonia Nitrogen | 0.949 | 0.066 | 0.251 | 0.803 |
| Petro | 0.913 | 0.074 | 1.020 | 0.313 |
| Volatile Phenol | 0.990 | 0.062 | −0.856 | 0.397 |
| Mercury | 0.992 | 0.063 | 0.631 | 0.531 |
| Lead | 0.979 | 0.061 | −2.870 | 0.006 |
| Chemical Oxygen Demand | 0.682 | 0.093 | −0.395 | 0.695 |
| Total Nitrogen | 0.776 | 0.075 | −0.416 | 0.679 |
| Total Phosphorus | 0.759 | 0.100 | 2.398 | 0.021 |
| Copper | 0.992 | 0.063 | 0.661 | 0.512 |
| Zinc | 0.988 | 0.062 | 1.972 | 0.055 |
| Fluoride | 0.832 | 0.117 | 2.201 | 0.033 |
| Selenium | 0.879 | 0.082 | 2.628 | 0.012 |
| Arsenic | 0.972 | 0.061 | −0.495 | 0.623 |
| Cadmium | 0.992 | 0.063 | −1.686 | 0.099 |
| Hexavalent Chromium | 0.568 | 0.110 | 0.604 | 0.549 |
| Cyanide | 0.568 | 0.133 | −0.784 | 0.437 |
| Anionic Surfactant | 0.608 | 0.100 | 0.554 | 0.582 |
| Sulfide | 0.665 | 0.215 | 0.706 | 0.484 |
| Fecal Coliform | 0.720 | 0.132 | −1.004 | 0.321 |
| Variable | Unstandardized Coefficients | Standardized Coefficients Beta | t stat | Sig. | |
|---|---|---|---|---|---|
| B | Std. Error | ||||
| Constant | 2.387 | 0.428 | / | 5.575 | 0 |
| GP | 1.03 × 10⁻⁶ | 0 | 0.72 | 5.099 | 0 |
| TI | 0.002 | 0.001 | 0.377 | 2.611 | 0.026 |
| PD | −0.011 | 0.003 | −0.583 | −4.091 | 0.002 |
| CI | 4.88 × 10⁻⁸ | 0 | 0.444 | 3.88 | 0.003 |
| NE | 2.36 × 10⁻⁵ | 0 | 0.64 | 6.55 | 0 |
© 2020 by the authors. Licensee MDPI, Basel, Switzerland. This article is an open access article distributed under the terms and conditions of the Creative Commons Attribution (CC BY) license (http://creativecommons.org/licenses/by/4.0/).
Share and Cite
Dong, J.; Wu, D. An Evaluation of the Impact of Ecological Compensation on the Cross-Section Efficiency Using SFA and DEA: A Case Study of Xin’an River Basin. Sustainability 2020, 12, 7966. https://doi.org/10.3390/su12197966
Dong J, Wu D. An Evaluation of the Impact of Ecological Compensation on the Cross-Section Efficiency Using SFA and DEA: A Case Study of Xin’an River Basin. Sustainability. 2020; 12(19):7966. https://doi.org/10.3390/su12197966
Chicago/Turabian StyleDong, Junran, and Desheng Wu. 2020. "An Evaluation of the Impact of Ecological Compensation on the Cross-Section Efficiency Using SFA and DEA: A Case Study of Xin’an River Basin" Sustainability 12, no. 19: 7966. https://doi.org/10.3390/su12197966
APA StyleDong, J., & Wu, D. (2020). An Evaluation of the Impact of Ecological Compensation on the Cross-Section Efficiency Using SFA and DEA: A Case Study of Xin’an River Basin. Sustainability, 12(19), 7966. https://doi.org/10.3390/su12197966


