1. Introduction
The emergence of COVID-19 has been affecting the consumption patterns of individuals’ world widely, especially in high-density city areas. Online shopping becomes a priority in contrast to the traditional offline shopping in order to avoid physical contact. Among the various online shopping modes, the food delivery industry is developing rapidly. On the one hand, more and more customers tend to order food online and have food delivery at home for convenience. On the other hand, a growing number of restaurants are providing food delivery service with abundant choices of food varieties. Moreover, the development of digital transaction platform has promoted the development of the food delivery industry significantly. Indeed, the food delivery industry is a variant of e-commerce economy, in which the logistics service plays a vital role affecting the customer satisfaction level substantially [
1]. The development of the food delivery industry has not only changed the consumption habits of individuals, but also increased a number of employment opportunities. It is reported that the daily number of food delivery orders in Meituan Takeout, one of the largest food delivery enterprises in China, is around 15 million, and the number of deliverymen of Meituan Takeout has been over 3.98 million, so as to provide satisfying food delivery services.
The food delivery industry possesses a variety of unique features and characteristics in comparison with other e-commerce industries. First of all, the number of food delivery orders is generally on a large scale, and the demand distribution of food delivery orders varies dramatically in different time periods and regions. Secondly, the food delivery industry is highly labor-intensive, in which maintaining a great number of employees is necessary to ensure the on-time delivery performance. Thirdly, the requirement of on-time delivery is extremely strict in the food delivery industry, as the products in the food delivery industry are highly perishable [
2]. The time requirement from online ordering to offline delivery is commonly within one hour. Such a short delivery time requirement challenges the decision-making process of food delivery operations. Moreover, due to the necessity of direct contact with customers, customer experience is a vital factor determining the development of the food delivery industry. In addition, the common operations of the food delivery process comprise two major consecutive steps. The first step is to assign a number of orders among multiple employees after online ordering. The second step is to plan the delivery tour for each specific order in view of the order location and time requirements. As the latter operations are commonly achieved using commercial navigation softwares, the operations in the first step, i.e., order assignment, become critical and affect the entire delivery performance.
The order assignment problem deals with the match between customer orders and available employees intrinsically. In the food delivery industry, customer orders are rather similar given that they all involve the dispatch of small packages within a radius of several miles. By contrast, the workforce scheduling and management are of high complexity in view of the individual performance variance under different conditions. In practice, the operational performance of an individual employee is affected by a variety of factors, which can be classified generally into two categories, i.e., deteriorating effects and learning effects [
3]. For instance, the delivery performance of an individual employee may drop if too many orders are assigned to him within a short time period. Concerning the learning effects, it is well acknowledged that the working proficiency of the newly recruited employees can increase significantly after a period of training. The working capability of employees varies at individual level in terms of different working attitudes and conditions. Moreover, employee turnover and recruitment frequently occur in the food delivery industry, which further complicates the employee scheduling and management. It is acknowledged that proper workforce management can benefit the sustainable development of labor-intensive corporates substantially, and corporates are obligated to improve the welfare of their employees as well [
4].
In this research, in order to achieve the optimal performance of order assignment and employee management, a multi-objective non-linear optimization model is proposed aiming to minimize the overall operational cost in multiple periods and balance the workload among multiple employees. Both the deteriorating effects and learning effects are taken into account, so as to acquire the practical and reasonable solutions. Linearization procedures are designed to solve the non-linear objective and constraints, while normalization operations are implemented to integrate the two objectives. Furthermore, the proposed model is converted to a standardized mix-integer linear model, which can be easily solved using commercial optimization softwares. The optimal solutions indicate that the variance of employee operational performance can affect the entire delivery performance substantially, and significant improvement of workload balancing can be achieved at the price of slight increase of operational cost.
The contribution of this research is two-fold. First, this research can be regarded as a pioneering study concerning the workforce scheduling and management in the food delivery industry, especially taking into account the deteriorating and learning effects on individual operational performance. To the best of our knowledge, few studies have been conducted in this industrial area. This study can enrich the scientific knowledge base regarding the workforce management in labor-intensive service-oriented industries. Second, the results and findings in this research can facilitate the decision-making process and improve the overall performance of corporate operations. Decision-makers are supposed to pay more attention to the workload discrepancy among multiple employees as the relative workload balancing can contribute to the improved welfare and loyalty of employees and can be achieved at a cost of a slight increase of operational cost.
The rest of this paper is organized as follows. After a brief introduction of the order assignment problem in the food delivery industry, related literatures are reviewed in
Section 2. The mathematical formulation for the proposed problem is presented in
Section 3. Then, a number of numerical experiments are conducted in
Section 4, including model validation and sensitivity analysis. After that,
Section 5 concludes this research describing the research results and further research directions.
2. Literature Review
The workforce management is a necessary and essential component of business administration in almost all industries, which affects the overall industrial performance. However, the representation of workforce performance varies in different industries and contexts. Hence, this section investigates the workforce management related literatures from the industrial perspectives, as follows.
Workforce planning is the second priority in addition to the machine scheduling in production industries, concerning different application scenarios. For example, Berman et al. [
5] introduced a workforce and workflow scheduling model in high volume factories. Lee and Vairaktarakis [
6] addressed the workforce planning problem in both serial assembly lines and mixed mode transfer lines. Vairaktarakis et al. [
7] formulated the workforce planning problem in synchronous production systems. Moreover, workforce capability and flexibility variances are gradually taken into account in production scenarios. Sabar et al. [
8] explored the personnel arrangement in a paced multi-product assembly center, which takes into consideration the individual competencies and preferences, and the competency requirements associated with each assembly activity. Sánchez and Torres [
9] studied a hand-intensive production flow-shop scheduling problem with variable worker productivity. Gong et al. [
10] introduced a flexible job shop scheduling problem with worker flexibility considerations and designed a new memetic algorithm to solve the corresponding problem. Furthermore, some review literatures concerning the workforce scheduling in product-oriented industries have been conducted. Ernst et al. [
11] investigated the staff scheduling and rostering problem in view of different problem classification and models, application areas, and solution methods. Van den Bergh et al. [
12] reviewed the personnel scheduling in a comprehensive and extensive manner including multiple application fields and technical features. Montoya-Torres et al. [
13] conducted a literature-based assessment of human factor consideration in shop scheduling problems.
In contrast, the employee scheduling and management in service-oriented industries emerges are relatively new, which is in consistent with the development of social economy. In comparison with the product-oriented industries, employee scheduling in service-oriented industries are of more diversity, flexibility, and complexity. On the one hand, the skill levels of employees are taken into account in order to meet the requirements of some specific tasks. Valls et al. [
14] introduced a skilled workforce project scheduling problem in a service company, which takes into account the urgency level of critical tasks and specialist worker with efficient operational levels. Fırat and Hurkens [
15] presented a task scheduling problem, in which complex tasks have multi-level skill requirements and technicians have varied capabilities. Cuevas et al. [
16] proposed a mixed integer programming approach to handle the multi-skilled workforce scheduling problem in service industry and concluded that employee multi-skilling is a significant source of labor flexibility to improve the coverage of labor requirements. On the other hand, the employee flexibility is commonly processed in terms of full-time contract and part-time employment. For example, Ağralı, Taşkın and Ünal [
3] introduced an employee scheduling model in service industry, in which the flexible employ availability is considered in terms of different contract forms and employee rostering is also incorporated. In addition to the settings of different skills and flexibility, Othman et al. [
17] designed a multi-objective mixed integer programming model for workforce scheduling incorporating multiple human aspects, such as skills, training, fatigue, and recovery, into consideration, and identified that worker differences consideration in workforce scheduling can help to generate realistic plans with minimum costs.
Among the various employee scheduling and management models in service-oriented industries, driver behavior management in logistics industry is of the most closeness with the employee management in this research. In logistics delivery industry, driver behaviors can be affected by multiple factors and lead to different operational performance. The effect of driver behavior variance has been studied mainly in the context of logistics delivery. For example, Arentze et al. [
18] examined the route choice behaviors of truck drivers considering various road attributes and pricing policies. Elbert et al. [
19] evaluated the effects of human behavior on the routing efficiency of order picking in a warehouse in terms of the frequently observe route deviation. Moussavi et al. [
20] designed a metaheuristic approach to handle the integration of worker assignment and vehicle routing problems in the context of home healthcare scheduling. Besides that, more and more researchers tend to understand and analyze the driver behaviors using different approaches. For instance, Yue et al. [
21] applied machine learning techniques to predict the routing behavior of drivers considering different route preferences. Lima et al. [
22] investigated the individual routing behaviors in cities by analyzing the collected GPS trajectories describing the movement of personal cars and suggested that a significant fraction of driver routes are not consistent with cost minimization assumption. More literature concerning driver behavior considerations can be found in a related survey paper [
23].
To sum up, in product-oriented industries, the emphasis of operations optimization still relies on the machine scheduling and resource management. Although workforces sometimes are treated as a category of resources, their capability and performance are commonly predetermined referring to different application scenarios. In contrast, employees are the most important component in service-oriented industries determining the overall performance. A large number of studies have been conducted to investigate and understand the individual behaviors as well. However, the aspects of employee behavior variance that have been examined are mainly from the perspective of psychological analysis and cognitive progress. Few studies of incorporating employee behavior and operations management have been conducted. The most approximate application scenarios to this research is the driver behavior incorporation in vehicle scheduling in logistics industries. However, in comparison with the driver management in logistics industries, the order assignment in the food delivery industry is more complicated as it has more stringent constraints in view of the special requirements of both products and employees. Our investigation shows that little empirical research concerning the integration of employee behavior variance and operations optimization has been conducted in the food delivery industry, not to mention the integration of various deteriorating and learning effects on individual performance variety, which motivates this research. This research can enrich the knowledge body of related theoretical research and provide practical implications for the sustainable development of the food delivery industry.
3. Problem Formulation
The food delivery order allocation among multiple riders indeed is a practical extension of the standard task assignment problem (AP). In AP, there are
tasks to be processed by
persons, and a processing cost,
, occurs when task
is assigned to person
. The objective is to find the optimal assignment policy which minimizes the overall operational cost. The mathematical model for task assignment problem is as follows, in which the binary decision variable
denotes the assignment of task
to person
. Two constraints indicate that one person can process one task and all tasks have to be processed correspondingly.
In contrast to the standard task assignment problem, the food delivery industry possesses different features and characteristics. First of all, the food delivery industry is of high labor-intensive, in which a large volume of orders needs to be assigned to a number of riders in a short time. Secondly, the order performance of riders varies in view of their working conditions and personal capability. The operational efficiency of riders may fall if too many orders are assigned to one rider in a short time period. Thirdly, the service capability of riders can advance after some training in the long run. Moreover, employee turnover and recruitment are frequently observed due to uneven distribution of seasonal market demand.
In this research, two objectives are taken into account. The first objective is to minimize the total operational cost considering the variable productivity, which is due to the consideration of performance deterioration when too many orders are assigned to one rider. The second objective is to balance the workload among different riders, which is designed to guarantee the minimum income for all riders.
In view of the features of the food delivery industry, the following assumptions are introduced.
- (1)
Order differentiation is not considered in this research as most of the delivered food cases are prepared and delivered in similar packages, and delivery radius is within a certain range.
- (2)
Order consolidation is not considered, which is not the focus of this research and can actually be treated as one unit if that occurs.
- (3)
The location constraints and time requirements concerning each order are neglected, and a rider can accomplish his/her assigned orders satisfying corresponding constraints.
- (4)
Each rider has different operational capability and service capacity. The operational capability drops if the number of orders assigned to one rider within a specified period exceeds a predetermined threshold, which results in an increase of delivery cost and time.
- (5)
Workforce turnover and recruitment are processed after a certain amount of periods, and the operational capability of newly recruited riders can be improved after training.
The notations are summarized as follows.
, the set of periods
, the set of orders in period
, the set of riders in period comprising two sub set, i.e., the set of beginners and the set of skilled riders.
, the service capacity of rider in terms of the number of orders in period .
, the maximum workable time length of rider in period .
, a predetermined productivity threshold of rider in case of performance deterioration.
, the standard operational capability of rider to process an order in period in terms of the required time consumption per order.
, the actual operational capability of rider to process an order in period in terms of the required time consumption per order.
, the processing cost for rider to handle an order in period .
The decision variables are listed as follows.
Binary decision variables, , denotes whether order is assigned to rider or not in period .
Integer decision variables, , denotes the number of orders assigned to rider in period .
Integer decision variables, , denotes the number of newly recruited riders at the beginning of period h.
Integer decision variables, , denotes the number of skilled riders at the beginning of period .
The completed mathematical models are presented as follows.
The first objective is to minimize the total processing cost, whilst the second objective is to balance the workload among multiple riders. Constraint (1) indicates that an order can only be processed by one rider. Constraint (2) means all the orders in each period must be assigned. Constraint (3) calculates the number of orders assigned to each specific rider. Constraint (4) denotes that the number of orders assigned to one rider cannot exceed his/her service capacity. Constraint (5) determines the productivity threshold, after which the performance of riders deteriorates. Constraint (6) calculates the productivity rate changes in case of performance deterioration. Constraint (7) informs that the maximum allowable work time for riders cannot be violated. Constraint (8) indicates the sum of orders processed by both beginners and skilled riders should be more than the total orders in each period. Constraint (9) means the set of riders in each period is comprised of the beginner riders and skilled riders. Constraint (10) calculates the number of skilled riders at the beginning of each period, which is the sum of the remaining skilled riders from last period and the new recruited riders in last period. Constraint (11) represents the role transformation from beginners to skilled riders after training. Constraint (12) describes the feature of decision variables. Constraint (13) is the settings of related parameters, among which is the threshold setting parameter, is the rider turnover rate, is the productivity deterioration rate due to too much workload, and is the productivity improvement rate due to training.
Solving Procedures
The introduction of piecewise linear function as constraint (6) and the absolute value expression as the second objective increases the complexity of the proposed model significantly in comparison with the traditional task assignment model. Moreover, the two objectives are not the same scale, which cannot be simply summated. Therefore, additional procedures need to be designed to handle the nonlinear consideration and multi-objective issues.
Regarding the constraint (6), the performance of riders deteriorates once the assigned order to a ride surpasses his/her service capacity. As mentioned previously, for each rider, there is a predeterminate threshold setting related to his/her maximum service capacity. Herein, additional binary variables,
are introduced.
is a positive big integer number.
With respect to the absolute value expression in the second objective function, additional auxiliary variables,
are introduced to represent the absolute value expressions.
Hence, two more constraints are added.
Therefore, the second objective function can be converted as follows.
Concerning the integration of two objectives with different scales, normalization operations are applied in this research as follows.
In order to strengthen the interval of difference and simplify the calculation,
is set as the optimal objective function value provided that only the first objective is considered when solving the proposed model, while
is designed as the objective function value on condition that all the orders are evenly assigned to all riders. As for the second objective,
indeed can be simply treated as zero considering the evenly distribution of orders among all riders.
is set as the practical value corresponding to the optimal solution associated with
. Thus, the proposed model can be rewritten as follows.
4. Numerical Experiments
In this section, numerical experiments are conducted to examine and validate the effectiveness of the proposed model. The test data instances are generated as follows. Referring to the practical scenarios, one period is assumed as one day, and the maximum permitted time length for employees is 8 h per day regardless of their work proficiency. The number of orders per period are uniformly distributed as . Regarding the different work proficiency among multiple riders, two categories of employees are assumed, i.e., beginner riders and skilled riders. For skilled employees, their productivity is postulated to follow a normal distribution as , where the mean value is set as 20 min per order and variation is set as 4, whilst their operational cost follows a normal distribution as , where the average cost per order is 6 CNY. In contrast, the productivity and operational cost of beginners follow and respectively.
In each period, all predetermined orders have to be dispatched to either beginner or skilled employees. It is observed that the performance of employees drops if too many orders are assigned to one employee. In order to simulate that, it is presumed that the productivity of employees drops 20% for both skilled employees and beginners whenever their assigned workload exceeds 80% of their capacity per period. Besides that, a minimum number of orders per period assigned to skilled employees and beginners are set as 15 and 10 respectively aiming to guarantee the income for both skilled employees and beginners. Moreover, the employee turnover and recruitment occur at the end of each month, and the newly recruited employees need to be trained for one month before they become skilled employees. The employee turnover rate is set as 10%, and normally a beginner becomes a skilled employee after one-month training.
4.1. Comparison between Constant Productivity and Variable Productivity
In the first period, it is assumed that there are 200 orders to be dispatched and 10 skilled employees are available. Ten test instances are generated referring to the productivity distribution and cost distribution of skilled employees. The calculations are conducted in following steps. First of all,
and
are acquired when solving the proposed model with only the first objective function as shown in the
column. Then,
and
are obtained in case of solving the model with only the second objective function as presented in
column. After that, the upper bound and lower bound of the two individual objectives are input into the final model as supporting parameters to compute the optimal
and
. In contrast, the optimal values of
and
in case of constant productivity are also calculated. All the calculations are implemented using ILOG CPLEX 12.9 on a personal computer with a i7 CPU and 64GB RAM. All the test instances are solved within 1 s and the results are presented in
Table 1.
As shown in
Table 1, the observed maximal operational cost variance occurs with case 7 as
, whilst the observed maximal workload discrepancy emerges with case 2, 3 and 9 as
. Ideally, the
is supposed to be 0. However, the productivities of employees vary even though they follow the same distribution, which causes the frequent observed nonzero
. Besides that, the deterioration phenomenon exacerbates the workload discrepancy. Indeed, the operational cost discrepancy between
and
are less straightforward than the workload discrepancy between
and
, which means the solutions with minimum operational cost disproportion workload significantly. The employees with higher productivity tend to acquire more orders if the single economic objective is taken into account. The performance comparison between varied productivity and constant productivity scenarios in terms of the integrated objective shows that the workload discrepancy drops 12% at the cost of 0.22% increase of the operational cost. Such a result is favorable as the decision makers can achieve a better workload balance among multiple employees with small additional budget.
Figure 1a,b provides a more visualized understanding of the workload distribution among multiple employees. The productivity settings in this instance are as [19.43, 20.84, 18.40, 22.55, 17.47, 17.548, 21.30, 14.74, 21.98, 23.08] in sequence, whilst the unit cost settings are as [5.41, 7.01, 6.70, 5.56, 5.90, 4.56, 6.74, 5.41, 4.88, 6.26]. It is noticed that employee 8 has the highest productivity, which leads to the amount of assigned orders as 31, as shown in
Figure 1a. The workload discrepancy of three scenarios, i.e., min f1, min f2, and min f′, are 4.2, 0.0 and 1.4 respectively. Meanwhile, the corresponding operational cost are 1138.26, 1169.72 and 1153.43. The different between min f′ and min f″ shows the effect of varied productivity, in which the workload imbalance drops from 1.6 to 1.4 and the operational cost rises from 1151.25 to 1153.43. Such a difference occurs with employee ID 6 and 7 as one order is assigned to employee 7 instead of employee 6 due to the varied productivity as shown in
Figure 1b.
4.2. Sensitivity Analysis for Productivity Deterioration Threshold and Rate Settings
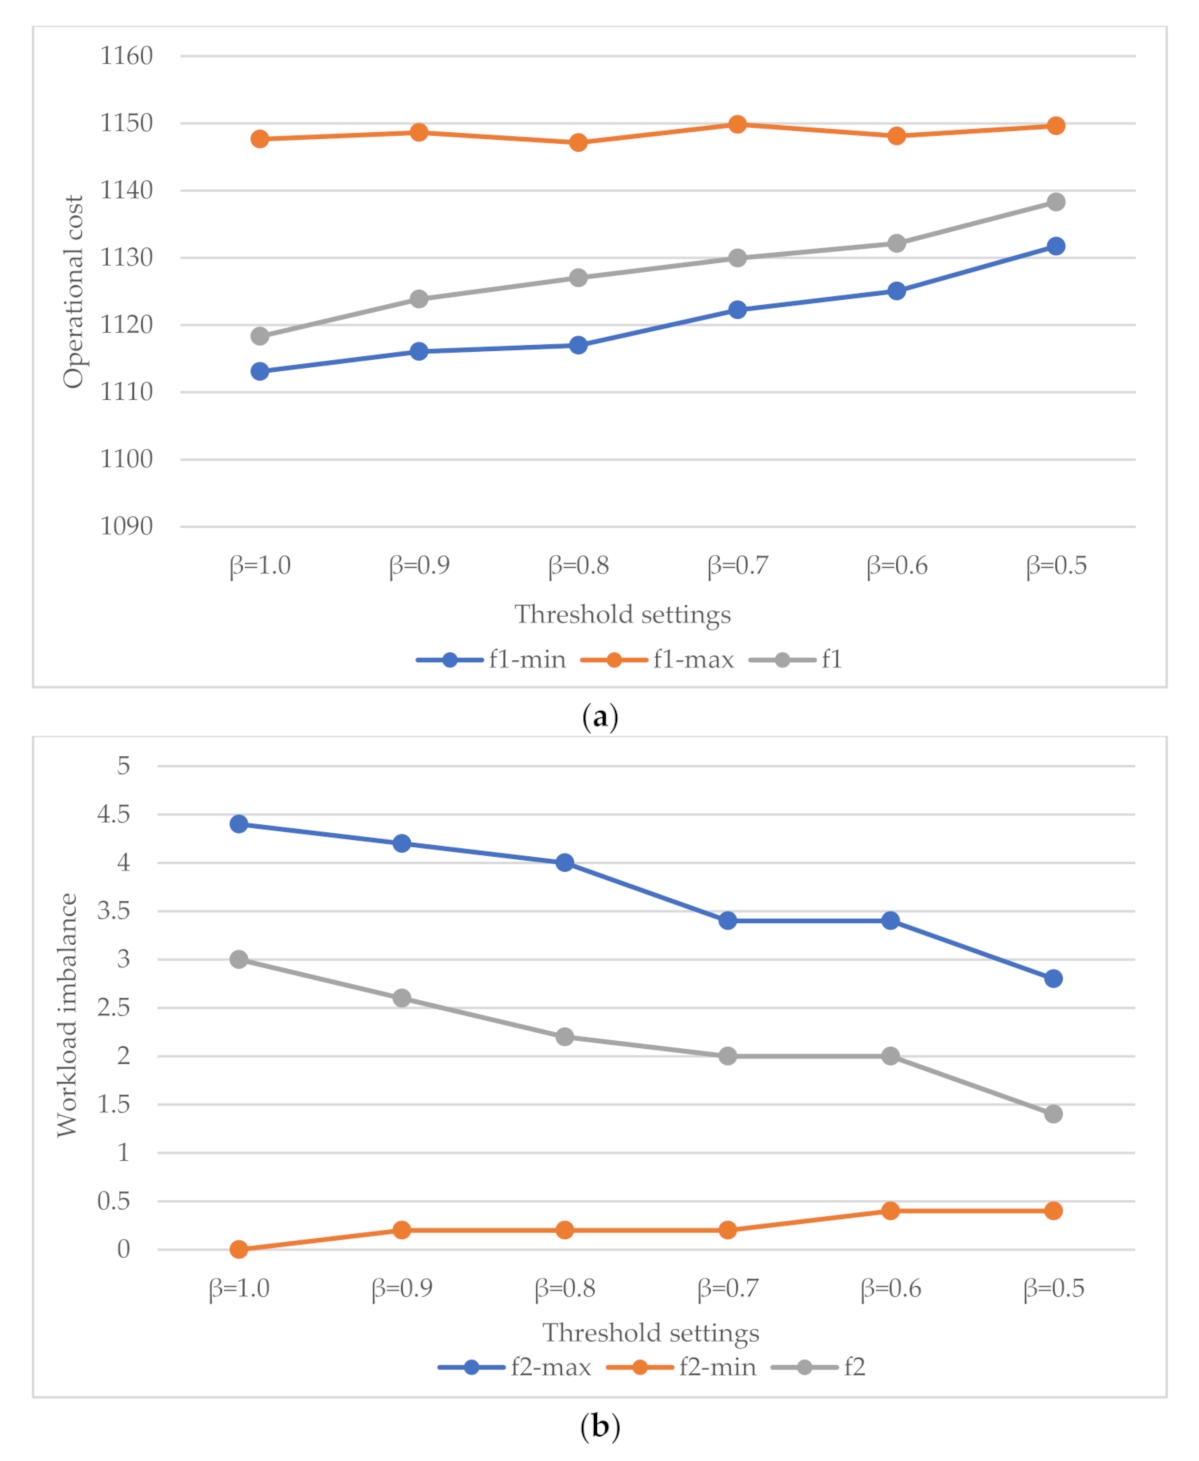
The threshold setting determines the criterion of productivity variance. Once the workload of assigned orders surpluses the predetermined threshold, the performance of employees drops by a ratio of deterioration rate. Different settings of threshold lead to different performance in terms of both operational cost and workload balancing as shown in
Figure 2a,b.
indicates that no deteriorating effect exists, whist
means the productivity of employees drops when the assigned orders exceed half of the corresponding service capacity. As shown in
Figure 2a, the operational cost gradually increases along with the decrease of the threshold setting, which is rather straightforward and understandable as the overall productivity drops with a small threshold setting. To be more specific, the operational cost in terms of f1 increases 1.79% when the threshold setting is changed from 1.0 to 0.5. By contrast, the workload imbalance drops in line with the changes of the threshold settings as shown in
Figure 2b. The workload discrepancies when
and
are 3.0 and 1.4 respectively. In general, the threshold settings contribute to the workload balancing among multiple employees. Another point that needs to be mentioned is that the introduction of threshold settings breaks the ideal workload balancing with the observation of f2-min changes in
Figure 2b.
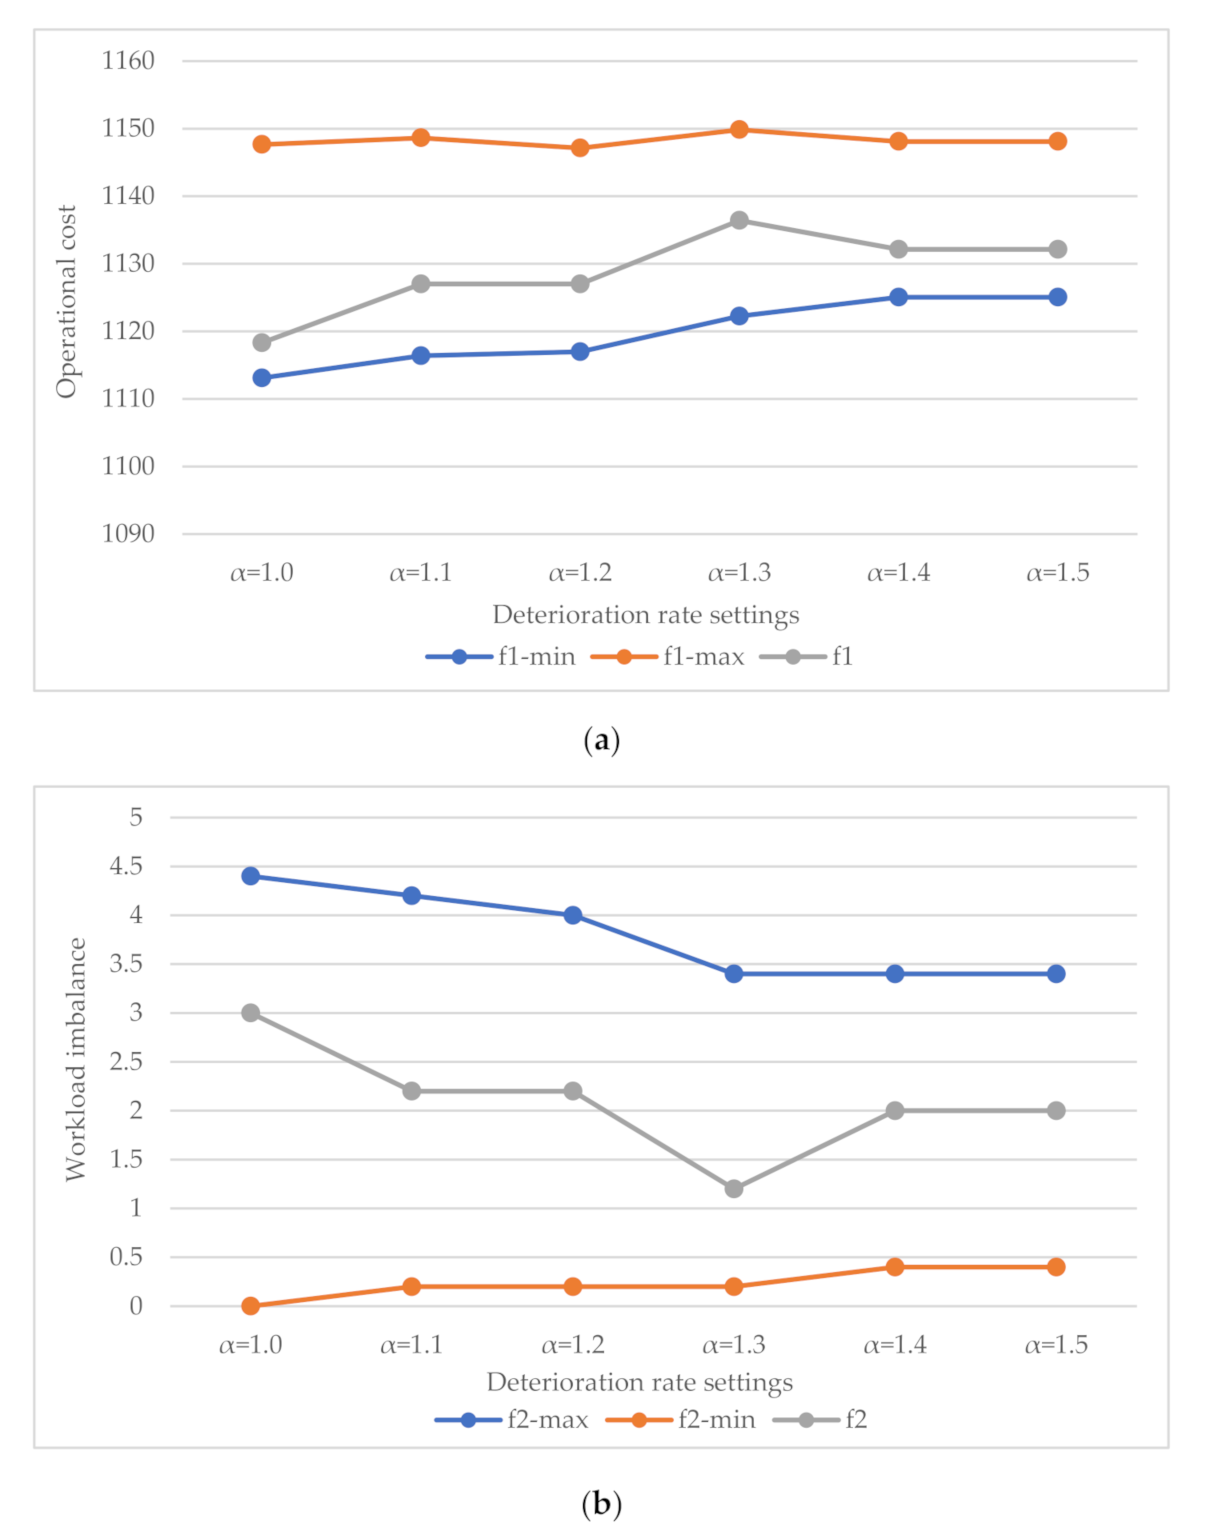
The settings of deterioration rate quantify the degree of the productivity decline. In this research, the productivity is presented in terms of the consumption time per order per employee. For instance, if
corresponds to the productivity of 20 min per order, then
equals the productivity of 30 min per order.
Figure 3a,b illustrates the operational cost variance and workload imbalance variance with different deterioration rate settings. Indeed,
implies that no deteriorating effect exists, which functions with the same effect as
. In general, the increase of the deterioration rate results in a slight increase in operational cost and a decrease in workload imbalance, which are 1.23% and 33.33%, respectively. In contrast to the effect of the deterioration threshold setting, the changes of deteriorating rate actually play a relatively minor role to the operational cost and workload balancing. Moreover, the workload imbalance fluctuates dramatically due to the combinatorial effect of the deterioration threshold and rate settings.
4.3. Examination of Multi-Period Effect Workforce Management
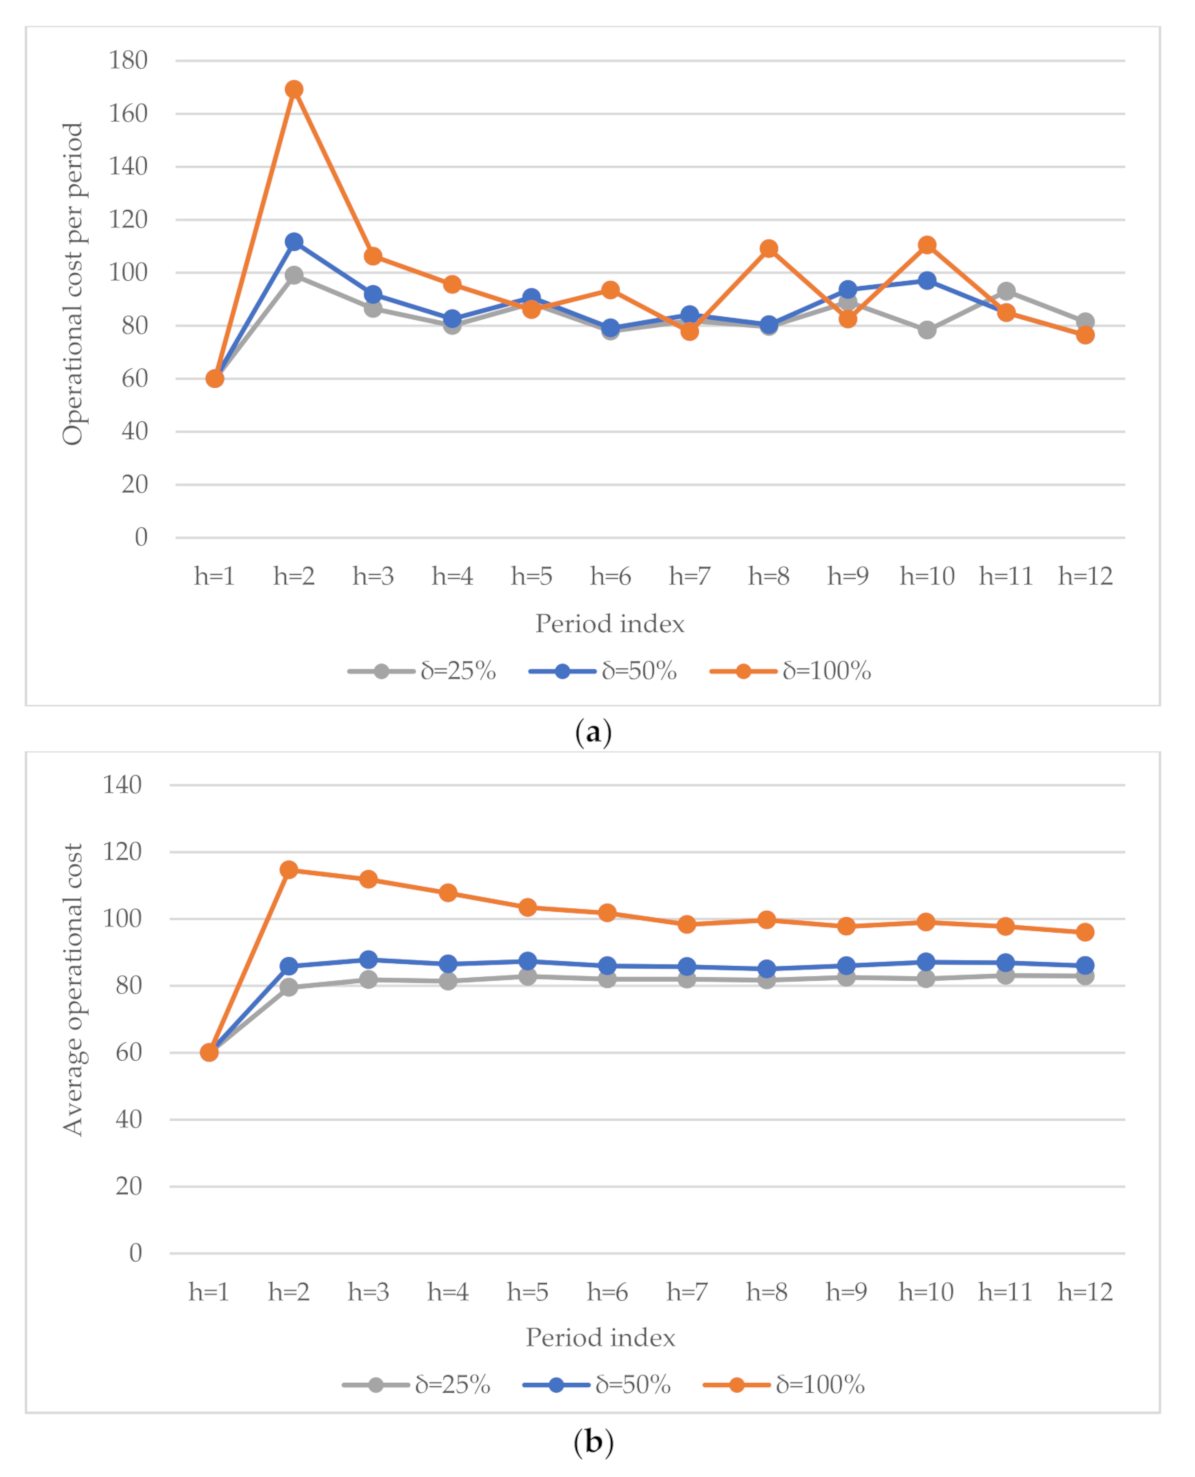
The food delivery industry is a labor-intensive industry of high workforce management complexity. The demand for food delivery service varies significantly in different periods leading to the workload imbalance among multiple employees and causing the frequently observed workforce turnover and recruitment. Moreover, the newly recruited employees need to be trained so as to achieve a better operational performance. In this section, instances with different turnover rate settings and training effect settings are examined to explore the performance of workforce management in multiple periods. The number of orders in different periods is assumed to follow uniform distribution as . In practical, one period is assumed to be one day, and commonly it takes around one month of training before a beginner becomes a skilled employee. However, in this case, to simplify the process, it is assumed that the training operation takes one period rather than one month. In other words, a newly recruited employee in this period becomes a skilled employee in next period. Referring to previous parameter settings, the productivity of beginners and skilled employees follows normal distribution as and , respectively, whilst the unit cost follows normal distribution as and , respectively.
Figure 4a,b illustrates the operational cost variance with different turnover rates in multiple periods. Apparently, a larger turnover rate gives rise to a more fluctuating performance in terms of operational cost, as shown in
Figure 4a. The average operational cost per period increases with the rise of turnover rate, as shown in
Figure 4b. To be more specific, the increase of turnover rate from 0.1 to 0.2 causes a 2.96% increase of the average operational cost, and another 2.85% increase is observed when the turnover rate increases from 0.2 to 0.3. Similar to the effect of the turnover rate settings, the introduction of a larger training effect also leads to a more volatile performance of operational cost as shown in
Figure 5a. A large setting of training effect indicates that there is a relatively large productivity gap between beginners and skilled employees. The operations of beginners are more costly with a larger training effect setting given that the performance of skilled employees is predetermined as a benchmark.
Figure 5b describes the changes of average operational cost with different training effects.
4.4. Summary
Traditional optimization of employee scheduling and management commonly postulates a constant performance concerning the capacity and operations of employees in various industries, which is applicable in high automated product-oriented industries. However, in labor-intensive service-oriented industries, productivity variance and workload discrepancy are two inevitable issues in employee scheduling and management. The numerical experiments show that the solely pursuit of economic goal can lead to a severely uneven distribution of workload, while the pursuit of absolute fairness can hamper the corporate development as well. By contrast, the integration of individual productivity variance and workload balancing can generate the most practical and rational solutions. Moreover, the results of threshold settings and deterioration rate settings suggest that proper rest and recovery mechanism could be taken into account to ameliorate the operational deterioration. Furthermore, the frequent employee turnover and recruitment can lead to an increased and fluctuated economic cost. Decision-makers are recommended to take actions to improve the employee loyalty and retention and increase the employee skills and capacity with more efficient and effective training approaches.
5. Conclusions
In this research, we have proposed a multi-objective optimization model to solve the order assignment problem in the food delivery industry with human factor considerations. Both the deteriorating and learning effects on individual performance variety are distinctly quantified and incorporated into the proposed model, so as to acquire the optimal order assignment solutions in practice. The numerical results prove that the performance variance of employees can affect the overall delivery performance substantially. Moreover, it is discovered that significant improvement of workload balancing among multiple employees can be achieved at the price of slight increase of the operational cost. This research can enrich the theoretical knowledge base concerning the workforce scheduling and management in service-oriented industries significantly, as most research in this area treat the operational capability and performance of employees as a constant or stable productivity, which is not suitable for labor-intensive service-oriented industries. Moreover, this research can offer valuable and practical implications facilitating the decision-making of food delivery industries. The incorporation of workload balancing and productivity variance into order assignment is beneficial to the sustainable development of food delivery industries in view of the welfare of employees and the social responsibilities of enterprises.
Despite much effort, it has not been possible to manage the order assignment and workforce management in the food delivery industry thoroughly and completely. There are still some limitations in this research. The most apparent limitation of this research lies in the quantitative measurements of deteriorating effect and learning effect. In this research, both the deteriorating and learning effects and are implemented using linear representations for simplicity. However, in practice, different formats could be tried so as to find the accurate and precise mathematical expressions. A second limitation concerns the parameter settings in the proposed model, which are mainly determined referring to personal experience and observation. Data analytic techniques could be applied in the future to analyze the cumulative historical dataset to fine-tune the parameter settings. Another limitation is the examination of learning effect in multiple periods, we simplified the period settings and assumed the learning effect is achieved in one period, which differentiates the practical scenarios and might be adjusted in future work.
In addition to ameliorating the limitations mentioned above, future research could be conducted in the following aspects to strengthen and expand the findings of this study. Data mining techniques could be employed to analyze the detailed employee behaviors as the navigation and trajectory data of employees can be acquired because of the applications of various mobile devices. The integration of data analytics and operations optimization can be a promising research direction. The discovered valuable data can facilitate the practical improvement of theoretical solutions, and the operations optimization model can help to generate more data instances. Another promising research direction could be the generalization and application of the proposed model in other labor-intensive service-oriented industries as servitization has gradually become the development direction of market and industry, and it is expected that the number of employees in the service industry will increase substantially. The research of employee scheduling and management in service-oriented industries is necessary and vital towards the industrial sustainable development.


