Impact of COVID-19 on Urban Mobility during Post-Epidemic Period in Megacities: From the Perspectives of Taxi Travel and Social Vitality
Abstract
1. Introduction
2. Materials and Methods
2.1. Research Framework
2.2. Study Area and Data
2.2.1. Study Area
2.2.2. Data Description
2.3. Driving Factors of Taxi Travel Before and during the Epidemic
2.3.1. Analysis Based on the COVID-19 Control Policies
2.3.2. Spatial Clustering and Regional Division of POI
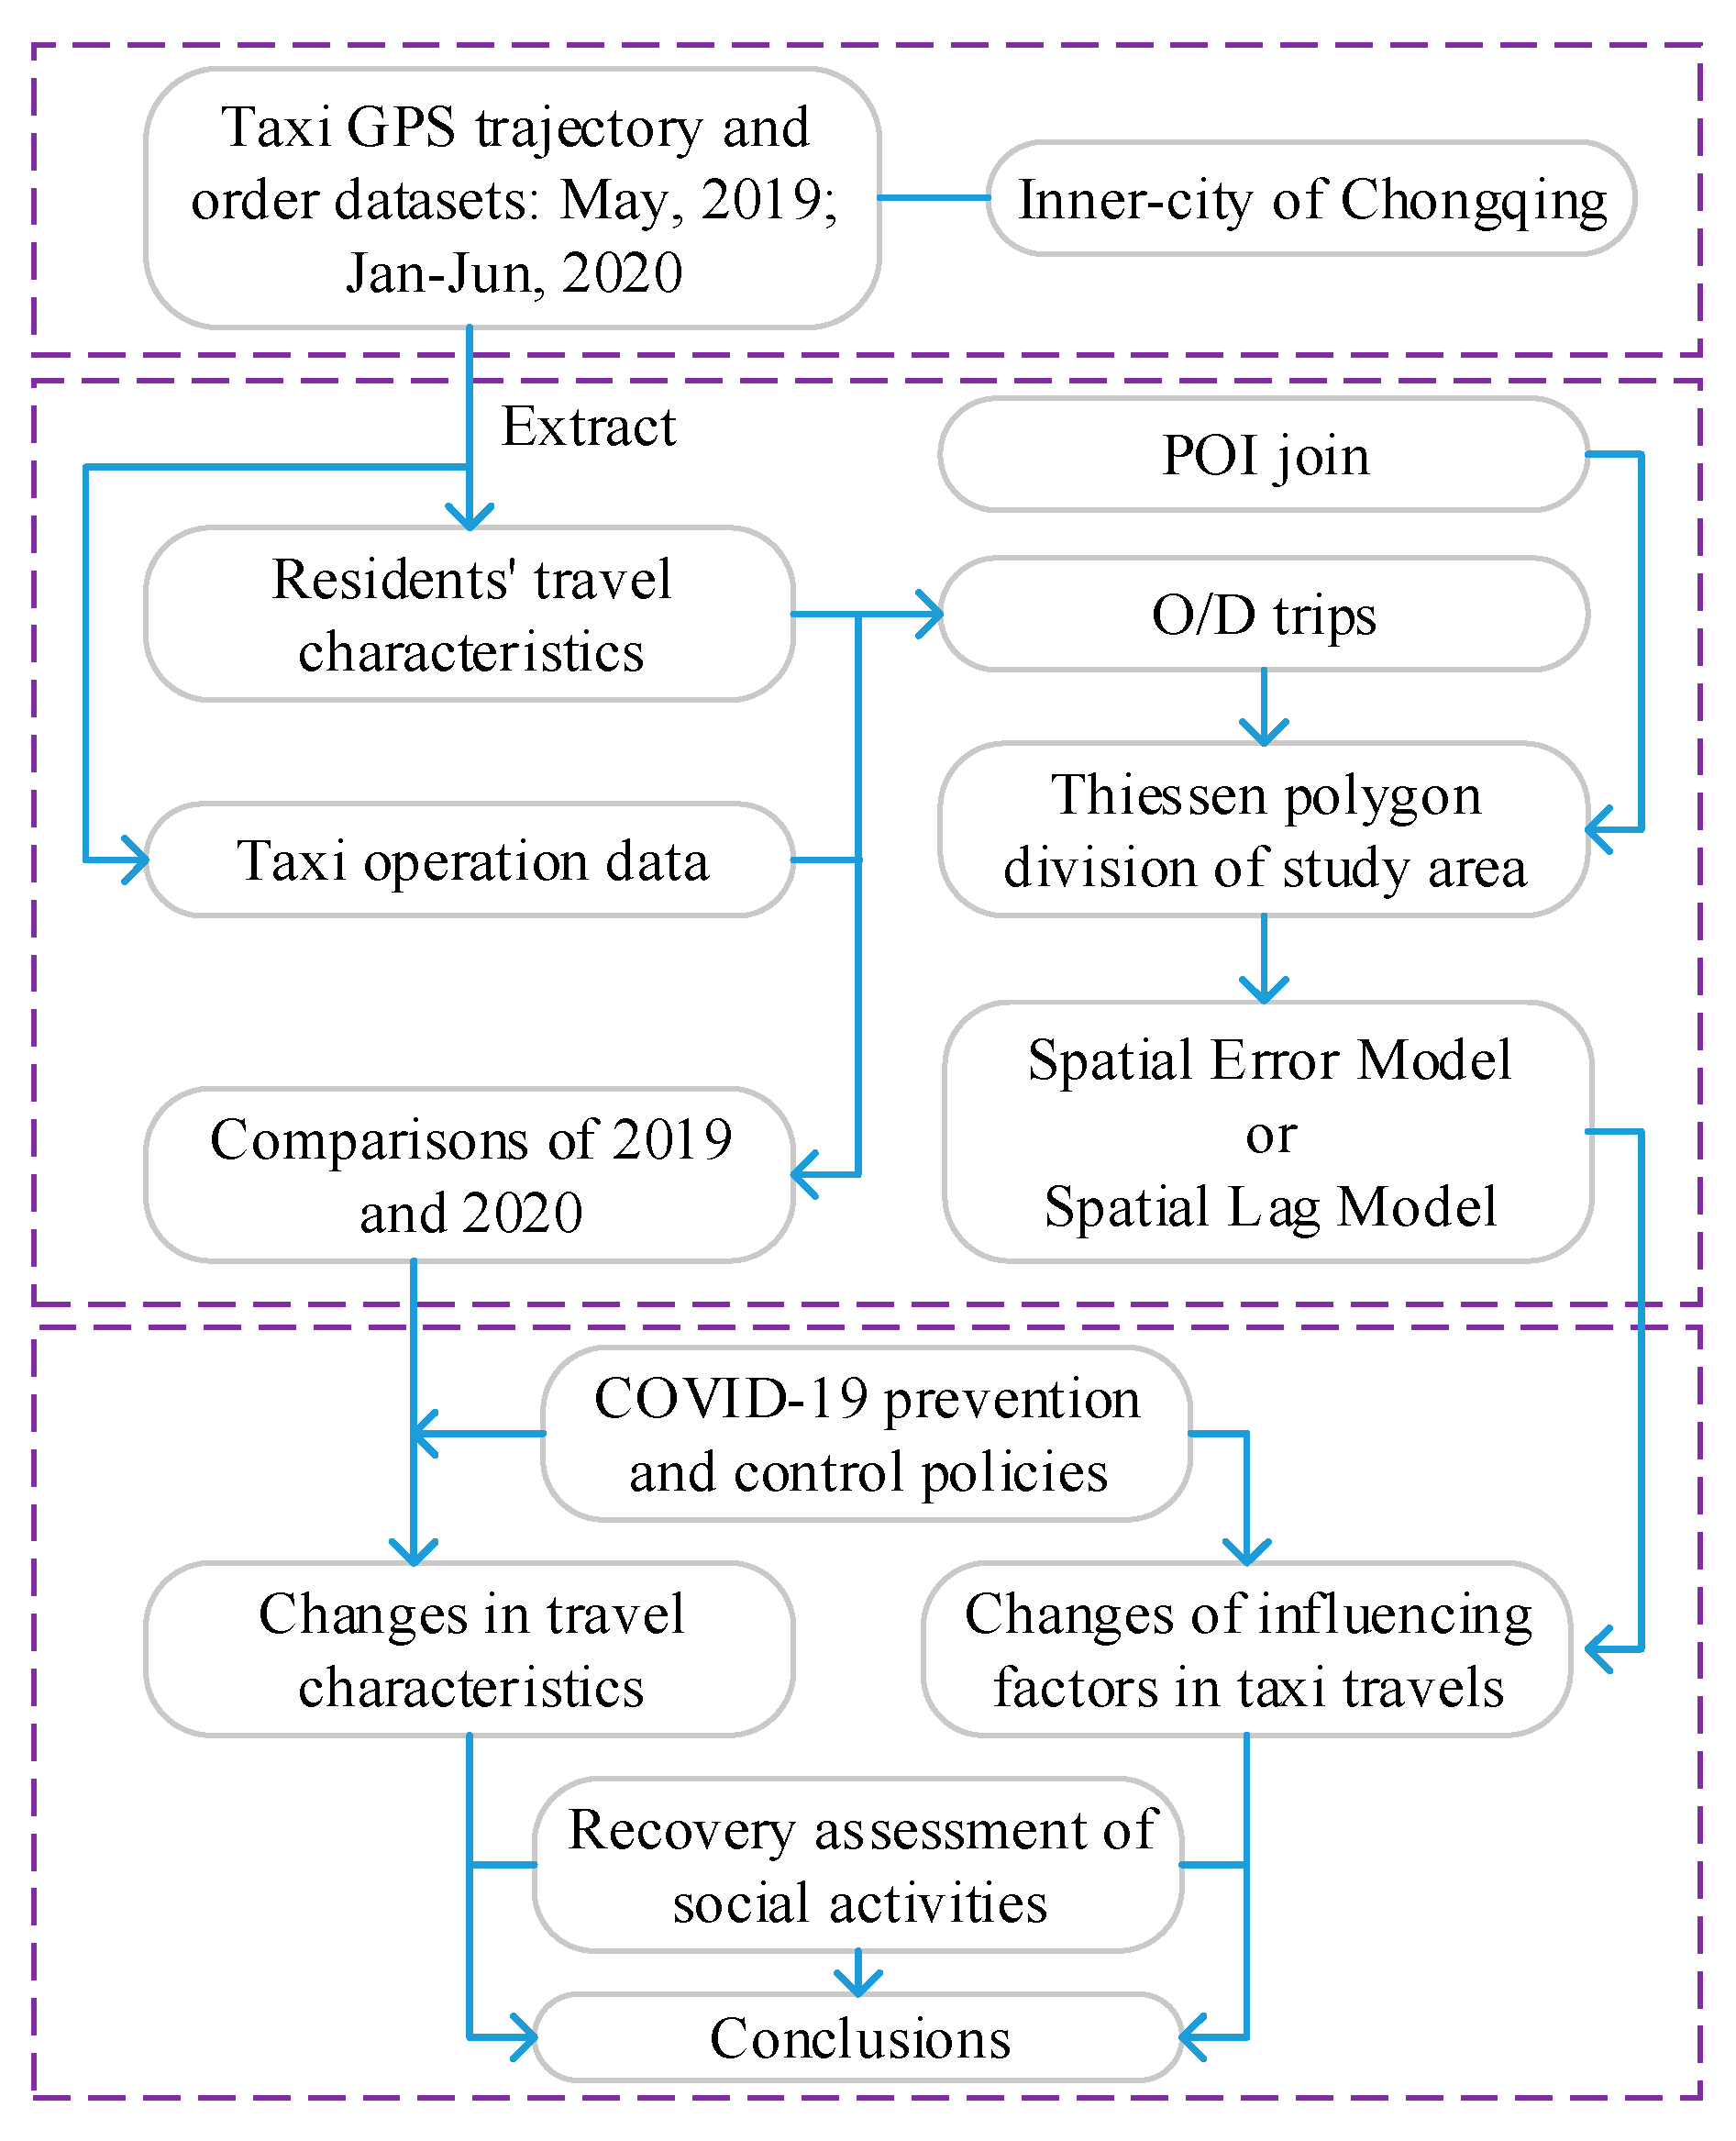
- Extract the origin and destination (OD) of taxi trips within the study area from the trajectory datasets, and conduct a density-based clustering analysis for calculating their centroid coordinates.
- Construct the Thiessen polygons based on the centroid points determined in step 1, and use the Thiessen polygons as the basic research unit.
- Calculate the number of OD points within each Thiessen polygon. Establish a spatial connection between OD points and polygons, and calculate the amount of OD points within the polygons.
- Calculate the number of POI within each Thiessen polygon for each POI category.
- Propose and construct a model to analyze the driving force of each category of POI on OD.
2.3.3. Spatial Weight Matrix
2.3.4. Measurement of Spatial Autocorrelation
2.3.5. Model Selection
- Make an Ordinary Least Squares (OLS) estimation.
- Conduct the Lagrange Multiplier test and compare two Lagrange Multiplier statistics Lagrange Multiplier test-spatial error (LMERR) and Lagrange Multiplier test-spatial lag (LMLAG).
- There is no need to perform a spatial measurement model if none of them are statistically significant.
- The spatial measurement model is selected if only one of them is statistically significant.
- Compare the Robust R-LMERR and R-LMLAG if both of them are statistically significant and select the spatial measurement model with more significant statistics.
2.3.6. Variable Selection
2.4. Social Activities Recovery Level Evaluation Model
2.4.1. Construction of Indicator System
2.4.2. Indicator Description
- Total trips: More total trips are associated with more travel demand, the more frequent social activities in the city, and the higher the social vitality.
- Total operating income: Higher operating income is associated with more spending on travel and higher the social vitality.
- The proportion of night trips: Night trips refers to the trips between 8 PM and 2 AM. The larger the proportion of night trips, the more prosperous and vibrant city business.
- The proportion of trips from transport hubs: The transport hubs here refer to the city’s railway passenger transport hubs, highway passenger transport hubs, and airports. Generally, the greater the demand for taxi-hailing in transport hubs, the greater the passenger volume of transport hubs the more frequent the city interacts with the outside world, and the higher the social vitality.
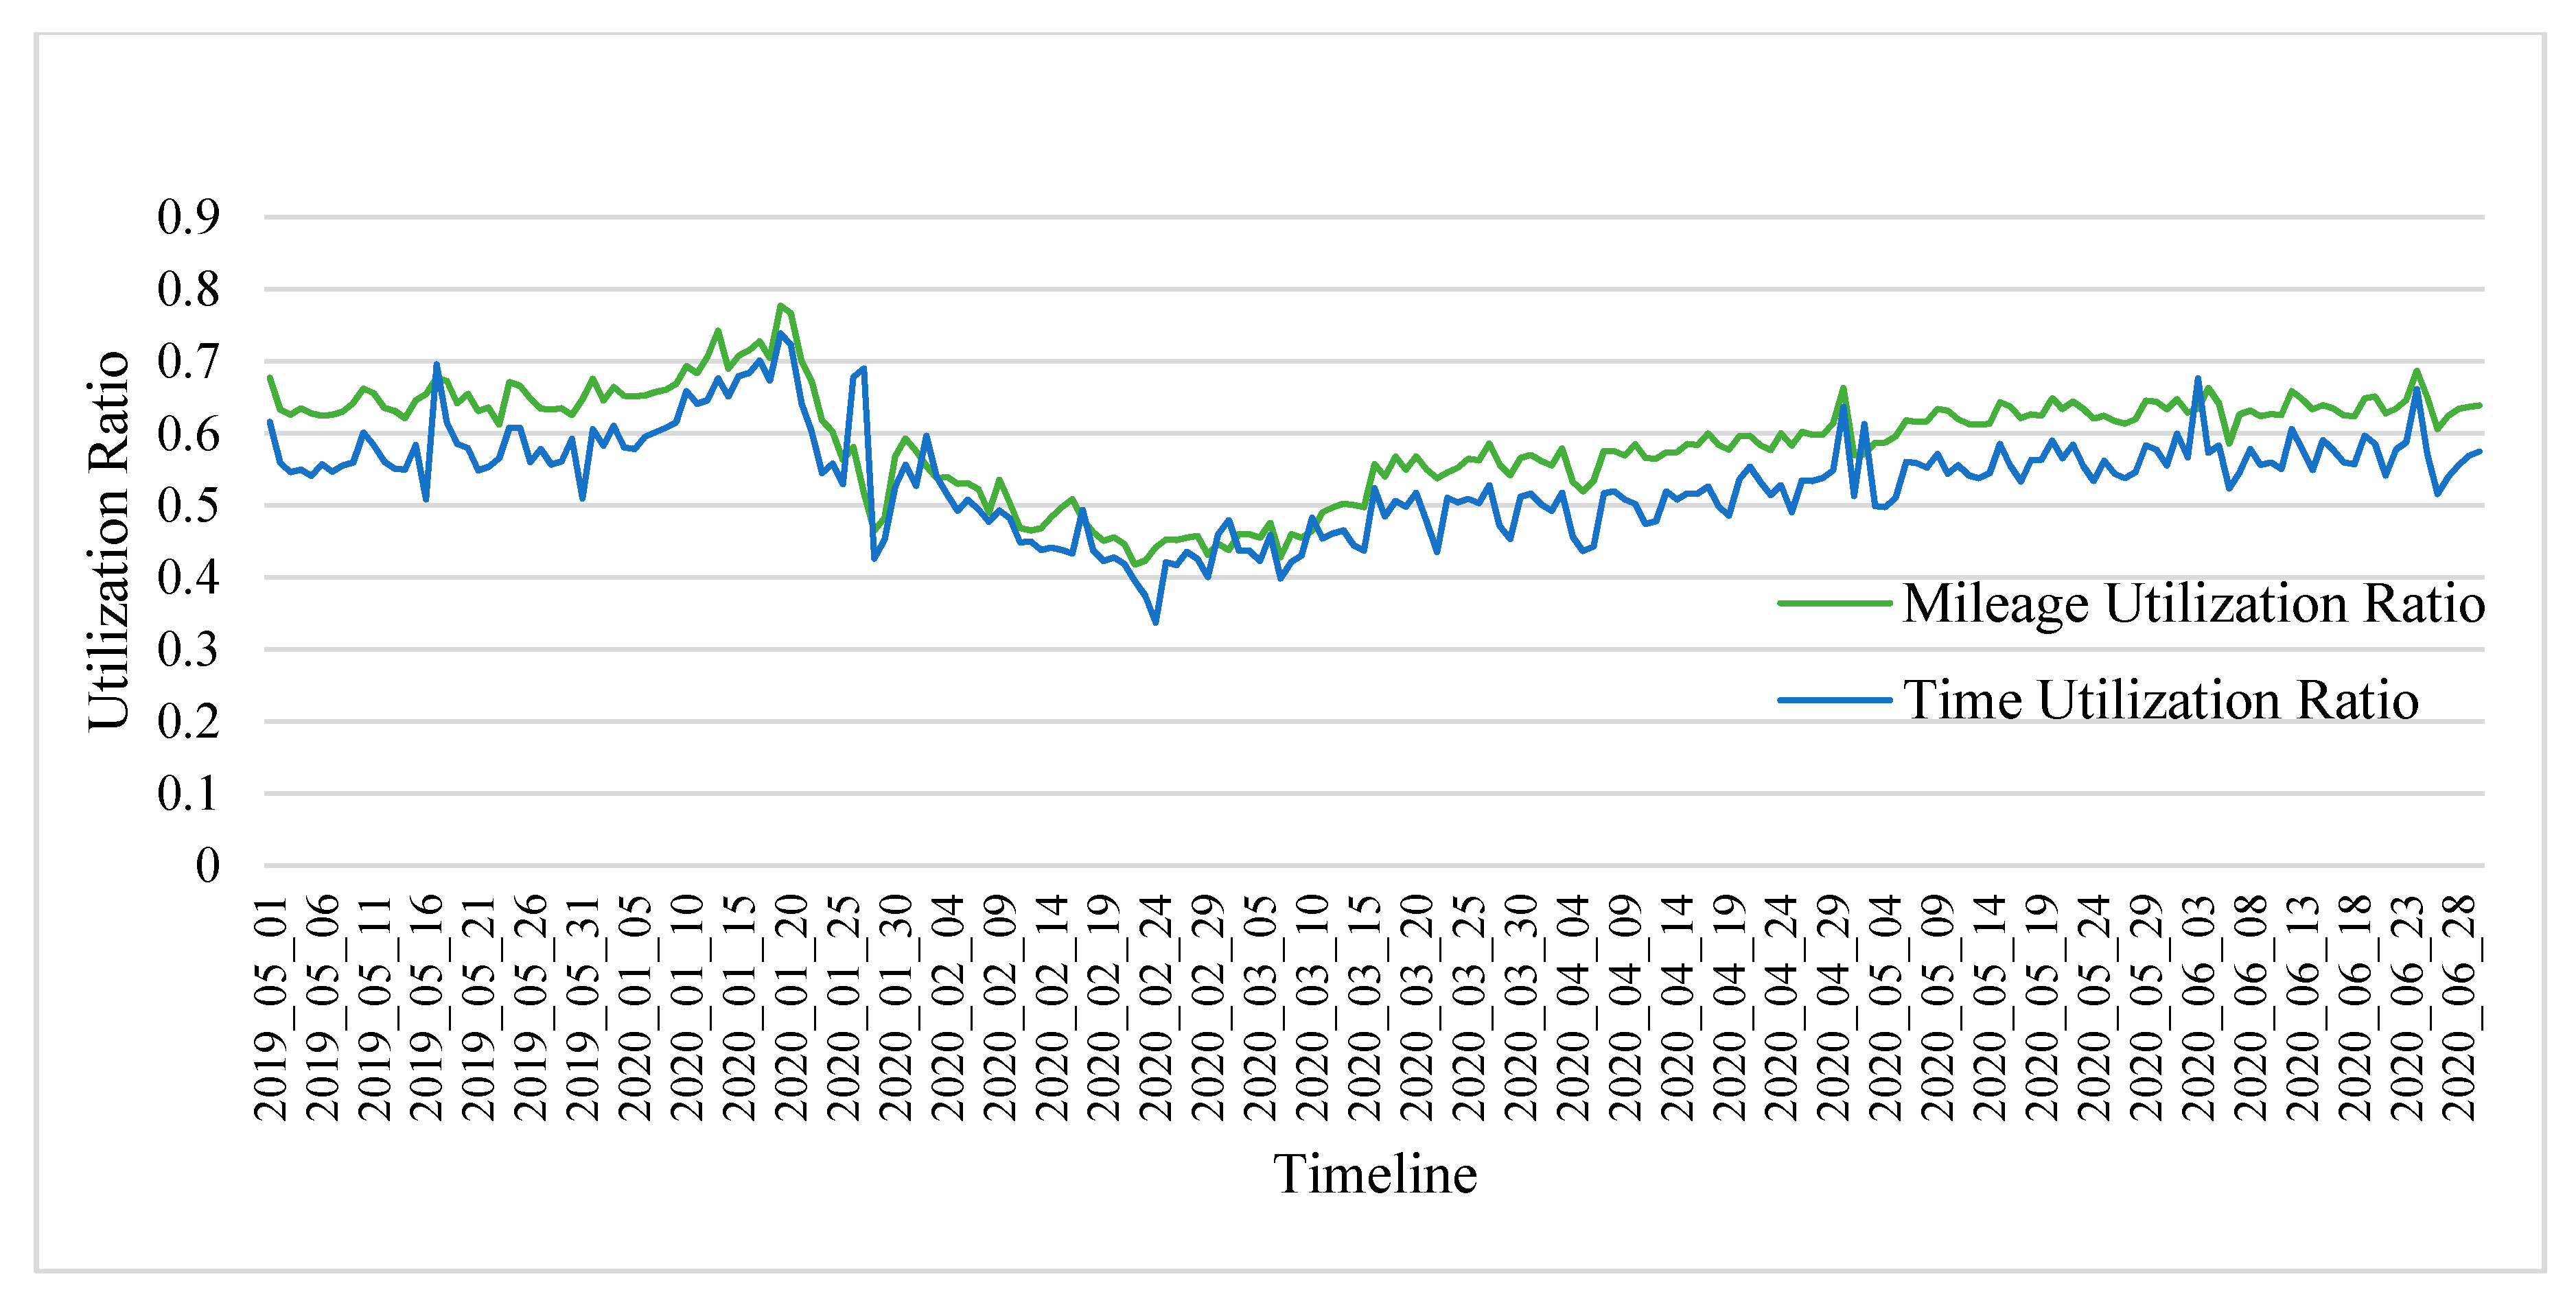
- Time utilization ratio: The higher the time utilization ratio of taxies, the higher the travel demand, and the higher the social vitality.
- Mileage utilization ratio: The higher the mileage utilization ratio of taxies, the higher the travel demand, and the higher the social vitality.
- Average trip time: The longer the travel time for the same trip, the lower the speed and the more saturated the road traffic, the better the recovery of social activities.
- Relative trip time of the morning peak: The morning peak refers to 7:00–9:00 AM of the day. The relative trip time of the morning peak is the ratio of the average travel time during the morning peak to the average travel time of all the trips of the day. The larger the value, the more significant the characteristics of the morning peak, the higher the degree of resumption of work and production, and the better the recovery of social activities.
2.4.3. Recovery Level Assessment Model
3. Results and Discussion
3.1. Analyses of Taxi Travel Characteristics before and during the Epidemic
3.1.1. Number of Daily Trips
3.1.2. Temporal Distribution of Trips in a Day
3.1.3. Basic Characteristics of the Trips
3.1.4. Analysis of Utilization Ratio
3.1.5. Monthly Operating Income
3.1.6. Spatial Distribution of Origins and Destinations
3.2. Analysis of Changes in Travel Driving Force
3.2.1. Results of POI Regional Statistics and Regional Division
3.2.2. Results of Model Selection
3.2.3. Moran’s I Results
3.2.4. Results of Spatial Lag Model (SLM)
3.3. Assessment of the Recovery Level of Social Activities in the Post-Epidemic Period
4. Conclusions
Author Contributions
Funding
Acknowledgments
Conflicts of Interest
References
- Leung, K.; Wu, J.T.; Liu, D.; Leung, G.M. First-wave COVID-19 transmissibility and severity in China outside Hubei after control measures, and second-wave scenario planning: A modelling impact assessment. Lancet 2020, 395, 1382–1393. [Google Scholar] [CrossRef]
- Chakraborty, I.; Maity, P. COVID-19 outbreak: Migration, effects on society, global environment and prevention. Sci. Total Environ. 2020, 728, 138882. [Google Scholar] [CrossRef] [PubMed]
- Lau, H.; Khosrawipour, V.; Kocbach, P.; Mikolajczyk, A.; Schubert, J.; Bania, J.; Khosrawipour, T. The positive impact of lockdown in Wuhan on containing the COVID-19 outbreak in China. J. Travel Med. 2020, 27, 1–7. [Google Scholar] [CrossRef] [PubMed]
- Hadjidemetriou, G.M.; Sasidharan, M.; Kouyialis, G.; Parlikad, A.K. The impact of government measures and human mobility trend on COVID-19 related deaths in the UK. Transp. Res. Interdiscip. Perspect. 2020, 6, 100167. [Google Scholar] [CrossRef]
- Verheyden, B.; Askitas, N.; Tatsiramos, K. Lockdown Strategies, Mobility Patterns and COVID-19. Available online: https://arxiv.org/abs/2006.00531 (accessed on 31 May 2020).
- Baker, S.R.; Farrokhnia, R.A.; Meyer, S.; Pagel, M.; Yannelis, C. How Does Household Spending Respond to an Epidemic? Consumption during the 2020 COVID-19 Pandemic. Available online: https://www.nber.org/papers/w26949 (accessed on 13 April 2020).
- World Health Organization. Coronavirus Disease 2019 (COVID-19) Situation Report-72 HIGHLIGHTS; WHO: Geneva, Switzerland, 2020. [Google Scholar]
- Lipsitch, M.; Cohen, T.; Cooper, B.; Robins, J.M.; Ma, S.; James, L.; Gopalakrishna, G.; Chew, S.K.; Tan, C.C.; Samore, M.H.; et al. Transmission dynamics and control of severe acute respiratory syndrome. Science 2003, 300, 1966–1970. [Google Scholar] [CrossRef]
- Chinazzi, M.; Davis, J.T.; Ajelli, M.; Gioannini, C.; Litvinova, M.; Merler, S.; Pastore y Piontti, A.; Mu, K.; Rossi, L.; Sun, K.; et al. The effect of travel restrictions on the spread of the 2019 novel coronavirus (COVID-19) outbreak. Science 2020, 368, 395–400. [Google Scholar] [CrossRef]
- Wilder-Smith, A.; Chiew, C.J.; Lee, V.J. Can we contain the COVID-19 outbreak with the same measures as for SARS? Lancet Infect. Dis. 2020, 20, e102–e107. [Google Scholar] [CrossRef]
- Kraemer, M.U.G.; Yang, C.-H.; Gutierrez, B.; Wu, C.-H.; Klein, B.; Pigott, D.M.; du Plessis, L.; Faria, N.R.; Li, R.; Hanage, W.P.; et al. The effect of human mobility and control measures on the COVID-19 epidemic in China. Science 2020, 368, 493–497. [Google Scholar] [CrossRef]
- Tian, H.; Liu, Y.; Li, Y.; Wu, C.H.; Chen, B.; Kraemer, M.U.G.; Li, B.; Cai, J.; Xu, B.; Yang, Q.; et al. An investigation of transmission control measures during the first 50 days of the COVID-19 epidemic in China. Science 2020, 368, 638–642. [Google Scholar] [CrossRef]
- Zhao, S.; Chen, H. Modeling the epidemic dynamics and control of COVID-19 outbreak in China. Quant. Biol. 2020, 8, 11–19. [Google Scholar] [CrossRef]
- Wilder-Smith, A.; Freedman, D.O. Isolation, quarantine, social distancing and community containment: Pivotal role for old-style public health measures in the novel coronavirus (2019-nCoV) outbreak. J. Travel Med. 2020, 27, taaa020. [Google Scholar] [CrossRef] [PubMed]
- Svoboda, T.; Henry, B.; Shulman, L.; Kennedy, E.; Rea, E.; Ng, W.; Wallington, T.; Yaffe, B.; Gournis, E.; Vicencio, E.; et al. Public health measures to control the spread of the severe acute respiratory syndrome during the outbreak in Toronto. N. Engl. J. Med. 2004, 350, 2352–2361. [Google Scholar] [CrossRef] [PubMed]
- Gumel, A.B.; Ruan, S.; Day, T.; Watmough, J.; Brauer, F.; Van Den Driessche, P.; Gabrielson, D.; Bowman, C.; Alexander, M.E.; Ardal, S.; et al. Modelling strategies for controlling SARS outbreaks. Proc. R. Soc. B Biol. Sci. 2004, 271, 2223–2232. [Google Scholar] [CrossRef] [PubMed]
- Yen, M.Y.; Schwartz, J.; Chen, S.Y.; King, C.C.; Yang, G.Y.; Hsueh, P.R. Interrupting COVID-19 transmission by implementing enhanced traffic control bundling: Implications for global prevention and control efforts. J. Microbiol. Immunol. Infect. 2020, 53, 377–380. [Google Scholar] [CrossRef]
- Primc, K.; Slabe-Erker, R. The success of public health measures in Europe during the COVID-19 pandemic. Sustainability 2020, 12, 4321. [Google Scholar] [CrossRef]
- The Passenger Volume of the 2020 Spring Festival Travel Rush is Significantly Lower than that of Last Year. Available online: http://www.rmjtxw.com/news/yaowen/102949.html (accessed on 20 February 2020).
- Ministry of Transport of the People’s Republic of China Statistics of Total Passenger Traffic in Central Cities. Available online: http://www.mot.gov.cn/tongjishuju/ (accessed on 26 June 2020).
- Aloi, A.; Alonso, B.; Benavente, J.; Cordera, R.; Echániz, E.; González, F.; Ladisa, C.; Lezama-Romanelli, R.; López-Parra, Á.; Mazzei, V.; et al. Effects of the COVID-19 lockdown on urban mobility: Empirical evidence from the city of Santander (Spain). Sustainability 2020, 12, 3870. [Google Scholar] [CrossRef]
- Chen, K.; Wang, M.; Huang, C.; Kinney, P.L.; Anastas, P.T. Air pollution reduction and mortality benefit during the COVID-19 outbreak in China. Lancet Planet. Health 2020, 4, e210–e212. [Google Scholar] [CrossRef]
- Huang, J.; Wang, H.; Fan, M.; Zhuo, A.; Sun, Y.; Li, Y. Understanding the Impact of the COVID-19 Pandemic on Transportation-related Behaviors with Human Mobility Data. In Proceedings of the 26th ACM SIGKDD Conference on Knowledge Discovery and Data Mining (KDD’20), Virtual Event, New York, NY, USA, 23–27 August 2020; pp. 3443–3450. [Google Scholar]
- Dubey, A.; Wilbur, M.; Ayman, A.; Ouyang, A.; Poon, V.; Kabir, R.; Vadali, A.; Pugliese, P.; Freudberg, D.; Laszka, A. Impact of COVID-19 on Public Transit Accessibility and Ridership. Available online: https://arxiv.org/abs/2008.02413 (accessed on 6 August 2020).
- Arellana, J.; Márquez, L.; Cantillo, V. COVID-19 Outbreak in Colombia: An Analysis of Its Impacts on Transport Systems. J. Adv. Transp. 2020, 2020, 8867316. [Google Scholar] [CrossRef]
- Molloy, J.; Tchervenkov, C.; Schatzmann, T.; Schoeman, B.; Hitermann, B.; Axhausen, K.W. MOBIS-COVID19/13: Results as of 06/07/2020 (Post-Lockdown); Arbeitsbericht Verkehrs und Raumplanung: Zurich, Switzerland, 2020. [Google Scholar]
- Tirachini, A.; Cats, O. COVID-19 and public transportation: Current assessment, prospects, and research needs. J. Public Transp. 2020, 22, 1–34. [Google Scholar] [CrossRef]
- Fernandes, N. Economic Effects of Coronavirus Outbreak (COVID-19) on the World Economy. Available online: https://ssrn.com/abstract=3557504 (accessed on 13 April 2020).
- Batty, M. The Coronavirus crisis: What will the post-pandemic city look like? Environ. Plan. B Urban Anal. City Sci. 2020, 47, 547–552. [Google Scholar] [CrossRef]
- Tang, J.; Heinimann, H.R.; Han, K. A Bayesian network approach for assessing the general resilience of road transportation systems: A systems perspective. In Proceedings of the CICTP 2019: Transportation in China—Connecting the World, Jiangsu, China, 6–8 June 2019. [Google Scholar]
- Amekudzi-Kennedy, A.; Labi, S.; Woodall, B.; Chester, M.; Singh, P. Reflections on Pandemics, Civil Infrastructure and Sustainable Development: Five Lessons from COVID-19 through the Lens of Transportation. Available online: https://www.preprints.org/manuscript/202004.0047/v1 (accessed on 6 April 2020).
- Wang, X.; Miao, S.; Tang, J. Vulnerability and resilience analysis of the air traffic control sector network in China. Sustainability 2020, 12, 3749. [Google Scholar] [CrossRef]
- Huang, J.; Wang, H.; Xiong, H.; Fan, M.; Zhuo, A.; Li, Y.; Dou, D. Quantifying the Economic Impact of COVID-19 in Mainland China Using Human Mobility Data. Available online: https://arxiv.org/abs/2005.03010 (accessed on 6 May 2020).
- Gössling, S.; Scott, D.; Hall, C.M. Pandemics, tourism and global change: A rapid assessment of COVID-19. J. Sustain. Tour. 2020, 1–20. [Google Scholar] [CrossRef]
- Dang, H.A.; Giang, L. Turning Vietnam’s COVID-19 Success into Economic Recovery: A Job-Focused Analysis of Individual Assessments on Their Finance and the Economy. Available online: https://papers.ssrn.com/sol3/papers.cfm?abstract_id=3620630 (accessed on 9 June 2020).
- Sun, D.; Ding, X. Spatiotemporal evolution of ridesourcing markets under the new restriction policy: A case study in Shanghai. Transp. Res. Part A Policy Pract. 2019, 130, 227–239. [Google Scholar] [CrossRef]
- Sun, D.; Zhang, K.; Shen, S. Analyzing spatiotemporal traffic line source emissions based on massive didi online car-hailing service data. Transp. Res. Part D Transp. Environ. 2018, 62, 699–714. [Google Scholar] [CrossRef]
- Gong, L.; Liu, X.; Wu, L.; Liu, Y. Inferring trip purposes and uncovering travel patterns from taxi trajectory data. Cartogr. Geogr. Inf. Sci. 2016, 43, 103–114. [Google Scholar] [CrossRef]
- Liu, X.; Sun, L.; Sun, Q.; Gao, G. Spatial Variation of Taxi Demand Using GPS Trajectories and POI Data. J. Adv. Transp. 2020, 2020, 7621576. [Google Scholar] [CrossRef]
- Chen, F.; Yin, Z.; Ye, Y.; Sun, D.J. Taxi Hailing Choice Behavior and Economic Benefit Analysis of Emission Reduction Based on Multi-mode Travel Big Data. Transp. Policy 2020, 97, 73–84. [Google Scholar] [CrossRef]
- Sun, D.J.; Zhang, C.; Zhang, L.; Chen, F.; Peng, Z.-R. Urban travel behavior analyses and route prediction based on floating car data. Transp. Lett. Int. J. Transp. Res. 2020, 6, 118–125. [Google Scholar] [CrossRef]
- Martin, A.; Markhvida, M.; Hallegatte, S.; Walsh, B. Socio-Economic Impacts of COVID-19 on Household Consumption and Poverty. Available online: https://link.springer.com/article/10.1007/s41885-020-00070-3#citeas (accessed on 23 July 2020).
- Karpman, M.; Acs, G. Employment, Income, and Unemployment Insurance during the COVID-19 Pandemic. Available online: https://www.urban.org/sites/default/files/publication/102485/employment-income-and-unemployment-insurance-during-the-covid-19-pandemic.pdf (accessed on 30 June 2020).
- Andrade, R.; Alves, A.; Bento, C. POI Mining for Land Use Classification: A Case Study. ISPRS Int. J. Geo-Inf. 2020, 9, 493. [Google Scholar] [CrossRef]
- Zeng, W.; Fu, C.; Müller Arisona, S.; Schubiger, S.; Burkhard, R.; Ma, K. Visualizing the Relationship Between Human Mobility and Points of Interest. IEEE Trans. Intell. Transp. Syst. 2017, 18, 2271–2284. [Google Scholar] [CrossRef]
- Chongqing Bureau of Statistics. Chongqing Statistical Yearbook 2019; China Statistics Press: Beijing, China, 2019. [Google Scholar]
- Zhang, K.; Sun, D.J.; Shen, S.; Zhu, Y. Analyzing spatiotemporal congestion pattern on urban roads based on taxi GPS data. J. Transp. Land Use. 2017, 10, 675–694. [Google Scholar] [CrossRef]
- MORAN, P.A. A test for the serial independence of residuals. Biometrika 1950, 37, 178–181. [Google Scholar] [CrossRef] [PubMed]
- Anselin, L.; Getis, A. Spatial statistical analysis and geographic information systems. Ann. Reg. Sci. 1992, 26, 19–33. [Google Scholar] [CrossRef]
- Anselin, L.; Florax, R.; Rey, S.J. Advances in Spatial Econometrics: Methodology, Tools and Applications; Springer: Berlin, Germany, 2004. [Google Scholar]
- Anselin, L. Spatial econometrics. In Palgrave Handbook of Econometrics: Econometric Theory; Mills, T., Patterson, K., Eds.; Palgrave Macmillan: Basingstoke, UK, 2006. [Google Scholar]
- Didi Development Research Institute; China Development Research Institute of Shanghai Jiaotong University; Economic and Social Development Research Institute of Northeast University of Finance and Economics. Towards an Efficient and Livable City: Didi “Urban Development Index”. Available online: http://www.shine.sjtu.edu.cn/shine/column/41106.html (accessed on 25 October 2019).
- Farber, H.S. Why you can’t find a taxi in the rain and other labor supply lessons from cab drivers. Q. J. Econ. 2015, 130, 1975–2026. [Google Scholar] [CrossRef]
- Sun, D.J.; Yin, Z.; Cao, P. An improved CAL3QHC model and the application in vehicle emission mitigation schemes for urban signalized intersections. Build. Environ. 2020, 183, 107213. [Google Scholar]
- Laverty, A.A.; Millett, C.; Majeed, A.; Vamos, E.P. COVID-19 presents opportunities and threats to transport and health. J. R. Soc. Med. 2020, 113, 251–254. [Google Scholar] [CrossRef]


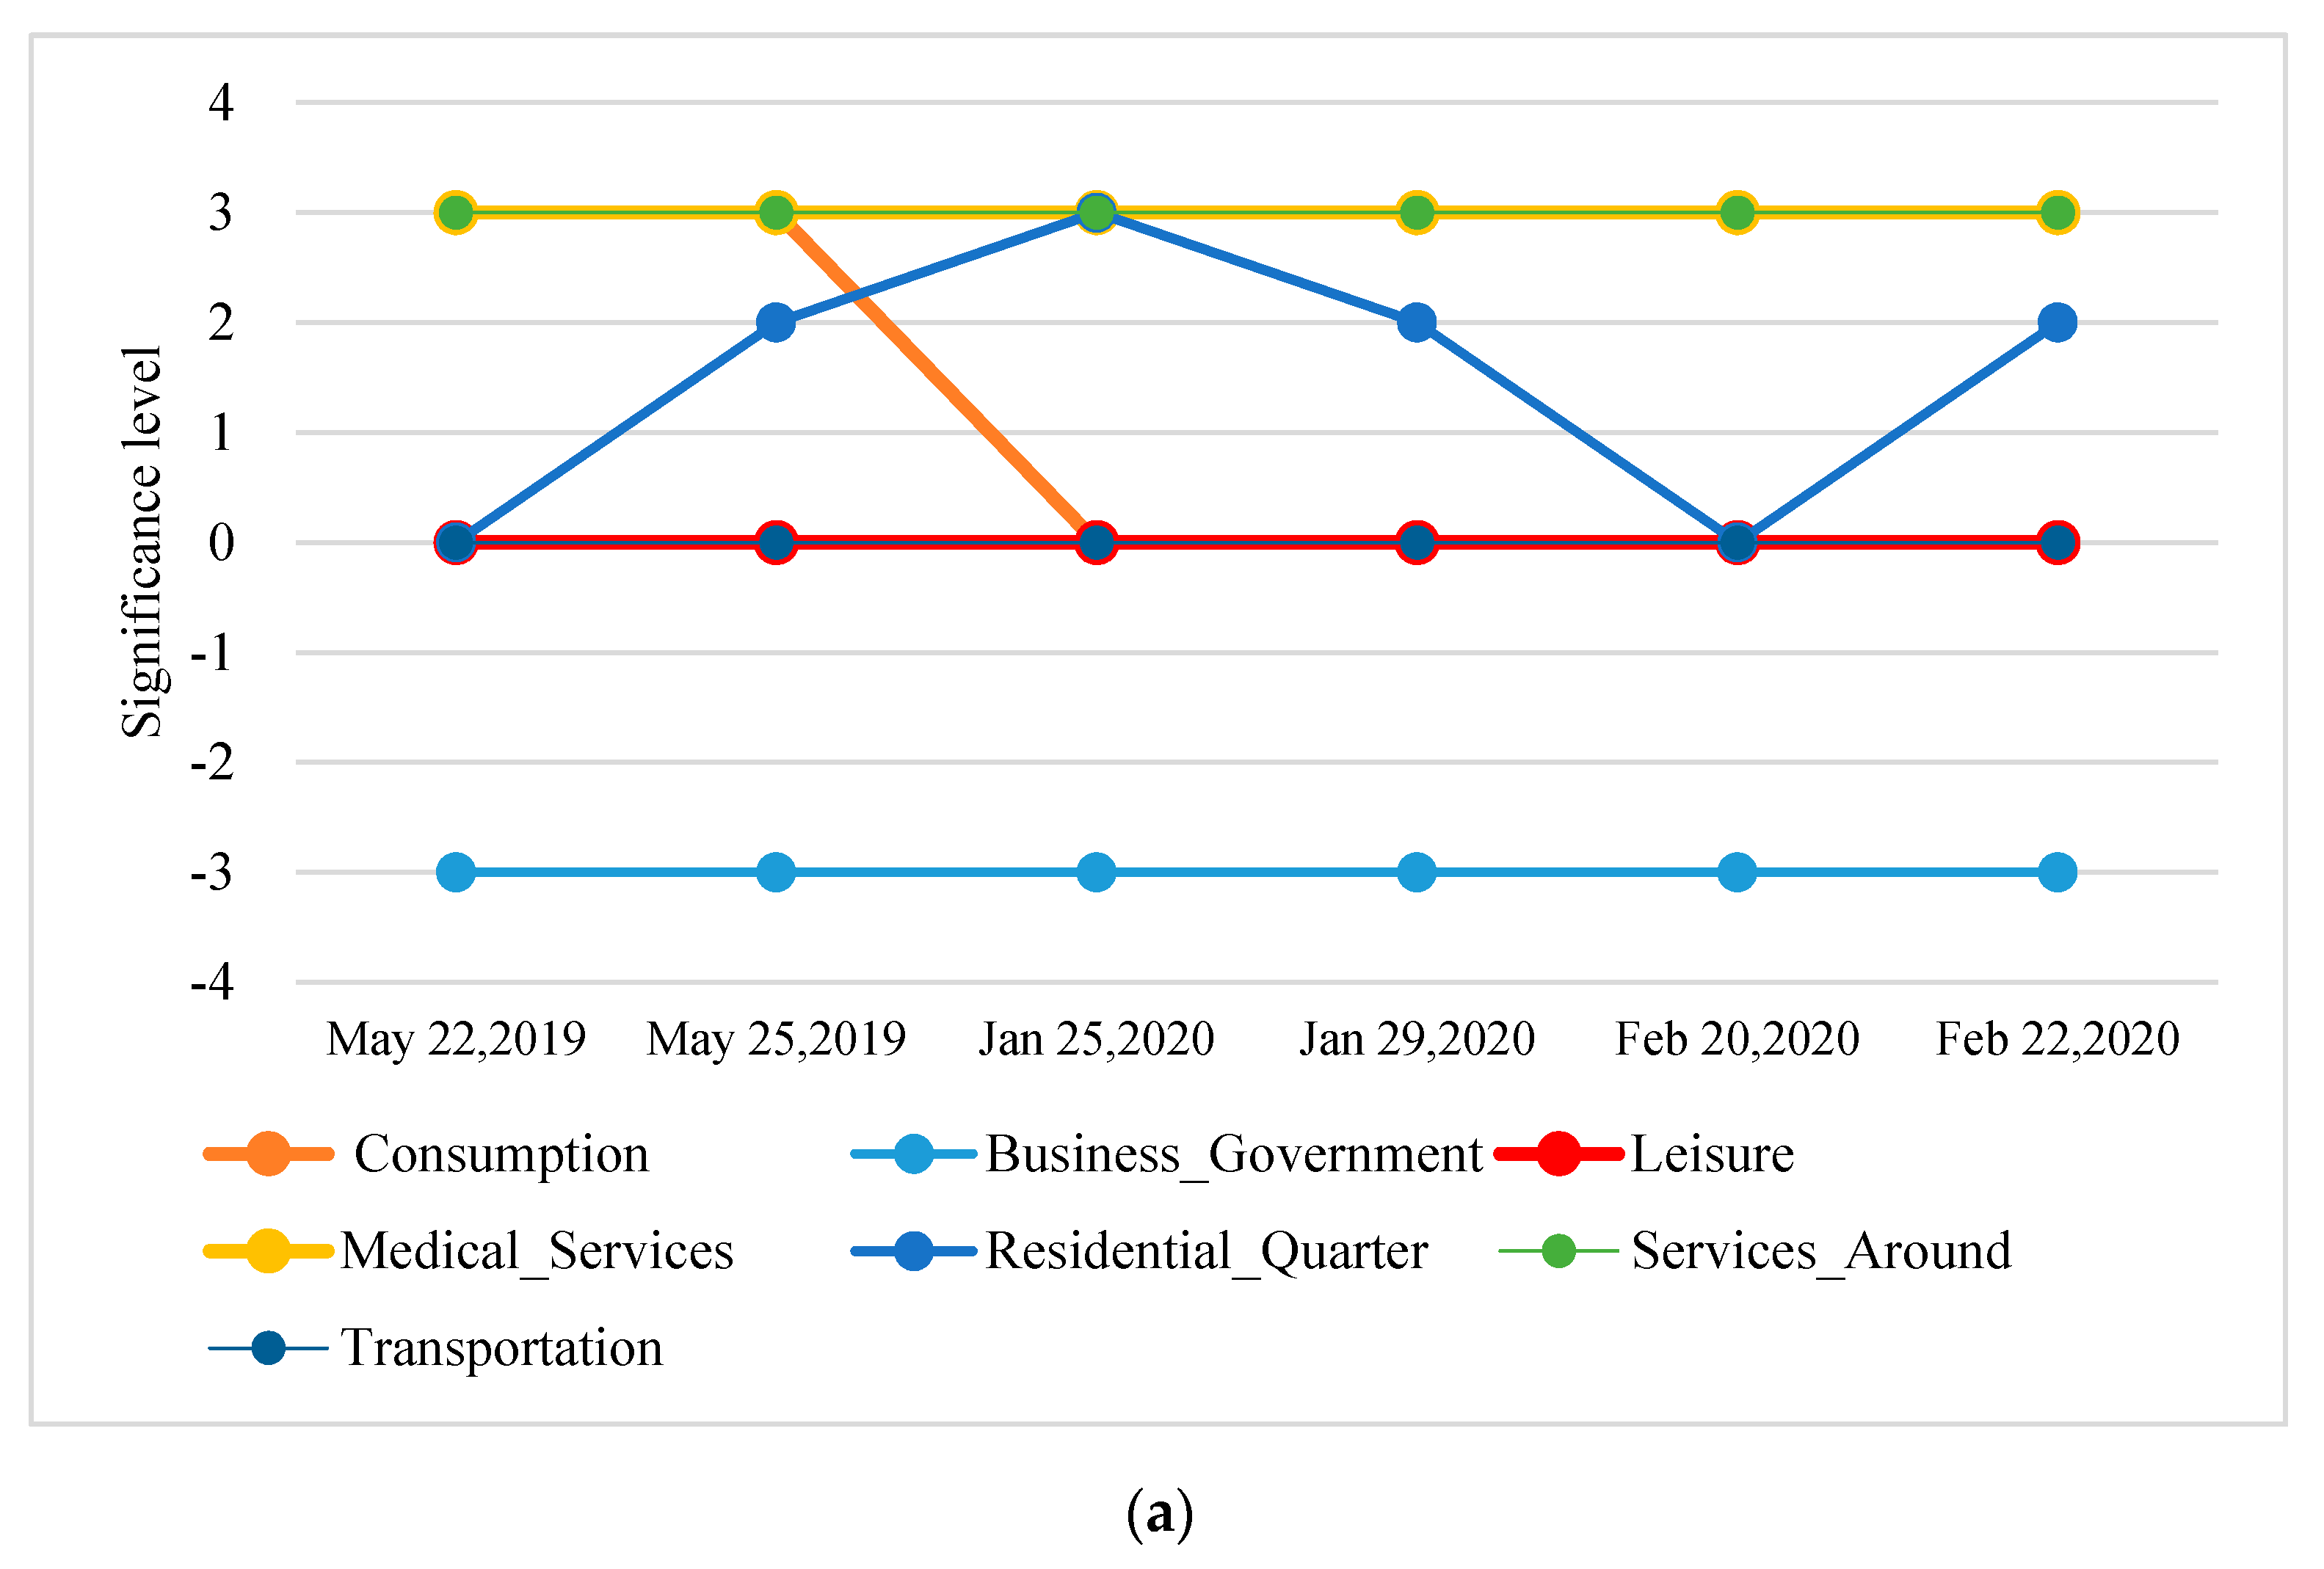
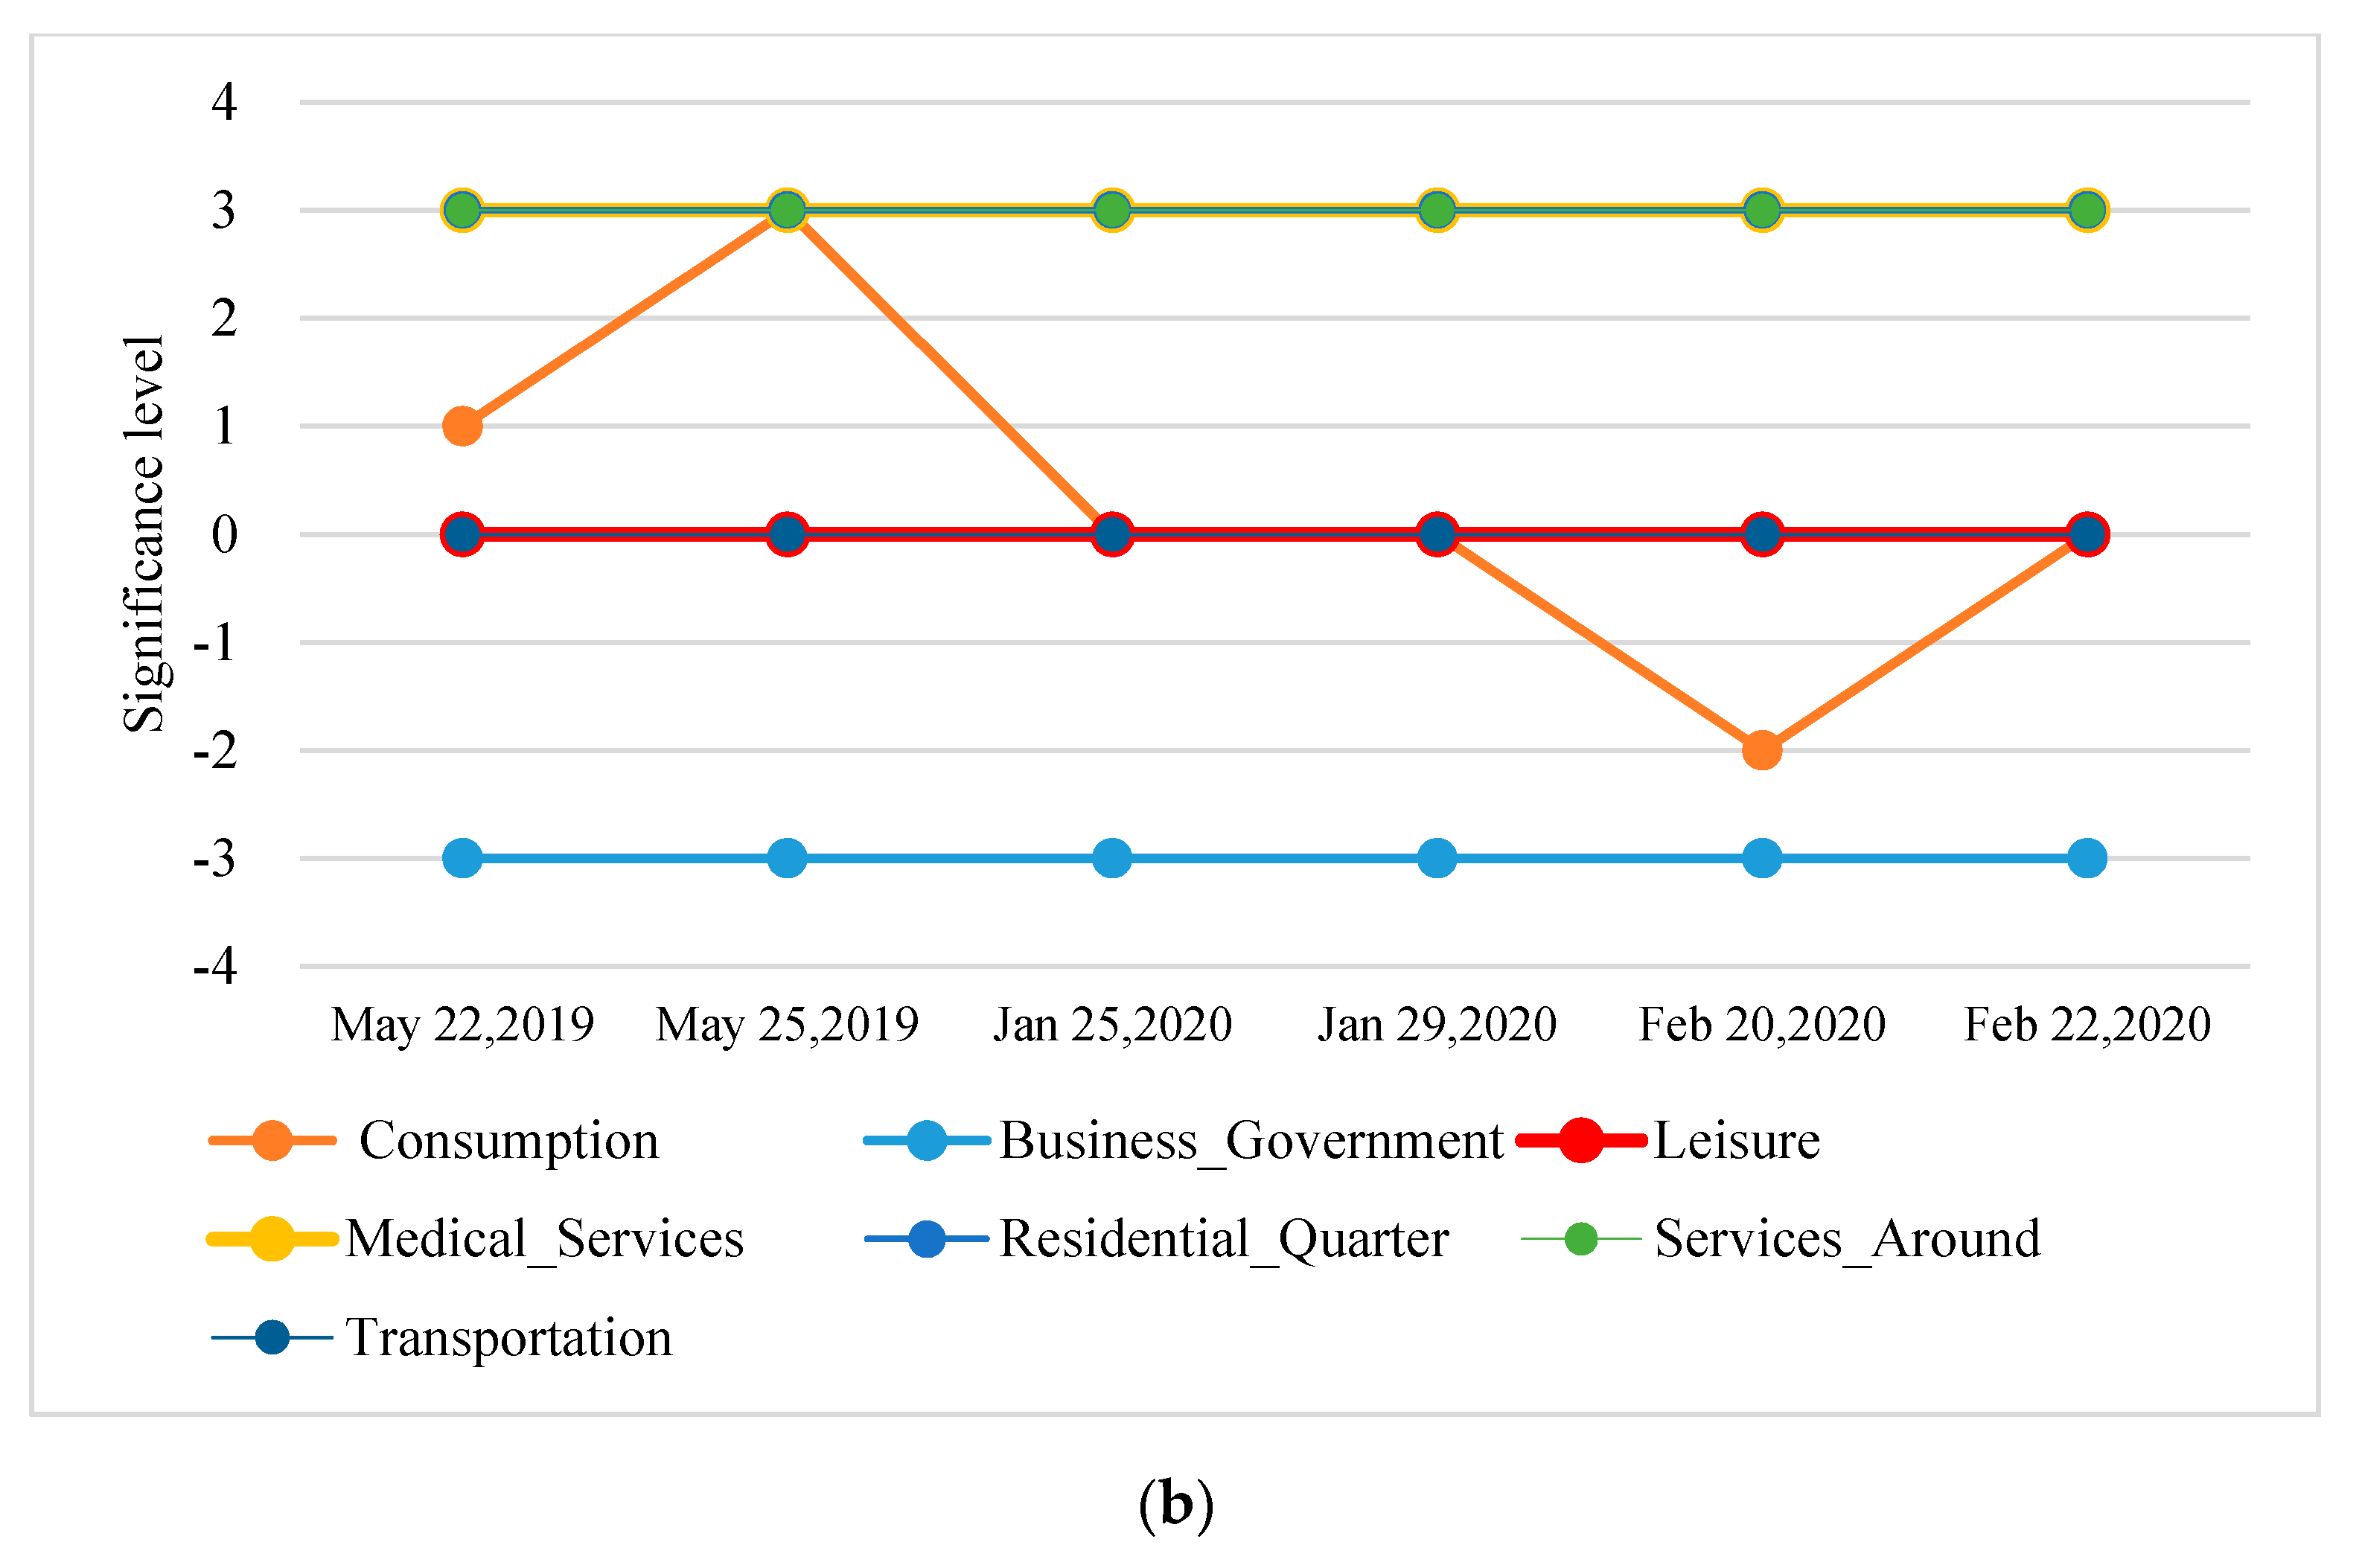
| Index | Original Category | New Category | Index |
|---|---|---|---|
| 1 | Hotel | Consumption | 1 |
| 2 | Catering | ||
| 3 | Shopping | ||
| 4 | Enterprise | Business_Government | 2 |
| 5 | Business Building | ||
| 6 | Government | ||
| 7 | Entertainment | Leisure | 3 |
| 8 | Tourist Attractions | ||
| 9 | Medical Treatment and Public Health | Medical_Services | 4 |
| 10 | Residential Community | Residential_Quarter | 5 |
| 11 | Life Services | Services_Around | 6 |
| 12 | Auto Service | ||
| 13 | Finance | ||
| 14 | Roads | Transportation | 7 |
| 15 | Transport infrastructure |
| Variable Category | Name | Description |
|---|---|---|
| Dependent variable | Origins (O)/ Destinations (D) | the number of origins and destinations of taxi trips |
| Independent variables | Consumption: γ1 | the number of Consumption POI within the polygon units |
| Business_Government: γ2 | the number of Business-Government POI within the polygon units | |
| Leisure: γ3 | the number of Leisure POI within the polygon units | |
| Medical_Services: γ4 | the number of Medical-Services POI within the polygon units | |
| Residential_Quarter: γ5 | the number of Residential-Quarter POI within the polygon units | |
| Services_Around: γ6 | the number of Services-Around POI within the polygon units | |
| Transportation: γ7 | the number of Transportation POI within the polygon units |
| Index | Indicator Name | Indicator Description and Calculation | Indicator Weights |
|---|---|---|---|
| 1 | Total trips Ti | Total number of taxi trips in one day | W1 |
| 2 | Total operating income Ri | Total operating income of taxi in one day | W2 |
| 3 | Proportion of night trips PNTi | The number of taxi trips from 8 PM to 2 AM in the morning TNi account for the proportion of all-day taxi trips Ti: PNTi = TNi/Ti | W3 |
| 4 | Proportion of trips from transport hubs PTHi | The number of taxi trips departing from the transport hubs THi account for the proportion of all-day taxi trips Ti: PTHi = THi/Ti | W4 |
| 5 | Time utilization ratio TURi | Occupy time as a proportion of operating time | W5 |
| 6 | Mileage ultization rate MURi | Occupy mileage as a proportion of operating mileage | W6 |
| 7 | Average trip time ATTi | Average travel time of taxi trips on the day | W7 |
| 8 | Relative trip time of the morning peak RTTi | The ratio of the average taxi trip time during morning peak AMTi to the average trip time on the day ATTi: RTTi = AMTi/ATTi | W8 |
| Index | Selected Days | Day of the Week | Weather Condition |
|---|---|---|---|
| 1 | 22 May 2019 | Wednesday | Cloudy |
| 2 | 25 May 2019 | Saturday | Overcast |
| 3 | 25 January 2020 | Saturday | Overcast |
| 4 | 29 January 2020 | Wednesday | Cloudy |
| 5 | 20 February 2020 | Thursday | Overcast |
| 6 | 22 February 2020 | Saturday | Overcast |
| 7 | 19 March 2020 | Thursday | Cloudy |
| 8 | 21 March 2020 | Saturday | Cloudy |
| 9 | 11 April 2020 | Saturday | Cloudy |
| 10 | 15 April 2020 | Wednesday | Cloudy |
| 11 | 20 May 2020 | Wednesday | Overcast |
| 12 | 23 May 2020 | Saturday | Cloudy |
| 13 | 13 June 2020 | Saturday | Overcast |
| 14 | 18 June 2020 | Thursday | Cloudy |
| Name | Variable | Coefficient | Std.Error | z.Value | p-Value | |
|---|---|---|---|---|---|---|
| Date | ||||||
| 22 May 2019 | W_ori190522 | 0.590 | 0.035 | 16.652 | 0.000 | |
| CONSTANT | −14.621 | 9.747 | −1.500 | 0.134 | ||
| γ1 | 0.226 | 0.053 | 4.269 | 0.000 | ||
| γ2 | −0.511 | 0.128 | −3.994 | 0.000 | ||
| γ3 | 0.018 | 0.295 | 0.061 | 0.951 | ||
| γ4 | 3.367 | 0.719 | 4.682 | 0.000 | ||
| γ5 | 0.202 | 0.144 | 1.407 | 0.159 | ||
| γ6 | 0.740 | 0.101 | 7.335 | 0.000 | ||
| γ7 | 0.044 | 0.095 | 0.467 | 0.641 | ||
| 25 May 2019 | W_ori190525 | 0.599 | 0.035 | 17.197 | 0.000 | |
| CONSTANT | −19.550 | 10.136 | −1.929 | 0.054 | ||
| γ1 | 0.298 | 0.055 | 5.393 | 0.000 | ||
| γ2 | −0.533 | 0.133 | −4.005 | 0.000 | ||
| γ3 | 0.235 | 0.306 | 0.768 | 0.443 | ||
| γ4 | 3.197 | 0.747 | 4.282 | 0.000 | ||
| γ5 | 0.318 | 0.149 | 2.127 | 0.033 | ||
| γ6 | 0.647 | 0.105 | 6.184 | 0.000 | ||
| γ7 | 0.030 | 0.098 | 0.304 | 0.761 | ||
| 25 January 2020 | W_ori20200125 | 0.573 | 0.036 | 15.748 | 0.000 | |
| CONSTANT | −4.360 | 2.885 | −1.511 | 0.131 | ||
| γ1 | 0.011 | 0.016 | 0.687 | 0.492 | ||
| γ2 | −0.131 | 0.038 | −3.485 | 0.000 | ||
| γ3 | −0.061 | 0.088 | −0.699 | 0.484 | ||
| γ4 | 1.674 | 0.215 | 7.785 | 0.000 | ||
| γ5 | 0.150 | 0.043 | 3.496 | 0.000 | ||
| γ6 | 0.221 | 0.030 | 7.344 | 0.000 | ||
| γ7 | 0.010 | 0.028 | 0.364 | 0.716 | ||
| 29 January 2020 | W_ori20200129 | 0.526 | 0.039 | 13.547 | 0.000 | |
| CONSTANT | −0.150 | 2.480 | −0.060 | 0.952 | ||
| γ1 | −0.001 | 0.014 | −0.087 | 0.930 | ||
| γ2 | −0.131 | 0.032 | −4.056 | 0.000 | ||
| γ3 | −0.071 | 0.075 | −0.942 | 0.346 | ||
| γ4 | 1.525 | 0.184 | 8.269 | 0.000 | ||
| γ5 | 0.086 | 0.037 | 2.335 | 0.020 | ||
| γ6 | 0.198 | 0.026 | 7.674 | 0.000 | ||
| γ7 | −0.006 | 0.024 | −0.252 | 0.801 | ||
| 20 February 2020 | W_ori20200220 | 0.509 | 0.040 | 12.719 | 0.000 | |
| CONSTANT | 0.281 | 1.303 | 0.215 | 0.829 | ||
| γ1 | 0.003 | 0.007 | 0.385 | 0.700 | ||
| γ2 | −0.062 | 0.017 | −3.602 | 0.000 | ||
| γ3 | −0.021 | 0.040 | −0.533 | 0.594 | ||
| γ4 | 0.922 | 0.098 | 9.368 | 0.000 | ||
| γ5 | 0.024 | 0.020 | 1.220 | 0.223 | ||
| γ6 | 0.079 | 0.014 | 5.746 | 0.000 | ||
| γ7 | −0.012 | 0.013 | −0.966 | 0.334 | ||
| 22 February 2020 | W_ori20200222 | 0.479 | 0.041 | 11.656 | 0.000 | |
| CONSTANT | −0.216 | 1.241 | −0.174 | 0.862 | ||
| γ1 | 0.006 | 0.007 | 0.928 | 0.353 | ||
| γ2 | −0.062 | 0.016 | −3.811 | 0.000 | ||
| γ3 | −0.035 | 0.038 | −0.904 | 0.366 | ||
| γ4 | 0.786 | 0.094 | 8.408 | 0.000 | ||
| γ5 | 0.047 | 0.019 | 2.517 | 0.012 | ||
| γ6 | 0.081 | 0.013 | 6.204 | 0.000 | ||
| γ7 | −0.007 | 0.012 | −0.585 | 0.558 | ||
| Name | Variable | Coefficient | Std.Error | z.value | p-Value | |
|---|---|---|---|---|---|---|
| Date | ||||||
| 22 May 2019 | W_des190522 | 0.636 | 0.033 | 19.119 | 0.000 | |
| CONSTANT | −10.014 | 8.516 | −1.176 | 0.240 | ||
| γ1 | 0.081 | 0.045 | 1.804 | 0.071 | ||
| γ2 | −0.446 | 0.109 | −4.098 | 0.000 | ||
| γ3 | −0.008 | 0.251 | −0.031 | 0.975 | ||
| γ4 | 3.241 | 0.614 | 5.281 | 0.000 | ||
| γ5 | 0.384 | 0.123 | 3.128 | 0.002 | ||
| γ6 | 0.683 | 0.086 | 7.919 | 0.000 | ||
| γ7 | 0.072 | 0.081 | 0.893 | 0.372 | ||
| 25 May 2019 | W_des190525 | 0.633 | 0.033 | 19.084 | 0.000 | |
| CONSTANT | −14.554 | 8.950 | −1.626 | 0.104 | ||
| γ1 | 0.166 | 0.047 | 3.512 | 0.000 | ||
| γ2 | −0.458 | 0.114 | −4.011 | 0.000 | ||
| γ3 | 0.115 | 0.262 | 0.437 | 0.662 | ||
| γ4 | 2.804 | 0.641 | 4.376 | 0.000 | ||
| γ5 | 0.466 | 0.128 | 3.633 | 0.000 | ||
| γ6 | 0.639 | 0.090 | 7.108 | 0.000 | ||
| γ7 | 0.073 | 0.084 | 0.868 | 0.385 | ||
| 25 January 2020 | W_des20200125 | 0.565 | 0.037 | 15.150 | 0.000 | |
| CONSTANT | −1.387 | 2.868 | −0.484 | 0.629 | ||
| γ1 | −0.015 | 0.015 | −0.941 | 0.347 | ||
| γ2 | −0.101 | 0.037 | −2.767 | 0.006 | ||
| γ3 | −0.041 | 0.086 | −0.479 | 0.632 | ||
| γ4 | 1.464 | 0.211 | 6.948 | 0.000 | ||
| γ5 | 0.191 | 0.042 | 4.535 | 0.000 | ||
| γ6 | 0.222 | 0.030 | 7.511 | 0.000 | ||
| γ7 | 0.002 | 0.028 | 0.060 | 0.952 | ||
| 29 January 2020 | W_des20200129 | 0.560 | 0.037 | 15.303 | 0.000 | |
| CONSTANT | −0.041 | 2.175 | −0.019 | 0.985 | ||
| γ1 | −0.015 | 0.012 | −1.267 | 0.205 | ||
| γ2 | −0.106 | 0.027 | −3.860 | 0.000 | ||
| γ3 | −0.065 | 0.064 | −1.014 | 0.310 | ||
| γ4 | 1.480 | 0.158 | 9.384 | 0.000 | ||
| γ5 | 0.139 | 0.031 | 4.422 | 0.000 | ||
| γ6 | 0.165 | 0.022 | 7.462 | 0.000 | ||
| γ7 | −0.011 | 0.021 | −0.526 | 0.599 | ||
| 20 February 2020 | W_des20200220 | 0.543 | 0.038 | 14.205 | 0.000 | |
| CONSTANT | 0.872 | 1.158 | 0.753 | 0.452 | ||
| γ1 | −0.013 | 0.006 | −2.094 | 0.036 | ||
| γ2 | −0.054 | 0.015 | −3.649 | 0.000 | ||
| γ3 | 0.000 | 0.035 | −0.002 | 0.998 | ||
| γ4 | 0.808 | 0.085 | 9.511 | 0.000 | ||
| γ5 | 0.053 | 0.017 | 3.158 | 0.002 | ||
| γ6 | 0.076 | 0.012 | 6.385 | 0.000 | ||
| γ7 | −0.006 | 0.011 | −0.529 | 0.597 | ||
| 22 February 2020 | W_des20200222 | 0.533 | 0.039 | 13.737 | 0.000 | |
| CONSTANT | 0.586 | 1.087 | 0.539 | 0.590 | ||
| γ1 | −0.009 | 0.006 | −1.475 | 0.140 | ||
| γ2 | −0.045 | 0.014 | −3.280 | 0.001 | ||
| γ3 | −0.025 | 0.032 | −0.765 | 0.444 | ||
| γ4 | 0.660 | 0.080 | 8.297 | 0.000 | ||
| γ5 | 0.072 | 0.016 | 4.551 | 0.000 | ||
| γ6 | 0.070 | 0.011 | 6.279 | 0.000 | ||
| γ7 | −0.004 | 0.010 | −0.391 | 0.696 | ||
© 2020 by the authors. Licensee MDPI, Basel, Switzerland. This article is an open access article distributed under the terms and conditions of the Creative Commons Attribution (CC BY) license (http://creativecommons.org/licenses/by/4.0/).
Share and Cite
Nian, G.; Peng, B.; Sun, D.; Ma, W.; Peng, B.; Huang, T. Impact of COVID-19 on Urban Mobility during Post-Epidemic Period in Megacities: From the Perspectives of Taxi Travel and Social Vitality. Sustainability 2020, 12, 7954. https://doi.org/10.3390/su12197954
Nian G, Peng B, Sun D, Ma W, Peng B, Huang T. Impact of COVID-19 on Urban Mobility during Post-Epidemic Period in Megacities: From the Perspectives of Taxi Travel and Social Vitality. Sustainability. 2020; 12(19):7954. https://doi.org/10.3390/su12197954
Chicago/Turabian StyleNian, Guangyue, Bozhezi Peng, Daniel (Jian) Sun, Wenjun Ma, Bo Peng, and Tianyuan Huang. 2020. "Impact of COVID-19 on Urban Mobility during Post-Epidemic Period in Megacities: From the Perspectives of Taxi Travel and Social Vitality" Sustainability 12, no. 19: 7954. https://doi.org/10.3390/su12197954
APA StyleNian, G., Peng, B., Sun, D., Ma, W., Peng, B., & Huang, T. (2020). Impact of COVID-19 on Urban Mobility during Post-Epidemic Period in Megacities: From the Perspectives of Taxi Travel and Social Vitality. Sustainability, 12(19), 7954. https://doi.org/10.3390/su12197954


