Article

Analyzing the Relationships between Citizens’ Emotions and their Momentary Satisfaction in Urban Public Spaces

Department of the Built Environment, Eindhoven University of Technology, 5612 AZ Eindhoven, The Netherlands
*
Author to whom correspondence should be addressed.
Sustainability 2020, 12(19), 7921; https://doi.org/10.3390/su12197921
Submission received: 20 August 2020 / Revised: 21 September 2020 / Accepted: 22 September 2020 / Published: 24 September 2020
(This article belongs to the Section Sustainable Urban and Rural Development)

Abstract

:
It is recognized that the urban environment, and specifically better-experienced urban public space, contribute to people’s subjective well-being. However, research on people’s momentary subjective well-being (i.e., emotional state) in relation to the multiple aspects of urban public spaces is still limited. Therefore, the aim of this study was to analyze people’s emotional state and how this is influenced by the momentary satisfaction with urban public spaces, and also controlling for personal and experience characteristics. Data of 1056 momentary experiences of 161 citizens regarding the urban public space in Eindhoven, The Netherlands, were collected by means of an experience sampling method (ESM). These data were analyzed using a mixed multinomial logit (MMNL) model for each dimension of people’s momentary subjective well-being (i.e., sense of security, comfort, happiness, and annoyance). Results of this study showed that people were happier when they were satisfied with the atmosphere of the public space and felt more secure, comfortable, and less annoyed when they were more satisfied with traffic safety. Results could be used by policymakers and urban planners to create inclusive urban public spaces where people have more positive experiences, which eventually could lead to happier, comfortable, more secure and less annoyed citizens.

1. Introduction

It is expected that, in 2050, two thirds of the world’s population will be living in cities [1]. It is recognized that features of a city influence how we experience the urban environment and consequently have an impact on our feelings or emotions [2]. Therefore, designing cities that are attractive and responsive to citizens’ needs and demands and where people have more positive experiences has become increasingly important for policymakers, urban planners, managers and designers [3,4].
A vital asset of a city is its public spaces [5], which can be defined as “open spaces,” which are indoor or outdoor spaces that are accessible to the public (e.g., streets, walkways, parks, public transportation facilities, public shopping facilities, and other spaces where people gather or pass through) [6,7,8]. It is recognized that a better-experienced urban public space (especially urban public spaces with natural elements) could have advantages for people’s psychological and physical health, which eventually could contribute to their overall quality of life [1,9,10]. In contemporary cities, urban public spaces often offer insufficient facilities or are misused, and therefore face the risk of deterioration [11]. In cities that fail to tackle the rapid growth population rates and societal changes, the maintenance of urban public spaces becomes a public burden [12], which consequently could result in negatively experienced urban public spaces and eventually thus negative emotional outcomes. Because of their potential to improve the quality of life of citizens, public spaces are increasingly considered as a potential setting for urban regeneration strategies.
According to Carr et al. [13], to avoid the deterioration and to ensure the regeneration of urban public spaces, the planning process should include citizens’ experiences, opinions, and needs. Although the way people feel (e.g., perceived safety) in relation to urban public spaces is highly important for the support of decision-making processes of urban design, there is still limited knowledge on the momentary subjective well-being (i.e., emotional state) in relation to urban public spaces [14].
Only a few studies focus on emotions in relation to specific urban environment features. For example, studies have shown that annoyance is one of the most important subjective effects of urban noise [15,16]. Furthermore, the perception of urban safety [17], green/natural elements in the urban environment [18], or urban smell [19] could also affect people’s emotional state [20]. However, these abovementioned studies focus mainly on one specific element of the urban environment (e.g., on urban safety, noise, smell, or green). To obtain more insight regarding all dimensions of people’s momentary subjective well-being (SWB) and how this is influenced by the satisfaction with the multiple aspects of the urban public space, further research is needed.
People’s emotional state could be described as momentary subjective well-being (SWB), which could vary over time and place [21]. It is expected that the way urban environments in cities are perceived (i.e., satisfaction) by citizens could also influence how they feel momentarily (i.e., momentary SWB). Birenboim [22] described momentary SWB of the urban environment as a construct of four independent emotional states or dimensions (feelings), namely, sense of security, comfort, happiness, and annoyance. In this current study, we also expect that these emotional states together form people’s momentary SWB, which could be influenced by the momentary satisfaction (i.e., perception) with the urban public space and the objective and subjective characteristics of the experience (e.g., time, location characteristics, company, activity, and familiarity) with the urban public space.
This study used a quantitative approach to measure momentary experiences, momentary SWB, and satisfaction with characteristics of urban public spaces. First, a questionnaire was used to collect data on people’s personal characteristics (e.g., age, gender, health condition, work situation, and personality). Next, data on people’s momentary experiences with regard to the urban public space were collected by means of a (near-real time) web-based Experience Sampling survey with a geotagging functionality. So, respondents were asked to report all their positive and negative experiences with regard to urban public spaces in Eindhoven at the moment of their experience (i.e., event-contingent experience sampling method (ESM)) [23]. They were simultaneously asked to indicate the location of the experience on a map. This Global Positioning System (GPS) location data and information about the time/date were used to extract secondary data (i.e., distance to facilities). This could give more insight into the influence of the objective characteristics (i.e., time and place) of the experience on people’s momentary SWB [21]. Using this methodology, it was possible to derive a heterogeneous dataset of (near real-time) momentary experiences in the city and explore the relationships between people’s emotional state (i.e., momentary SWB) and their satisfaction with several characteristics of the urban public space.
This study was done within the framework of the European Union Horizon 2020 project “Regeneration and Optimization of Cultural heritage in creative and Knowledge cities” (ROCK) and Actieagenda Ruimtelijk Ontwerp 2017–2020 of the Rijksoverheid of the Netherlands. The ROCK project aims to develop an innovative, collaborative, and circular systemic approach for the sustainable regeneration and adaptive reuse of historic city centers. In the ROCK project, one of the sub-goals is the regeneration of open public spaces for enabling more positively experienced spaces for the residents in cities. In the ROCK project, the case area of the City of Eindhoven is Strijp-S, which is a redeveloped industrial heritage site. However, in this study, we looked into the whole city instead of limiting the study to the ROCK case area, since focusing on the whole city can provide a better understanding of the influence of a variety of urban physical characteristics on momentary experiences.

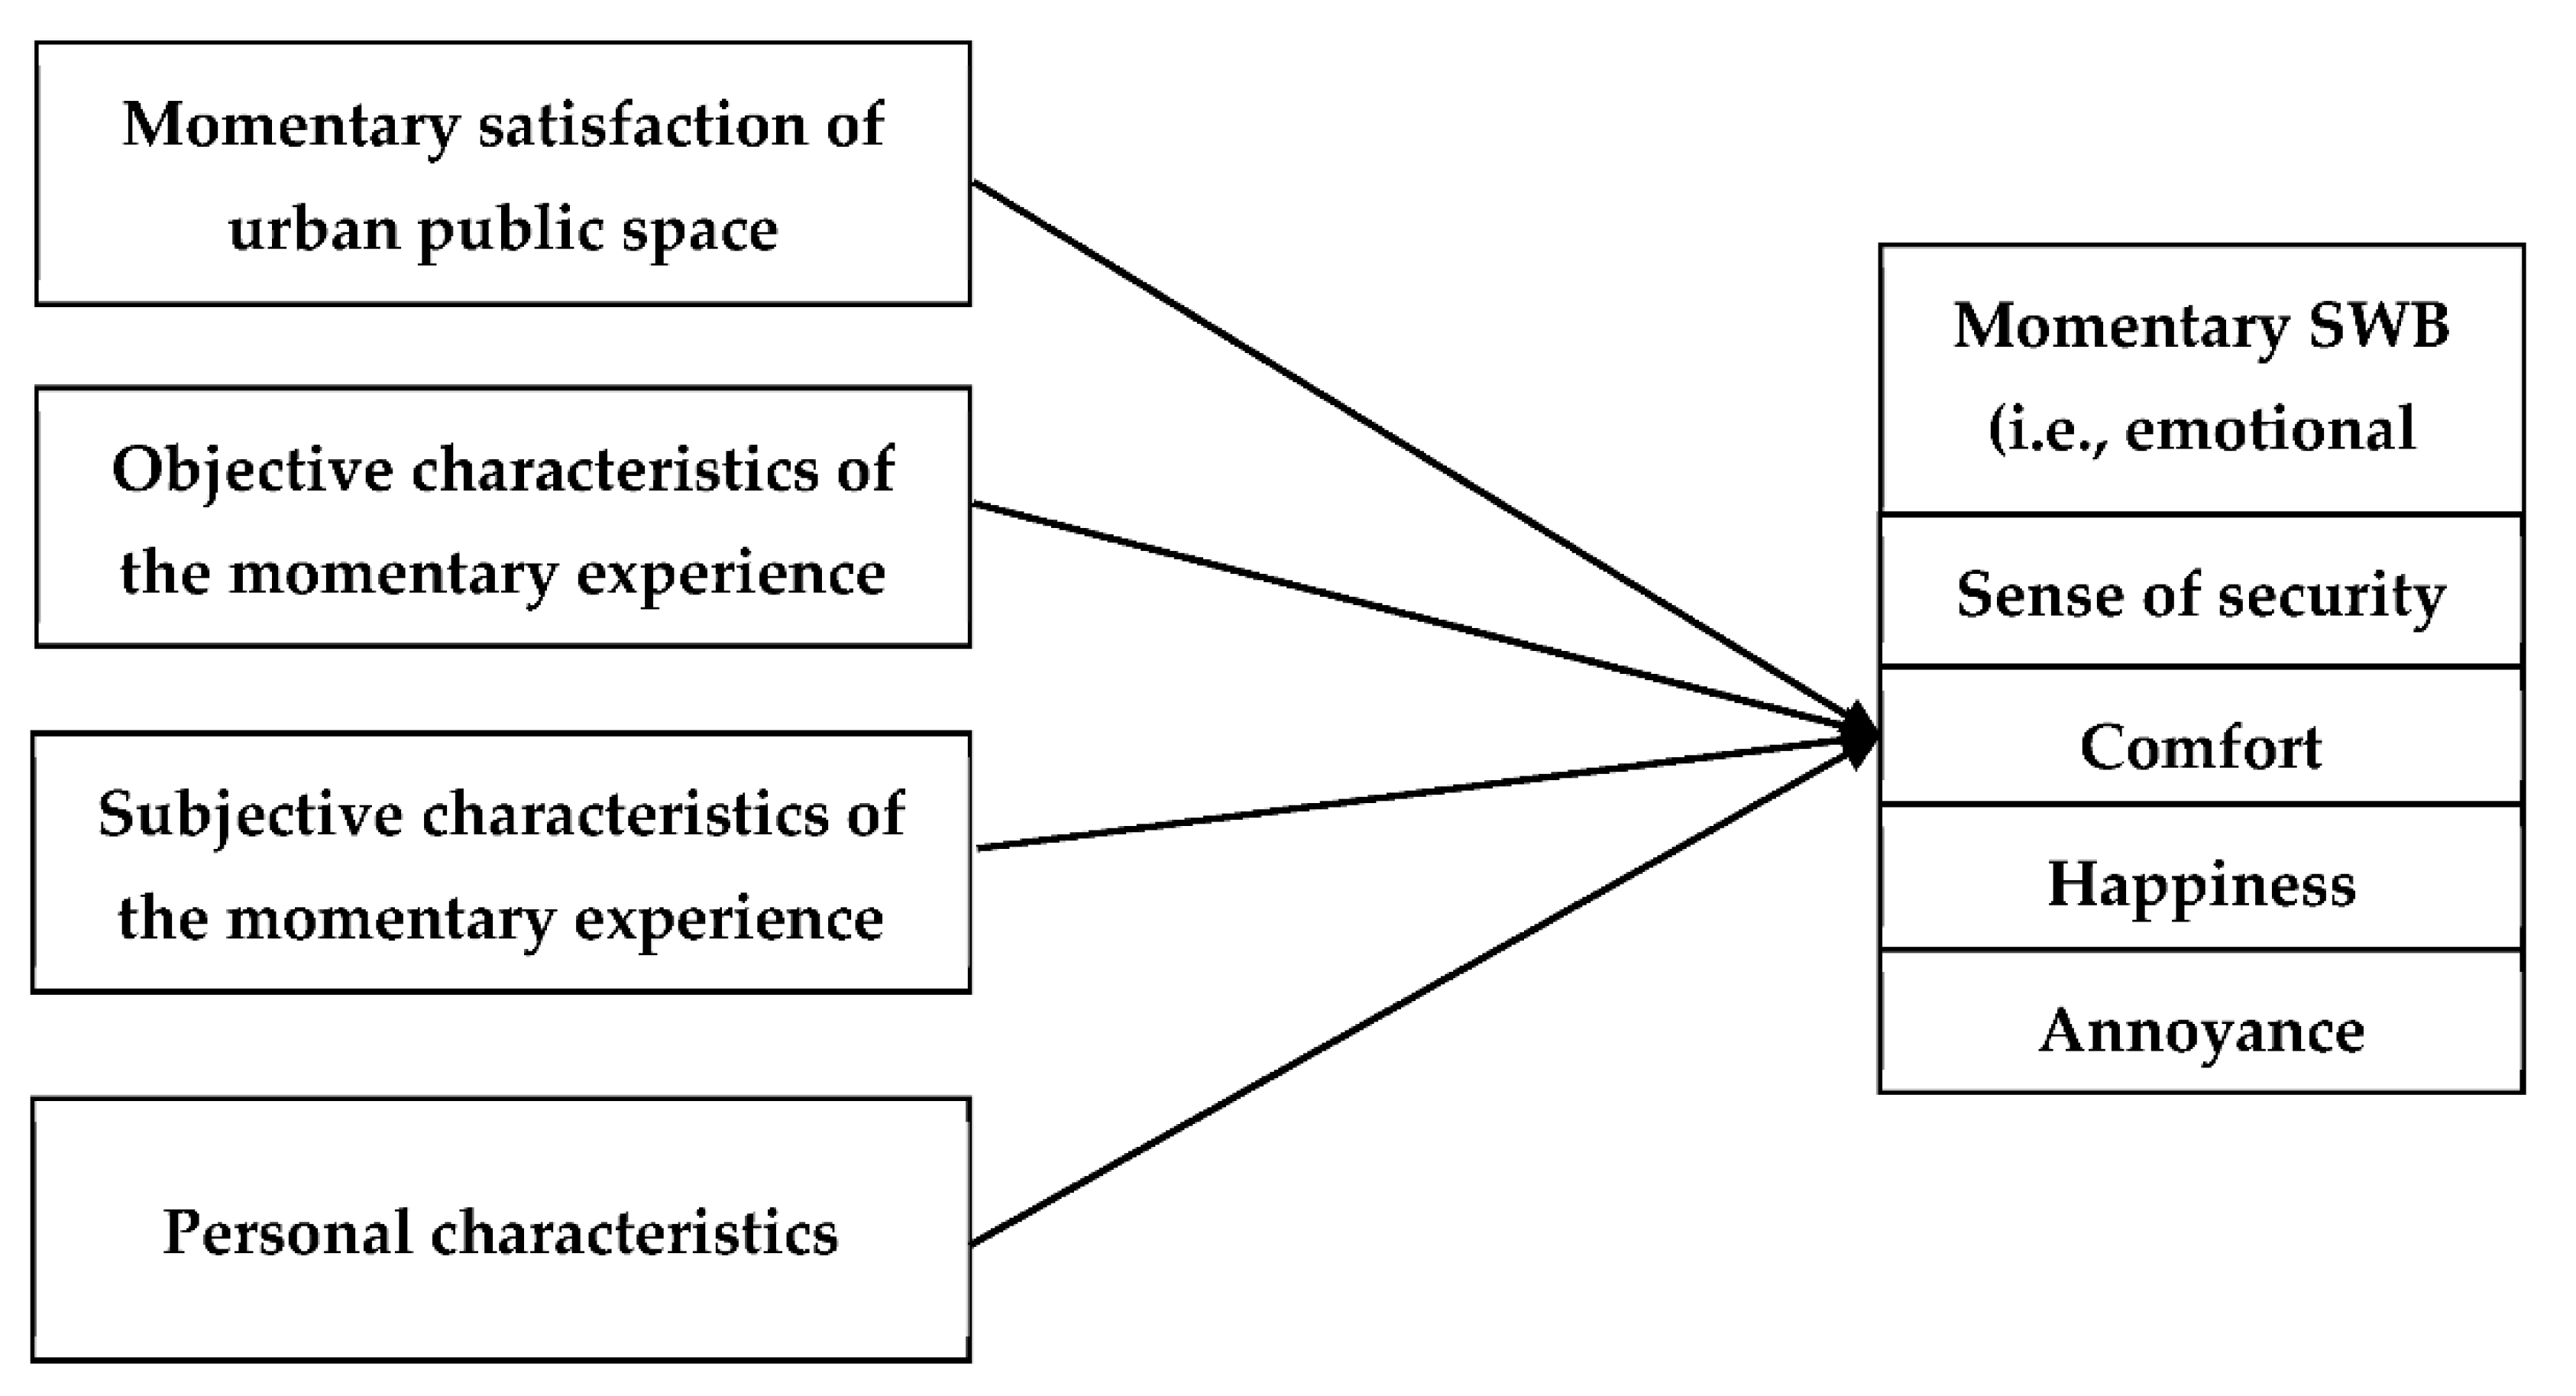
2. Theoretical Framework

Tonnelat [8] described urban public spaces as spaces in the city that are accessible to the public, such as streets and parks, transportation facilities, or shopping facilities. These public spaces are important for providing opportunities for movement, communication, enjoyment, and relaxation [13]. Mehta [24] discussed five dimensions to evaluate a public space, namely, that a good public space is meaningful and supports different activities, it should be pleasurable, accessible to varying individuals and groups (i.e., inclusiveness), provide a sense of safety, and provide physical and environmental comfort. The evaluation of public spaces was further improved by Zamanifard et al. [7], who proposed the user-centered Public Space Experiential Quality Index (PSEQI) to measure comfort, inclusiveness, diversity and vitality, and image and likeability.
Understanding the emotional response to urban public space is important for the decision-making process when developing urban areas. It has been recognized for a long time that people’s behavior (B) could be influenced by personal characteristics (P) as well as the environment (E) (i.e., B = f (P, E)) [25]. Furthermore, it is believed that spaces and places are interconnected with emotions, and every experience of a location can evoke an emotion [26]. Thus, when people interact with their environment at a certain moment, this could result in a momentary subjective experience, which evokes a momentary affect [27]. Affect could be described as an inclusive concept that refers to people’s emotions [28]. For example, it is recognized, based on an extensive literature review, that physical activity in a natural environment leads to more positive emotions [29]. Other studies also showed that people are in a better mood and report lower levels of anxiety and stress after visiting a park [20]. Birenboim [22] defined four dimensions of people’s momentary emotions, namely, sense of security, comfort, happiness, and annoyance. These emotional states (Table 1) are used, in this current study, to explain the relationships between the experience with regard to urban public spaces and people’s emotional outcomes.

2.1. Happiness

Most studies that have analyzed emotions in relation to urban space focus on happiness, as this is an important element of people’s (mental) health and well-being. For example, results of the study by Negami et al. [30] showed that spaces with green and which are colorful were related to higher levels of happiness. Also, the architecture of the urban space was found to have an effect on happiness [31]. Furthermore, air pollution was found to negatively influence feelings of happiness [32,33]. In addition, Sepe [34] defined principles of public spaces that are important for urban happiness. First, a public space should be multifunctional and have a good balance between nature and equipment (e.g., benches, playgrounds, and exercise equipment, etc.). Next, the public space should be clean and well maintained and people should feel safe (e.g., by means of artificial light in the evening) at these spaces. Furthermore, the smell of nature (e.g., grass, wood, or sea) is important for people to feel happy at public spaces. Finally, noise by transportation should be minimized in public spaces to increase happiness.

2.2. Annoyance

Besides happiness, people could also feel annoyed as a reaction to their urban environment, which is mainly related to noise pollution [15]. Studies showed that living close and having access to green areas was related to lower levels of noise annoyance [35,36]. Another study by Gozalo, Morillas, and González [37] showed that noise is the most important indicator of being satisfied with a park and that noise from road traffic is more annoying in small parks. Also, for people who attend a park for tranquility, quietness is important [38]. In addition, smell also influences how people perceive places [19]. For example, a study showed that annoyance from (offensive) smells was related to low residential satisfaction [39].

2.3. Sense of Security

Another important dimension of momentary SWB, in relation to the urban environment, is sense of security [22]. It is important that a sense of security is provided at urban public spaces, otherwise this could lead to negative effects such as fear, anti-social behavior, and stress outcomes [40]. Sense of security is related to safety, which is recognized to be one of the most important factors when evaluating the quality of public spaces [24]. When people perceive a place as unsafe, they could choose to use the place less often or even avoid it. Previous research showed that more green spaces in the living environment was found to affect people’s perceived safety [41,42]. Feeling safe also depends on the time of the day [43], namely, people feel less safe in the evening than during the day. This might be caused by the fact that perceived prospect (i.e., ability to see) is lower in the evening. It is recognized that the ability to see is related to perceived environmental safety [44].

2.4. Comfort

With regard to feeling comfortable, research showed that openness and better acquaintance with a public space could improve people’s perception of comfort of an urban public space [45]. Other characteristics that could contribute to comfort in public spaces are suitable and attractive street furniture, generous sidewalk width, and trees [6]. Furthermore, for people who attend a park for tranquility, besides quietness, visual aspects (i.e., aesthetic quality) are important aspects for feeling comfortable [46].

2.5. Momentary Experience of Urban Public Spaces

Studies focusing on all four dimensions of momentary SWB (i.e., emotional states) defined by Birenboim [22] are still limited. A single previous study by Weijs-Perrée et al. [47] analyzed the influence of people’s momentary satisfaction with urban public spaces on people’s momentary and long-term SWB, including all dimensions. They found a positive effect of the overall satisfaction with urban public spaces with people’s momentary SWB (the sum score of the degree of feeling secure, comfortable, happy, and annoyed). However, this study did not look into detail at each emotional state and the differences between them. In addition, the effects of specific characteristics of satisfaction with urban public spaces (e.g., green, air quality, traffic safety or noise pollution) were not analyzed. Only a few studies have focused on analyzing the relationships between the momentary emotional state and the urban environment [22,48]. However, these studies are mainly based on a sample of students and therefore homogenous. Thus, research on momentary experiences with regard to multiple aspects of the urban public space in relation to people’s emotional state is still limited.
Table 1. Overview of important aspects of urban public spaces for momentary subjective well-being (SWB).
Momentary SWB (i.e., Emotional State)
HappinessAnnoyanceSense of SecurityComfortOverall Momentary SWB
Satisfaction with urban public space characteristicsAir quality [15]
Green/natural elements [30]
Cleaning/maintenance [34]
Perceived safety [34]
Smell [34]
Noise [37]
Smell [19,39]
Control over time (e.g., looking for a parking space or traffic jams) [49]
Perceived safety [24]
Green/natural environments [41,42]
Aesthetic quality [6,45,46]
Noise [46]
Atmosphere/ambiance of a place [50]
Distance to facilities (e.g., shops) [46]
Furthermore, only a few studies tried to map emotions to specific places in cities. For instance, Matei, Ball-Rokeach and Qiu [51] tried to visualize feelings of fear and comfort in Los Angeles, based on people’s perceived emotional response to places in the city. This study was based on perceived emotions from the past and did not focus on real-time emotions. Another study used GPS and geotagging techniques to measure people’s experience of public open spaces [52]. However, this study only analyzed positive/negative experiences and did not look in detail at people’s emotions in response to the urban environment. Furthermore, earlier studies did not incorporate the satisfaction with different attributes of urban environment in their studies. Therefore, it is still not clear which elements of the perceived urban public space are most important for explaining people’s emotional state, also when controlling for objective and subjective characteristics of the momentary experiences and personal characteristics. Therefore, this current study contributes to previous research by using GPS location data (i.e., geotagging) to extract objective characteristics of the momentary experiences and analyze (near) real-time emotional responses to urban public spaces based on a dataset of experiences from a heterogeneous sample. Figure 1 shows the conceptual model with all expected relationships.

3. Materials and Methods

3.1. Data Collection

The web-based data collection instrument consisted of two parts. For the first part, respondents were asked to answer questions about their demographics (i.e., age, gender, and education level), work situation, homeownership, and household composition. Furthermore, they were asked about their long-term subjective well-being (SWB). The measurement of SWB was based on the Satisfaction with Life Scale (SWLS) by Diener et al. [53], combined with the 10-item international Positive and Negative Affect Schedule Short Form (I-PANAS-SF) by Thompson [54]. This combined measurement was also used by Saw, Lim, and Carrasco [55]. The 5-item SWLS scale consists of the following items, namely “In most ways my life is close to my ideal,” “The conditions of my life are excellent,” “I am satisfied with my life,” “So far I have gotten the important things I want in life,” and ““If I could live my life over, I would change almost nothing.” Participants were asked to indicate how much they agree or disagree with each of these items based on a 7-point scale ranging from (1) strongly disagree to (7) strongly agree.
For the 10-item I-PANAS-SF, participants were asked to rate on a scale from 1 (never) to 5 (always) how often they generally felt a particular emotion or feeling. This scale consists of several emotions to measure positive affect, namely, active, inspired, determined, alert (i.e., aware, watchful, on guard), attentive (i.e., paying close attention to something), and to measure negative affect, namely, the emotions upset, hostile, ashamed, afraid, and nervous. Overall, long-term SWB was measured by the following sum, adapted from Saw, Lim, and Carrasco [55]: long-term SWB = positive affect (5 items) + reversed score of negative affect (5 items) + life satisfaction (5 items). It is suggested that a Cronbach’s alpha of 0.7 (and sometimes 0.6) is acceptable [56]. Thus, the Cronbach’s alpha of the total sum of these 15 items of 0.790 is acceptable.
Also, a single-item question was used to measure perceived health, namely, by asking respondents about their general health condition, based on a 5-point Likert scale ranging from (1) poor health to (5) excellent health. Next, for measuring personality and specifically the Big Five personality traits (i.e., extraversion, agreeableness, conscientiousness, emotional stability, and openness), the 10-item scale BFI-10 (Big Five Inventory) by Rammstedt and John [57] was used. This scale is based on the original 44-item Big Five Inventory [58] and consists of the ten personality traits, namely, (1) reserved, (2) generally trusted, (3) lazy, (4) relaxed, (5) few artistic interests, (6) outgoing, sociable, (7) tends to find fault with others, (8) does a thorough job, (9) nervous, and (10) an active imagination. The scoring of the personality traits was adapted from Rammstedt and John [57], namely, Extraversion: sum of item 1 (reversed) and item 6; Agreeableness: sum of item 2 and item 7 (reversed); Conscientiousness: sum of item 3 (reversed) and item 8; Neuroticism: sum of item 4 (reversed) and item 9; Openness: sum of item 5 (reversed) and item 10. The sum scores show low-to-moderate Cronbach’s alphas (α = between 0.309 and 0.735) which indicates that the homogeneity was not so high, which is not surprising for short scales [59]. A previous study that measured personality traits, using the same method, also showed lower Cronbach’s alphas, which is directly influenced by the low number of items (i.e., two items) [60].
Next, for the second part, an ESM approach was used. Specifically, the event-contingent ESM method was used to collect data on all positive and negative experiences and/or feelings with regard to urban public spaces in the city. The purpose of the event-contingent method is that participants are asked to report all events at the moment when they occur [23]. This ESM type is recommended, because the chance is limited that experiences with regard to the urban public environment occur within a short time period [61]. One of the main advantages of this sampling technique is that it is possible to repeatedly measure people’s momentary experiences in a real-life situation for a longer period of time, compared to traditional questionnaires [22].
For the ESM approach, a web-based questionnaire was used. Respondents were asked to self-report all their experiences (not work-related and at-home experiences) with regard to urban public spaces in the city for two weeks. For example, when people walked alone in the evening around the train station and they felt very unsafe, they were asked to report this experience. For every experience, respondents were first asked to geotag their GPS location of their experience on a map from OpenStreetMap (OSM). Next, they were asked to answer several questions about the type of the location (e.g., leisure location, shopping, or relocating), activity during the experience, transportation mode to the experience location, previous knowledge of the location (i.e., familiarity), and company during the experience.
Furthermore, to measure respondents’ momentary emotions (i.e., momentary SWB), they were asked to indicate, on a 5-point Likert scale, how secure, comfortable, happy, and annoyed they felt during the experience [22]. In the analyses, the reversed version of feeling annoyed is used, which makes it easier to compare it with the other emotional states that are positively oriented.
Finally, to measure the satisfaction with the urban environment, respondents were asked to indicate to what extent they were satisfied with several characteristics of urban public spaces at the moment of their experience. This question was based on a 5-point Likert scale, ranging from (1) very dissatisfied to (5) very satisfied. Based on the extensive literature review in the previous section, several characteristics were expected to influence people’s emotional state (see Table 1).

3.2. Procedure

Data were collected in June 2019 among citizens of Eindhoven. The municipality of Eindhoven has a panel of citizens (called “Digipanel Eindhoven”) who are willing to participate in research on city-related issues. Respondents of this current study were approached by using an online link to the first questionnaire in a newsletter, which was sent to all participants of the panel. They were also asked about their willingness to participate in the second part of the study (ESM part) and whether they wanted to share their email address. This way, we were able to remind them two times a days during two weeks to report all their experiences with regard to the urban public space in Eindhoven. It was important that respondents participated in the first (general questionnaire) and second part (ESM part) of this study to analyze the experiences. Therefore, participants who were not willing to share their email address were not able to continue the questionnaire. Furthermore, participants were asked to give their informed consent for inclusion before they participated in the study, and they were able to stop at any time during the research period.
To increase the response rate, participants were rewarded with a gift voucher of 10 euros when they participated in both the first and second part of this study. For the first part, the limit was set at 300 participants because of the budget limitations. Of these participants, 161 participants also reported one or more experiences during the two weeks (i.e., second ESM part). In total, these 161 participants reported 1056 momentary experiences (M = 6.56, SD = 6.32). Although participants were reminded two times a day for two weeks, many participants reported only one experience (see Figure 2). Therefore, many experiences were probably not recorded, which could have led to a biased sample. However, because of the high number of reported experiences (N = 1056), the dataset is still suitable for analyzing the relationship between experience characteristics and people’s emotional state at the moment of the experience with the urban public space.

3.3. Analytical Approach

First, a test of parallel lines was performed to test the assumption of the ordered logit model that the regression coefficients are the same for all categories. The Chi-square statistics are significant for happiness (p = 0.00), sense of security (p = 0.00), comfortable (p = 0.00), and annoyed (reversed) (p = 0.00). Thus, the assumption of the ordered logit model was rejected. Therefore, it can be concluded that ordered logit coefficients are not equal across the levels of happiness, sense of security, comfortable, and annoyed (reversed) and that using an ordered logit model is not valid for analyzing these emotional states. Therefore, to analyze the relationships between satisfaction with the urban environment and people’s momentary emotions (i.e., SWB) and controlling for personal (e.g., personality, age, or gender) and experience characteristics (e.g., time, location characteristics, weather, company, activity, and familiarity), a mixed multinomial logit model (MMNL) was used. A MMNL is a very efficient and flexible discrete choice model [62,63] for analyzing data with a panel structure (i.e., multiple experiences and related feelings/emotions by the same respondent). Furthermore, using this approach, it is possible to capture unobserved heterogeneity [64]. The model also accounts for the clustering of experiences in respondents.
In the estimated models, an experience is the unit of analysis and the dependent variable is people’s momentary SWB, which consists of the emotional states: sense of security, comfort, happiness, and annoyance. For each of these emotional states, a MMNL model was estimated. In every model, the dependent variable was the “choice” or alternative for the emotional state at the moment of the experience with regard to the urban public space, whereby each emotional state consisted of three alternatives (i.e., a negative, neutral, and positive emotion, where neutral was taken as the base alternative). To reduce the number of parameters, the five categories of each emotional state were merged into three categories. For example, with regard to the emotional state “happiness,” alternative 1 is unhappy, alternative 2 is neutral, and alternative 3 is happy.
Furthermore, a random parameter was estimated for the utility constant term for each alternative of the people’s emotional states during the experiences to capture possible heterogeneity in base preferences. The Cholesky decomposition was used to estimate correlations (i.e., similarities between categories within the emotional states) between the random parameters [63].
In each MMNL model, the independent variables, namely, subjective and objective experience characteristics, personal characteristics, and satisfaction with the urban environment, were included as interactions with all the emotional state alternatives (e.g., satisfaction with the atmosphere of urban public space × alternative 1: unhappy). The coefficients of the interaction terms are estimated as nonrandom parameters to reduce degrees of freedom. Furthermore, interaction terms for one independent variable were stepwise added and removed at a time. In addition, to compare the models of the different emotional states (i.e., sense of security, happiness, comfort, and annoyance), the same parameters were included in the four MMNL models.

4. Results

4.1. Experience Characteristics

With regard to the experience characteristics (i.e., unit of analysis is an experience of an urban public space), Table 2 shows that slightly more than half of the experiences (58%) were with one or more other people and most experiences were outdoors (83%). Most experiences (37%) took place on the road (when relocating) or at an outdoor public space (e.g., park) (21%). Other experiences took place at a shop/mall (14%) or at a culture/sports venue or facility/café/restaurant/bar (13%). The transportation mode that was most frequently used to travel to the location of the experience was a bicycle (49%) or walking (30%). The average temperature during the experiences was 24 °C, and during 5% of the experiences it rained.
Figure 3 shows the distribution of experiences in Eindhoven. The area was divided into 100 m hexagons and the number of experiences were counted per hexagon. Most experiences were reported in the city center, at or near parks (e.g., Genneper Park or Stadswandelpark), the central train station, and shopping areas. Figure 4 shows the intensity of the four dimensions of momentary subjective well-being (i.e., sense of security, happiness, comfort, and annoyance) at the moment of the experience. Overall, people felt very secure, happy, comfortable, and less annoyed during experiences in the city. However, during experiences in some parts of the city (e.g., areas in the city center, the Kruisstraat (i.e., multicultural street) and at tunnels), people felt more negative experiences.
In addition, for Strijp-S (the case area of the ROCK project), 18 momentary experiences were registered. These experiences were, in general, positive and showed a similar pattern as the whole city. Comparing the momentary experiences in Strijp-S to the overall experiences in the city, it was found that people felt on average happier (M = 3.777, SD = 1.395), more comfortable (M = 4.111, SD = 1.323) but more annoyed (M = 3.455, SD = 1.041) and less secure (M = 4.0, SD = 1.328) during their experiences in the Strijp-S area. The momentary experiences that were less positive were reported to be related to the traffic and parking spaces.
The results on the satisfaction with aspects of the urban environment show that, overall, people are satisfied with the urban public spaces. During 50% of the experiences, respondents were (very) satisfied with the smell (e.g., smell from traffic or restaurants), and during 53% of the experiences, respondents were (very) satisfied with natural elements. In addition, during 55% of the experiences, respondents were (very) satisfied with the traffic safety (e.g., sidewalks, speed humps, and traffic lights), and during 60% of the experiences, respondents were (very) satisfied with the air quality (e.g., air pollution from traffic or ventilation). Also, during the experiences, respondents were (very) satisfied with the aesthetic quality (e.g., decor, design, architecture, or color schemes) (61%), (very) satisfied with the cleaning and maintenance of the urban public space (65%), (very) satisfied with the atmosphere (e.g., lively ambience) (67%), and (very) satisfied with the accessibility of the location (e.g., by car, by public transport, and walking) (76%).

4.2. Participant Characteristics

As can be seen in Table 3, the participants of this study consisted of a comparable share of women and men, which is comparable to the population of Eindhoven. In addition, the sample consists of a lower percentage of people aged between 18 and 35 years and a higher percentage of people aged over 45, compared to the population of Eindhoven. Thus, the sample is not completely representative of the population of Eindhoven. This is probably also related to the relatively high percentage of respondents who are retired, and who probably had more time to take part in this study. Next, a higher percentage of the participants are couples living without children and a lower percentage of the participants are one-person households, compared to the population of Eindhoven. Also, a large share of participants own their home and perceive their health as (very) good or excellent.

4.3. Results of MMNL Models

Table 4 shows the estimation results of the four MMNL models related to the emotional states (i.e., sense of security, happiness, comfort, and annoyance). Some characteristics of the urban environment, such as air quality, aesthetic quality, accessibility, natural elements, noise, and cleanliness and maintenance were not found to be significantly related to one of the emotional states. The related nonrandom parameters were stepwise removed from the models to reduce degrees of freedom. The significant standard deviations of the random parameters in Table 4 show that there exists unobserved heterogeneity in preferences between users of urban public spaces. These findings suggest, for example, that users differ in their propensity (i.e., chance) to have an emotional response (i.e., negative, neutral, or positive) to an urban public space.

4.3.1. Sense of Security

With regard to the first emotional state, namely, sense of security, the results showed that when people feel more satisfied with the traffic safety of the experience location, the probability is higher that they would also feel more secure. Also, when an experience takes place at an outdoor urban public space, people tend to feel less secure compared to an indoor experience. In addition, people feel less secure during relocating/travelling. A higher distance to shops also leads to higher levels of feeling secure. Finally, people feel more secure when they rate their overall well-being higher.

4.3.2. Happiness

The probability that people are happier is higher when people are more satisfied with the atmosphere (e.g., lively ambiance) and smell of the urban public space. In addition, people felt happier when relocating/travelling compared to other experienced locations (i.e., shop/mall). This could also be related to the result that when the distance to shops/malls is lower, the probability that people feel less happy is higher. This result suggests that a higher distance to shops leads to higher levels of happiness. A public outdoor location is also related to a higher probability of feeling happy. With regard to the day of the week, people feel happier during experiences on the weekend compared to experiences during weekdays. Time (i.e., daytime or evening) was not found to be significant and was therefore removed from the models. Also, age was found to be related to people’s momentary SWB (i.e., happiness). The results suggested that people aged under 45 years feel less frequently unhappy during the momentary experiences than people older than 45 years. Finally, personality traits were found to be important for explaining people’s happiness. The results showed that people who are more agreeable are less likely to feel unhappy, compared to people who are more neurotic.

4.3.3. Comfort

With regard to feeling comfortable, the results showed that when an experience takes place at an outdoor urban public space, people feel less comfortable than at indoor public spaces. People feel more comfortable at a leisure location (e.g., culture/sports venues or at a café/restaurant/bar) compared to other locations (e.g., shop/mall or during travelling). Being satisfied with traffic safety and smell of the urban public space is also important for feeling comfortable. In addition, the probability is lower that people with reasonable/bad perceived health conditions feel comfortable during the experience of the urban public space. Also, people who perceive their general well-being as more positive are more likely to feel comfortable during a momentary experience of an urban public space.

4.3.4. Annoyance

With regard to annoyance, the results showed that people feel more annoyed when relocating/travelling during an experience compared to other experienced locations (e.g., leisure location, public outdoor location, or shop/mall). Also, being satisfied with the traffic safety is important for not feeling annoyed. With regard to sufficient parking spaces, respondents feel less annoyed when they are more satisfied with the amount and quality of parking spaces at the urban public space. In addition, the results showed that people who walked (i.e., 30% of the experiences) to the location of the experience felt less annoyed compared to other transportation modes (e.g., bicycle, car, or public transport). Finally, when people perceive their overall subjective well-being as higher, they also feel less annoyed during a momentary experience.

5. Discussion and Future Directions

Only a few studies focused on people’s emotional state in relation to satisfaction with urban public spaces based on experiences in the city. However, these are mainly based on a homogeneous sample (i.e., students) [22,48]. This study used a more heterogeneous sample among citizens of Eindhoven and aimed to analyze people’s emotional state and how this is influenced by satisfaction with urban public spaces, when controlling for personal (e.g., age, gender, health, and personality) and experience characteristics (e.g., time/day, location characteristics, company, activity, and familiarity).
Significant relationships were found between people’s emotional state and the momentary satisfaction with the urban space. A better-perceived atmosphere of an urban public space was found to lead to more positive emotional states. Atmosphere is related to the ambiance (e.g., cozy, lively, popular, or joyful, etc.) of an urban place, which is a multifaceted (physical, physiological, sociological, cultural, and psychological) concept. Although the ambiance of urban places is already recognized to have an effect on how people perceive places [50], it remains difficult to measure and analyze the atmosphere/ambiance of a place. Future research should analyze which design characteristics of the built environment could support the atmosphere or ambiance of urban public spaces.
With regard to transportation-related aspects, the results showed that traffic safety is an important indicator for people’s emotions (i.e., momentary SWB). It is also recognized that there is a relationship between perceived safety and walkability of the environment and people’s well-being [65]. Only a few studies found a positive relationship between perceived urban safety and people’s emotional state (i.e., feelings of happiness) [17], but they did not look in detail at annoyance or comfort. More research is needed on measurements to improve perceived traffic safety in urban areas and how these measurements can be implemented in the urban design.
Walking as a transportation mode results in less annoyance among users of urban public spaces. This might suggest that the walking facilities are perceived qualitatively better than the other transportation facilities. In addition, people could also feel more annoyed because of the decreased control over time when using a car or public transport compared to walking. This is related to the results that people feel less annoyed if they perceive sufficient parking spaces. Robin, Matheau-Police and Couty [49] also suggested that the lack of control over time in relation to car use (e.g., looking for a parking space or a traffic jam) is an important environmental annoyance in urban areas. Thus, urban planners and policymakers could stimulate walking in urban areas by creating more attractive walkways or designing car-free areas, where people feel less annoyed, to increase positive momentary experiences.
Not all characteristics of urban public spaces that were found in the literature were also found to significantly affect momentary SWB, namely, air quality, aesthetic quality, accessibility, natural elements, noise, and cleanliness and maintenance were not significant. For example, previous studies showed that air pollution (i.e., air quality) [32] is negatively, and natural elements are positively [18], related to feelings of happiness, and that noise (e.g., from traffic) could lead to annoyance [36]. However, these studies mainly focused on one aspect of the urban environment. This suggests that some characteristics of the urban environment (e.g., traffic safety, atmosphere, and parking facilities) are more important than other characteristics.
The distance to shops was found to be an important indicator for people’s emotional state (i.e., degree of feeling happy, comfortable, secure, and annoyed). A previous study also showed a significant relationship between distance of shops and people’s long-term and momentary SWB [47]. Another study also showed that quiet places and going outside to walk are important for people with a higher need for quietness (i.e., people who are more annoyed by sound from traffic, shops, etc.) [66]. These quiet places, such as green areas in cities, are mostly located at a higher distance from shopping centers. Therefore, more quiet and green places should be designed in urban areas, so people would feel happier, comfortable, secure, and less annoyed. For future research, focus group discussions can be held to understand the underlying reasons for the evaluation of places regarding the distance to shops.
With regard to time influences, people report more positive emotional states during weekend experiences related to urban public spaces. This was also recognized by previous research [22,67]. The results did not show a significant relation between weather and people’s momentary SWB. Probably other variables are more important for explaining momentary SWB. This could also be caused by the fact that only during 5% of the experiences it rained. Therefore, it is important for future studies to collect data during different seasons, to get more insight into weather influences.
Furthermore, relationships were found between personal characteristics and people’s emotional state. People who, overall, perceive their well-being as higher are also more likely to report a more positive momentary SWB. This is also recognized by previous research [47,68]. People with perceived reasonable/bad health conditions feel less comfortable at urban public spaces compared to people with better health conditions. The results also suggest that people aged over 45 years feel more frequently unhappy than younger people. However, these vulnerable people (e.g., people with lower health conditions and the elderly) have the most need to access, for example, public parks and the opportunity to socially interact in a safe and comfortable urban public setting, which could contribute to their quality of life [69]. Therefore, more facilities for vulnerable people should be created at urban public spaces, so they would feel more comfortable and safe. Also, personality was found to influence people’s emotional state, which confirms previous research [70]. Finally, no relationships were found between gender and the momentary SWB dimensions. This suggests that men and women do not differ in their emotions as outcomes of their experience with regard to urban public spaces.

6. Conclusions

Research that gives more insight into the relationships between subjective and objective characteristics of momentary experiences, momentary emotional states, and satisfaction with the urban environment is still limited, but highly important for urban planning processes. This study contributes to existing theory by analyzing the relationships between the satisfaction with urban public spaces and the dimensions of people’s momentary SWB (i.e., sense of security, comfort, happiness, and annoyance) by using a novel approach, namely, a (near-real time) web-based ESM survey with a geotagging functionality. This functionality led to new insights of the impact of the objective experience characteristics (i.e., time and place) on people’s emotional state. In addition, this study contributes to previous research by incorporating the satisfaction with different attributes of the urban environment in relation to momentary SWB. Also, this study shows that ESM is a valid and valuable approach for future studies on analyzing people’s momentary experiences in relation to the built environment. This approach could be further developed in future studies, for example, by developing a more user-friendly smartphone application to analyze temporal differences of experiences. Although this study provided new insights related to the effects of urban design on people’s momentary SWB, whereas previous studies mainly focus on long-term SWB, there are some limitations. First, through the ESM approach, a lot of time and commitment were demanded from the participants of this study, which led to a low response rate. Therefore, to increase the interpretation and generalizability of the results, a more representative and larger sample, also from other cities and counties, should be used. In addition, in future studies, focus groups and/or expert interviews should be held to strengthen and give more in-depth insights into the quantitative results.
The main limitation of this study is that participants did not report all their positive and negative momentary experiences with regard to any urban public space in Eindhoven during the two-week sampling period. This could lead to a response bias, as many respondents reported just one experience with regard to the public space. Also, there is a chance that people are more eager to report negative or just positive experiences. Therefore, it was not possible to analyze areas in the city that were experienced more positive compared to others.
Another limitation of this study is that it mainly focused on the perceived urban environment during the experience and on people’s perceived SWB. Only a few objective measures (i.e., distance to facilities, weather, and time) were taken into account. It would be, for example, interesting for future research to include more objective measures of the urban environment (e.g., air quality or noise levels), subjective measures (e.g., architecture, culture, the atmosphere of the community), and of people’s emotional state (e.g., stress levels by using wearables).
Overall, this study provided results which could be used by policymakers and urban planners to develop urban regeneration strategies. It also shows the importance of analyzing people’s momentary experiences and their perception of urban public spaces for the planning process. To avoid deterioration, it is important to create urban public spaces where people have a more positive perception of the urban environment [13], which eventually could lead to happier, comfortable, more secure, and less-annoyed citizens. Future research is necessary to analyze the mediating effects of these momentary emotional responses of urban public spaces on people’s long-term health and quality of life.

Author Contributions

M.W.-P. performed the data collection and analyses. M.W.-P. and G.D. developed the theoretical framework and data collection methodology of this research and also acquired funding for this research. M.W.-P., G.D., and P.v.d.B. wrote the manuscript. All authors have read and agreed to the published version of the manuscript.

Funding

This research was funded by the European Union’s Horizon 2020 research and innovation program under grant agreement No. 730280, as part of the ‘regeneration and optimization of cultural heritage in creative and knowledge cities—ROCK’ project and Actieagenda Ruimtelijk Ontwerp 2017–2020 of the Rijksoverheid of the Netherlands.

Acknowledgments

We want to thank the municipality of Eindhoven for their help with distributing the questionnaire among their panel of citizens. Finally, we want to thank the respondents for their participation in this research and all their efforts to report their momentary experiences in the city.

Conflicts of Interest

The authors declare no conflict of interest.

References

  1. Bele, A.A.; Wasade, N. Perception, use and experience of urban. Open spaces—Case studies of neighbourhood Public Parks in Nagpur. Int. J. Sci. Res. 2018, 7, 712–717. [Google Scholar] [CrossRef]
  2. Benabbou, R.; Lee, H. Exploring the evolution of urban emotions in the city of Seoul using social media information. Int. J. Knowl.-Based Dev. 2019, 10, 232–248. [Google Scholar] [CrossRef]
  3. Daly, J.; Farahani, L.M.; Hollingsbee, T.; Ocampo, R. Measuring Human Experiences of Public Spaces: A Methodology in the Making. Consious Cities J. 2016, 1. Available online: https://www.researchgate.net/publication/310481974_Measuring_human_experiences_of_public_spaces_A_methodology_in_the_making (accessed on 22 July 2019).
  4. Jiang, L.; Nellthorp, J. Valuing transport noise impacts in public urban spaces in the UK: Gaps, opportunities and challenges. In Proceedings of the INTER-NOISE and NOISE-CON Congress and Conference, Institute of Noise Control Engineering, Madrid, Spain, 3 September 2019; pp. 5204–5216. [Google Scholar]
  5. Mandeli, K. Public Space and the Challenge of Urban Transformation in Cities of Emerging Economies: Jeddah Case Study. Cities 2019, 95, 102409. [Google Scholar] [CrossRef]
  6. Costamagna, F.; Lind, R.; Stjernström, O. Livability of Urban Public Spaces in Northern Swedish Cities: The Case of Umeå. Plan. Pract. Res. 2019, 34, 131–148. [Google Scholar] [CrossRef]
  7. Zamanifard, H.; Alizadeh, T.; Bosman, C.; Coiacetto, E. Measuring experiential qualities of urban public spaces: Users’ perspective. J. Urban. Des. 2019, 24, 340–364. [Google Scholar] [CrossRef]
  8. Tonnelat, S. The Sociology of Urban Public Spaces. In Territorial Evolution and Planning Solution: Experiences from China and France; Wang, H., Savy, M., Zhai, G., Eds.; Atlantis Press: Paris, France, 2010; pp. 84–92. [Google Scholar]
  9. Maller, C.J.; Henderson-Wilson, C.; Townsend, M. Rediscovering nature in everyday settings: Or how to create healthy environments and healthy people. Ecohealth 2009, 6, 553–556. [Google Scholar] [CrossRef]
  10. Sefcik, J.S.; Kondo, M.C.; Klusaritz, H.; Sarantschin, E.; Solomon, S.; Roepke, A.; South, E.C.; Jacoby, S.F. Perceptions of nature and access to green space in four urban neighborhoods. Int. J. Environ. Res. Public Health 2019, 16, 2313. [Google Scholar] [CrossRef] [Green Version]
  11. Hajer, M.; Reijndorp, A. In Search of New Public Domain: Analysis and Strategy; NAI: Rotterdam, The Netherlands, 2001. [Google Scholar]
  12. Gehl, J.; Svarre, B. How to Study Public Life; Island Press: Washington DC, USA, 2013. [Google Scholar]
  13. Carr, S.; Francis, M.; Rivlin, L.G.; Stone, A.M. Needs in Public Space. In Urban Design Reader; Carmona, M., Tiesdell, S., Eds.; Architectural Press: Oxford, UK, 1992; pp. 230–240. [Google Scholar]
  14. Zeile, P.; Resch, B.; Exner, J.P.; Sagl, G. Urban Emotions: Benefits and Risks in Using Human Sensory Assessment for the Extraction of Contextual Emotion Information in Urban Planning. In Lecture Notes in Geoinformation and Cartography; Springer International Publishing: Cham, Switzerland, 2015; Volume 213, pp. 209–225. [Google Scholar] [CrossRef]
  15. Huang, B.; Pan, Z.; Zhang, B. A virtual perception method for urban noise: The calculation of noise annoyance threshold and facial emotion expression in the virtual noise scene. Appl. Acoust. 2015, 99, 125–134. [Google Scholar] [CrossRef]
  16. Kim, M.; Chang, S.I.; Seong, J.C.; Holt, J.B.; Park, T.H.; Ko, J.H.; Croft, J.B. Road traffic noise: Annoyance, sleep disturbance and public health implications. Am. J. Prev. Med. 2012, 43, 353–360. [Google Scholar] [CrossRef]
  17. Poon, J.P.H.; Shang, Q. Are creative workers happier in chinese cities? The influence of work, lifestyle and amenities on urban well-being. Urban. Geogr. 2014, 35, 567–585. [Google Scholar] [CrossRef]
  18. Bakolis, I.; Hammoud, R.; Smythe, M.; Gibbons, J.; Davidson, N.; Tognin, S.; Mechelli, A. Urban mind: Using smartphone technologies to investigate the impact of nature on mental well-being in real time. Bioscience 2018, 68, 134–145. [Google Scholar] [CrossRef] [PubMed] [Green Version]
  19. Quercia, D.; Schifanella, R.; Aiello, L.M.; McLean, K. Smelly Maps: The digital life of urban smellscapes. In Proceedings of the International Conference on Web and Social Media (ICWSM), Oxford, UK, 26–29 May 2015; Available online: https://www.aaai.org/ocs/index.php/ICWSM/ICWSM15/paper/view/10572/10516 (accessed on 22 July 2019).
  20. Bedimo-Rung, A.L.; Mowen, A.J.; Cohen, D.A. The significance of parks to physical activity and public health: A conceptual model. Am. J. Prev. Med. 2005, 28, 159–168. [Google Scholar] [CrossRef] [PubMed]
  21. Eid, M.; Diener, E. Global judgments of subjective well-being: Situational variability and long-term stability. Soc. Indic. Res. 2004, 65, 245–277. [Google Scholar] [CrossRef]
  22. Birenboim, A. The influence of urban environments on our subjective momentary experiences. Environ. Plan. B Urban. Anal. City Sci. 2018, 45, 915–932. [Google Scholar] [CrossRef]
  23. Côté, S.; Moskowitz, D.S. On the dynamic covariation between interpersonal behavior and affect: Prediction from neuroticism, extraversion, and agreeableness. J. Pers. Soc. Psychol. 1998, 75, 1032–1046. [Google Scholar] [CrossRef]
  24. Mehta, V. Evaluating public space. J. Urban. Des. 2014, 19, 53–88. [Google Scholar] [CrossRef]
  25. Lewin, K. Field Theory in Social Science: Selected Theoretical Papers; Harper & Brothers: New York, NY, USA, 1951. [Google Scholar]
  26. Mody, R.N.; Willis, K.S.; Kerstein, R. WiMo: Location-Based Emotion Tagging. In Proceedings of the 8th International Conference on Mobile and Ubiquitous Multimedia, Cambridge, UK, 22–25 November 2009. [Google Scholar] [CrossRef]
  27. Dane, G.; Borgers, A.; Feng, T. Subjective immediate experiences during large-scale cultural events in cities: A geotagging experiment. Sustainability 2019, 11, 5698. [Google Scholar] [CrossRef] [Green Version]
  28. Hull, R.B. Mood as a product of leisure: Causes and consequences. J. Leis. Res. 1990, 22, 99–111. [Google Scholar] [CrossRef]
  29. Bowler, D.E.; Buyung-Ali, L.M.; Knight, T.M.; Pullin, A.S. A systematic review of evidence for the added benefits to health of exposure to natural environments. BMC Public Health 2010, 10, 456. [Google Scholar] [CrossRef] [Green Version]
  30. Negami, H.R.; Mazumder, R.; Reardon, M.; Ellard, C.G. Field analysis of psychological effects of urban design: A case study in Vancouver. Cities Heal. 2018, 2, 106–115. [Google Scholar] [CrossRef]
  31. Montgomery, C. Happy City. Transforming Our Lives Through Urban Design; Farrar, Straus and Giroux Publishers: New York, NY, USA, 2013. [Google Scholar]
  32. Levinson, A. Valuing public goods using happiness data: The case of air quality. J. Public Econ. 2012, 96, 869–880. [Google Scholar] [CrossRef]
  33. Li, Z.; Folmer, H.; Xue, J. To what extent does air pollution affect happiness? The case of the Jinchuan mining area, China. Ecol. Econ. 2014, 99, 88–99. [Google Scholar] [CrossRef]
  34. Sepe, M. Placemaking, livability and public spaces. achieving sustainability through happy places. J. Public Space 2017, 2, 63. [Google Scholar] [CrossRef] [Green Version]
  35. Gidlöf-Gunnarsson, A.; Öhrström, E. Noise and well-being in urban residential environments: The potential role of perceived availability to nearby green areas. Landsc. Urban. Plan. 2007, 83, 115–126. [Google Scholar] [CrossRef]
  36. Dzhambov, A.M.; Dimitrova, D.D. Green spaces and environmental noise perception. Urban. For. Urban. Green. 2015, 14, 1000–1008. [Google Scholar] [CrossRef]
  37. Rey Gozalo, G.; Barrigón Morillas, J.M.; Montes González, D. Perceptions and use of urban green spaces on the basis of size. Urban. For. Urban. Green. 2019, 46. [Google Scholar] [CrossRef]
  38. Brambilla, G.; Gallo, V.; Zambon, G. The soundscape quality in some urban parks in Milan, Italy. Int. J. Environ. Res. Public Health 2013, 10, 2348–2369. [Google Scholar] [CrossRef] [Green Version]
  39. Van Poll, R.; Stellato, R.; Kruize, H.; Heisterkamp, S. Residential satisfaction and annoyance in residents living near instudrial estates. Epidemiology 2005, 16, S28. [Google Scholar] [CrossRef]
  40. Shehayeb, D. Safety and Security in Public Space. Int. Rep. CRIME Prev. COMMUNITY Saf. TRENDS Perspect. 2008. Available online: https://www.academia.edu/2485098/Safety_and_Security_in_Public_Space (accessed on 20 November 2019).
  41. Kuo, F.E.; Bacaicoa, M.; Sullivan, W.C. Transforming inner-city landscapes. Environ. Behav. 1998, 30, 28–59. [Google Scholar] [CrossRef]
  42. Maas, J.; Spreeuwenberg, P.; van Winsum-Westra, M.; Verheij, R.A.; Vries, S.; Groenewegen, P.P. Is green space in the living environment associated with people’s feelings of social safety? Environ. Plan. 2009, 41, 1763–1777. [Google Scholar] [CrossRef] [Green Version]
  43. Bennett, G.G.; McNeill, L.H.; Wolin, K.Y.; Duncan, D.T.; Puleo, E.; Emmons, K.M. Safe to walk? Neighborhood safety and physical activity among public housing residents. PLoS Med. 2007, 4, 1599–1607. [Google Scholar] [CrossRef] [PubMed] [Green Version]
  44. van Rijswijk, L.; Haans, A. Illuminating for safety: Investigating the role of lighting appraisals on the perception of safety in the urban environment. Environ. Behav. 2018, 50, 889–912. [Google Scholar] [CrossRef]
  45. Peng, Y.; Feng, T.; Timmermans, H. A path analysis of outdoor comfort in urban public spaces. Build. Environ. 2019, 148, 459–467. [Google Scholar] [CrossRef]
  46. Watts, G.R.; Pheasant, R.J.; Horoshenkov, K.V. Predicting perceived tranquillity in urban parks and open spaces. Environ. Plan. B Plan. Des. 2011, 38, 585–594. [Google Scholar] [CrossRef]
  47. Weijs-Perrée, M.; Dane, G.; van den Berg, P.; van Dorst, M. A multi-level path analysis of the relationships between the momentary experience characteristics, satisfaction with urban public spaces and momentary and long-term subjective wellbeing. Int. J. Environ. Res. Public Health 2019, 16, 3621. [Google Scholar] [CrossRef] [Green Version]
  48. Ettema, D.; Smajic, I. Walking, Places and wellbeing. Geogr. J. 2015, 181, 102–109. [Google Scholar] [CrossRef]
  49. Robin, M.; Matheau-Police, A.; Couty, C. Development of a scale of perceived environmental annoyances in urban settings. J. Environ. Psychol. 2007, 27, 55–68. [Google Scholar] [CrossRef]
  50. Redi, M.; Aiello, L.M.; Schifanella, R.; Quercia, D. The Spirit of the city: Using social media to capture neighborhood ambiance. Proc. ACM Hum. Comput. Interact. 2018, 2. [Google Scholar] [CrossRef]
  51. Matei, S.; Ball-Rokeach, S.J.; Qiu, J.L. Fear and Misperception of Los Angeles Urban Space. Commun. Res. 2001, 28, 429–463. [Google Scholar] [CrossRef]
  52. Schrenk, M.; Popovich, V.V.; Zeile, P.; Elisei, P.; Beyer, C.; Ryser, J.; Reicher, C.; Dane, G.; Derakhshan, S.; Ettefagh, T.; et al. Participatory Mapping of Citizens’ Experiences at Public Open Spaces: A Case Study at Bologna Living Lab. In Proceedings of the 25th International Conference on Urban Planning and Regional Development in the Information Society GeoMultimedia, Aachen, Germany, 15–18 September 2020. [Google Scholar]
  53. Diener, E.; Emmons, R.A.; Larsem, R.J.; Griffin, S. The satisfaction with life scale. J. Pers. Assess. 1985, 49, 71–75. [Google Scholar] [CrossRef] [PubMed]
  54. Thompson, E.R. Development and validation of an internationally reliable short-form of the positive and negative affect schedule. Proc. Natl. Acad. Sci. USA 2007, 38, 227–242. [Google Scholar] [CrossRef]
  55. Saw, L.E.; Lim, F.K.S.; Carrasco, L.R. The Relationship between natural park usage and happiness does not hold in a tropical city-state. PLoS ONE 2015, 10, e0133781. [Google Scholar] [CrossRef] [PubMed] [Green Version]
  56. Loewenthal, K.; Lewis, C.A. An Introduction to Psychological Tests and Scales; Psychology Press: London, UK, 2018; Volume 2. [Google Scholar] [CrossRef]
  57. Rammstedt, B.; John, O.P. Measuring personality in one minute or less: A 10-item short version of the big five inventory in English and German. J. Res. Pers. 2007, 41, 203–212. [Google Scholar] [CrossRef]
  58. John, O.P.; Donahue, E.M.; Kentle, R.L. The Big Five Inventory Versions 4a and 54; University of California, Institute of Personality and Social Research: Berkeley, CA, USA, 1991. [Google Scholar]
  59. Ziegler, M.; Kemper, C.J.; Kruyen, P. Short scales—Five misunderstandings and ways to overcome them. J. Individ. Differ. 2014, 35, 185–189. [Google Scholar] [CrossRef]
  60. Gosling, S.D.; Rentfrow, P.J.; Swann, W.B. A very brief measure of the big-five personality domains. J. Res. Pers. 2003, 37, 504–528. [Google Scholar] [CrossRef]
  61. Reis, H.T.; Gable, S.L. Event-Sampling and Other Methods for Studying Everyday Experience. In Handbook of Research Methods in Social and Personality Psychology; Cambridge University Press: New York, NY, USA, 2000; pp. 190–222. [Google Scholar]
  62. McFadden, D.; Train, K. Mixed MNL Models for discrete response. J. Appl. Econom. 2000, 15, 447–470. [Google Scholar] [CrossRef]
  63. Hensher, D.A.; Greene, W.H. The mixed logit model: The state of practice. Transportation 2003, 30, 133–176. [Google Scholar] [CrossRef]
  64. Train, K. Discrete Choice Methods with Simulation; Cambridge University Press: London, UK, 2002. [Google Scholar]
  65. Leslie, E.; Cerin, E. Are perceptions of the local environment related to neighbourhood satisfaction and mental health in adults? Prev. Med. 2008, 47, 273–278. [Google Scholar] [CrossRef]
  66. Booi, H.; van den Berg, F. Quiet areas and the need for quietness in Amsterdam. Int. J. Environ. Res. Public Health 2012, 9, 1030–1050. [Google Scholar] [CrossRef]
  67. Diener, E. Introduction—The Science of Well-Being: Reviews and Theoretical Articles by Ed. Diener; Springer: Dordrecht, The Netherlands, 2009; pp. 1–10. [Google Scholar] [CrossRef]
  68. Kim, J.J.; Fesenmaier, D.R. Measuring emotions in real time: Implications for tourism experience design. J. Travel Res. 2015, 54, 419–429. [Google Scholar] [CrossRef]
  69. Kazmierczak, A.; James, P. The Role of Urban Green Spaces in Improving Social Inclusion. Landsc. Urban. Plan. 2007. Available online: http://usir.salford.ac.uk/11339 (accessed on 21 September 2020).
  70. González Gutiérrez, J.L.; Jiménez, B.M.; Hernández, E.G.; Puente, C.P. Personality and subjective well-being: Big five correlates and demographic variables. Pers. Individ. Differ. 2005, 3, 1561–1569. [Google Scholar] [CrossRef]
Figure 1. Conceptual model.
Sustainability 12 07921 g001
Figure 2. Distribution of the number of experiences per participant.
Sustainability 12 07921 g002
Figure 3. Distribution of the number of experienced emotions per 100 m hexagons.
Sustainability 12 07921 g003
Figure 4. Distribution of the intensity of emotions in space, averaged per 100 m hexagons.
Sustainability 12 07921 g004
Table 2. Experience characteristics (N = 1056).
Sample (N)Sample (%)
Indoor/outdoor
Indoor17417
Outdoor88283
Company
Alone61258
One or more other people44442
Location type
On the road (relocating)38637
Shop/mall14814
Leisure: Café/bar/restaurant/culture/sports venue/facility
Public outdoor space (e.g., park)
Other
129
219
174
13
21
16
Transportation mode
Car 19218
Bicycle51149
Walking32030
Public transport
Other
21
12
2
1
MeanSt. deviation
Familiarity4.580.693
Satisfaction with urban public space
Air quality (e.g., air pollution from traffic or ventilation)3.631.018
Aesthetic quality (e.g., decor, design, architecture, or color schemes)3.641.160
Atmosphere (e.g., lively ambience)3.831.108
Smell (e.g., smell from traffic or restaurants)3.560.993
Accessibility of the location (e.g., by car, by public transport, and walking)4.120.919
The number of parking spaces3.860.792
Distance to facilities (e.g., shops, restaurants, or leisure)4.330.578
Traffic safety (e.g., sidewalks, speed humps, and traffic lights)3.501.227
Natural elements (e.g., green areas, water, etc.)3.631.205
Noise (e.g., traffic noise)3.421.081
Cleanliness and maintenance of the space3.701.100
Momentary SWB
Sense of security4.091.143
Happiness3.681.179
Comfort3.781.226
Annoyance (reversed)4.081.412
Location characteristics in kilometers (extracted from OSM)
Distance to nearest shops0.26910.3115
Distance to nearest restaurants0.34880.3597
Distance to nearest public transport stop0.27210.2035
Weather (extracted from Koninklijk Nederlands Meteorologisch Instituut (KNMI))
Temperature
(in 0.1 degrees Celsius)
236.6445.830
Cloudiness (1–9)4.353.402
Rain (Yes)0.050.210
Table 3. Characteristics participants (N = 161).
(N)(%)Eindhoven 2019 (%)
Gender
Male845251
Female774849
Age (>20 years)
Age (18–35 years)171132
Age (35–45 years)
Age (46–55 years)
Age (56–65 years)
26
39
39
16
24
24
17
16
15
Age (>65 years)402521
Household composition
One-person household452848
Couple without children734525
Couple with children352226 (households with
children and other)
Single-parent family and other85
Work situation
Self-employed12764 (percentage of people who are employed for more than 12 h per week)
Full-time5635
Part-time3019
Unemployed
Retired
19
42
13
26
36
Education
Low education level5133NA
Medium education level7043
Higher education level3824
Homeownership
Homeowner1277947
Tenant342153
Health
Reasonable/Bad
Good
Excellent/Very good
26
69
66
16
43
41
NA
MeanSt. deviation
Long-term subjective well-being (SWB)26.465.520
Personality traits
Extroversion6.521.803
Agreeableness7.841.212
Conscientiousness7.661.341
Neuroticism4.781.544
Openness7.471.565
Table 4. Model results.
SecureHappyComfortAnnoyed (Reversed)
Random parametersCoefficientCoefficientCoefficientCoefficient
Alternative 2 (neutral) (base level)0000
Alternative 1 −5.5543**1.1691−2.1167−1.0861
Alternative −3.7462**−1.9569−3.1179−1.7898
Interaction variables (nonrandom parameters)UnsecureSecureUnhappyHappyUncomfortableComfortableAnnoyedNot annoyed
Momentary satisfaction with urban environment
Satisfaction with urban space—smell0.5034 **0.4526 ***0.16760.2830 **0.14880.2577 *−0.0383−0.0085
Satisfaction with urban space—sufficient parking spaces−0.15420.0277−0.06020.0199−0.03690.15700.20060.3181 *
Satisfaction with urban space—traffic safety−0.14840.2452 **−0.1671−0.0458−0.2095 *0.0875−0.3967 **−0.3032
Satisfaction with urban space—atmosphere−0.1236−0.00110.09510.1901 *−0.01340.01250.00330.0977
Subjective experience characteristics
Experience—company (>1 person) (dummy)0.0161−0.0549−0.07550.15490.03200.0183−0.0557−0.0284
Outdoor experience (dummy) 1.8488 **−0.3385−0.5113−0.08731.3380 ***0.30180.8282*0.2587
Location—leisure (culture/sports venue/ café/restaurant/bar) (dummy)0.2064−1.3363−1.17930.9946 **−0.41461.2503 **0.21640.8836
Location—relocating/travelling (dummy)0.0606−1.3029 ***−0.35251.4132 ***0.6677−0.8099 **0.5195−0.7239 *
Location—shop/mall (dummy)−1.3519*−0.9887 **−0.1497−0.8606 **−0.1005−0.48560.82190.0607
Location—public outdoor (dummy)−0.1200−0.77530.9138 *0.29920.4005−0.04990.43430.1573
Travel mode—walking (dummy)−0.36560.18750.00720.02260.03820.31730.47710.8025 **
Objective experience characteristics
Time/day—weekend day (dummy)−0.43450.3397−0.8186 **0.4237 *−0.7726 **0.3843−0.22770.3800
Distance shops (in km)−0.86641.4885 ***−1.4270 ***0.2521−1.4051 **0.6646 *0.85611.4556 **
Personal characteristics
Subjective well-being (SWB) 0.1228 ***0.1137 ***0.03670.0656 **0.14880.2577 *0.05750.0826 **
Age (≤45 years) (dummy)−0.7983 *−0.6676 **−1.0868 ***0.2371−0.2618−0.2524−0.5219−0.6721 *
Gender—man (dummy)0.40580.41270.30570.0025−0.1561−0.08200.66380.2857
Health—reasonable/ bad (dummy)−0.2920−0.51570.1229−0.40450.0253−0.8264 **0.60460.4604
Personality trait—agreeableness0.06980.1203−0.3460 ***0.1144−0.14300.1112−0.07100.0116
Personality trait—neurotic0.3427 **0.2078 *0.1826 *−0.02970.16170.04920.08460.0112
Personality trait—openness−0.1839−0.04580.01410.05370.10550.00910.02100.0363
Standard deviation 1.0590 ***0.7524 ***0.5607 **1.1290 ***1.0830 **1.1455 ***1.0736 ***0.5808 **
Parameters45454545
Log Likelihood function (LL(β))−591.23001−788.5260−738.4227−630.6752
Log Likelihood function null model (LL(0))−1160.1346−1160.1346−1160.1346−1160.1346
ρ20.49040.32030.36350.4564
ρ2 adjusted0.47930.30550.34960.4445
Note: Grey cells indicate significant relationships. * Significant at 0.1 level, ** Significant at 0.05 level, *** Significant at 0.01 level.

