Abstract
The balance between the supply of multiple ecosystem services (ES) and the fulfillment of society demands is a challenge, especially in the tropics where different land use transition phases emerge. These phases are characterized by either a decline (from intact old-growth to logged forests) or a recovery of ES (successional forests, plantations, and agroforestry systems). This highlights the importance of ecosystem service multifunctionality (M) assessments across these land use transition phases as a basis for forest management and conservation. We analyzed synergies and trade-offs of ES to identify potential umbrella ES. We also evaluated the impact of logging activities in the decline of ES and M, and the influence of three recovery phases in the supply of ES and M. We installed 156 inventory plots (1600 m2) in the Ecuadorian Central Amazon and the Chocó. We estimated indicators for provisioning, regulating, supporting services and biodiversity. M indicator was estimated using the multifunctional average approach. Our results show that above-ground carbon stocks can be considered as an umbrella service as it presented high synergetic relations with M and various ES. We observed that logging activities caused a decline of 16–18% on M, with high impacts for timber volume and above-ground carbon stocks, calling for more sustainable practices with stricter post-harvesting control to avoid a higher depletion of ES and M. From the recovery phases it is evident that, successional forests offer the highest level of M, evidencing high potential to recover multiple ES after human disturbance.
1. Introduction
Tropical forests cover 45% of the global forest area [1,2] and are characterized by an outstanding biodiversity [3]. They exhibit a great potential to supply several ecosystem services (ES) such as provisioning, regulating, supporting, and cultural services which are important for people’s well-being at a global and local scale [4,5]. Locally, forests can provide timber and non-timber forest products, maintain soil fertility, help with biological connectivity in fragmented areas, and sustain different levels of biodiversity [6,7,8,9,10]. Globally, forests have attracted attention in the climate change mitigation agenda due to their capacity for carbon sequestration and the reduction of greenhouse emissions [11,12,13]. Despite the importance of tropical forests, it is estimated that only 20% of the remaining forests are undisturbed [14], with anthropogenic activities as the main threats of an ecosystem’s capacity to provide multiple ES [8]. These negative influences on tropical forest have been particularly observed in the Amazon Basin and the Chocó region, which are two important biodiversity hotspots in the world [15,16,17]. The principal drivers of deforestation and forest degradation (Forest degradation refers to changes or decline in ecosystem services due to anthropogenic disturbances [8,18,19,20]) in these areas are related to forest conversion to agricultural lands, road opening, population growth, and timber extraction [18,21,22,23,24]. Deforestation and degradation processes result in land use transition phases which in turn are associated with changes in ES [6,25,26]. These phases can be represented by natural forests (old-growth forest, logged forest and successional forest), planted forests, and agroforestry systems [19,26]. On the one hand, the transition from undisturbed old-growth forests to logged forests is frequently accompanied by a decline in ES and ecosystem service multifunctionality (M) [8,20,27,28]. On the other hand, successional forests (restoration), plantations (reforestation), and agroforestry systems, can emerge as an effort to recover the ecosystem’s integrity and functionality [7,29].
ES are defined as the benefits that people obtain directly or indirectly from ecosystems [8]. The capacity of an ecosystem to co-supply multiple ES is understood as the ecosystem service multifunctionality and translates into various environmental and economic benefits for the society [30,31,32]. Given that ES are influenced by human activities, ecosystem service multifunctionality is not necessarily provided at the same level. Moreover, international forest policy initiatives and their monitoring systems are rather focused on individual services (timber or carbon), but there is still a lack of knowledge and tools to evaluate the ecosystem service multifunctionality. This is particularly important for REDD+ safeguards or forest landscape restoration initiatives both aiming to preserve forests and biodiversity, combat deforestation and ecosystem degradation, and promote ecosystem restoration. As there is an increasing awareness that forest landscapes have to fulfill multiple functions and services, a deeper understanding of synergies and trade-offs between ES and ecosystem service multifunctionality is required to satisfy the multiple demands of society, for example, food, livelihood opportunities, climate regulation, and conservation of biodiversity [33,34,35].
Even though ES assessments have gained momentum in the last decades, studies have focused on evaluating selected services such as timber provision, water supply, climate regulation, erosion regulation, or cultural services without considering interactions with other services [36,37,38,39,40,41,42,43,44,45,46]. Other studies have assessed ES either only in mature forest, logged forest, successional forest, or plantations [47,48,49,50,51,52,53], showing that more empirical studies integrating different land use transition phases are needed to understand the potential decline and recovery of ES supply. Moreover, little attention has been devoted to the study of ecosystem service multifunctionality. For the Amazon and Chocó lowland rainforests there is still a lack of assessments that comprehensively evaluate synergies and trade-offs on ES supply and ecosystem service multifunctionality throughout different land use transition phases. On the one hand, it is important to understand whether timber extraction impacts different ES and ecosystem service multifunctionality to the same extent. On the other hand, given the accelerated loss of ES, it is necessary to quantify the recovery potential of ES and ecosystem service multifunctionality within successional forests, plantations, and agroforestry systems. Detailed quantitative information on the interactions, decline, and recovery of ES and ecosystem service multifunctionality in ecological systems is needed to efficiently monitor and preserve the remaining forest areas while building on the sustainable use of bundles of ES [33].
Our study contributes to closing this research gap by integrating the analysis of various ES (provisioning, regulating, and supporting) and biodiversity indicators. We include natural forests (old-growth forest, logged forest, and successional forest), planted forest, and agroforestry systems [19,54], which altogether represent the land use transitions phases [25,26] observed in two biodiversity hotspots, the Amazon and the Chocó. We address the fact that ES are interrelated and produce complex dynamics within an ecosystem, which need to be disentangled to make better management decisions. Additionally, we acknowledge that the selected phases supply ES at different levels that need to be quantified with in situ information to identify which one can have a greater potential to sustain ecosystem service multifunctionality (M). In this context, our study aims to: (1) understand which synergies and trade-offs occur between ES and M across different land use transition phases, and to assess whether a single ES could be identified as a potential “umbrella ES”; (2) assess the influence of logging activities on the decline of ES and M; and (3) to identify the potential of successional forests, plantations, and agroforestry systems for the recovery of ES and M. For this purpose a total of 156 inventory plots of 40 m × 40 m were installed among old-growth forests, logged forests, successional forests, plantations, and agroforestry systems in the study areas. Seven indicators were considered for provisioning, regulating, and supporting services [8]. Two indicators related to plant diversity were also included due to the positive link of biodiversity to support ES [55,56,57]. Finally, with the selected indicators, we estimated M based on the multifunctional average approach [58,59].
2. Materials and Methods
2.1. Study Area
Our study was carried out in the Central Amazon and Chocó lowland rainforests of Ecuador (Figure 1). The Central Amazon is characterized by low fertility and acid soils with a pH of 4.5 and high contents of iron (Fe). The annual precipitation in this region is between 2800 and 4000 mm, with an annual temperature of 22 and 27 °C. In the Chocó soils are more fertile and less acidic with a pH of 5.5; the annual precipitation in the Chocó ranges from 728 to 3681 mm, with an annual temperature of 22 and 27 °C [60,61]. These regions represent 54% of the remnant forest in the country and are strategic areas for biodiversity conservation and for the provision of timber and non-timber forest products [62,63]. We randomly selected 12 landscapes (eight in the Central Amazon and four in the Chocó) of approximately 10 km × 10 km each, covering a total area of 163,000 ha. Although our landscapes are in the lowland rainforests, they are influenced by different climatic conditions that could affect the ES and M supply and the synergies and trade-offs observed between them. Hence, we conducted a cluster analysis as the preliminary analysis step to identify whether a grouping pattern of plots due to climatic influence could be detected. First, we executed a principal component analysis (PCA) with 15 climatic variables obtained from WorldClim [64] for each plot. The first two components of the PCA explained 96.6% of the variability and were used for the cluster analysis considering Ward’s methods and Bray–Curtis distance. Cluster analysis showed two large groups, “Central Amazon and Chocó”, which were statistically different according to the MANOVA test (Figure A1, Figure A2, and Table A1 in Appendix A) [65,66].
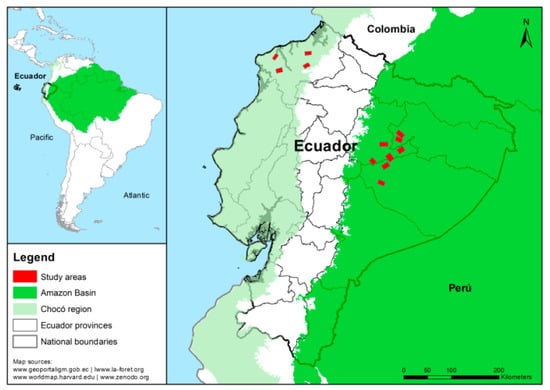
Figure 1.
Landscapes selected in the Ecuadorian Central Amazon and Chocó lowland rainforests.
2.2. Sampling Design
Based on available land cover maps, field visits, and participatory mapping exercises performed in 12 community workshops (one per landscape), we obtained a zoning map with the different land use transition phases [6,25,26] (Figure 2). Mapping exercises were conducted with local stakeholders using printouts of high-resolution satellite images obtained from Google Earth. Consequently, we distinguished: (i) Old-growth forests: mature forest with unknown human disturbance [7,19,67]. (ii) Logged forests: forests where timber extraction interventions have been carried out in the last two to five years. In the Central Amazon, logged forests were under simplified harvesting programs (PAFSI, for its Spanish acronym). PAFSIs are small-scale non-mechanized drag programs with a five-year cutting cycle. In the Chocó, logged areas are under the so-called sustainable harvesting programs (PAFSU, for its Spanish acronym). PAFSUs are medium to large scale programs with a fifteen-year cutting cycle, characterized by mechanized hauling. Both, PAFSI and PAFSU, are selective logging systems [68,69]. In one landscape in the Chocó, landholders did not report formal harvesting programs; nevertheless, the owners declared forest intervention in the last two to five years. (iii) Successional forests: second-growth forest resulted from abandoning previously cleared forest [7,70]; random selection resulted in forests ranging between 11 and 28 years of succession. (iv) Agroforestry systems: They are a mixed production system with trees and crops [71]. The most common tree species found in these systems are Cordia alliodora, Inga edulis, and Cedrela odorata mixed with fruit tress like Citrus reticulata, Citrus sinensis, Citrus limon, or Mangifera indica. Among the most frequent crops we can cite Theobroma cacao, Musa paradisiaca, and Manihot esculenta. In the Central Amazon, agroforestry systems are called Chakras and correspond to traditional agroforestry systems of diversified production [71]). (v) Plantations: in the Central Amazon these correspond to two to three-years old balsa (Ochroma pyramidale) and in the Chocó to four to 18-years old teak (Tectona grandis). Balsa usually has a six-year cutting cycle, it grows between 0 and 1000 m a.s.l., with annual precipitation of 1500–3000 mm and temperatures between 22 and 27 °C; balsa reaches a height of 30 m and diameter of 70 cm at breast height. Teak has an 18-year cutting cycle, it grows between 0 and 800 m a.s.l., with an annual precipitation of 1000–2200 mm and temperatures from 22 to 28 °C; teak reaches a height of 30 m and a diameter at breast height of 80 cm.
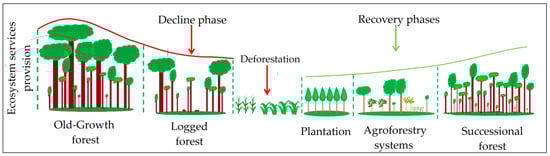
Figure 2.
Schematic representation of the land use transition phases based on the ecosystem services provision decline and recovery.
Building on this information, we randomly selected three plots of 40 m × 40 m (1600 m2) for the old-growth forest, logged forest, successional forest, plantations, and agroforestry systems within each landscape. A total of 156 plots were established across the two study areas (Table 1). For logged forests in the Chocó, we established only nine plots since it was not possible to obtain authorization to conduct the forest inventory in other sites under logging interventions. Meanwhile, for plantations, we only established six plots in the Central Amazon and nine plots in the Chocó since there were no plantations in all the sites.

Table 1.
Number of plots installed for the Central Amazon and Chocó.
2.3. Ecosystem Services Quantification
ES are the result of complex ecological processes and functions performed within forests. Seven indicators were used as proxies for provisioning, regulating, and supporting services, and two for biodiversity [8,72,73,74,75] (Table 2). These indicators were chosen based on the Millennium Ecosystem Assessment [8] and their importance in the local and global contexts. The relations observed between indicators provide insights of synergies and trade-offs among ES and reflect the influence of natural resources management and land cover change [73,76]. Ecosystem service multifunctionality (M) estimation was based on the multifunctional average approach [58,59], described in more detail in Section 2.4.
Table 2.
Selected ecosystem services and the indicators used for the assessment.
2.3.1. Provisioning Services
Provisioning services refer to products obtained from ecosystems (e.g., food, timber) which are mainly important for human well-being at the local level [8]. We selected timber volume potential (TVP) and non-timber forest products (NTFP) as provisioning services indicators. In the Ecuadorian Amazon and the Chocó, timber provision plays a key role since both areas are important timber suppliers within the country [77]. These areas contain 68% of the national harvestable high-value timber [63]. TVP accounts for the total tree volume of timber species that can be harvested according to the respective species minimum cutting diameter specified in the Ecuadorian forest regulations [69,78]. For TVP, we used diameter at breast height (DBH), total tree height, and a form factor of 0.7 for native species [63]. In the case of Tectona grandis plantations, the form factor was 0.55, and 0.73 for the Ochroma pyramidale [79,80,81]. Tree heights were estimated based on four specific equations considering the total height of 1132 trees measured in the Central Amazon and the Chocó. These equations were generated based on own data. Tree height equation for Amazonian trees (Equation (1)) was estimated using 668 trees (p < 0.0001; R2 = 0.69). Tree height equation for balsa (Equation (2)) used 110 trees (p < 0.0001; R2 = 0.81). Tree height equation for Chocó trees (Equation (3)) was based on 298 trees (p < 0.0001; R2 = 0.69). Tree height equation for teak (Equation (4)) was estimated with 56 trees (p < 0.0001; R2 = 0.70).
where Ht is the total height of the tree and DBH is the diameter at breast height.
where Ht is the total height of the tree and DBH is the diameter at breast height.
where Ht is the total height of the tree and DBH is the diameter at breast height.
where Ht is the total height of the tree and DBH is the diameter at breast height.
NTFPs are paramount for Ecuadorian local communities. According to de la Torre et al. [82], of the 5172 species analyzed in their study in Ecuador, food use corresponds to 30%, medicine 60%, and materials 55%. NTFP represent the number of species per plot with potential use for medicine, food, and materials. Species-use identification was based on secondary information available for the country [82,83,84] and household surveys from the studied landscapes.
2.3.2. Regulating Services
Regulating services are benefits related to the regulation of ecosystem processes (e.g., air regulation, climate regulation) [8]. Forest ecosystems play an important role in the global carbon cycle [11,12,13,85]. It is estimated that 652 Gt C (above-ground biomass, below-ground biomass, necromass, and soil) are stored in the world’s forests [86]. Our analysis considers the above-ground carbon (AGC) and soil carbon (SOC), both contribute up to 90% of the total carbon pool within tropical forests [12]. We estimated AGC as the sum of above-ground carbon in trees (AGCtree) and above-ground carbon in palms (AGCpalm). For AGCtree, we used Chave, et al. [87] equation (Equation (5)), considering DBH greater than 10 cm and species wood density. Tree species wood density was obtained from the Global Wood Density Database [88,89], MAE [90], and Aguirre, et al. [91]. For tree species not included in any of these databases, we used the genus, family, or plot average depending on the case. AGCpalm was calculated based on the Goodman, et al. [92] equation (Equation (6)).
where DBH is the diameter at breast height, ρ is the tree species wood density and E is the environmental stress variable.
where DBH is the diameter at breast height.
In the case of agroforestry systems, we used specific equations for Manihot esculenta (Equation (7) [93]), Theobroma cacao (Equation (8) [94]), Coffea arabica (Equation (9) [94]), Coffea robusta (Equation (9) [94]) and Musa paradisiaca (Equation (11) [95]).
where d is the diameter.
where d is the diameter.
where d is the diameter.
where d is the diameter.
where H is the height.
For Ochroma pyramidale and Tectona grandis we used the equations of Douterlungne et al. [96] (Equation (12)) and Perez-Cordero et al. [97] (Equation (13)) respectively. A conversion factor of 0.47 was used to convert above-ground biomass (AGB) to carbon [85].
where DBH is the diameter at breast height.
where DBH is the diameter at breast height.
SOC was estimated from bulk density, organic carbon content concentration (%), and soil depth (0–30 cm). Bulk density was calculated using the oven-dried weight of soil from a known volume of sampled material at 105 °C until reaching a constant weight; two samples were taken from each plot for this purpose. For the concentration of organic carbon content (0–30 cm horizon), two mixed samples per plot were taken to the laboratory and the wet digestion method of Walkley and Black was used [12,98].
where BD is the bulk density, %CO is the percentage of organic carbon content and D is the depth.
2.3.3. Supporting Services
Supporting services are related to basic ecosystem processes such as soil formation or primary productivity, contributing indirectly to human well-being, and helping to maintain processes and functions for provisioning, regulating, and cultural services [8,99]. In our study, we considered soil quality indicators related to the ecosystem’s health. We selected phosphorus (P), total nitrogen (N), and potassium (K) because of their wide application for soil quality assessments [100]. These indicators are crucial in several of the ecosystem’s processes as they intervene in biomass development which directly influences plant growth and net primary productivity, and therefore in the supply of other ES [100,101,102]. In each plot, two mixed soil samples per plot (0–30 cm horizon) were taken to the laboratory. Total nitrogen (N%) was determined by the Kjeldahl method whereas potassium (K meq/100 mL) and the content of phosphorus (P mg kg−1) were estimated with Olsen’s methodology [103,104].
2.3.4. Biodiversity
Biodiversity underpins ES provision since it has an important role in the ecosystem´s processes and functions [55,56,57,105,106,107]. Quantifying biodiversity is a complex task as it is a multifaceted concept that can be measured or documented in different ways [108]. For this reason, researchers usually focus on certain components of biodiversity. In this regard, plant diversity is a fundamental component of biodiversity [108,109] as it is closely linked with other components of biological diversity, for example, soil fauna, birds, or arthropods [108,110,111,112,113]. Besides, plant diversity has a positive effect on ES supply [57,107,114,115] and the interactions occurring among plant species play an important role in the ecosystem functioning. Thus, plant diversity is an important indicator for conservation purposes. Moreover, Ecuador is an important hotspot of biodiversity [15,16,17] and one of the countries in the tropics with more tree species [116,117]; therefore, for this study, we used plant diversity (D) as a biodiversity indicator. D was estimated with the Shannon index (H) and considers trees and palms (Equation (15)) [108]. We additionally used endemism (E), as a proxy to evaluate the capacity of an ecosystem to offer habitat for species with limited distribution [118]. The regions included in this study are important areas of endemism; of the 4500 endemic species registered for the country, around 78% are threatened to some degree of extinction [119]. E is expressed as the percentage of species per plot whose distributional range is restricted to Ecuador. Estimations of E were based on the red book of endemic plants for Ecuador [119].
where is the species’ relative proportion.
2.4. Ecosystem Service Multifunctionality (M)
Ecosystem service multifunctionality (M) is defined as the capacity of an ecosystem to simultaneously provide multiple ES to society [31]. Human activities have a direct influence on ecosystem service multifunctionality and can reduce or increase the supply of several benefits from forests. M estimations were based on the multifunctional average approach [58,59]. The approach has been applied in various studies to analyze bundles of ecosystem services, functions, biodiversity, functional trait diversity, and landscape multifunctionality (e.g., [58,59,120,121,122,123,124,125,126,127]). The multifunctional average approach is based on the mean of the standardized values of each ES. For the standardization, minimum and maximum values for the land use transition phases were used. Given that ES could be correlated to each other, we tested for multicollinearity among the selected indicators using the variance inflation factor (VIF) [128,129,130]; which resulted in a VIF value of 3.21. VIF values between 5 and 10 correspond to moderate collinearity, and greater than 10 suggest the presence of high collinearity [128,129,130].
2.5. Statistical Analysis
Synergies and trade-offs among the land use transition phases (old-growth forest, logged forest, successional forest, agroforestry systems, and plantations), M, selected ES and biodiversity indicators (TVP, NTFP, AGC, SOC, N, P, K, D, and E) were evaluated with a principal component analysis (PCA) for each study region. Furthermore, we performed an analysis of variance (ANOVA) using general mixed models to evaluate the potential decline and recovery of ES and M. Land use transition phases within the Central Amazon and the Chocó were considered as fixed factors and landscapes as a random factor. Outliers’ identification was based on the standardized Pearson residual. Normality and homoscedasticity were evaluated through the Shapiro and Levene tests. TVP, AGC, P, and K were natural log-transformed to meet ANOVA assumptions, and in the case of E, a non-parametric analysis (Kruskal–Wallis test) was performed. For NTFP, D, and E ANOVA, we excluded plantations as they did not have values for these indicators.
3. Results
3.1. Ecosystem Services Synergies and Trade-Offs
The first two components of the PCA explained 62.2% of the variance for the Central Amazon and 58.7% for the Chocó. The first component in both regions showed a grouping pattern that exhibits the change in ES and M across different land use transition phases from old-growth forest to logged forest and then to more transformed systems such as successional forests, agroforestry systems, and plantations. M was closely related to the first component indicating that it explains between 40% and 44% of the variability. As expected, old-growth forests offer higher values of M, demonstrating a good capacity to provide multiple ES. Interestingly, soil parameters showed different patterns between both study areas, while AGC, TVP, NTFP, D, E, and M behaved in a relatively similar way (Figure 3).
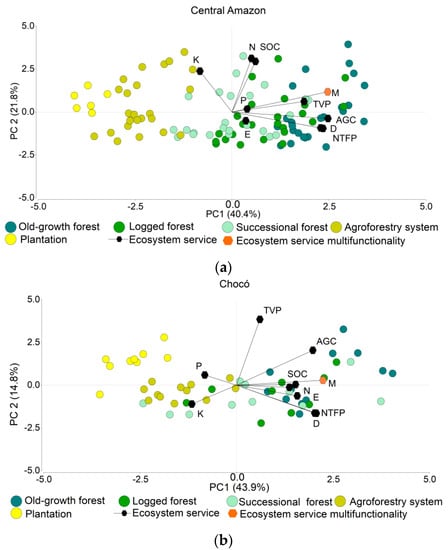
Figure 3.
Principal component analysis. (a) Central Amazon synergies and trade-offs. (b) Chocó synergies and trade-offs. TVP: timber volume potential (m3 ha−1). NTFP: non-timber forest products (# sp. per plot). AGC: above-ground carbon stocks (Mg ha−1). SOC: soil carbon stocks (Mg ha−1). N: nitrogen (%). P: phosphorus (mg kg−1). K: potassium (meq/100 mL), D: Shannon index. E: endemism (% of species per plot). M: ecosystem service multifunctionality.
We observed that a bundle of ES related to regulating and provisioning services, and biodiversity, are interacting in a synergetic way in both regions. We identified positive correlations between AGC, TVP, NTFP, D, E, and M with higher values in old-growth forest and lower values in agroforestry systems and plantations. Other positive relations were found among SOC and N, and between AGC and TVP, the latter one with a higher correlation in the Central Amazon than in the Chocó. In contrast, negative correlations, which indicate trade-offs, were also detected for both regions between supporting services indicators (K for Central Amazon; P and K for Chocó) with regulating and provisioning services indicators, and biodiversity. Besides, the PCA showed lower AGC, TVP, NTFP, and D values for agroforestry systems and plantations, but revealed an increase of K (Figure 3).
3.2. The Provision of Ecosystem Services and Ecosystem Service Multifunctionality across the Land Use Transition Phases
Analysis of variance showed that ES and M provision varies significantly across land use transition phases (Table 3, Figure 4 and Figure 5), except for N which did not show significant differences (p: 0.2686). TVP, AGC, SOC, N, K, P, and M for old-growth forests in both the Central Amazon vs. Chocó were statistically similar. Nonetheless, NTFP, and E showed statistical differences between the old-growth forests in both regions. E was higher in the Chocó’s old-growth forest where 6.4% of species were endemic (Table A2 in Appendix A). In the Chocó region, endemic species were also found in the logged forest, successional forest, and agroforestry systems. In contrast, endemic species in the Central Amazon were circumscribed in a lower percentage to the old-growth, logged, and successional forest only.
Table 3.
Analysis of variance of ecosystem services and ecosystem service multifunctionality.
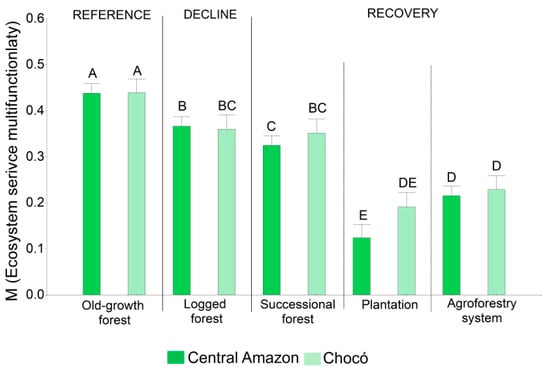
Figure 4.
Analysis of variance for the evaluation of the ecosystem service multifunctionality. Different letters indicate a significant difference from each other (p ≤ 0.05).
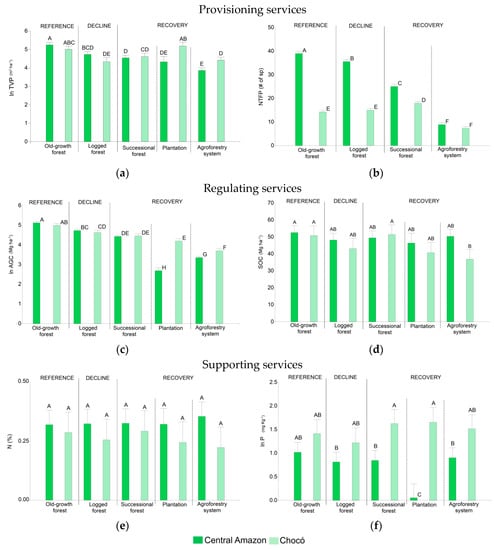
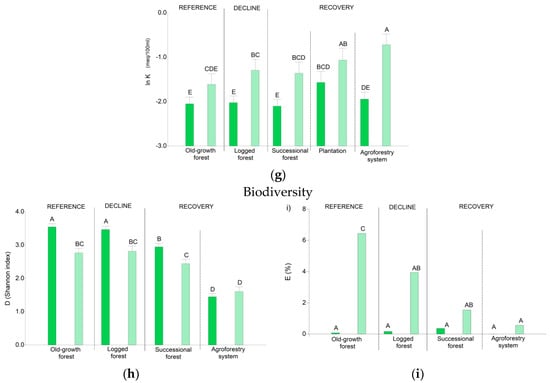
Figure 5.
Analysis of variance for the ecosystem services. (a) ln TVP: timber volume potential, (b) NTFP: non-timber forest products, (c) ln AGC: above-ground carbon stocks, (d) SOC: soil carbon stocks, (e) N: nitrogen, (f) ln P: phosphorus, (g) ln K: potassium, (h) D: Shannon index, (i) E: endemism. Different letters indicate a significant difference from each other (p ≤ 0.05).
The decline in the provision of ES and M as a result of logging interventions was assessed by comparing old-growth and logged forests. We observed a clear reduction in M (Figure 4) by 16% in the Central Amazon and 18% in the Chocó due to timber extraction. Likewise, a decline in specific ES was evidenced (Figure 5). TVP values in the old-growth forest were 190.5 m3 ha−1 in the Central Amazon and 149.9 m3 ha−1 in the Chocó. Compared with old-growth forests, logged forests showed low values for TVP; we estimated 113.3 m3 ha−1 for the Central Amazon and 75.9 m3 ha−1 for the Chocó (Table A2 in Appendix A). We also observed significant differences for AGC (Figure 5). Old-growth forests accounted for 167.3 Mg ha−1 in the Central Amazon and 146.9 Mg ha−1 in the Chocó; in contrast, logged forests had 113.3 Mg ha−1 for the Central Amazon and 102.5 Mg ha−1 for the Chocó (Table A2 in Appendix A). The level of SOC, N, and P also decreased due to logging interventions, although no statistical differences were found for these services (Figure 5). Logging activities caused a significant reduction of NTFP species only in the Central Amazon, with 39 species per plot in the old-growth forest in comparison to 35 species per plot in the logged forest. A significant decline in the percentage of endemic species was observed for the Chocó; in the old-growth forest we found 6.4% of E; meanwhile, in the logged forest this value decreased to 3.9%. Regarding D, similar levels were found among the logged and old-growth forest.
The recovery of ES supply and M was evaluated for successional forests, agroforestry systems, and plantations. Our results show an important potential of these recovery phases to recuperate the M (Figure 4) and particular ES (Figure 5). Indicators regarding soil-related services (N, P, K, and SOC) presented similar values than the reference old-growth forest. For example, N values in soil ranged from 0.22% to 0.33% across the three recovery phases and were statistically similar to the old-growth forest with values from 0.29% to 0.33% in both regions. As expected, the M, provisioning (TVP and NTFP) and regulating (AGC) services, and biodiversity (D and E) did not reach similar levels than the old-growth forest. Nonetheless, we observed that successional forests had similar values of ES than logged forests in both study areas. M reached values of 0.32 and 0.35 (Figure 4), TVP ranged between 93.6 and 101.4 m3 ha−1, AGC was between 83.9 and 86.4 Mg ha−1, and D was between 2.9 and 2.4 in the Central Amazon and the Chocó, respectively (Figure 5 and Table A2 in Appendix A). These results indicate the high capacity of successional forest to recover ES bundles. Plantations and agroforestry systems had low M; though, teak plantations had high values of TVP (179.4 m3 ha−1) similar to the old-growth forest.
4. Discussion
4.1. Ecosystem Services Synergies and Trade-Offs
The first component of the PCA showed a strong and positive correlation of M and how anthropogenic activities influence the ecosystems’ integrity and their capacity to provide multiple ES simultaneously. In the Central Amazon and the Chocó, M, AGC, TVP, NTFP, D, and E have a synergetic relation; whereas SOC, N, P, and K have rather diverging patterns. Interestingly, AGC showed positive relations with various ES similar to those observed for M, which indicates that AGC could be key for ecosystem service multifunctionality. Despite this, between both study areas M and AGC did not show similar patterns of correlations with soil-ES indicators (P and K), which can be the result of specific edaphoclimatic conditions, such as pH and precipitation intensities that influence soil indicators [131,132,133]. In our study areas, the average annual precipitation is 1812 mm in the Chocó and 4118 mm in the Central Amazon; whereas the pH is 5.5 in the Chocó and 4.5 for the Central Amazon. The information on average annual precipitation for these two regions was extracted from WorldClim data [62] for each plot installed for this study; likewise, the pH information is based on measurements in each of those plots. In consequence, the lower levels of P and K found in the Central Amazon could be explained by acid soils and leaching effects produced due to higher annual precipitation [61,131].
The observed interrelations between ES indicate that any human activity oriented to modify an ecosystem will have a positive or negative influence in various ES. For example, AGC and TVP had strong synergy in the Central Amazon and a moderate one in the Chocó, meaning that timber yields maximization most likely influence carbon pools directly, especially if the number of timber species and related harvestable timber volumes increase. In this context, the implementation of sustainable forest management practices considering less damage to remaining trees and the harvest of lower timber volumes will help to maintain AGC [134,135]. Additionally, we observed high to moderate positive correlations in the Central Amazon and Chocó between AGC and D. In this respect, Bunker, et al. [136] suggest that selective logging of species with big diameter and high wood density will contribute to a reduction of carbon stocks. There are also strong correlations between D and NTFP which means that a greater diversity of trees and palms holds a higher potential for forests to supply provisioning services, other than timber, which at the same time can promote alternative forest uses. On the other hand, we observed trade-offs mainly in AGC, TVP, D, NTFP, and M primarily for agroforestry systems and plantations. Despite this reduction, the values observed in soil indicators are still high, especially for K and P. Trees within agroforestry systems and plantations can influence soil properties and nutrient cycling [137]. Therefore, specific species can either cause a decrease or will help to enhance soil-related services [53,138].
Since monitoring ES and biodiversity is time-consuming and expensive, the implementation of policies aimed at the conservation of key services will generate simultaneous benefits to other ES. In this context, the umbrella species approach could provide the background for the identification of potential “umbrella ES”. This approach aims to conserve important species that require large areas or particular habitats to maintain their population. Therefore, the protection of umbrella species simultaneously contributes to the conservation of other species [139,140,141]. Based on this approach, conservation policies could target specific umbrella ES considering their capacity to generate multiple synergies with other ES. Umbrella ES should be easily measurable and sensitive to forest degradation and land use change. In this regard, our results showed that AGC can be considered as an umbrella ES since it is a sensitive indicator of forest integrity and it had strong to moderate synergies with M and several ES; however, AGC may not be a good proxy for soil indicators since it showed variable patterns. Thus, our findings support the feasibility of strategies such as REDD+ as it confirms synergies between carbon pools, provisioning services, and biodiversity [142], but also shows some limitations concerning soil ES.
4.2. Assessing the Decline of Ecosystem Services and Ecosystem Service Multifunctionality
The intensity of timber extraction, tree damage during forest intervention, and unplanned logging activities result in temporal or permanent decline of ES and therefore a potential forest degradation [37]. Based on the selected ES, the Central Amazon and the Chocó had a reduction of 16%–18% of M values respectively. AGC was highly affected by a reduction of 30%–32% for both regions, whereas TVP depleted 40% in the Central Amazon and 49% in the Chocó. This reduction occurred even though forest interventions in our study areas followed the technical guidelines from the Ministry of Environment of Ecuador, with cutting cycles between 5 years for PAFSI and 15 years for PAFSU. According to Roopsind, et al. [143], after 32 years the recovery probability of carbon and timber stocks with harvest intensities of 15–23 m3 ha−1 ranges between 45% and 80%. Other studies suggest that a logged forest will need between 12 to 43 years to recover after an AGC reduction of 10%–26% [144,145,146]. Based on these studies and our estimations, there is evidence that suggests that the logged areas included in our study may not completely reach their initial or reference levels as undisturbed forest if the current cutting cycles are maintained. If logging activities in these areas increase, it will lead to a permanently degraded forest where timber yields could be lower for the second or third cut [147].
Our findings highlight the importance of implementing sustainable forest management practices, such as reduced impact logging (RIL). RIL techniques will allow an adequate recovery of timber and carbon stocks, reducing C emission and supporting climate change mitigation. If RIL is implemented adequately, the damage to the remaining trees can be reduced [135]. In this regard, West, et al. [145] and Vidal, et al. [148] found that after the application of RIL techniques, with a reduction of 17% of AGB and 21% of commercial timber volume, AGB and commercial volume (merchantable species) can be recovered within 16–20 years, respectively.
Regarding NTFP, a decrease was only found in the Central Amazon which suggests a potential loss of species important for local use due to a change in forest structure and composition. The decrease in NTFP species can have implications on livelihood strategies since some species can be important for both timber and NTFP, creating a conflict of use for local people [149]. The logging effect on E was only observed in the Chocó, in this particular environment, continuous timber extraction interventions could lead to a high risk of endemic species extinction due to their restricted habitat distribution. The non-statistical differences of D between old-growth and logged forest in the Central Amazon and Chocó could be explained by the intermediate disturbance hypothesis, wherein the diversity of species can be maximized by the presence of disturbances [150,151,152]. In our case, probably the timber extraction (disturbance) stimulated new pioneer species contributing to species diversity [153,154]. Nevertheless, high intensity and frequency of disturbances could deplete tree diversity due to the decline of shade-tolerant species [150,151].
Logging intensities, size gap, and frequency influence nutrient cycling through the loss of nutrient pools and the reduction of litter inputs [155,156]. In our study areas, soil-related ES presented a reduction in the logged forest for SOC, N, and P, but with non-statistical differences to the old-growth forest in both study areas, suggesting a low effect of timber extraction. Our results are in line with Olander, et al. [157], who did not find an influence of logging gaps on SOC, N, and P. These authors observed a reduction of these indicators particularly in roads and decks during logging which can be mainly attributed to litter movement. Concomitantly, McNabb, et al. [158], found a reduction in C, N, P, and, K primarily in skid trails, and argued that soil impacts were a combination of logging effects and indirect influence of pioneer species such as Cecropia sp. during secondary succession. The removal of litter and nutrient pools from big trees in the above-ground biomass as a result of high logging intensities affect nutrient cycles [155] and therefore soil-related ES. Our results suggest relatively low evidence for degradation effects in soil-related services. However, these results should be interpreted with caution as we did not evaluate the effects of logging interventions on roads or decks.
Timber extraction is an important driver of degradation in the Amazon and Chocó [18]. In our study areas, logging mainly affected TVP and AGC, and to a lower level, the soil-related services, leading to a decrease of M. Since our study regions account for 68% of Ecuador´s harvestable timber with high commercial value [63], our results imply that to maintain ecosystem service multifunctionality and forest integrity, it is essential to implement sustainable use strategies that involve RIL techniques. It is also required to adjust the logging cycles and logging intensities considering the forest recovery potential. Moreover, the establishment of a permanent plot-network for the long-term monitoring of logged forests should be part of the national forestry inventory efforts.
4.3. Identifying the Potential Recovery of Ecosystem Services and Ecosystem Service Multifunctionality
Among the three analyzed recovery phases, the successional forest was the most effective in recovering single ES and M. These results show the importance of the successional forest to recover carbon pools, to provide timber and non-timber products, and to sustain plant diversity. However, successional forests have different species composition than undisturbed forests and are mainly characterized by fast-growing trees and a low abundance of slow-growing trees [159,160]. High values of AGC and TVP in the successional forest are explained by the high rates of biomass during the young and mid-stages of natural succession [48]. Overall, plantations and agroforestry systems had low levels of M. For example, balsa plantations in the Central Amazon had the lowest M values, low stocks of TVP and AGC, which is also expected due to their age structure (two to three-year of age; cutting cycle: 6 years) in contrast to older teak plantations in the Chocó (four to eighteen years; cutting cycle: 18 years). A relevant result was that agroforestry systems in the Chocó provide habitat shelter for endemic plant species (0.55% plot-average) and maintain an important agro-diversity that contributes to the livelihoods and income of local communities. On the other hand, plantations are an important source for timber provision. If smartly allocated, they could alleviate anthropogenic pressures in old-growth forests and contribute to AGC accumulation in the short and mid-term.
Land use change affects soil-related ES indicators by increasing soil erosion and by reducing the nutrient pools in above-ground biomass and litter. A study on soil attributes comparing pastures and forest in the Napo River valley, found that forest clearing caused a soil fertility loss for C (up to −68%), N (up to −50%), and K (up to −50%). This can be explained by a reduction in organic matter and high precipitation associated with nutrient leaching [161]. Other studies suggest that land use conversion from the forest into agricultural land can reduce SOC stocks by 25–75% [76,162,163]. The evaluated recovery phases offer promising values of soil indicators (SOC, N, P, and K). Plantations and agroforestry systems can influence soil properties positively or negatively depending on the species incorporated. Plantations of fast-growing species like Jacaranda copaia and Vochysia guatemalensis can deplete soil K and P [138], while teak plantations can maintain soil K and P [53]. In this case, the process is linked to leaf litter decomposition as older teak plantations are often more efficient in nutrient up taking from deeper soil horizons [164]. On the other hand, our agroforestry systems contain species such as Inga edulis, Myroxylon balsamum, and Erytrina poeppigiana which facilitate nitrogen fixation and foliar biomass, contributing to soil organic material and recovery of soil nutrients [165,166]. Plantations and agroforestry systems can help to recover soil-related services. However, it is important to highlight that a decline in nutrient pools can occur by a reduction of above-ground biomass after forest clearing or through timber extraction during several rotations cycles for the case of plantations. In the long-term this would lead to a permanent loss of soil fertility [167,168].
The recovery of the ecosystem’s integrity in deforested and degraded lands received more attention after the 20 × 20 Initiative, the Bonn Challenge, the FLR initiative, and REDD+. In this sense, our assessment provides empirical evidence of the effect of three common recovery phases on ecosystem service multifunctionality. Our study shows how natural systems that were almost completely modified have the potential to recover M values and reverse anthropogenic degradation. Agroforestry systems and plantations presented the lowest M, but they are important elements at the landscape level as they represent productive activities that help to improve local welfare and reduce pressures on the old-growth forest. This is especially important in our study areas, where 50–60% of household income depends on natural resources [169] and for indigenous communities who culturally rely on traditional agroforestry systems (chakras) to develop their livelihoods, harmonizing ES (mainly provision and regulation) for their well-being and biodiversity preservation.
From the three recovery phases, successional forests reach the highest levels of M. Although the successional forests evaluated here are not fully comparable to old-growth or even logged forests, the levels of M achieved so far were between 73% for the Central Amazon and 80% for the Chocó compared to the old-growth forest and had similar values to the logged forest, but with a different structure and composition. This underpins the importance of successional forests for recovery of ES with a low associated cost; considering these forests in strategies like payment for ecosystem services or sustainable forest management may generate economic benefits to their owners while supporting conservation and avoid a new clearing of these successional forests. Agroforestry systems and plantations might not reach high M values as old-growth forest, but they are of crucial importance for food and timber provision. If both strategies are combined with successional forest they can improve ES provision at the landscape level.
5. Conclusions
We present new evidence on the capacity of different land use transition phases to simultaneously provide bundles of ES as a result of complex interactions. The interrelations among the selected ES show that human-induced alterations on ecological systems have a profound effect on ES bundles. Since AGC was positively correlated with M and presented synergies with multiple ES (e.g., TVP, NTFP, D, and E), we consider that AGC could serve as an umbrella ES as it confirms a synergetic relation with provisioning services and biodiversity indicators. Actions focused to improve or conserve the carbon pools can benefit other ES in parallel. However, for soil-related services, the conservation of AGC may not be entirely effective.
Our result shows that logging activities provoke a decline in ES and M, reaching critical thresholds. M and particular ES such as TVP and AGC are highly affected, whereas soil-related services showed lower impacts due to timber extraction. More intense and frequent logging interventions can lead to long-term degradation or even trigger a drastic forest cover change with high negative effects on the ecosystem service multifunctionality. Sustainable management practices are required to reduce tree damage. It is also necessary to harmonize cutting cycles considering the forest recovery potential, accompanied by strict monitoring and post-harvesting control measures. These actions will help to avoid forest conversion into alternative land uses, maintaining ecosystem service multifunctionality, especially in landscapes under high deforestation pressure, such as the Amazon and the Chocó.
Our results highlight how successional forest, plantations, and agroforestry systems have the potential to recover ecosystem service multifunctionality and reverse human disturbance after forest clearing. From the evaluated recovery phases, the successional forest achieves the highest levels of M values and is the best option for recovering an ecosystem´s integrity. Nevertheless, as more human-modified landscapes emerge and the need for provisioning services increases (e.g., food, medicine, timber), it is also important to envisage options towards agroforestry systems and plantations. The incorporation of different alternatives to recover ES and M will help to reduce the gap between conservation and economic activities in local communities.
This study evidences that there is an urgent need for a broad range of interventions to integrally tackle environmental problems in tropical landscapes. On the one hand, actions that conserve the standing intact forests and reduce the ongoing deforestation are required; on the other hand, better forest management practices aimed at reducing ES depletion have to be implemented. This shows that there is no unique strategy and calls for integrated landscape approaches and initiatives aiming to harmonize climate change mitigation with other forest functions, such as REDD+.
Author Contributions
Conceptualization, P.E., T.O.L., and S.G.; methodology, P.E. and S.G.; formal analysis, P.E. and T.O.L.; investigation, P.E.; data curation, P.E.; writing—original draft preparation, P.E. and T.O.L.; writing—review and editing, P.E., T.O.L., B.T., M.L., and S.G.; project administration, P.E., T.O.L., and B.T.; funding acquisition, P.E., T.O.L., and S.G., supervision, S.G. All authors have read and agreed to the published version of the manuscript.
Funding
The study and the authors are part of the Landscape Forestry in the Tropics (LaForeT) project conducted by the Thünen Institute of International Forestry and Forest Economics, Hamburg, Germany, and funded by the German Federal Ministry of Food and Agriculture. Paul Eguiguren and Tatiana Ojeda Luna received a four-year scholarship from the Secretary of Higher Education, Science, Technology and Innovation of Ecuador (SENESCYT).
Acknowledgments
We would like to thank the Thünen Institute of International Forestry and Forest Economics for the financial support and the Secretary of Higher Education, Science, Technology and Innovation of Ecuador (SENESCYT) for the scholarship for Paul Eguiguren and Tatiana Ojeda Luna. We also thank the proofreading service of TUM Graduate School and Thünen Institute Proofreading Service, Richard Fischer from Thünen Institute and Fabián Tamayo from Universidad Estatal Amazónica for their coordination and support during the field campaign, and to our field team in Ecuador: Daniel Paguay, Gabriel Grefa, Cristian Tipán, and Rodrigo Maza.
Conflicts of Interest
The authors declare no conflict of interest.
Appendix A

Figure A1.
PCA based in climatic variables BIO 1: annual mean temperature, TMIN: annual mean minimum temperature, TMAX: annual mean maximum temperature, BIO 2: mean diurnal range, BIO 5: max temperature of the warmest month, BIO 6: min temperature of the coldest month, BIO 8: mean temperature of the wettest month, BIO 9: mean temperature of driest quarter, BIO 10: mean temperature of warmest quarter, BIO 11: mean temperature of coldest quarter, BIO 12: annual precipitation, BIO 13: precipitation of wettest month, BIO 15: precipitation seasonality (coefficient of variation), BIO 16: precipitation of wettest quarter, BIO 18: precipitation of warmest quarter and BIO 19: precipitation of coldest quarter.

Figure A2.
Cluster analysis based on the first two components resultant from the PCA. OGL: old-growth forest. LF: logged forest. SF: successional forest. AGS: agroforestry systems. PLA: plantation.
Table A1.
MANOVA for the two main groups identified from cluster analysis.
Table A1.
MANOVA for the two main groups identified from cluster analysis.
| Cluster | PC 1 | PC 2 | n | |
|---|---|---|---|---|
| Cluster 1 = Chocó | 4.16 | −0.97 | 54 | A |
| Cluster 2 = Central Amazon | –2.2 | 0.51 | 102 | B |
| Wilks: p-value ≤ 0.0001 | ||||
| Pillai: p-value ≤ 0.0001 | ||||
| Lawley–Hotelling: p-value ≤ 0.0001 | ||||
| Roy: p-value ≤ 0.0001 | ||||
| Different letters (A and B) indicate significant difference from each other | ||||
Table A2.
Descriptive statistics for the selected ecosystem services.
Table A2.
Descriptive statistics for the selected ecosystem services.
| Region | TVP (m3 ha−1) | NTFP (# sp. plot−1) | AGC (Mg ha−1) | SOC (Mg ha−1) | N (%) | P (mg kg−1) | K (meq/100 mL) | D (index) | E (%) | M (index) | |
|---|---|---|---|---|---|---|---|---|---|---|---|
| Old-growth forest | Central Amazon | 190.57 | 38.98 | 167.34 | 52.57 | 0.32 | 2.77 | 0.13 | 3.54 | 0.07 | 0.44 |
| Chocó | 149.90 | 14.26 | 146.94 | 50.79 | 0.29 | 4.10 | 0.20 | 2.76 | 6.44 | 0.44 | |
| Logged forest | Central Amazon | 113.30 | 35.55 | 113.30 | 48.19 | 0.32 | 2.25 | 0.13 | 3.46 | 0.16 | 0.37 |
| Chocó | 75.94 | 15.01 | 102.51 | 43.13 | 0.26 | 3.39 | 0.27 | 2.81 | 3.94 | 0.36 | |
| Successional forest | Central Amazon | 93.69 | 25.03 | 83.93 | 49.45 | 0.33 | 2.34 | 0.12 | 2.94 | 0.36 | 0.32 |
| Chocó | 101.49 | 17.94 | 86.49 | 51.42 | 0.29 | 5.10 | 0.26 | 2.44 | 1.54 | 0.35 | |
| Plantations | Central Amazon | 75.94 | - | 14.73 | 46.39 | 0.32 | 1.06 | 0.21 | - | - | 0.12 |
| Chocó | 179.47 | - | 66.02 | 40.68 | 0.24 | 5.21 | 0.34 | - | - | 0.19 | |
| Agroforestry systems | Central Amazon | 47.47 | 8.87 | 28.50 | 50.34 | 0.35 | 2.46 | 0.14 | 1.45 | 0.00 | 0.22 |
| Chocó | 83.10 | 7.34 | 40.45 | 36.88 | 0.22 | 4.57 | 0.49 | 1.60 | 0.56 | 0.23 |
TVP: timber volume potential. NTFP: Non-timber forest products. AGC: above-ground carbon stocks. SOC: soil carbon stocks. N: nitrogen. P: phosphorus. K: potassium, D: Shannon index. E: endemism. M: ecosystem service multifunctionality.
References
- Keenan, R.; Reams, G.; Achard, F.; De-Freitas, J.; Grainger, A.; Lindquist, E. Dynamics of global forest area: Results from the FAO Global Forest Resources Assessment 2015. For. Ecol. Manag. 2015, 352, 9–20. [Google Scholar] [CrossRef]
- FAO. Global Forest Resources Assessment 2020. Key Findings; Food andf Agriculture Organization of the United Nations: Rome, Italy, 2020; p. 15. [Google Scholar]
- Tovo, A.; Suweis, S.; Formentin, M.; Favretti, M.; Volkov, I.; Banavar, J.; Azaele, S.; Maritan, A. Upscaling species richness and abundances in tropical forests. Sci. Adv. 2017, 3, 1–11. [Google Scholar] [CrossRef] [PubMed]
- Nelson, E.; Mendoza, G.; Regetz, J.; Polasky, S.; Tallis, H.; Cameron, R.; Chan, K.; Daily, G.; Goldstein, J.; Kareiva, P. Modeling multiple ecosystem services, biodiversity conservation, commodity production, and tradeoffs at landscape scales. Front. Ecol. Environ. 2009, 7, 4–11. [Google Scholar] [CrossRef]
- Costanza, R.; d’-Arge, R.; De-Groot, R.; Farber, S.; Grasso, M.; Hannon, B.; Limburg, K.; Naeem, S.; O’neill, R.; Paruelo, J. The value of the world’s ecosystem services and natural capital. Nature 1997, 387, 253. [Google Scholar] [CrossRef]
- Wilson, S.; Schelhas, J.; Grau, H.; Nanni, A.; Sloan, S. Forest ecosystem-service transitions: The ecological dimensions of the forest transition. Ecol. Soc. 2017, 24, 1–20. [Google Scholar] [CrossRef]
- Chazdon, R. Second Growth: The Promise of Tropical Forest Regeneration in an Age of Deforestation; University of Chicago Press: Chicago, IL, USA, 2014; pp. 1–429. [Google Scholar]
- MEA. Millennium Ecosystem Assessment. Ecosystems and Human Well-being: Synthesis. Millennium Ecosystem Assessment; Island Press: Washington, DC, USA, 2005; pp. 1–155. [Google Scholar]
- Bailey, S. Increasing connectivity in fragmented landscapes: An investigation of evidence for biodiversity gain in woodlands. For. Ecol. Manag. 2007, 238, 7–23. [Google Scholar] [CrossRef]
- Loreau, M.; Naeem, S.; Inchausti, P.; Bengtsson, J.; Grime, J.; Hector, A.; Hooper, D.; Huston, M.; Raffaelli, D.; Schmid, B.; et al. Biodiversity and Ecosystem Functioning: Current Knowledge and Future Challenges. Science 2001, 294, 804–808. [Google Scholar] [CrossRef]
- Houghton, R.A. Carbon emissions and the drivers of deforestation and forest degradation in the tropics. Curr. Opin. Environ. Sustain. 2012, 4, 597–603. [Google Scholar] [CrossRef]
- Ravindranath, N.; Ostwald, M. Carbon Inventory Methods Handbook for Greenhouse Gas Inventory, Carbon Mitigation and Roundwood Production Projects; Springer: Berlin, Germany, 2008; p. 299. [Google Scholar]
- Asner, G.; Powell, G.; Mascaro, J.; Knapp, D.; Jacobson, J.; Kennedy-Bowdoin, T.; Balaji, A.; Paez-Acosta, G.; Victoria, E.; Secada, L.; et al. High-resolution forest carbon stocks and emissions in the Amazon. Proc. Natl. Acad. Sci. USA 2010, 107, 16738–16742. [Google Scholar] [CrossRef]
- Potapov, P.; Hansen, M.; Laestadius, L.; Turubanova, S.; Yaroshenko, A.; Thies, C.; Smith, W.; Zhuravleva, I.; Komarova, A.; Minnemeyer, S. The last frontiers of wilderness: Tracking loss of intact forest landscapes from 2000 to 2013. Sci. Adv. 2017, 3, e1600821. [Google Scholar] [CrossRef]
- Myers, N.; Mittermeier, R.; Mittermeier, C.; Fonseca, G.; Kent, J. Biodiversity hotspots for conservation priorities. Nature 2000, 403, 853–858. [Google Scholar] [CrossRef] [PubMed]
- Marchese, C. Biodiversity hotspots: A shortcut for a more complicated concept. Glob. Ecol. Conserv. 2015, 3, 297–309. [Google Scholar] [CrossRef]
- Basthlott, W.; Hostert, A.; Kier, G.; Kuper, W.; Kreft, J.; Rafiqpoor, D.; Sommer, H. Geographic patterns of vascular plant divesity at continental to global scales. Erdkunde 2007, 61, 305–315. [Google Scholar] [CrossRef]
- Hososuma, N.; Herold, M.; De-Sy, V.; De-Fries, R.; Brockhaus, M.; Verchot, L.; Angelsen, A.; Romijn, E. An assessment of deforestation and forest degradation drivers in developing countries. Environ. Res. Lett. 2012, 7, 1–12. [Google Scholar]
- FAO. Global Forest Resources Assessment. Terms and Definitions FRA 2020; Working Paper Series; Food and Agriculture Organization of the United Nations: Rome, Italy, 2020; pp. 1–26. [Google Scholar]
- IPBES. Summary for Policymakers of the Assessment Report on Land Degradation and Restoration of the Intergovernmental SciencePolicy Platform on Biodiversity and Ecosystem Services; IPBES secretariat: Bonn, Germany, 2018; pp. 1–44. [Google Scholar]
- Sierra, R. Patrones Y Factores De Deforestación En El Ecuador Continental, 1990–2010. Y un Acercamiento a Los Próximos 10 Años. Conservación Internacional Ecuador Y Forest Trends; GeoIS: Quito, Ecuador, 2013; pp. 1–57. [Google Scholar]
- Wasserstrom, R.; Southgate, D. Deforestation, Agrarian Reform and Oil Development in Ecuador, 1964–1994. Nat. Resour. 2013, 4, 31–44. [Google Scholar] [CrossRef]
- Fagua, C.; Baggio, J.; Ramsey, D. Drivers of forest cover changes in the Chocó-Darien Global Ecoregion of South America. Ecosphere 2019, 10, e02648. [Google Scholar] [CrossRef]
- Foley, J.; Asner, G.; Heil, M.; Coe, M.; DeFries, R.; Gibbs, H.; Howard, E.; Olson, S.; Patz, J.; Ramankutty, N.; et al. Amazonia revealed: Forest degradation and loss of ecosystem good and services in the Amazon basin. Ecol. Soc. Am. 2007, 5, 25–32. [Google Scholar] [CrossRef]
- Lambin, E.; Meyfroidt, P. Land use transitions: Socio-ecological feedback versus socio-economic change. Land Use Policy 2010, 27, 108–118. [Google Scholar] [CrossRef]
- Bremer, L.; Farley, K. Does plantation forestry restore biodiversity or create green deserts? A synthesis of the effects of land-use transitions on plant species richness. Biodivers. Conserv. 2010, 19, 3893–3915. [Google Scholar] [CrossRef]
- Kissinger, G.; Herold, M.; De-Sy, V. Drivers of Deforestation and Forest Degradation: A Synthesis Report for REDD+ Policymakers; Lexeme Consulting: Vancouver, BC, Canada, 2012; pp. 1–47. [Google Scholar]
- Thompson, I.; Guariguata, M.; Okabe, K.; Bahamondez, C.; Nasi, R.; Heymell, V.; Sabogal, C. An operational framework for defining and monitoring forest degradation. Ecol. Soc. 2013, 18, 20. [Google Scholar] [CrossRef]
- Chazdon, R.; Uriarte, M. Natural regeneration in the context of large-scale forest and landscape restoration in the tropics. Biotropica 2016, 48, 709–715. [Google Scholar] [CrossRef]
- Benz, P.; Chen, S.; Dang, S.; Dieter, M.; Labelle, E.; Liu, G.; Hou, L.; Mosandl, R.; Pretzsch, H.; Pukall, K.; et al. Multifunctionality of Forests: A White Paper on Challenges and Opportunities in China and Germany. Forests 2020, 11, 266. [Google Scholar] [CrossRef]
- Manning, P.; van-der-Plas, F.; Soliveres, S.; Allan, E.; Maestre, F.; Mace, G.; Whittingham, M.; Fischer, M. Redefining ecosystem multifunctionality. Nat. Ecol. Evol. 2018, 2, 427–436. [Google Scholar] [CrossRef] [PubMed]
- Hölting, L.; Beckmann, M.; Volk, M.; Cord, A. Multifunctionality assessments—More than assessing multiple ecosystem functions and services? A quantitative literature review. Ecol. Indic. 2019, 103, 226–235. [Google Scholar] [CrossRef]
- O’Farrell, P.; Anderson, P. Sustainable multifunctional landscapes: A review to implementation. Curr. Opin. Environ. Sustain. 2010, 2, 59–65. [Google Scholar] [CrossRef]
- Lovell, S.; Johnston, D. Creating multifunctional landscapes: How can the field of ecology inform the design of the landscape? Front. Ecol. Environ. 2009, 7, 212–220. [Google Scholar] [CrossRef]
- Mastrangelo, M.; Weyland, F.; Villarino, S.; Barral, M.; Nahuelhual, L.; Laterra, P. Concepts and methods for landscape multifunctionality and a unifying framework based on ecosystem services. Landsc. Ecol. 2014, 29, 345–358. [Google Scholar] [CrossRef]
- Dauber, E.; Fredericksen, T.; Pena, M. Sustainability of timber harvesting in Bolivian tropical forests. For. Ecol. Manag. 2005, 214, 294–304. [Google Scholar] [CrossRef]
- Sist, P.; Nascimiento, F. Sustainability of reduced-impact logging in the Eastern Amazon. For. Ecol. Manag. 2007, 243, 199–209. [Google Scholar] [CrossRef]
- Gerwing, J. Degradation of forest through logging and fire in the eastern Brazilian Amazon. For. Ecol. Manag. 2002, 157, 131–141. [Google Scholar] [CrossRef]
- Lara, A.; Little, C.; Urrutia, R.; McPhee, J.; Álvarez-Garretón, C.; Oyarzún, C.; Soto, D.; Donoso, P.; Nahuelhual, L.; Pino, M. Assessment of ecosystem services as an opportunity for the conservation and management of native forests in Chile. For. Ecol. Manag. 2009, 258, 415–424. [Google Scholar] [CrossRef]
- Uriarte, M.; Yackulic, C.; Lim, Y.; Arce-Nazario, J. Influence of land use on water quality in a tropical landscape: A multi-scale analysis. Landsc. Ecol. 2011, 26, 1151–1164. [Google Scholar] [CrossRef] [PubMed]
- Bertzky, M.; Ravilious, C.; Araujo-Navas, A.; Kapos, V.; Carrión, D.; Chíu, M.; Dickson, B. Carbon, Biodiversity and Ecosystem Services: Exploring Co-benefits; UNEP-WCMC: Cambridge, UK, 2010; pp. 1–19. [Google Scholar]
- Anderson-Teixeira, K.; Snyder, P.; Twine, T.; Cuadra, S.; Costa, M.; DeLucia, E. Climate-regulation services of natural and agricultural ecoregions of the Americas. Nat. Clim. Chang. 2012, 2, 177. [Google Scholar] [CrossRef]
- Pearson, T.; Brown, S.; Murray, L.; Sidman, G. Greenhouse gas emissions from tropical forest degradation: An underestimated source. Carbon Balance Manag. 2017, 12, 1–11. [Google Scholar] [CrossRef] [PubMed]
- Suryatmojo, H.; Masamitsu, F.; Kosugi, K.; Mizuyama, T. Impact of selective logging and intensive line planting system on runoff and soil erosion in a Tropical Indonesia rainforest. In River Basin Management VI; Wessex Institute of Technology: Southampton, UK, 2011; pp. 288–300. [Google Scholar]
- Brancalion, P.H.; Cardozo, I.V.; Camatta, A.; Aronson, J.; Rodrigues, R. Cultural ecosystem services and popular perceptions of the benefits of an ecological restoration project in the Brazilian Atlantic Forest. Restor. Ecol. 2014, 22, 65–71. [Google Scholar] [CrossRef]
- Sutherland, I.; Gergel, S.; Bennett, E. Seeing the forest for its multiple ecosystem services: Indicators for cultural services in heterogeneous forests. Ecol. Indic. 2016, 71, 123–133. [Google Scholar] [CrossRef]
- Edwards, D.; Tobias, J.; Sheil, D.; Meijaard, E.; Laurance, W. Maintaining ecosystem function and services in logged tropical forests. Trends Ecol. Evol. 2014, 29, 511–520. [Google Scholar] [CrossRef]
- Chazdon, R.L.; Broadbent, E.N.; Rozendaal, D.M.A.; Bongers, F.; Zambrano, A.M.A.; Aide, T.M.; Balvanera, P.; Becknell, J.M.; Boukili, V.; Brancalion, P.H.S.; et al. Carbon sequestration potential of second-growth forest regeneration in the Latin American tropics. Sci. Adv. 2016, 2, e1501639. [Google Scholar] [CrossRef]
- Silver, W.; Ostertag, R.; Lugo, A. The Potential for Carbon Sequestration Through Reforestation of Abandoned Tropical Agricultural and Pasture Lands. Restor. Ecol. 2000, 8, 394–407. [Google Scholar] [CrossRef]
- Bauhus, J.; Pokorny, B.; van der Meer, P.; Kanowski, P.; Kanninen, M. Ecosystem Goods and Services from Plantation Forests; Routledge: Washington, DC, USA, 2010; pp. 1–253. [Google Scholar]
- Zeng, Y.; Gou, M.; Ouyang, S.; Chen, L.; Fang, X.; Zhao, L.; Li, J.; Peng, C.; Xiang, W. The impact of secondary forest restoration on multiple ecosystem services and their trade-offs. Ecol. Indic. 2019, 104, 248–258. [Google Scholar] [CrossRef]
- Clec’h, S.; Oszwald, J.; Decaens, T.; Desjardins, T.; Dufour, S.; Grimaldi, M.; Jegou, N.; Lavelle, P. Mapping multiple ecosystem services indicators: Toward an objective-oriented approach. Ecol. Indic. 2016, 69, 508–521. [Google Scholar] [CrossRef]
- Boley, J.; Drew, A.; Andrus, R. Effects of active pasture, teak (Tectona grandis) and mixed native plantations on soil chemistry in Costa Rica. For. Ecol. Manag. 2009, 257, 2254–2261. [Google Scholar] [CrossRef]
- FAO. Global Forest Resources Assessment’s (FRA) definitions for forests. Planted Forest. Available online: http://www.fao.org/forestry/plantedforests/67504/en/ (accessed on 1 June 2020).
- Harrison, P.; Berry, P.; Simpson, G.; Haslett, J.; Blicharska, M.; Bucur, M.; Dunford, R.; Egoh, B.; Garcia-Llorente, M.; Geamănă, N.; et al. Linkages between biodiversity attributes and ecosystem services: A systematic review. Ecosyst. Serv. 2014, 9, 191–203. [Google Scholar] [CrossRef]
- Mace, G.; Norris, K.; Fitter, A. Biodiversity and ecosystem services: A multilayered relationship. Trends Ecol. Evol. 2012, 27, 19–26. [Google Scholar] [CrossRef] [PubMed]
- Balvanera, P.; Quijas, S.; Martín-López, B.; Barrios, E.; Dee, L.; Isbell, F.; Durance, I.; White, P.; Blanchard, R.; de Groot, R. The links between biodiversity and ecosystem services. In Routledge Handbook of Ecosystem Services; Routledge: Washington, DC, USA, 2016; pp. 45–61. [Google Scholar]
- Mouillot, D.; Villéger, S.; Scherer-Lorenzen, M.; Mason, N.W. Functional structure of biological communities predicts ecosystem multifunctionality. PLoS ONE 2011, 6, e17476. [Google Scholar] [CrossRef] [PubMed]
- Schuldt, A.; Assmann, T.; Brezzi, M.; Buscot, F.; Eichenberg, D.; Gutknecht, J.; Härdtle, W.; He, J.-S.; Klein, A.-M.; Kühn, P. Biodiversity across trophic levels drives multifunctionality in highly diverse forests. Nat. Commun. 2018, 9, 2989. [Google Scholar] [CrossRef]
- INAMHI. Anuario Metodologico del Ecuador; Instituto Nacional de Meteorología e Hidrología del Ecuador; MAE: Quito, Ecuador, 2015; pp. 1–134. [Google Scholar]
- Bravo, C.; Ramirez, A.; Haidee, M.; Torres, B.; Alemán, R.; Roldan, T.; Hnery, N.; Changoluisa, D. Factores asociados a la foertilidad del suelo en diferentes usos de la tierra en la Región Amazónica Ecuatoriana. Rev. Electron. Vet. 2017, 18, 1–16. [Google Scholar]
- MAE. Deforestación del Ecuador continental periodo 2014–2016; Ministerio del Ambiente del Ecuador: Quito, Ecuador, 2017; pp. 1–37. [Google Scholar]
- MAE; FAO. Resultados de la Evaluación Nacional Forestal; MAE: Quito, Ecuador, 2014; pp. 1–316. [Google Scholar]
- Fick, S.; Hijmans, R. WorldClim 2: New 1-km spatial resolution climate surfaces for global areas. R. Meteorol. Soc. 2017, 37, 4302–4315. [Google Scholar] [CrossRef]
- Tabachnick, B.; Fidell, L. Using Multivariate Statistics, 6th ed.; Pearson: Boston, MA, USA, 2013; pp. 1–983. [Google Scholar]
- Huberty, C.; Olejnik, S. Applied MANOVA and Discriminant Analysis, 2nd ed.; John Wiley & Sons, Inc.: Hoboken, NJ, USA, 2006; pp. 1–488. [Google Scholar]
- Killmann, W. Proceedings of the Expert Meeting on Harmonizing Forest-Related Definitions for Use by Various Stakeholders, Rome, Italy, 23–25 January 2002; Food and Agriculture Organization of the United Nations: Rome, Italy, 2002. [Google Scholar]
- Bonilla-Bedoya, S.; Estrella-Bastidas, A.; Ordoñez, M.; Sanchez, A.; Herrera, M. Patterns of timber harvesting and its relationship with sustainable forest management in the western Amazon, Ecuador case. J. Sustain. For. 2017, 36, 433–453. [Google Scholar] [CrossRef]
- MAE. Las Normas Para el Manejo Forestal Sostenible de los Bosques Húmedo. Acuerdo N. 0125; Ministerio del Ambiente del Ecuador: Quito, Ecuador, 2015. [Google Scholar]
- Brown, S.; Lugo, A. Tropical secondary forest. J. Trop. Ecol. 1990, 6, 1–32. [Google Scholar] [CrossRef]
- Torres, B.; Jadan, O.; Aguirre, P.; Hinojosa, L.; Günter, S. The contribution of traditional agroforestry to climate change adaptation in the Ecuadorian Amazon: The Chakra system. In Handbook of Climate Change Adaptation; Leal-Filho, W., Ed.; Springer-Verlag: Berlin, Germany, 2015; pp. 1973–1994. [Google Scholar]
- La-Notte, A.; D’Amato, D.; Mäkinen, H.; Paracchini, M.; Liquete, C.; Egoh, B.; Geneletti, D.; Crossman, N. Ecosystem services classification: A systems ecology perspective of the cascade framework. Ecol. Indic. 2017, 74, 392–402. [Google Scholar] [CrossRef] [PubMed]
- De Groot, R.; Alkemade, R.; Braat, L.; Hein, L.; Willemen, L. Challenges in integrating the concept of ecosystem services and values in landscape planning, management and decision making. Ecol. Complex. 2010, 7, 260–272. [Google Scholar] [CrossRef]
- Burkhard, B.; Kroll, F.; Nedkov, S.; Müller, F. Mapping ecosystem service supply, demand and budgets. Ecol. Indic. 2012, 21, 17–29. [Google Scholar] [CrossRef]
- Williams, A.; Hedlund, K. Indicators of soil ecosystem services in conventional and organic arable fields along a gradient of landscape heterogeneity in southern Sweden. Appl. Soil Ecol. 2013, 65, 1–7. [Google Scholar] [CrossRef]
- Don, A.; Schumacher, J.; Freibauer, A. Impact of tropical land-use change on soil organic carbon stocks—A meta-analysis. Glob. Chang. Biol. 2011, 17, 1658–1670. [Google Scholar] [CrossRef]
- Mejia, E.; Pacheco, P. Forest Use and Timber Markets in the Ecuadorian Amazon. Occasional Paper 111; CIFOR: Bogor, Indonesia, 2014; p. 101. [Google Scholar]
- MAE. Procedimientos para Autorizar el Aprovechamiento y Corta de Madera. Acuerdo Ministerial 139; Ministerio del Ambiente del Ecuador: Quito, Ecuador, 2010; pp. 1–33. [Google Scholar]
- Rodríguez, C.; Guillen, A.; Tercero, E. Factor de forma para la Tectona grandis LF, empresa MLR-Forestal, Siuna, Costa Caribe Norte de Nicaragua. Cienc. Intercult. 2017, 21, 74–84. [Google Scholar] [CrossRef]
- Armijos, D. Construcción de Tablas Volumétricas y Cálculo de Factor de Forma (FF.) para dos especies, Teca (Tectona Grandis) y Melina (Gmelina arborea) en tres plantaciones de la Empresa Reybanpac CA en la provincia de Los Ríos. Bachelor´s Thesis, Escuela Superior Politécnica de Chimborazo, Riobamba, Ecuador, 2013. [Google Scholar]
- Murillo, C. Tablas de Volumen y Porcentaje de Aprovechamiento en el Aserrado de Ochroma Pyramidale (BALSA) en el Recinto El Vergel, Cantón Valencia, Provincia de Los Ríos, año 2012; UTEQ: Quevedo, Spain, 2012. [Google Scholar]
- De la Torre, L.; Navarrete, H.; Muriel, P.; Macía, M.; Balslev, H. Enciclopedia de las Plantas Útiles del Ecuador (Con Extracto de Datos); Herbario QCA de la Escuela de Ciencias Biológicas de la Pontificia Universidad Católica del Ecuador & Herbario AAU del Departamento de Ciencias Biológicas de la Universidad de Aarhus: Quito, Ecuador, 2008; p. 955. [Google Scholar]
- Pérez, Á.; Hernández, C.; Romero-Saltos, H.; Valencia, R. Árboles Emblemáticos de Yasuní, Ecuador; Escuela de Ciencias Biológicas, Pontificia Universidad Católica del Ecuador: Quito, Ecuador, 2014. [Google Scholar]
- MAE. Propuesta Normativa: Lineamientos Técnicos Para el Manejo y Aprovechamiento Sostenible de Productos Forestales no Maderables (PFNM); MAE: Quito, Ecuador, 2018; pp. 1–13. [Google Scholar]
- IPCC. IPCC 5th Assessment Report "Climate Change 2013: The Physical Science Basis"; IPCC: Stockholm, Sweden, 2013. [Google Scholar]
- FAO. The State of Forests in the Amazon Basin, Congo Basin, and Southeast Asia. A Report Prepared for the Summit of the Three Rainforest Basins; FAO: Rome, Italy, 2011; pp. 1–80. [Google Scholar]
- Chave, J.; Rejou-Mechain, M.; Burquez, A.; Chidumayo, E.; Colgan, M.; Delitti, W.; Duque, A.; Eid, T.; Fearnside, P.; Goodman, R.; et al. Improved allometric models to estimate the aboveground biomass of tropical trees. Glob. Chang. Biol. 2014, 20, 3177–3190. [Google Scholar] [CrossRef]
- Chave, J.; Coomes, D.A.; Jansen, S.; Lewis, S.L.; Swenson, N.G.; Zanne, A.E. Data from: Towards a Worldwide Wood Economics Spectrum; Dryad: Durham, CA, USA, 2009. [Google Scholar]
- Chave, J.; Coomes, D.A.; Jansen, S.; Lewis, S.L.; Swenson, N.G.; Zanne, A.E. Towards a worldwide wood economics spectrum. Ecol. Lett. 2009, 12, 351–366. [Google Scholar] [CrossRef]
- MAE. Propiedades Anatómicas, Físicas y Mecanicas de 93 Especies Forestales; Ministerios del Ambiente del Ecuador: Quito, Ecuador, 2014; p. 169. [Google Scholar]
- Aguirre, Z.; Loja, A.; Solano, C.; Aguirre, N. Especies Forestales Más Aprovechadas en la Región Sur del Ecuador; Universidad Nacional de Loja: Loja, Ecuador, 2015; pp. 1–80. [Google Scholar]
- Goodman, R.; Phillips, O.; Castillo, D.; Freitas, L.; Tapia, S.; Monteagudo, A.; Baker, T. Amazon palm biomass and allometry. For. Ecol. Manag. 2013, 310, 994–1004. [Google Scholar] [CrossRef]
- Jadan, O.; Torres, B.; Gunter, S. Influencia del uso de la tierra sobre almacenamiento de carbono en sistemas productivos y bosque primario en Napo, Reserva de Biosfera Sumaco, Ecuador. Rev. Amaz. Cienc. Tecnol. 2012, 1, 173–186. [Google Scholar]
- Ordóñez, L.; Gavilánez, C.; Salazar, A. Secuestro de Carbono en Biomasa Aérea en Sistemas Agroforestales de Cacao y Café Ubicados en la Reserva de Biosfera Sumaco. Estudio Técnico; GIZ: Quito, Ecuador, 2011; p. 32. [Google Scholar]
- Anacafe (Asociación Nacional del Café en Guatemala). Propuesta Metodologica para la Evaluación de Servicios Ambientales; Anacafe (Asociación Nacional del Café en Guatemala): Guatemala, Guatemala, 2008. [Google Scholar]
- Douterlungne, D.; Herrera-Gorocica, A.; Ferguson, B.; Siddique, I.; Soto-Pinto, L. Allometric equations used to estimate biomass and carbon in four neotropical tree species with restoration potential. Agrociencia 2013, 47, 385–397. [Google Scholar]
- Perez-Cordero, L.; Kanninen, M. Aboveground biomass of Tectona grandis platantions in Costa Rica. J. Trop. For. Sci. 2003, 15, 199–213. [Google Scholar]
- Pearson, T.; Walker, S.; Brown, S. Sourcebook for Land Use, Land-use Change and Forest Projects; World Bank: Washington, DC, USA, 2005; p. 57. [Google Scholar]
- Costanza, R.; De Groot, R.; Braat, L.; Kubiszewski, I.; Fioramonti, L.; Sutton, P.; Farber, S.; Grasso, M. Twenty years of ecosystem services: How far have we come and how far do we still need to go? Ecosyst. Serv. 2017, 28, 1–16. [Google Scholar] [CrossRef]
- Schoenholtz, S.H.; Van-Miegroet, H.; Burger, J. A review of chemical and physical properties as indicators of forest soil quality: Challenges and opportunities. For. Ecol. Manag. 2000, 138, 335–356. [Google Scholar] [CrossRef]
- Wall, D.; Bardgett, R.; Behan-Pelletier, V.; Herrick, J.; Jones, H.; Ritz, K.; Six, J.; Strong, D.; van-der-Putten, W. Soil Ecology and Ecosystem Services; Oxford University Press: Oxford, UK, 2012. [Google Scholar]
- Aragão, L.; Malhi, Y.; Metcalfe, D.; Silva-Espejo, J.; Jiménez, E.; Navarrete, D.; Almeida, S.; Costa, A.; Salinas, N.; Phillips, O.; et al. Above-and below-ground net primary productivity across ten Amazonian forests on contrasting soils. Biogeosciences 2009, 6, 2759–2778. [Google Scholar] [CrossRef]
- Survey, S.S. Kellogg Soil Survey Laboratory Methods Manual; Report No. ed.; U.S. Department of Agriculture, Natural Resources Conservation Service: Washington, DC, USA, 2014; pp. 1–1030. [Google Scholar]
- Olsen, S.C.; Watanabe, F.; Dean, L. Estimation of available Phosphorus in Soils by Extraction with Sodium Bicarbonate; USDA: Washington, DC, USA, 1954; Volume 939. [Google Scholar]
- Cardinale, B.; Matulich, K.; Hooper, D.; Byrnes, J.; Duffy, E.; Gamfeldt, L.; Balvanera, P.; O’connor, M.; Gonzalez, A. The functional role of producer diversity in ecosystems. Am. J. Bot. 2011, 98, 572–592. [Google Scholar] [CrossRef] [PubMed]
- Chopra, K.; Leemans, R.; Kumar, P.; Simons, H. Ecosystems and Human Well-Being: Policy Responses; Island Press: Washington, DC, USA, 2005; Volume 3. [Google Scholar]
- Quijas, S.; Schmid, B.; Balvanera, P. Plant diversity enhances provision of ecosystem services: A new synthesis. Basic Appl. Ecol. 2010, 11, 582–593. [Google Scholar] [CrossRef]
- Magurran, A.; McGill, B. Biological Diversity: Frontiers in Measurement and Assessment; OUP: Oxford, UK, 2011; pp. 1–151. [Google Scholar]
- Magurran, A. Ecological Divertsity and Its Measurement; Princeton University Press: Princeton, NJ, USA, 1988. [Google Scholar]
- Ferris, R.; Humphrey, J. A review of potential biodiversity indicators for application in British forests. Forestry 1999, 72, 313–328. [Google Scholar] [CrossRef]
- Korboulewsky, N.; Perez, G.; Chauvat, M. How tree diversity affects soil fauna diversity: A review. Soil Biol. Biochem. 2016, 94, 94–106. [Google Scholar] [CrossRef]
- Dinnage, R.; Cadotte, M.; Haddad, N.; Crutsinger, G.; Tilman, D. Diversity of plant evolutionary lineages promotes arthropod diversity. Ecol. Lett. 2012, 15, 1308–1317. [Google Scholar] [CrossRef]
- Scherber, C.; Eisenhauer, N.; Weisser, W.; Schmid, B.; Voigt, W.; Fischer, M.; Schulze, E.; Roscher, C.; Weigelt, A. Bottom-up effects of plant diversity on multitrophic interactions in a biodiversity experiment. Nature 2010, 468, 553–556. [Google Scholar] [CrossRef] [PubMed]
- Isbell, F.; Calcagno, V.; Hector, A.; Connolly, J.; Harpole, W.S.; Reich, P.B.; Scherer-Lorenzen, M.; Schmid, B.; Tilman, D.; Van Ruijven, J. High plant diversity is needed to maintain ecosystem services. Nature 2011, 477, 199–202. [Google Scholar] [CrossRef] [PubMed]
- Hooper, D.; Chapin, F.; Ewel, J.; Hector, A.; Inchausti, P.; Lavorel, S.; Lawton, J.; Lodge, D.; Loreau, M.; Naeem, S. Effects of biodiversity on ecosystem functioning: A consensus of current knowledge. Ecol. Monogr. 2005, 75, 3–35. [Google Scholar] [CrossRef]
- Beech, E.; Rivers, M.; Oldfield, S.; Smith, P. GlobalTreeSearch: The first complete global database of tree species and country distributions. J. Sustain. For. 2017, 36, 454–489. [Google Scholar] [CrossRef]
- Mutke, J.; Barthlott, W. Patterns of vascular plant diversity at continental to global scales. Biol. Skr. 2005, 55, 521–531. [Google Scholar]
- Hobohm, C. Endemism in Vascular Plants; Springer: Flensburg, Germany, 2014. [Google Scholar]
- León-Yánez, S.; Velencia, R.; Pitman, N.; Endara, L.; Ulloa, C.; Navarrete, H. Libro Rojo de las Plantas Endémicas del Ecuador, 2nd ed.; Herbario QCA, Pontificia Universidad Católica del Ecuador: Quito, Ecuador, 2012. [Google Scholar]
- Maestre, F.; Quero, J.; Gotelli, N.; Escudero, A.; Ochoa, V.; Delgado-Baquerizo, M.; García-Gómez, M.; Bowker, M.; Soliveres, S.; Escolar, C. Plant species richness and ecosystem multifunctionality in global drylands. Science 2012, 335, 214–218. [Google Scholar] [CrossRef]
- Hooper, D.; Vitousek, P. Effects of Plant Composition and Diversity on Nutrient Cycling. Ecol. Monogr. 1998, 68, 121–149. [Google Scholar] [CrossRef]
- Stürck, J.; Verburg, P. Multifunctionality at what scale? A landscape multifunctionality assessment for the European Union under conditions of land use change. Landsc. Ecol. 2017, 32, 481–500. [Google Scholar] [CrossRef]
- Finney, D.; Kaye, J. Functional diversity in cover crop polycultures increases multifunctionality of an agricultural system. J. Appl. Ecol. 2017, 54, 509–517. [Google Scholar] [CrossRef]
- Fanin, N.; Gundale, M.; Farrell, M.; Ciobanu, M.; Baldock, J.; Nilsson, M.-C.; Kardol, P.; Wardle, D. Consistent effects of biodiversity loss on multifunctionality across contrasting ecosystems. Nat. Ecol. Evol. 2018, 2, 269–278. [Google Scholar] [CrossRef]
- Gross, N.; Le Bagousse-Pinguet, Y.; Liancourt, P.; Berdugo, M.; Gotelli, N.; Maestre, F. Functional trait diversity maximizes ecosystem multifunctionality. Nat. Ecol. Evol. 2017, 1, 1–9. [Google Scholar] [CrossRef] [PubMed]
- Tresch, S.; Frey, D.; Bayon, R.; Mäder, P.; Stehle, B.; Fliessbach, A.; Moretti, M. Direct and indirect effects of urban gardening on aboveground and belowground diversity influencing soil multifunctionality. Sci. Rep. 2019, 9, 9769. [Google Scholar] [CrossRef] [PubMed]
- Rodríguez-Loinaz, G.; Alday, J.; Onaindia, M. Multiple ecosystem services landscape index: A tool for multifunctional landscapes conservation. J. Environ. Manag. 2015, 147, 152–163. [Google Scholar] [CrossRef] [PubMed]
- Wooldridge, J. Introductory Econometrics: A Modern Approach; Nelson Education: Natorp Boulevard Mason, OH, USA, 2016; p. 900. [Google Scholar]
- Hair, J.; Black, W.; Babin, B.; Anderson, R.; Tatham, R. Multivariate Data Analysis; Pearson Prentice Hall: Upper Saddle River, NJ, USA, 2006; Volume 6. [Google Scholar]
- Midi, H.; Bagheri, A. Robust multicollinearity diagnostic measure in collinear data set. In Proceedings of the 4th International Conference on Applied Mathematics, Simulation, Modeling. World Scientific and Engineering Academy and Society (WSEAS), Selangor, Malaysia, 22 July 2010; pp. 138–142. [Google Scholar]
- Wright, J.; Yavitt, J.; Wurzburger, N.; Turner, B.; Tanner, E.; Sayer, E.; Santiago, L.; Kaspari, M.; Hedin, L.; Harms, K. Potassium, phosphorus, or nitrogen limit root allocation, tree growth, or litter production in a lowland tropical forest. Ecology 2011, 92, 1616–1625. [Google Scholar] [CrossRef]
- Austin, A.; Vitousek, P. Nutrient dynamics on a precipitation gradient in Hawai’i. Oecologia 1998, 113, 519–529. [Google Scholar] [CrossRef]
- Gardi, C.; Angelini, M.; Barceló, S.; Comerma, J.; Cruz Gaistardo, C.; Encina Rojas, A.; Jones, A.; Krasilnikov, P.; Mendonça Santos Brefin, M.; Montanarella, L. Atlas de suelos de América Latina y el Caribe, Comisión Europea; L-2995; Oficina de Publicaciones de la Unión Europea: Luxembourg, 2014; p. 176. [Google Scholar]
- Triviño, M.; Pohjanmies, T.; Mazziotta, A.; Juutinen, A.; Podkopaev, D.; Le Tortorec, E.; Mönkkönen, M. Optimizing management to enhance multifunctionality in a boreal forest landscape. J. Appl. Ecol. 2017, 54, 61–70. [Google Scholar] [CrossRef]
- Putz, F.; Zuidema, A.; Pinard, A.; Boot, G.; Sayer, A.; Sheil, D.; Vanclay, K. Improved Tropical Forest Management for Carbon Retention. PLoS Biol. 2008, 6, e166. [Google Scholar] [CrossRef]
- Bunker, D.; DeClerck, F.; Bradford, J.; Colwell, R.; Perfecto, I.; Phillips, O.; Sankaran, M.; Naeem, S. Species Loss and Aboveground Carbon Storage in a Tropical Forest. Science 2005, 310, 1029–1031. [Google Scholar] [CrossRef]
- Wartenberg, A.; Blaser, W.; Roshetko, J.; Van-Noordwijk, M.; Six, J. Soil fertility and Theobroma cacao growth and productivity under commonly intercropped shade-tree species in Sulawesi, Indonesia. Plant Soil 2020, 453, 87–104. [Google Scholar] [CrossRef]
- Montagnini, F. Accumulation in above-ground biomass and soil storage of mineral nutrients in pure and mixed plantations in a humid tropical lowland. For. Ecol. Manag. 2000, 134, 257–270. [Google Scholar] [CrossRef]
- Caro, T. Conservation by Proxy: Indicator, Umbrella, Keystone, Flagship, and Other Surrogate Species; Island Press: Washington, DC, USA, 2010. [Google Scholar]
- Simberloff, D. Flagships, umbrellas, and keystones: Is single-species management passé in the landscape era? Biol. Conserv. 1998, 83, 247–257. [Google Scholar] [CrossRef]
- Siddig, A.; Ellison, A.; Ochs, A.; Villar-Leeman, C.; Lau, M. How do ecologists select and use indicator species to monitor ecological change? Insights from 14 years of publication in Ecological Indicators. Ecol. Indic. 2016, 60, 223–230. [Google Scholar] [CrossRef]
- UNFCCC. REDD + Safeguards. Available online: https://redd.unfccc.int/fact-sheets/safeguards.html (accessed on 3 May 2020).
- Roopsind, A.; Wortel, V.; Hanoeman, W.; Putz, F. Quantifying uncertainty about forest recovery 32-years after selective logging in Suriname. For. Ecol. Manag. 2017, 391, 246–255. [Google Scholar] [CrossRef]
- Rutishauser, E.; Hérault, B.; Baraloto, C.; Blanc, L.; Descroix, L.; Sotta, E.D.; Ferreira, J.; Kanashiro, M.; Mazzei, L.; d’Oliveira, M. Rapid tree carbon stock recovery in managed Amazonian forests. Curr. Biol. 2015, 25, R787–R788. [Google Scholar] [CrossRef] [PubMed]
- West, T.; Vidal, E.; Putz, F. Forest biomass recovery after conventional and reduced-impact logging in Amazonian Brazil. For. Ecol. Manag. 2014, 314, 59–63. [Google Scholar] [CrossRef]
- Huang, M.; Asner, G. Long-term carbon loss and recovery following selective logging in Amazon forests. Glob. Biogeochem. Cycles 2010, 24, 1–15. [Google Scholar] [CrossRef]
- Putz, F.E.; Zuidema, P.; Synnott, T.; Peña-Claros, M.; Pinard, M.; Sheil, D.; Vanclay, J.; Sist, P.; Gourlet-Fleury, S.; Griscom, B. Sustaining conservation values in selectively logged tropical forests: The attained and the attainable. Conserv. Lett. 2012, 5, 296–303. [Google Scholar] [CrossRef]
- Vidal, E.; West, T.; Putz, F. Recovery of biomass and merchantable timber volumes twenty years after conventional and reduced-impact logging in Amazonian Brazil. For. Ecol. Manag. 2016, 376, 1–8. [Google Scholar] [CrossRef]
- Rist, L.; Shanley, P.; Sunderland, T.; Sheil, D.; Ndoye, O.; Liswanti, N.; Tieguhong, J. The impacts of selective logging on non-timber forest products of livelihood importance. For. Ecol. Manag. 2011, 268, 57–69. [Google Scholar] [CrossRef]
- Bongers, F.; Poorter, L.; Hawthorne, W.; Sheil, D. The intermediate disturbance hypothesis applies to tropical forests, but disturbance contributes little to tree diversity. Ecol. Lett. 2009, 12, 798–805. [Google Scholar] [CrossRef]
- Connell, J. Diversity in tropical rain forests and coral reefs. Science 1978, 199, 1302–1310. [Google Scholar] [CrossRef] [PubMed]
- Molino, J.-F.; Sabatier, D. Tree diversity in tropical rain forests: A validation of the intermediate disturbance hypothesis. Science 2001, 294, 1702–1704. [Google Scholar] [CrossRef] [PubMed]
- Magnusson, W.; Lima, O.; Quintiliano, F.; Higuchi, N.; Ferreira, J. Logging activity and tree regeneration in an Amazonian forest. For. Ecol. Manag. 1999, 113, 67–74. [Google Scholar] [CrossRef]
- Verburg, R.; Van-Eijk-Bos, C. Effects of selective logging on tree diversity, composition and plant functional type patterns in a Bornean rain forest. J. Veg. Sci. 2003, 14, 99–110. [Google Scholar] [CrossRef]
- Martinelli, L.; Almeida, S.; Brown, I.; Moreira, M.; Victoria, R.; Filoso, S.; Ferreira, C.; Thomas, W. Variation in Nutrient Distribution and Potential Nutrient Losses by Selective Logging in a Humid Tropical Forest of Rondonia, Brazil 1. Biotropica 2000, 32, 597–613. [Google Scholar] [CrossRef]
- Dam, O. Forest Filled with Gaps: Effects of Gap Size on Water and Nutrient Cycling in Tropical Rain Forest: A Study in Guyana; Universiteit Utrecht: Utrecht, The Netherlands, 2001. [Google Scholar]
- Olander, L.; Bustamante, M.; Asner, G.; Telles, E.; Prado, Z.; Camargo, P. Surface soil changes following selective logging in an eastern Amazon forest. Earth Interact. 2005, 9, 1–19. [Google Scholar] [CrossRef]
- McNabb, K.; Miller, M.; Lockaby, B.; Stokes, B.; Clawson, R.; Stanturf, J.A.; Silva, J. Selection harvests in Amazonian rainforests: Long-term impacts on soil properties. For. Ecol. Manag. 1997, 93, 153–160. [Google Scholar] [CrossRef]
- Chazdon, R.; Finegan, B.; Capers, R.; Salgado-Negret, B.; Casanoves, F.; Boukili, V.; Norden, N. Composition and Dynamics of Functional Groups of Trees During Tropical Forest Succession in Northeastern Costa Rica. Biotropica 2010, 42, 31–40. [Google Scholar] [CrossRef]
- Martin, P.; Newton, A.; Bullock, J. Carbon pools recover more quickly than plant biodiversity in tropical secondary forests. Proc. R. Soc. B Biol. Sci. 2013, 280, 20132236. [Google Scholar] [CrossRef]
- Mainville, N.; Webb, J.; Lucotte, M.; Davidson, R.; Betancourt, O.; Cueva, E.; Mergler, D. Decrease of soil fertility and release of mercury following deforestation in the Andean Amazon, Napo River Valley, Ecuador. Sci. Total Environ. 2006, 368, 88–98. [Google Scholar] [CrossRef]
- Lal, R. Soil carbon sequestration impacts on global climate change and food security. Science 2004, 304, 1623–1627. [Google Scholar] [CrossRef] [PubMed]
- Murty, D.; Kirschbaum, M.; Mcmurtrie, R.; Mcgilvray, H. Does conversion of forest to agricultural land change soil carbon and nitrogen? A review of the literature. Glob. Chang. Biol. 2002, 8, 105–123. [Google Scholar] [CrossRef]
- Marquez, O.; Hemadez, R.; Torres, A.; Franco, W. Changes in the physicochemical properties of soils in a chronosequence of Tectona grandis plantation. Turrialba 1993, 43, 37–41. [Google Scholar]
- Ferrari, A.; Wall, L. Utilización de árboles fijadores de nitrógeno para la revegetación de suelos degradados. Rev. Fac. Agron. 2004, 105, 2004. [Google Scholar]
- Lojka, B.; Preininger, D.; Van-Damme, P.; Rollo, A.; Banout, J. Use of the Amazonian tree species Inga edulis for soil regeneration and weed control. J. Trop. For. Sci. 2012, 24, 89–101. [Google Scholar]
- Montagnini, F.; Jordan, C. Tropical Forest Ecology. The Basis for Conservation and Management; The Netherlands; Springer: Berlin, Germany, 2005; p. 281. [Google Scholar]
- Fernández-Moya, J.; Alvarado, A.; San-Miguel-Ayanz, A.; Marchamalo-Sacristán, M. Forest nutrition and fertilization in teak (Tectona grandis Lf) plantations in Central America. N. Z. J. For. Sci. 2014, 44, S6. [Google Scholar] [CrossRef]
- Ojeda, T.; Zhunusova, E.; Günter, S.; Dieter, M. Measuring forest and agricultural income in the Ecuadorian lowland rainforest frontiers: Do deforestation and conservation strategies matter? For. Policy Econ. 2020, 111, 102034. [Google Scholar] [CrossRef]
© 2020 by the authors. Licensee MDPI, Basel, Switzerland. This article is an open access article distributed under the terms and conditions of the Creative Commons Attribution (CC BY) license (http://creativecommons.org/licenses/by/4.0/).