Article

Impacts of Layoffs and Government Assistance on Mental Health during COVID-19: An Evidence-Based Study of the United States

1
Shanghai Academy of Social Sciences, Shanghai 200020, China
2
School of Economics, Fudan University, Shanghai 200433, China
3
The Development Research Center of Shanghai Municipal People’s Government, Shanghai 200003, China
4
Graduate School of Design, Harvard University, Cambridge, MA 02138, USA
5
T.H. Chan School of Public Health, Harvard University, Boston, MA 02115, USA
*
Author to whom correspondence should be addressed.
Sustainability 2020, 12(18), 7763; https://doi.org/10.3390/su12187763
Submission received: 9 August 2020 / Revised: 17 September 2020 / Accepted: 18 September 2020 / Published: 20 September 2020
(This article belongs to the Special Issue Working during the COVID-19 Global Pandemic)

Abstract

:
This study evaluates the impact of unemployment and government financial assistance during the COVID-19 pandemic on the working-age population’s mental health and further examines the differential impacts between urban and non-urban groups, as well as African American (AA) and non-African American groups. Based on the COVID-19 Household Impact Survey, four measures of mental health conditions (nervous, depressed, lonely, and hopeless) are constructed. Our empirical analysis applies the ordinal regression model (ordered logit model) that takes both the week and regional factors into consideration to control for potential time effects and time-invariant confounders varying across regions. The results show that government aid only mitigates the psychological symptoms for the group in non-urban areas, with no significant impacts on the urban group. On the other hand, the AA working-age group experiences similar or more favorable mental health than other ethnic groups, while government aid does not alleviate the mental pressure for the AA group. Therefore, government interventions should recognize the heterogeneity of impacts on socioeconomic groups within the target population.

1. Introduction

The COVID-19 pandemic has profoundly changed our daily lives in many ways—including shops closed, airlines suspended, and streets turned empty. In response to this global challenge, quarantine and lockdown have been widely used by governmental entities to prevent infection. Although effective in containing the virus, the economic devastation of lockdown has caused a drastic surge of unemployment. The Bureau of Labor Statistics estimates that the U.S. economy lost more than 20 million jobs in March and April (about one-seventh of the total number of people employed in February). This raised the unemployment rate in the U.S. to a historical high of 14.7% in April 2020. Beyond the direct financial losses brought by unemployment to individuals, the often overlooked yet more profound impact of unemployment during COVID-19 is on the population’s mental health. A large body of literature suggests that there is a negative correlation between COVID-19 and mental health status. These quantitative studies report a high prevalence of psychological distress and disorder [1,2], including anxiety and depression [3]. Worsening population’s mental health could lead to long-term post-traumatic stress symptoms, such as drug addiction, alcoholism, and suicide, that could harm both individuals and society [4,5,6,7,8,9]. Meanwhile, although government assistance aims at ameliorating the financial hardship, the actual outcomes might be unknown. Therefore, the adverse effects of unemployment and the unknown results of government aid demand more research into this field.
However, existing studies only test the general correlations between COVID-19 and mental health, not giving enough attention to the specific stressors from different perspectives. The literature suggests that, in general, stressors for mental issues could include having inadequate supplies, financial losses [10], and concerns about one’s own health and that of their loved ones (particularly elderly or ones who suffer from any physical illness) [11], all of which can generate or exacerbate fear, depression, and anxiety [12]. But the effects of unemployment during COVID-19 have not yet been widely examined, while only a group of work has investigated the impact of unemployment on mental health during economic recessions, which is similar to the current situation during COVID-19. These studies provide empirical evidence that people who were unemployed experienced more distress than people who had a job [13,14,15,16]. There are a number of pathways through which unemployment affects the mental well-being of the labor force. The direct effect of unemployment relates to the financial difficulties from losing income [16,17,18,19]. The indirect effect could be the loss of latent social support [20], such as social status, social contact, and opportunity for control [21,22], which are caused by removing work-based social networks [23,24,25]. Social network theory suggests that these psychological assets can be attributed to “social capital” [26], which is the enabling mechanism for social participation [27]. Deprivation of social capital can reduce people’s resilience to mental conditions [28]. Therefore, the financial losses, together with the social losses, increase material and psychosocial stress, particularly for individuals in the labor force.
At the same time, financial aid packages, such as the Coronavirus stimulus checks from the Trump administration, were handed out with the hope of ameliorating the economic hardship for those affected by COVID-19. As of 24 June 2020, the IRS has sent over $159 million total in stimulus checks. As mental issues related to unemployment are caused by both financial and social capital losses, the actual effects of this aid might still be unknown. Using data on web searches from Google Insights for Search, one study found that although a negative relationship between initial unemployment insurance claims and the search indexes for “depression” and “anxiety” was suggested, an extended period of higher levels of unemployment insurance claims is associated with a higher depression search index [29]. This implies that government aid, while addressing the population’s mental stress in the short run, may cause a surge of mental health difficulties in the long run. Therefore, the government ought to reevaluate its initial intentions and the eventual outcomes of the aid interventions. Through applying the latest individual-level data, we present an analysis of the rather multi-faceted interactive impacts of both unemployment and government aid packages on the population’s mental health status.
In conducting this analysis, it is important to understand the heterogeneity of psychological vulnerability to unemployment between various population groups. One potential difference is between urban and non-urban (peri-urban and rural) groups caused by the accessibility to social capital. Higher social capital and the resulting social participation have protective effects on depressive symptoms [30,31]. However, non-urban populations possess less social capital compared to the urban population [32]. Several empirical studies show that depressive symptoms are significantly higher among older adults residing in rural areas than among older adults in urban areas [33,34,35]. However, a limitation of these studies is that they focus on the elderly population because they are usually retired and are more prone to mental issues resulting from deprivation of social capital. Since the pandemic is an equal threat to all population groups, the differential impact on urban and non-urban individuals should be acknowledged.
Another possible difference in effects could be among ethnic groups, which we categorize in this paper as African American (AA) and non-African American (non-AA) groups. This division is purely derived from previous empirical research to give sensitivity to our empirical analyses. Research found that although African Americans have relatively disadvantaged social status, they enjoy similar or more favorable mental health outcomes than whites, which is an unexpected pattern [36]. One study in particular argues that social support was the key determinant [37]. The empirical analyses in this paper also find a significantly higher psychological resilience to mental difficulties for the AA group, which is a caveat that we will later discuss.
Taking all these factors into consideration, this empirical study evaluates the impact of unemployment and government financial aid during COVID-19 on the working-age population’s mental health. Our paper, based on existing literature, has the following hypotheses:
(1)
Layoffs could deteriorate the population’s mental health through causing financial difficulties and loss of latent social capital.
(2)
Government assistance, although designed to address the financial hardship, might not relieve or may even increase the psychological pressure, therefore, its actual effect awaits an empirical analysis.
(3)
Since, in general, urban residents usually possess more latent social capital than rural residents, urban residents might suffer a greater loss of mental well-being during the quarantine due to COVID-19.
(4)
Following the findings of the existing literature, we assume that the AA community might show stronger resilience to mental adversity comparing to other ethnic groups during COVID-19.

2. Materials and Methods

2.1. Data Source

The data source of this study is the COVID-19 Household Impact Survey, which is a philanthropic project funded by the Data Foundation and conducted by the National Opinion Research Center (NORC) at the University of Chicago [38]. The survey was originally based on a proposal developed by the Federal Reserve Bank of Minneapolis and further applied by advisors to the COVID-19 Household Impact Survey project. It includes three core modules—physical health, social and mental health, and economic and financial health. For the physical health module, specific questions include symptoms related to COVID-19, relevant existing conditions, and health insurance coverage. In the social and mental health module, questions for survey respondents are designed to align with the current population survey, focusing on communication with friends and family, volunteerism, and anxiety. The last module on economic and financial health prioritizes questions about government cash assistance, employment, and food security. In addition to these modules, the survey also collects important demographic characteristics, such as age, gender, race, and household income.
The survey targets two types of samples: a nationally representative sample of adults aged 18 and above in the United States and a regional representative sample of adults aged 18 and older living in 18 different geographic areas, including 10 states and eight metropolitan statistical areas (MSAs). These states include California, Colorado, Florida, Louisiana, Minnesota, Missouri, Montana, New York, Oregon, and Texas; and the MSAs include Atlanta-Sandy Springs-Alpharetta, Georgia; Baltimore-Columbia-Towson, Maryland; Birmingham-Hoover, Alabama; Chicago-Naperville-Elgin, Illinois-Indiana-Wisconsin; Cleveland-Elyria, Ohio; Columbus, Ohio; Phoenix-Mesa-Chandler, Arizona; Pittsburgh, Pennsylvania. Accordingly, two sampling techniques are applied: AmeriSpeak (a probability-based panel designed to be representative of the U.S. household population) and multi-mode address-based sample (ABS, which is a sampling frame based on an extract of the U.S. Postal Service delivery sequence file). The field reports on the COVID Impact Survey official website provide details on both techniques (https://www.covid-impact.org/results).
As of June, three waves of the samples have been collected and made available with survey field periods of 20–26 April, 4–10 May, and 30 May 30–8 June. These samples contain 25,269 observations with completed interviews, which consist of 92.64% (23,408) web interviews and 7.36% (1861) phone interviews. Among them, 74.38% (18,794) are sampled through the ABS approach and 25.62% (6475) are sampled through the AmeriSpeak approach.

2.2. Working-Age Employee

Prior quantitative studies examining the impact of unemployment on mental health focus on the elderly population. But during a global pandemic like COVID-19, the working-age population can be particularly vulnerable to unemployment. This is because it could change their life pattern by lowering their financial income and social capital. The resulting psychological shock could be greater for the working-age population than other groups. As a result, this analysis focuses on the working-age population in the United States. After filtering the raw sample, all three waves in the survey provided 8782 non-retired, non-self-employed working individuals aged 18 and above within specified geographic areas. These individuals had not been diagnosed with mental health conditions before, had not been infected with or recovered from COVID-19, had not been isolated due to exposure to COVID-19, and had not lived with someone infected by the virus. None of the sampled individuals felt hot, feverish, chilly, cold, had bad chills, or sweated more than usual in the 7 days prior to the interview. To identify the impact of being laid off, we dropped individuals who had not worked any hours prior to 1 March 2020 (when COVID-19 began spreading in the U.S.).

2.3. Mental Health

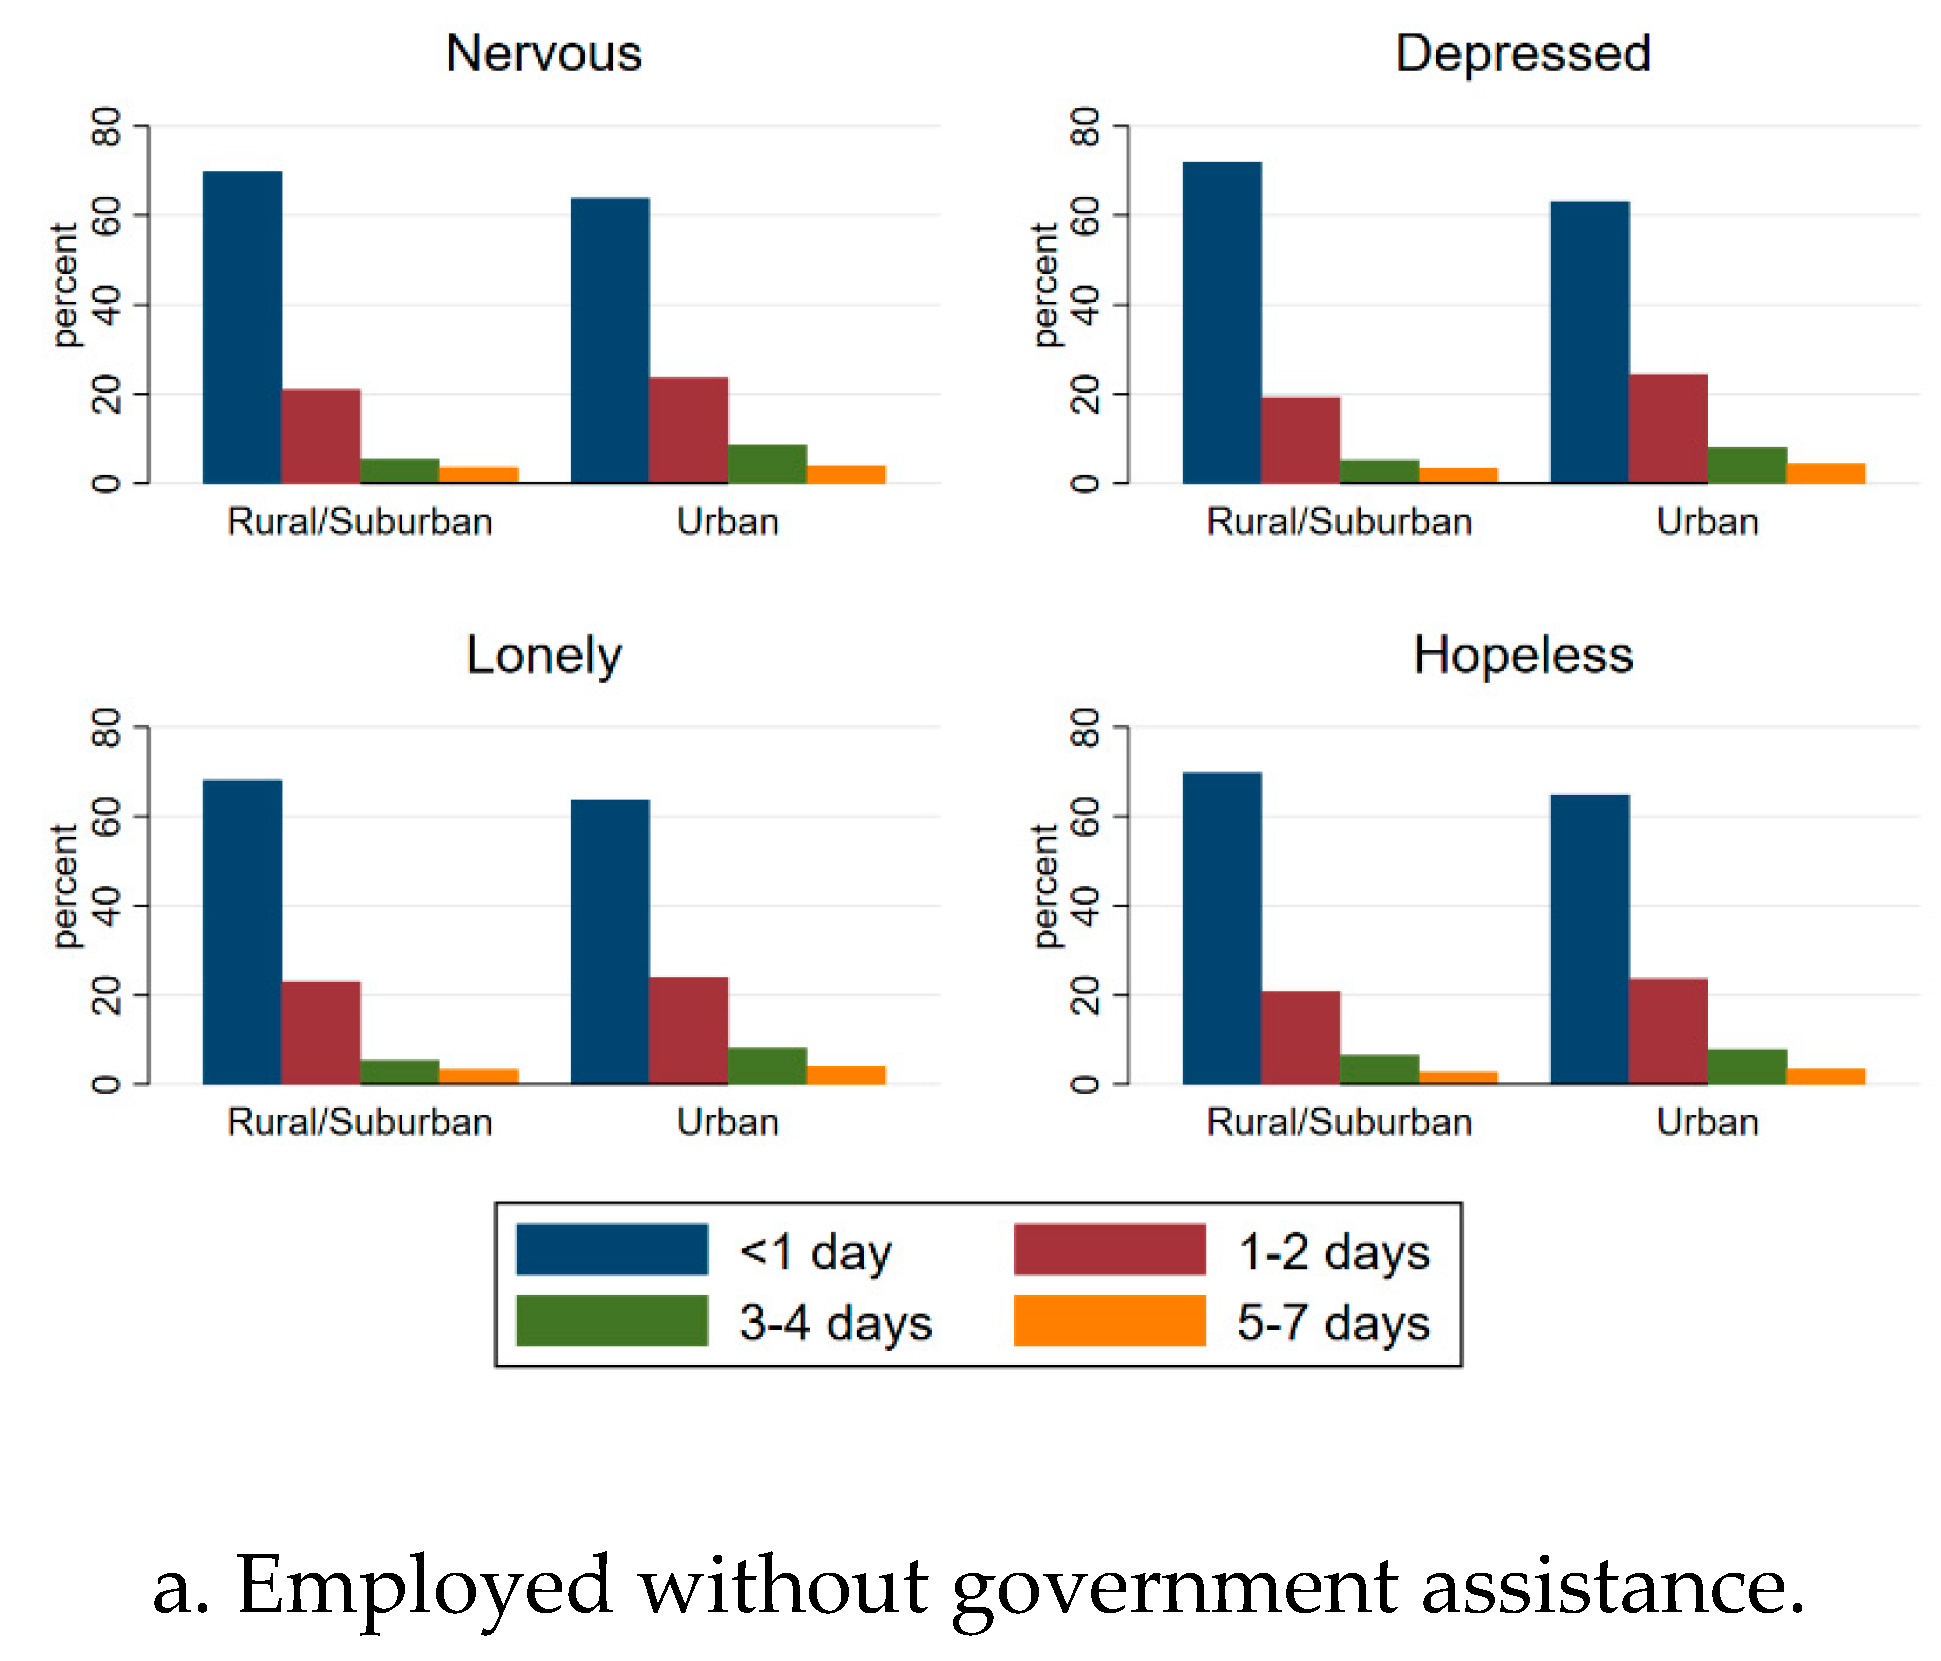
We construct four measures of mental health conditions based on the survey question SOC5: “In the past 7 days, how often have you felt nervous, depressed, lonely, and hopeless”. More specifically, interviewees were asked to report the frequency of feeling those four emotions in the 7 days prior to the survey field period. The responses range between not at all or less than 1 day, 1–2 days, 3–4 days, and 5–7 days. Out of the 8782 working-age population observations, 64% of the interviewees did not have the symptoms at all or experienced them for less than 1 day, 23% had them for 1–2 days, 8.1–8.35% had them for 3–4 days, and 4.06–4.58% had them for 5–7 days. Figure 1 illustrates the distributions of the four specific symptoms.

2.4. Covariates

We compile 10 covariates that are indexed at the individual and regional levels. The four major independent variables include: whether under an involuntary layoff, whether receiving any form of government assistance (such as unemployment insurance, a supplemental nutrition assistance program, temporary assistance for a needy family, social security, supplemental social security, Medicaid, Medicare, and other government aid), whether residing in an urban or non-urban area, and whether belonging to the African American community. The other six control variables include general self-rated health (ranging from excellent, very good, good, fair, to poor), age categories (18–22, 23–64, 65+), gender, household income, education, and marital status.

2.5. Statistical Analysis

Our statistical analysis uses an ordinal regression model (ordered logit model) that considers both the week and regional factors. This model appropriately captures the ordinal frequency of the four mental health condition measures, reflected by the number of days that interviewees felt nervous, depressed, lonely, or hopeless during the outbreak of COVID-19. By adding both week and regional factors, we can account for the potential time effects and time-invariant confounders that only vary across regions. The time effect should be controlled in the statistical analyses because, according to the CDC (Centers for Disease Control and Prevention: Learn About Mental Health---Can your mental health change over time? Retrieved from: https://www.cdc.gov/mentalhealth/learn/index.htm#:~:text=Yes%2C%20it’s%20important%20to%20remember,mental%20health%20could%20be%20impacted), a person’s mental health can change over time, depending on many factors, such as extra pressure, like the outbreak of COVID-19 or worrying about job security, which could cause a change in mental well-being over time. Standard errors are clustered at the regional level.

3. Results

Table 1, Table 2 and Table 3 contain descriptive statistics summarizing the responses for the frequency of the four mental health symptoms—feeling nervous, depressed, lonely, and hopeless—among different groups. Table 1 summarizes the frequency of these emotions among four groups of the working-age population—employed without government assistance, employed with government assistance, laid off without assistance, and laid off with assistance. Table 2 summarizes the frequencies by the urban and non-urban groups, while Table 3 summarizes the frequencies by the AA and non-AA groups.
The descriptive data in Table 1 suggests that the unemployed group tends to experience a higher frequency of the four symptoms compared to the employed group. This table also reveals that government assistance might alleviate these negative feelings for both the employed and unemployed working-age populations. Table 2 suggests that the urban population generally tends to experience these mental health issues more frequently than the non-urban population. Furthermore, Table 3 suggests that the AA group tends to feel nervous, depressed, lonely, and hopeless less often than the non-AA group.
This correlational evidence demonstrates the phenomena in which this paper is interested. The following empirical exercises test the impact of layoffs and government, through interaction with assistance, on the frequencies of these symptoms. This study also highlights the differences of these effects on the urban and non-urban and AA and non-AA groups. Interestingly, the analytical findings contradict some of the raw correlations in the descriptive data.

3.1. Impacts of Layoffs and Government Assistance

The estimates in Table 4 are from the baseline model of the association between the 10 covariates and mental health conditions. Consistent with existing studies on the impact of unemployment on mental health conditions, individuals who are involuntarily laid off have a higher frequency of feeling nervous, lonely, and hopeless. However, government financial assistance does not ameliorate the mental health conditions of the working-age population and might even make them feel more hopeless. This result counteracts the finding from the descriptive data. The working-age population residing in urban areas has a significantly higher frequency of feeling all four conditions compared to those in non-urban areas. Compared to other ethnic groups, the AA group reports experiencing less of the four conditions.
One potential identification problem is that the working-age population that is involuntarily laid off could be more eager to apply for financial assistance. Furthermore, this group might even have a greater probability of actually receiving the aid. This would produce a composite effect on mental health from both being laid off and receiving assistance. Thus, to identify this effect, we estimate a model in Table 5 with an interaction term between layoffs and financial assistance. Using the currently employed working-age population who did not receive government assistance as a control group, the results suggest three points: (1) the currently employed working-age population receiving government assistance has a higher frequency of feeling depressed and hopeless; (2) the currently unemployed working-age population without assistance has a greater frequency of feeling depressed, lonely, and hopeless; (3) the currently unemployed working-age population with assistance has a higher frequency of feeling nervous, lonely, and hopeless.

3.2. Urban and Non-Urban Difference

As suggested in the baseline model, there is a significant difference between the results for the urban and non-urban areas. In order to further explore these distinctions, we estimate the ordered logit model for each group separately in Table 6 and Table 7. The results are discussed under three circumstances: (1) for the currently employed working-age population with assistance, if residing in non-urban areas, there is no significant effect of having either a higher or lower frequency of mental health conditions compared to the currently employed working-age population without government assistance. However, those who live in urban areas experience a higher frequency of feeling depressed and hopeless; (2) for the currently unemployed working-age population without government assistance, those residing in urban areas experience more days of feeling lonely, while their non-urban counterparts have a higher frequency of feeling nervous, depressed, and lonely; (3) for the currently unemployed working-age population with government assistance residing in non-urban areas, there is no significant difference in mental health conditions from the currently employed working-age population without government assistance. However, for those residing in urban areas, the frequency of feeling nervous, lonely, and hopeless is significantly higher.
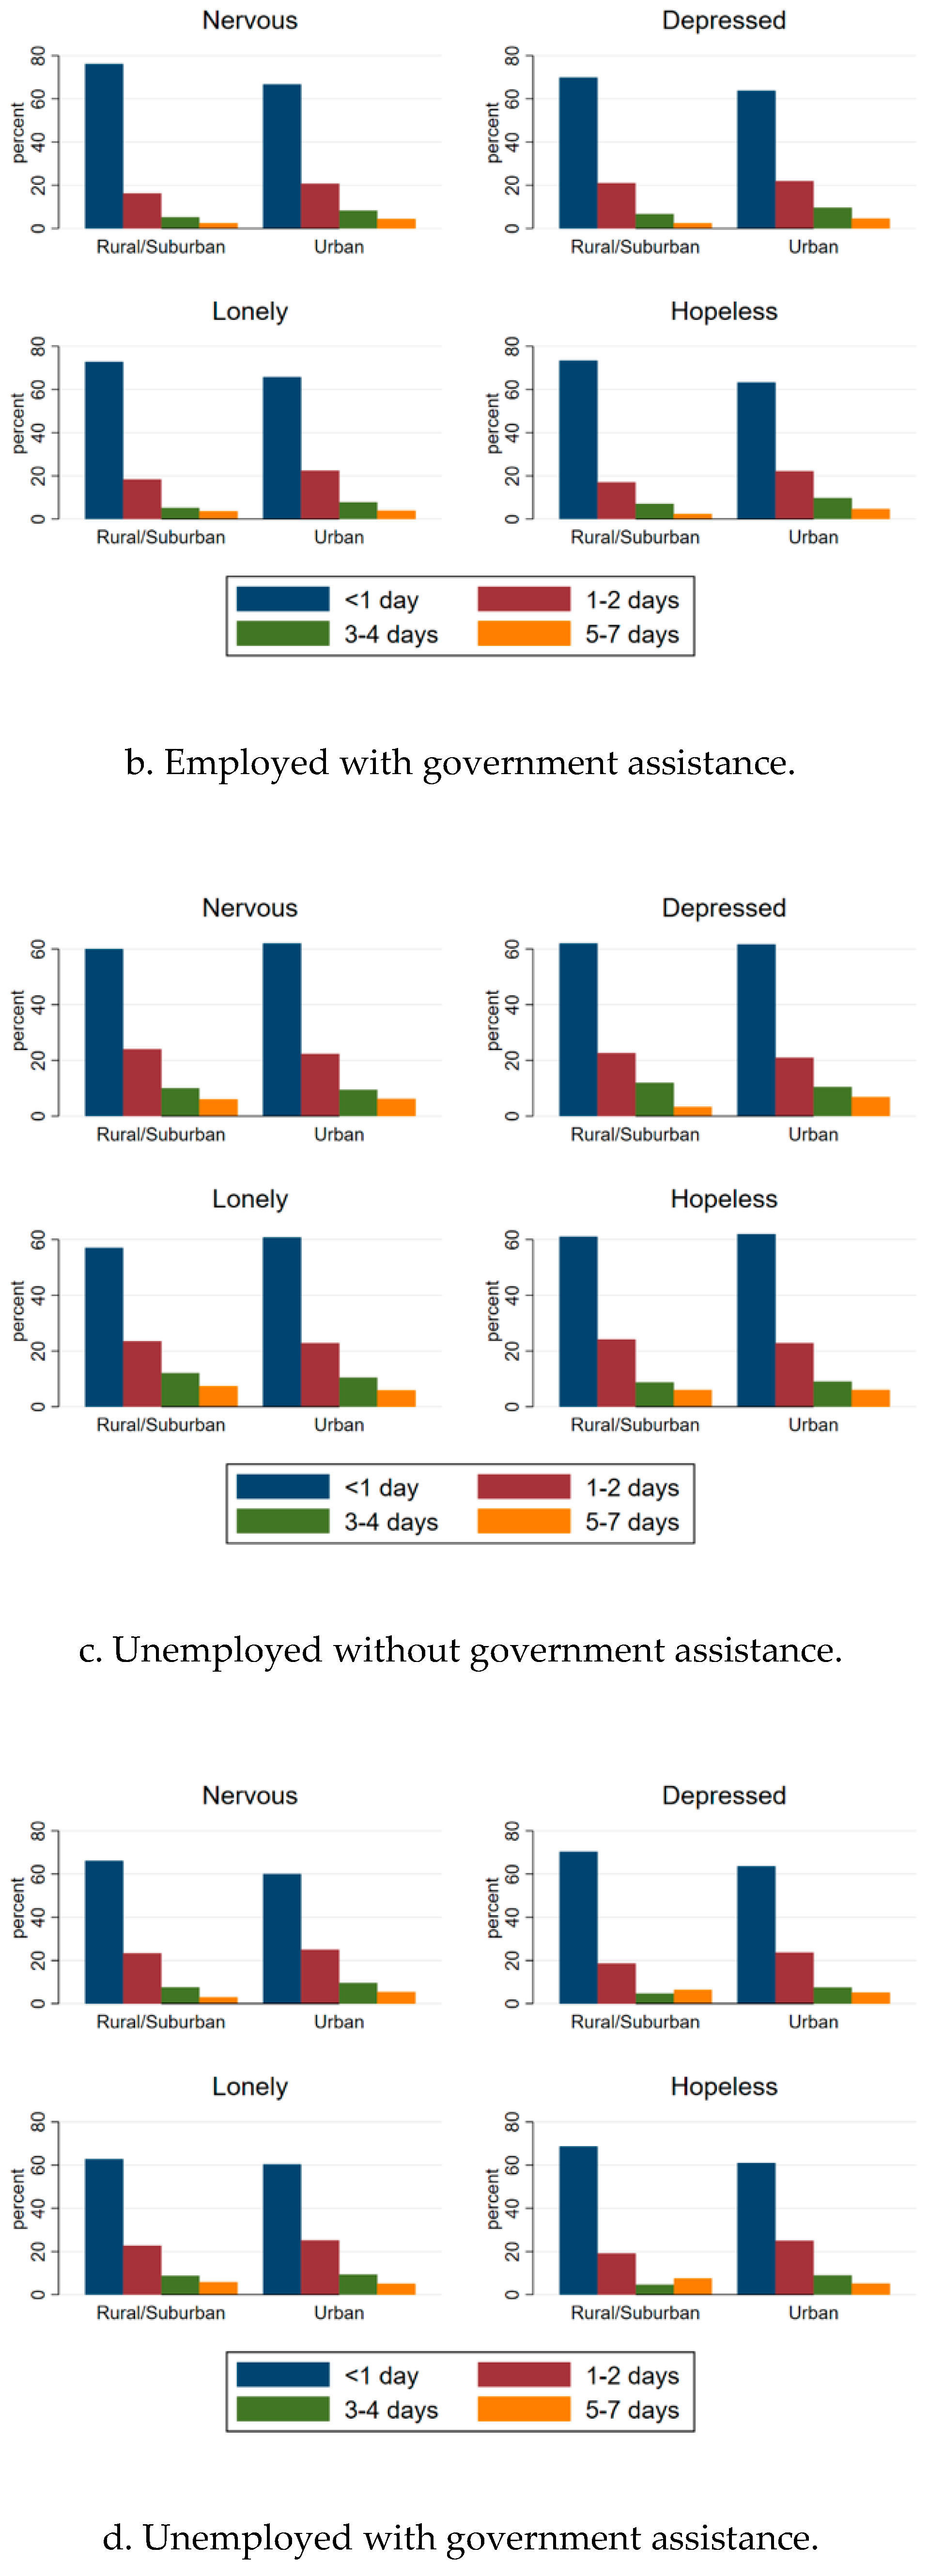
 Figure A1 in Appendix A illustrates the frequency of these emotions between the urban and non-urban groups, stratified by the laid-off and financial assistance groups.

3.3. AA and Non-AA Difference

From the baseline model, the AA group shows a much better resilience to mental health conditions than other ethnic groups, as shown by their lower frequency of the four symptoms. To further analyze the difference across the AA and non-AA communities, we estimate an ordinal regression model stratified by ethnic groups. The findings are summarized in Table 8 and Table 9. Using the currently employed working-age population without government assistance as a control group, the analysis provides a few interesting results: (1) both the AA and non-AA currently employed working-age populations with government assistance show no significantly higher or lower frequency of the four symptoms; (2) for the currently unemployed working-age population without government assistance, there is no significant difference from the control group for the AA community, while the non-AA community experiences feeling lonely and hopeless significantly more often; (3) within the currently unemployed working-age population with government assistance, the AA community feels nervous and hopeless on more days, while the non-AA community experiences more days of feeling nervous, lonely, and hopeless.
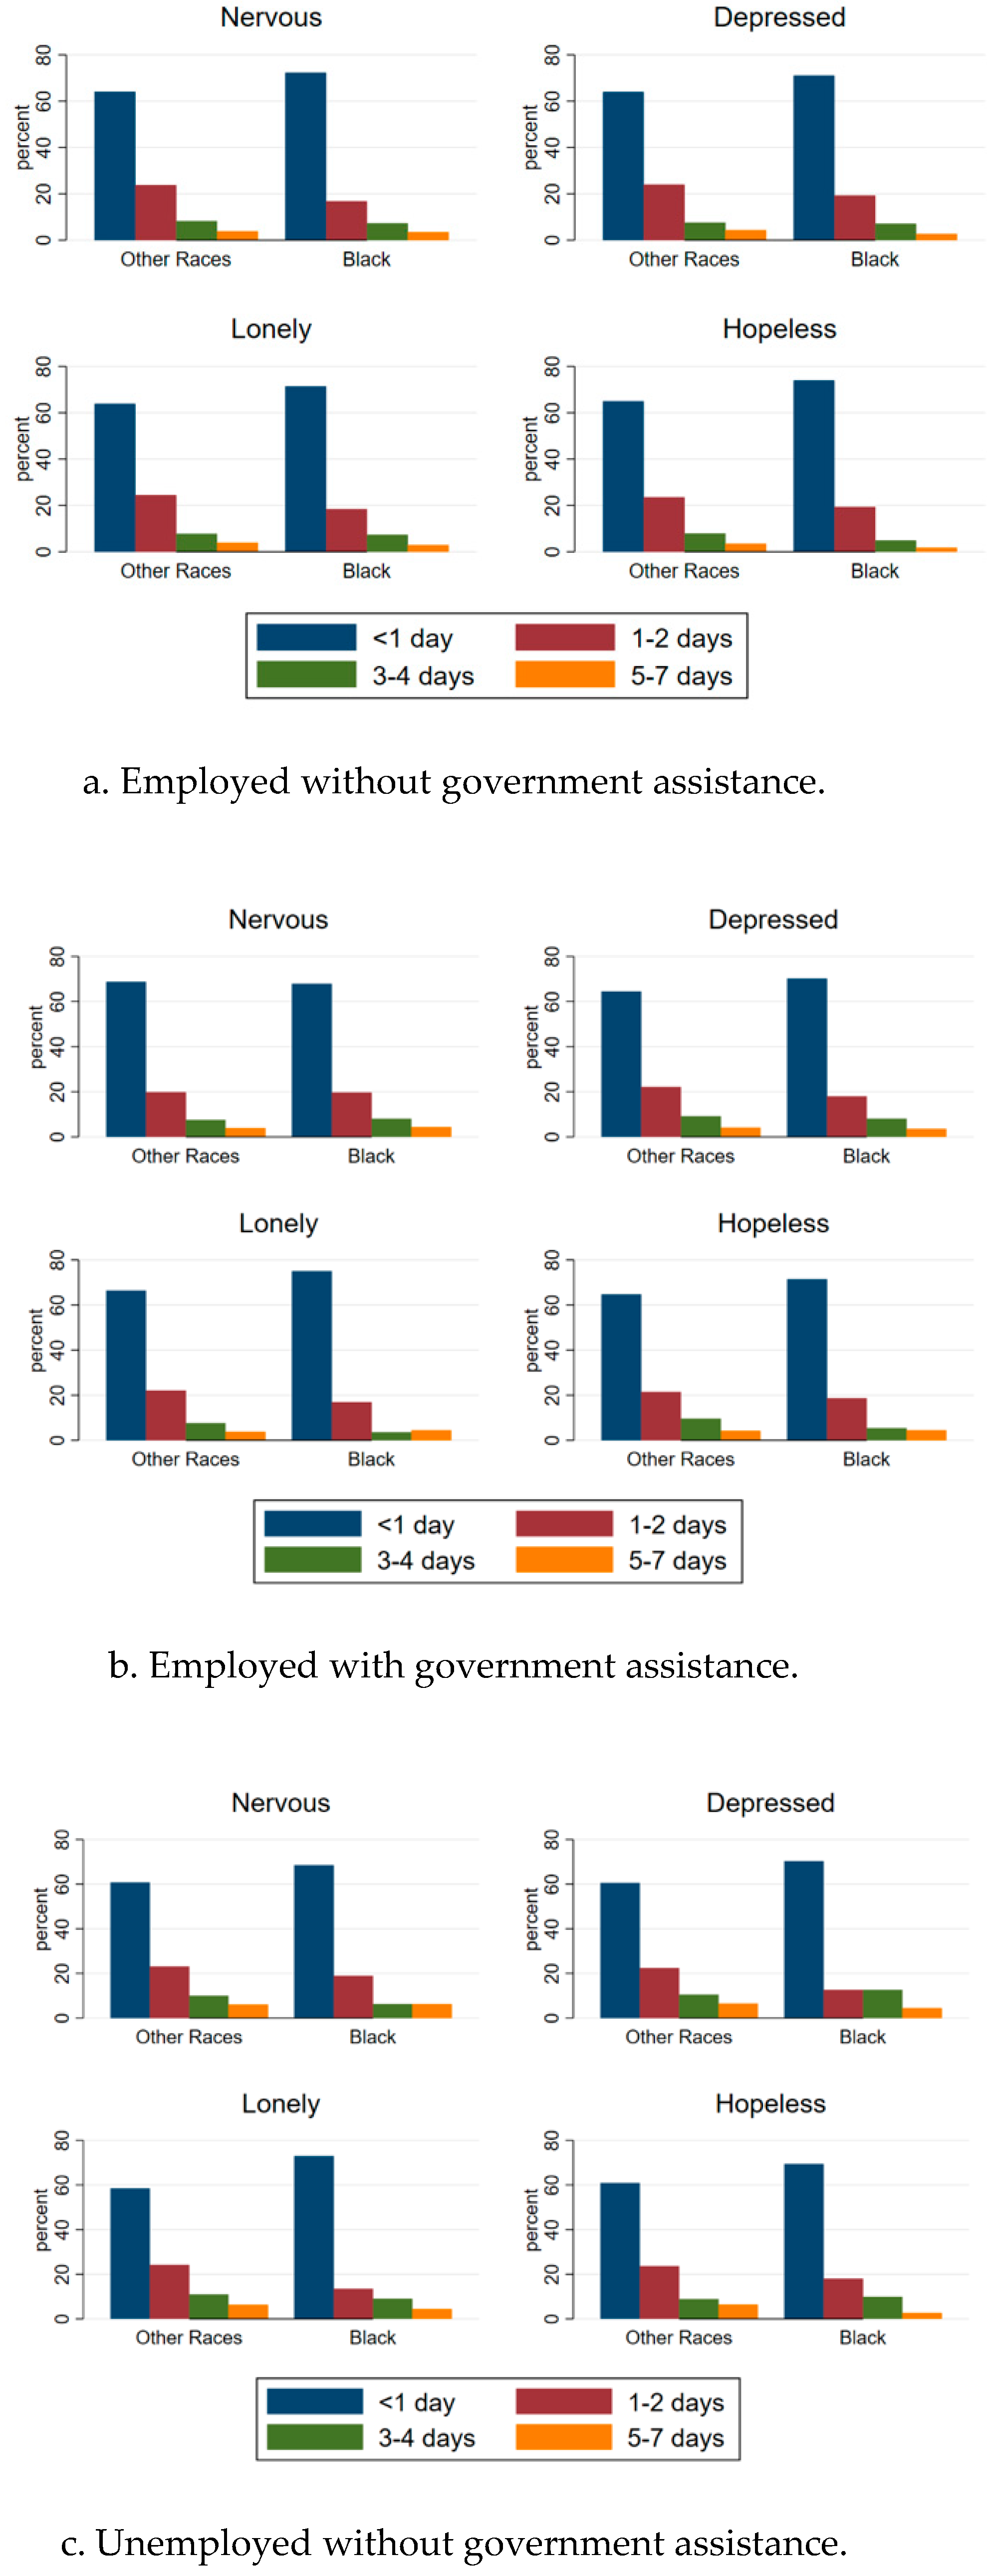
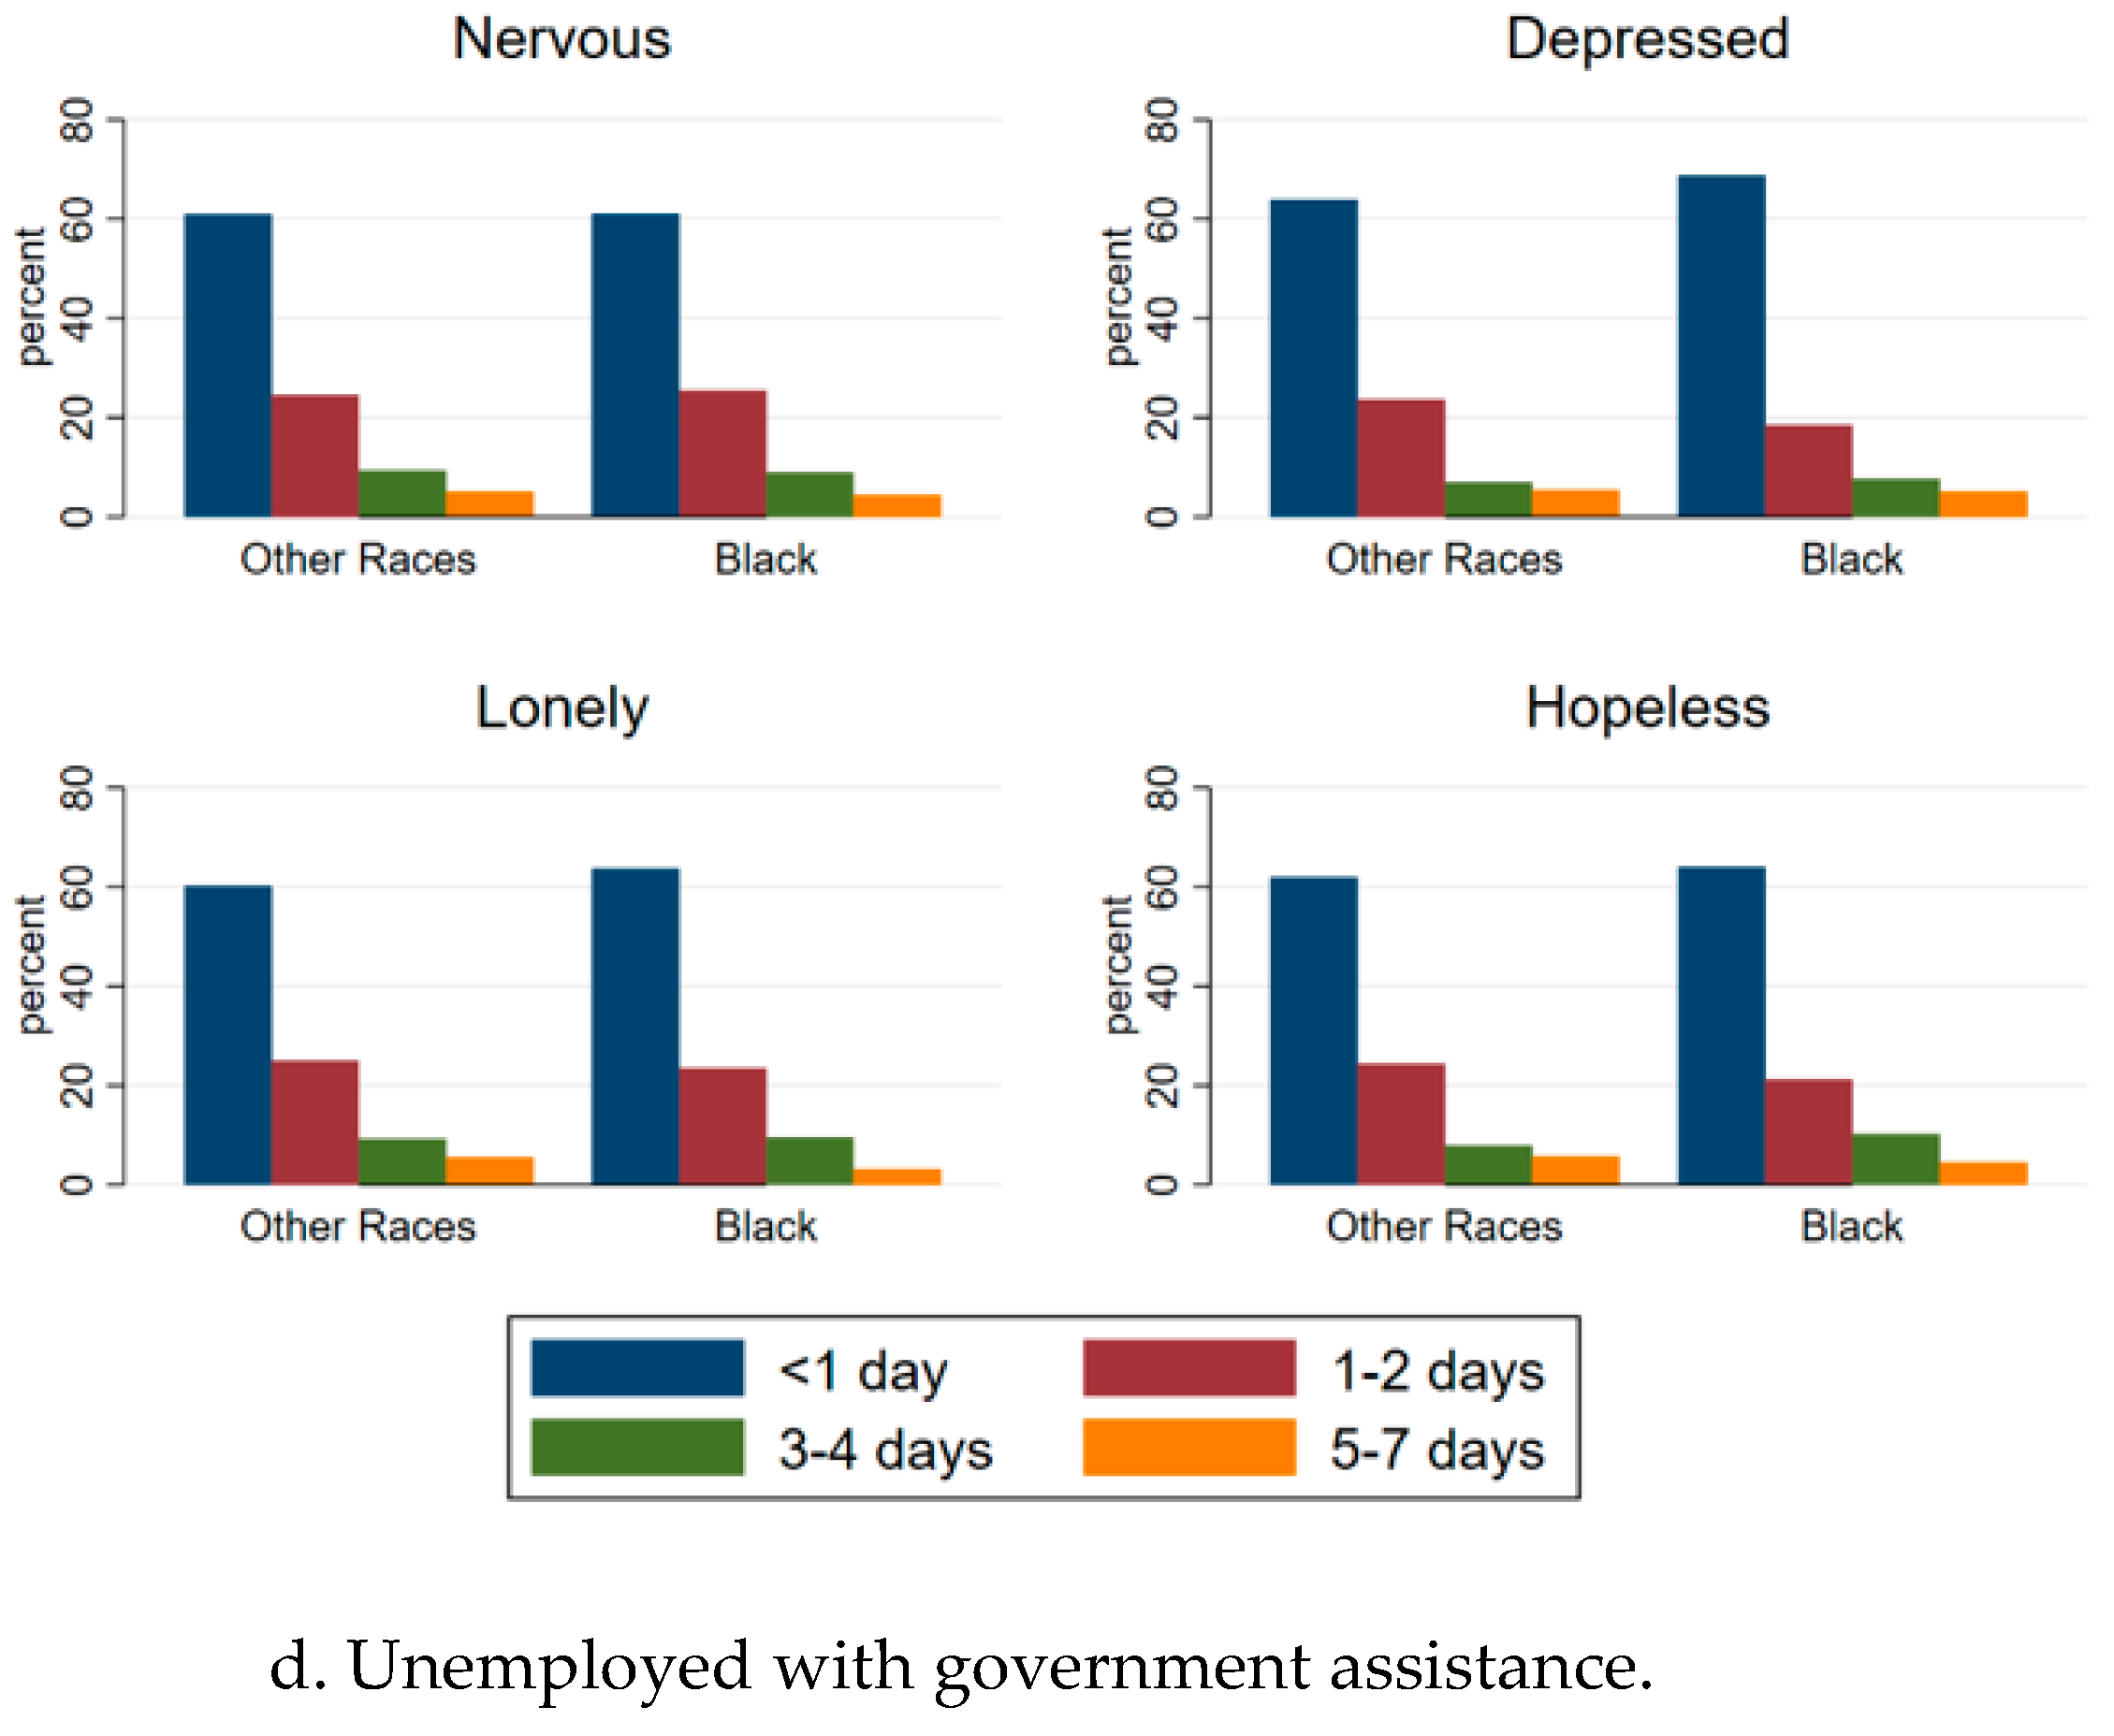
 Figure A2 in Appendix A illustrates the frequency of these symptoms for the AA and non-AA groups, stratified by the laid-off and financial assistance groups.

4. Discussion

We think that the most intriguing empirical findings are the different impacts of unemployment and government aid on various socio-economic groups within the sampled population. One existing study finds that the adverse impact of unemployment on mental health is stronger for those with high social support or a low previous wage [39]. This paper identifies the differences between both the urban and non-urban groups and the AA and non-AA groups.
The results show that the urban population is psychologically more vulnerable to unemployment compared to their non-urban counterparts. However, government aid only mitigates the psychological symptoms for the working-age population residing in non-urban areas and has no significant impact on the urban group. Although previous studies argue that the non-urban population possesses less social capital and is therefore less resilient to psychological conditions, this empirical study suggests a different conclusion. Table 10 shows that the lifestyle changes caused by restrictions between the urban and non-urban groups are similar, meaning that the impact of social capital and social participation for both groups is similar. The vulnerability of the urban population to psychological symptoms might be caused by their voluntary decision to take the pandemic more seriously compared to their non-urban counterparts. Table 11 shows that the urban population tends to take more measures against coronavirus compared to the non-urban population. Furthermore, urban areas usually encompass higher density and less green space, which may exacerbate anxiety and depression during quarantine. More research could examine whether more green and open space could help in ameliorating mental distress during COVID-19 lockdowns.
We find that the AA community is psychologically more resilient to unemployment shocks compared to the non-AA group, while government aid does not alleviate the mental pressure for the AA group. In fact, the aid leads to the deterioration of their mental health. Similarly, the government aid does not improve the symptoms of the non-AA group. As previously stated, the AA group experiences similar or more favorable mental health compared to other races, which is an unexpected pattern given their relatively disadvantaged social status. This pattern is also demonstrated in the results from the empirical analyses. Table 12 shows that although there is a more significant lifestyle change for the AA group, particularly for those who might have more connections with workplaces, the ethnic groups tend to take similar numbers of measures against coronavirus (as shown in Table 13). Under the significant lifestyle change, the AA group is more resilient to the four psychological conditions. However, the reason still remains controversial. Previous research tried to explain the higher resilience of the AA community to mental health conditions through higher levels of religious involvement [39], but the quantitative study did not prove that more intensive religious involvement is associated with better mental health. Deriving from the social network and social capital arguments, we could expect that the higher resilience is a result of closer social networks and therefore higher social capital within their community. Therefore, future research effort is required here to further explain this phenomenon.

5. Conclusions

Our literature research lays the theoretical mechanism through which layoffs and government assistance could affect the population’s mental health during COVID-19. Layoffs could not only remove one’s income from a financial perspective, but also deprive an employee of a work-related social network, reducing social capital. Government assistance, while designed to alleviate the financial hardship caused by layoffs, might not address the target population’s psychological needs, therefore, the actual outcome could be unknown. Combining all of the findings, this paper can help policy-makers reevaluate the heterogenous impact of unemployment and government interventions on different socio-economic groups.
This research makes a contribution to the existing literature from two perspectives. Firstly, the empirical analyses suggest that government aid alone is insufficient in addressing the population’s mental health. In fact, government assistance might even adversely deteriorate mental health. Therefore, the government should implement policy bundles that address the latent psychological symptoms of the target population. Secondly, we found that the non-urban population is more resilient to these mental stressors than the urban population, while the AA population is more resilient to these mental difficulties than the non-AA population. These contributions could help policy-makers better target public policy interventions while future research could target the mechanisms that cause the urban and non-urban, as well as AA and non-AA, differences.
As for policy recommendations, it is vital that the government pays more attention to mental health problems, especially depression and anxiety, among the general population, while also combating the “infodemic” of public health emergencies. The government or health officials sending mixed messages can lead to public confusion, uncertainty, and fear [40], which might bring further social consequences, such as increasing negative attitudes toward foreign groups most affected by the pandemic [41]. The official public campaigns aiming at mitigating the psychological impact of pandemics should consider the mechanism that modulates the influence of an individual’s perception about COVID-19 on their subjective well-being or life satisfaction [42]. Anxiety might arise from fear of contagion and inadequate clarity around social distancing guidelines, often made worse by less reliable media sources heightening this confusion and fear-mongering [1]. One empirical study shows that there is a high prevalence of mental health problems positively associated with frequent social media exposure during the COVID-19 outbreak [43]. A calibrated level of social participation among the population can help ameliorate these mental issues. One study suggests that social participation interventions can increase an individual’s social networks, thus building up resilience toward psychological symptoms [44]. In addition, establishing psychological first aid interventions, which has been fulfilled within an Italian university public hospital, may help mental health professionals and promote health and individual and community resilience [45]. Furthermore, the mental well-being of health care workers who are on the front lines responding to COVID-19 is also a very important dimension [46], which needs the specific attention of the government to protect them from secondary trauma, like applying hardiness and coping strategies to stop unpleasant emotions and thoughts [47]. These interventions could either be government led or community led, as long as the essential public health standards, such as social distancing or limited capacity, are ensured.

Author Contributions

Both authors H.F. and X.N. contributed equally and have read and agreed to the published version of the manuscript.

Funding

This research was supported by the Key Program of the National Natural Science Foundation of China (Grant No. 71933001).

Acknowledgments

Both authors acknowledge the Data Foundation for funding the COVID Impact Survey and NORC at the University of Chicago for conducting the survey, and their generosity of sharing these data. We also give thanks to Sarah Wilson for editing and proofreading our paper, and very grateful to the assistant editor (Jeffery Wang) and academic editor as well as three anonymous referees for their valuable comments.

Conflicts of Interest

The authors declare no conflict of interest.

Appendix A

Figure A1. Mental health condition distributions for groups with different combinations of employment status and government assistance across urban and non-urban areas.
Sustainability 12 07763 g0a1aSustainability 12 07763 g0a1b
Figure A2. Mental health condition distributions for groups with different combinations of employment status and government assistance for AA and non-AA working-age populations.
Sustainability 12 07763 g0a2aSustainability 12 07763 g0a2b
Note-1: Restrictions are from question ECON8 “In the past 7 days, have your personal plans been changed or affected by the following types of restrictions, or not?”, including a ban on gatherings of 250 people or more, a ban on gatherings of 50 people or more, a ban on gatherings of 10 people or more, the closure of other businesses, the closure of work, work from home requirements, quarantine requirements, or stay-at-home orders. These restrictions are identified because of their linkage to influencing the population’s connections to social participation and social capital embedded in their workplaces.
Note-2: The measures are from question PHYS2 “which of the following measures, if any, are you taking in response to the coronavirus?”, including canceled doctor appointment; worn a face mask; visited a doctor or hospital; canceled or postponed work activities; canceled or postponed school activities; canceled or postponed dentist or other appointments; canceled outside housekeepers or caregivers; avoided some or all restaurants; worked from home; studied at home; canceled or postponed pleasure, social, or recreational activities; stockpiled food or water; avoided public or crowded places; prayed; avoided contact with high-risk people; washed or sanitized hands; kept six feet away from those outside of my household; stayed home because I felt unwell; wiped packages entering my home.

References

  1. Brooks, S.K.; Webster, R.K.; Smith, L.E.; Woodland, L.; Wessely, S.; Greenberg, N.; Rubin, G.J. The Psychological Impact of Quarantine and How to Reduce It: Rapid Review of the Evidence. Lancet 2020, 395, 912–920. [Google Scholar] [CrossRef] [Green Version]
  2. Wang, C.; Pan, R.; Wan, X.; Tan, Y.; Xu, L.; Ho, C.S.; Ho, R.C. Immediate Psychological Responses and Associated Factors during the Initial Stage of the 2019 Coronavirus Disease (COVID-19) Epidemic among the General Population in China. Int. J. Environ. Res. Public Health 2020, 17, 1729. [Google Scholar] [CrossRef] [PubMed] [Green Version]
  3. Rajkumar, R.P. COVID-19 and Mental Health: A Review of the Existing Literature. Asian J. Psychiatry 2020, 52, 102066. [Google Scholar] [CrossRef]
  4. Moore, T.H.M.; Kapur, N.; Hawton, K.; Richards, A.; Metcalfe, C.; Gunnell, D. Interventions to reduce the impact of unemployment and economic hardship on mental health in the general population: A systematic review. Psychol. Med. 2016, 47, 1062–1084. [Google Scholar] [CrossRef] [PubMed] [Green Version]
  5. Reynolds, D.L.; Garay, J.R.; Deamond, S.L.; Moran, M.K.; Gold, W.; Styra, R. Understanding, Compliance and Psychological Impact of the SARS Quarantine Experience. Epidemiol. Infect. 2008, 136, 997–1007. [Google Scholar] [CrossRef] [PubMed]
  6. Cuijpers, P.; Smit, F. Excess Mortality in Depression: A Meta-analysis of Community Studies. J. Affect. Disord. 2002, 72, 227–236. [Google Scholar] [CrossRef]
  7. Kruijshaar, M.E.; Hoeymans, N.; Bijl, R.V.; Spijker, J.; Essink-Bot, M.L. Levels of Disability in Major Depression: Findings from the Netherlands Mental Health Survey and Incidence Study (NEMESIS). J. Affect. Disord. 2003, 77, 53–64. [Google Scholar] [CrossRef]
  8. Suls, J.; Bunde, J. Anger, Anxiety, and Depression as Risk Factors for Cardiovascular Disease. Psychol. Bull. 2005, 131, 260–300. [Google Scholar] [CrossRef]
  9. Stunkard, A.J.; Faith, M.S.; Allison, K.C. Depression and Obesity. Biol. Psychiatry (1969) 2003, 54, 330–337. [Google Scholar] [CrossRef]
  10. Pfefferbaum, B.; North, C.S. Mental Health and the Covid-19 Pandemic. N. Engl. J. Med. 2020. [Google Scholar] [CrossRef]
  11. Fiorillo, A.; Gorwood, P. The Consequences of the COVID-19 Pandemic on Mental Health and Implications for Clinical Practice. Eur. Psychiatry 2020, 63, 35–62. [Google Scholar] [CrossRef] [Green Version]
  12. Rubin, G.J.; Wessely, S. The Psychological Effects of Quarantining a City. BMJ 2020. [Google Scholar] [CrossRef] [Green Version]
  13. Paul, K.I.; Moser, K. Unemployment Impairs Mental Health: Meta-analyses. J. Vocat. Behav. 2009, 74, 264–282. [Google Scholar] [CrossRef]
  14. Zivin, K.; Paczkowski, M.; Galea, S. Economic Downturns and Population Mental Health: Research Findings, Gaps, Challenges and Priorities. Psychol. Med. 2011, 41, 1343–1348. [Google Scholar] [CrossRef] [PubMed]
  15. Fryers, T.; Melzer, D.; Jenkins, R.; Brugha, T. The distribution of the common mental disorders: Social inequalities in Europe. Clin. Pract. Epidemiol. Ment. Health 2005, 1, 14. [Google Scholar] [CrossRef] [PubMed] [Green Version]
  16. Dooley, D.; Fielding, J.; Levi, L. Health and unemployment. Annu. Rev. Public Health 1996, 17, 449–465. [Google Scholar] [CrossRef] [PubMed]
  17. Jahoda, M. Work, Employment, and Unemployment: Values, Theories, and Approaches in Social Research. Am. Psychol. 1981, 36, 184–191. [Google Scholar] [CrossRef]
  18. Erdem, Ö.; Lenthe, F.; Prins, R.; Voorham, T.; Burdorf, A. Socioeconomic Inequalities in Psychological Distress among Urban Adults: The Moderating Role of Neighborhood Social Cohesion. PLoS ONE 2016, 11, E0157119. [Google Scholar] [CrossRef] [PubMed]
  19. Ettner, S.L. New Evidence on the Relationship between Income and Health. J. Health Econ. 1996, 15, 67–85. [Google Scholar] [CrossRef]
  20. Atkinson, T.; Liem, R.; Liem, J. The Social Costs of Unemployment: Implications for Social Support. J. Health Soc. Behav. 1987, 27, 317–331. [Google Scholar] [CrossRef]
  21. Jahoda, M. Employment and Unemployment: A Social-Psychological Analysis; Cambridge University Press: Cambridge, UK, 1982. [Google Scholar]
  22. Warr, P. A Conceptual Framework for the Study of Work and Mental Health. Work Stress 1994, 8, 84–97. [Google Scholar] [CrossRef]
  23. Goldman-Mellor, S.J.; Saxton, K.B.; Catalano, R.C. Economic Contraction and Mental Health: A Review of the Evidence, 1990-2009. Int. J. Ment. Health 2010, 39, 6–31. [Google Scholar] [CrossRef]
  24. Glaeser, E.L.; Laibson, D.; Sacerdote, B. An Economic Approach to Social Capital. Econ. J. (Lond.) 2002, 112, F437–F458. [Google Scholar] [CrossRef] [Green Version]
  25. Sobel, J. Can We Trust Social Capital? J. Econ. Lit. 2002, 40, 139–154. [Google Scholar] [CrossRef]
  26. Putnam, R.D. Bowling alone: America’s declining social capital. J. Democr. 1995, 6, 65–78. [Google Scholar] [CrossRef] [Green Version]
  27. Almedom, A.M. Social Capital and Mental Health: An Interdisciplinary Review of Primary Evidence. Soc. Sci. Med. 2005, 61, 943–964. [Google Scholar] [CrossRef]
  28. Koltai, J. Recession-related Stress, Mental Health, and the Buffering Role of Psychosocial Resources. Eur. J. Public Health 2018, 28, 124. [Google Scholar] [CrossRef]
  29. Tefft, N. Insights on Unemployment, Unemployment Insurance, and Mental Health. J. Health Econ. 2011, 30, 258–264. [Google Scholar] [CrossRef]
  30. Takagi, D.; Kondo, K.; Kawachi, I. Social Participation and Mental Health: Moderating Effects of Gender, Social Role and Rurality. BMC Public Health 2013, 13, 701. [Google Scholar] [CrossRef] [Green Version]
  31. Nummela, O.; Sulander, T.; Rahkonen, O.; Karisto, A.; Uutela, A. Social Participation, Trust and Self-rated Health: A Study among Ageing People in Urban, Semi-urban and Rural Settings. Health Place 2008, 14, 243–253. [Google Scholar] [CrossRef]
  32. Vogelsang, E.M. Older Adult Social Participation and Its Relationship with Health: Rural-urban Differences. Health Place 2016, 42, 111–119. [Google Scholar] [CrossRef] [PubMed] [Green Version]
  33. Guo, Q.; Bai, X.; Feng, N. Social Participation and Depressive Symptoms among Chinese Older Adults: A Study on Rural—Urban Differences. J. Affect. Disord. 2018, 239, 124–130. [Google Scholar] [CrossRef] [PubMed]
  34. Li, L.W.; Liu, J.; Xu, H.; Zhang, Z. Understanding Rural—Urban Differences in Depressive Symptoms Among Older Adults in China. J. Aging Health 2016, 28, 341–362. [Google Scholar] [CrossRef] [PubMed] [Green Version]
  35. Norstrand, J.A.; Xu, Q. Social Capital and Health Outcomes Among Older Adults in China: The Urban—Rural Dimension. Gerontologist 2012, 52, 325–334. [Google Scholar] [CrossRef] [PubMed] [Green Version]
  36. Mouzon, D.M. Religious Involvement and the Black-White Paradox in Mental Health. Race Soc. Probl. 2017, 9, 63–78. [Google Scholar] [CrossRef]
  37. Lincoln, K.D.; Chatters, L.M.; Taylor, R.J. Social Support, Traumatic Events, and Depressive Symptoms Among African Americans. J. Marriage Fam. 2005, 67, 754–766. [Google Scholar] [CrossRef] [PubMed] [Green Version]
  38. Wozniak, A.; Willey, J.; Benz, J.; Hart, N. COVID Impact Survey: Version 1 [Dataset]; National Opinion Research Center: Chicago, IL, USA, 2020. [Google Scholar]
  39. Backhans, M.C.; Hemmingsson, T. Unemployment and mental health—Who is (not) affected? Eur. J. Public Health 2011, 22, 429–433. [Google Scholar] [CrossRef] [Green Version]
  40. Han, P.K.J.; Zikmund-Fisher, B.J.; Duarte, C.W.; Knaus, M.; Black, A.; Scherer, A.M.; Fagerlin, A. Communication of Scientific Uncertainty about a Novel Pandemic Health Threat: Ambiguity Aversion and Its Mechanisms. J. Health Commun. 2018, 23, 435–444. [Google Scholar] [CrossRef]
  41. Sorokowski, P.; Groyecka, A.; Kowal, M.; Sorokowska, A.; Białek, M.; Lebuda, I.; Dobrowolska, M.; Zdybek, P.; Karwowski, M. Can information about pandemics increase negative attitudes toward foreign groups? A case of COVID-19 outbreak. Sustainability 2020, 12, 4912. [Google Scholar] [CrossRef]
  42. Blasco-Belled, A.; Tejada-Gallardo, C.; Torrelles-Nadal, C.; Alsinet, C. The Costs of the COVID-19 on Subjective Well-Being: An Analysis of the Outbreak in Spain. Sustainability 2020, 12, 6243. [Google Scholar] [CrossRef]
  43. Gao, J.; Zheng, P.; Jia, Y.; Chen, H.; Mao, Y.; Chen, S.; Wang, Y.; Fu, H.; Dai, J. Mental Health Problems and Social Media Exposure during COVID-19 Outbreak. PLoS ONE 2020, 15, E0231924. [Google Scholar] [CrossRef] [PubMed]
  44. Webber, M.; Fendt-newlin, M. A Review of Social Participation Interventions for People with Mental Health Problems. Soc. Psychiatry Psychiatr. Epidemiol. 2017, 52, 369–380. [Google Scholar] [CrossRef] [PubMed] [Green Version]
  45. Maldonato, N.M.; Bottone, M.; Chiodi, A.; Continisio, G.I.; De Falco, R.; Duval, M.; Muzii, B.; Siani, G.; Valerio, P.; Vitelli, R.; et al. A Mental Health First Aid Service in an Italian University Public Hospital during the Coronavirus Disease 2019 Outbreak. Sustainability 2020, 12, 4244. [Google Scholar] [CrossRef]
  46. Buselli, R.; Baldanzi, S.; Corsi, M.; Chiumiento, M.; Del Lupo, E.; Carmassi, C.; Dell’Osso, L.; Cristaudo, A. Psychological care of health workers during the COVID-19 outbreak in Italy: Preliminary report of an Occupational Health Department (AOUP) responsible for monitoring hospital staff condition. Sustainability 2020, 12, 5039. [Google Scholar] [CrossRef]
  47. Vagni, M.; Maiorano, T.; Giostra, V.; Pajardi, D. Hardiness, stress and secondary trauma in Italian healthcare and emergency workers during the COVID-19 pandemic. Sustainability 2020, 12, 5592. [Google Scholar] [CrossRef]
Figure 1. Mental health condition distribution.
Sustainability 12 07763 g001
Table 1. Distribution of frequency of feeling nervous, depressed, lonely, and hopeless across groups.
In the Past 7 Days, How often You FeltFull SampleEmployed without AssistanceEmployed with AssistanceLaid-Off without AssistanceLaid-Off with Assistance
NervousFreq.PercentFreq.PercentFreq.PercentFreq.PercentFreq.Percent
No or less than 1 day566064.60355364.8084968.6358161.6862461.00
1–2 days199722.79127223.2024519.8121322.6125324.73
3–4 days7328.354458.12947.60909.55959.29
5–7 days3734.262133.88493.96586.16514.99
Total8762100.005483100.001237100.00942100.001023100.00
DepressedFreq.PercentFreq.PercentFreq.PercentFreq.PercentFreq.Percent
No or less than 1 day564164.40354364.6180365.0258061.7066264.71
1–2 days201222.97129423.6026921.7820021.2823422.87
3–4 days7058.054167.591129.0710110.74727.04
5–7 days4014.582314.21514.13596.28555.38
Total8759100.005484100.001235100.00940100.001023100.00
LonelyFreq.PercentFreq.PercentFreq.PercentFreq.PercentFreq.Percent
No or less than 1 day559564.05352264.5182967.1856760.1962160.76
1–2 days205923.57130823.9626721.6421622.9325324.76
3–4 days7098.124207.69907.2910110.72959.30
5–7 days3724.262103.85483.89586.16535.19
Total8735100.005460100.001234100.00942100.001022100.00
HopelessFreq.PercentFreq.PercentFreq.PercentFreq.PercentFreq.Percent
No or less than 1 day567464.88359565.7180665.3758361.8963762.27
1–2 days200922.97126923.2026121.1721723.0424523.95
3–4 days7088.104217.701149.25859.02848.21
5–7 days3554.061863.40524.22576.05575.57
Total8746100.005471100.001233100.00942100.001023100.00
Table 2. Distribution of frequency of feeling nervous, depressed, lonely, and hopeless across urban and non-urban areas.
In the Past 7 Days, How Often You FeltFull SampleUrban AreasNon-Urban Areas
NervousFreq.PercentFreq.PercentFreq.Percent
No or less than 1 day566064.60462863.57103269.64
1–2 days199722.79169023.2130720.72
3-4 days7328.356428.82906.07
5-7 days3734.263204.40533.58
Total8762100.007280100.001482100.00
DepressedFreq.PercentFreq.PercentFreq.Percent
No or less than 1 day564164.40460063.21104170.24
1–2 days201222.97171723.5929519.91
3–4 days7058.056138.42926.21
5–7 days4014.583474.77543.64
Total8759100.007277100.001482100.00
LonelyFreq.PercentFreq.PercentFreq.Percent
No or less than 1 day559564.05460063.4099567.28
1–2 days205923.57173123.8632822.18
3–4 days7098.126148.46956.42
5–7 days3724.263114.29614.12
Total8735100.007256100.001479100.00
HopelessFreq.PercentFreq.PercentFreq.Percent
No or less than 1 day567464.88464663.95102869.41
1–2 days200922.97170923.5230020.26
3–4 days7088.106088.371006.75
5–7 days3554.063024.16533.58
Total8746100.007265100.001481100.00
Table 3. Distribution of frequency of feeling nervous, depressed, lonely, and hopeless across AA (African American) and non-AA working-age population.
In the Past 7 Days, How Often You FeltFull SampleAANon-AA
NervousFreq.PercentFreq.PercentFreq.Percent
No or less than 1 day566064.6058269.29507864.10
1–2 days199722.7916019.05183723.19
3–4 days7328.35637.506698.44
5–7 days3734.26354.173384.27
Total8762100.00840100.007922100.00
DepressedFreq.PercentFreq.PercentFreq.Percent
No or less than 1 day564164.4059170.44505063.76
1–2 days201222.9715218.12186023.48
3–4 days7058.05677.996388.06
5–7 days4014.58293.463724.70
Total8759100.00839100.007920100.00
LonelyFreq.PercentFreq.PercentFreq.Percent
No or less than 1 day559564.0559370.68500263.35
1–2 days205923.5715618.59190324.10
3–4 days7098.12627.396478.19
5–7 days3724.26283.343444.36
Total8735100.00839100.007896100.00
HopelessFreq.PercentFreq.PercentFreq.Percent
No or less than 1 day567464.8859671.21507864.21
1–2 days200922.9716319.47184623.34
3–4 days7088.10556.576538.26
5–7 days3554.06232.753324.20
Total8746100.00837100.007909100.00
Table 4. Associations between frequency of feeling nervous, depressed, lonely, hopeless and covariates.
(1) (2) (3) (4)
Nervous Depressed Lonely Hopeless
Laid off0.180 ***[0.076,0.283]0.087[−0.029,0.202]0.254 ***[0.125,0.382]0.150 *[0.016,0.284]
Assistance−0.005[−0.124,0.114]0.060[−0.046,0.165]0.004[−0.094,0.101]0.116 *[0.018,0.214]
Urban0.322 ***[0.203,0.442]0.374 ***[0.286,0.463]0.209 ***[0.093,0.325]0.253 ***[0.124,0.383]
African American−0.383 ***[−0.532,−0.235]−0.458 ***[−0.564,−0.353]−0.473 ***[−0.566,−0.380]−0.510 ***[−0.679,−0.341]
Self-rated Health0.244 ***[0.180,0.309]0.246 ***[0.190,0.302]0.261 ***[0.197,0.325]0.189 ***[0.130,0.248]
Age−0.621 ***[−0.795,−0.446]−0.570 ***[−0.747,−0.393]−0.630 ***[−0.745,−0.515]−0.601 ***[−0.744,−0.457]
Female0.331 ***[0.237,0.425]0.319 ***[0.267,0.371]0.320 ***[0.226,0.414]0.321 ***[0.241,0.402]
Household Income−0.058 ***[−0.086,−0.030]−0.043 **[−0.072,−0.014]−0.046 ***[−0.069,−0.022]−0.065 ***[−0.092,−0.038]
Education0.208 ***[0.158,0.257]0.241 ***[0.196,0.285]0.257 ***[0.176,0.338]0.279 ***[0.214,0.345]
Single−0.017[−0.402,0.368]−0.143[−0.564,0.277]0.045[−0.281,0.370]−0.008[−0.226,0.210]
Intercept 10.504[−0.124,1.132]0.816 **[0.211,1.422]0.763 **[0.247,1.280]0.767 ***[0.357,1.177]
Intercept 21.871 ***[1.257,2.485]2.197 ***[1.604,2.790]2.180 ***[1.690,2.669]2.166 ***[1.775,2.558]
Intercept 33.063 ***[2.440,3.686]3.319 ***[2.717,3.920]3.352 ***[2.873,3.832]3.366 ***[2.951,3.781]
N8504 8502 8478 8489
95% confidence intervals in brackets; * p < 0.05, ** p < 0.01, *** p < 0.001.
Table 5. Associations between frequency of feeling nervous, depressed, lonely, hopeless and the interaction of being laid off and government assistance.
(1) (2) (3) (4)
Nervous Depressed Lonely Hopeless
Not Laid off No Assistance0.000[0.000,0.000]0.000[0.000,0.000]0.000[0.000,0.000]0.000[0.000,0.000]
Not Laid off with Assistance−0.047[−0.186,0.092]0.135 *[0.011,0.258]0.007[−0.141,0.154]0.160 *[0.025,0.295]
Laid off No Assistance0.132[−0.003,0.268]0.177 *[0.001,0.353]0.257 ***[0.118,0.395]0.202 *[0.031,0.374]
Laid off with Assistance0.202 **[0.068,0.336]0.093[−0.032,0.218]0.256 ***[0.111,0.400]0.237 ***[0.121,0.352]
Urban0.322 ***[0.202,0.441]0.377 ***[0.289,0.465]0.209 ***[0.094,0.325]0.254 ***[0.126,0.382]
African American−0.385 ***[−0.533,−0.237]−0.455 ***[−0.563,−0.348]−0.473 ***[−0.565,−0.381]−0.508 ***[−0.680,−0.337]
Self-rated Health0.244 ***[0.179,0.309]0.246 ***[0.190,0.303]0.261 ***[0.197,0.325]0.189 ***[0.130,0.248]
Age−0.619 ***[−0.794,−0.443]−0.574 ***[−0.750,−0.399]−0.630 ***[−0.745,−0.515]−0.603 ***[−0.748,−0.459]
Female0.331 ***[0.236,0.425]0.320 ***[0.268,0.372]0.320 ***[0.226,0.414]0.322 ***[0.242,0.402]
Household Income−0.058 ***[−0.086,−0.030]−0.042 **[−0.072,−0.012]−0.046 ***[−0.070,−0.022]−0.064 ***[−0.091,−0.037]
Education0.207 ***[0.158,0.255]0.242 ***[0.200,0.285]0.257 ***[0.177,0.337]0.280 ***[0.215,0.346]
Single−0.018[−0.405,0.370]−0.143[−0.558,0.272]0.045[−0.281,0.370]−0.008[−0.224,0.209]
Intercept 10.492[−0.129,1.113]0.839 **[0.246,1.432]0.764 **[0.248,1.280]0.779 ***[0.365,1.192]
Intercept 21.859 ***[1.252,2.466]2.220 ***[1.640,2.800]2.180 ***[1.692,2.669]2.178 ***[1.783,2.574]
Intercept 33.051 ***[2.436,3.665]3.342 ***[2.754,3.931]3.353 ***[2.875,3.832]3.378 ***[2.955,3.801]
N8504 8502 8478 8489
95% confidence intervals in brackets; * p < 0.05, ** p < 0.01, *** p < 0.001.
Table 6. Associations between frequency of feeling nervous, depressed, lonely, hopeless and the interaction of being laid off and government assistance in rural/suburban areas.
(1) (2) (3) (4)
Nervous Depressed Lonely Hopeless
Not Laid off No Assistance0.000[0.000,0.000]0.000[0.000,0.000]0.000[0.000,0.000]0.000[0.000,0.000]
Not Laid off with Assistance−0.277[−0.648,0.094]0.097[−0.249,0.442]−0.163[−0.581,0.256]−0.089[−0.464,0.287]
Laid off No Assistance0.427 *[0.079,0.774]0.374 *[0.052,0.696]0.550 ***[0.230,0.870]0.384[−0.037,0.805]
Laid off with Assistance0.267[−0.135,0.668]0.101[−0.202,0.404]0.367[−0.098,0.833]0.213[−0.252,0.678]
Urban0.000[0.000,0.000]0.000[0.000,0.000]0.000[0.000,0.000]0.000[0.000,0.000]
African American−0.067[−0.971,0.836]−0.523[−1.205,0.159]−0.823 **[−1.426,−0.219]−0.915[−1.841,0.012]
Self-rated Health0.262 **[0.086,0.438]0.191 *[0.036,0.347]0.340 ***[0.167,0.513]0.210 **[0.071,0.348]
Age−0.333[−0.699,0.033]−0.339 *[−0.664,−0.015]−0.575 **[−0.941,−0.210]−0.388[−0.894,0.119]
Female0.268 **[0.090,0.446]0.179 *[0.035,0.322]0.250 **[0.072,0.428]0.422 ***[0.265,0.578]
Household Income−0.021[−0.081,0.039]−0.086 **[−0.151,−0.021]−0.121 ***[−0.179,−0.064]−0.061 *[−0.108,−0.015]
Education0.087[−0.087,0.261]0.184 *[0.021,0.346]0.351 ***[0.216,0.486]0.278 ***[0.159,0.398]
Single0.239[−0.233,0.711]−0.142[−0.722,0.439]0.231[−0.301,0.764]−0.015[−0.832,0.802]
Intercept 10.997[−0.005,1.999]0.704[−0.215,1.623]1.468 *[0.199,2.738]1.654 *[0.248,3.060]
Intercept 22.443 ***[1.372,3.514]2.086 ***[1.190,2.982]2.961 ***[1.688,4.234]3.046 ***[1.653,4.439]
Intercept 33.534 ***[2.486,4.581]3.137 ***[2.094,4.180]4.028 ***[2.646,5.411]4.177 ***[2.785,5.570]
N1433 1433 1430 1432
95% confidence intervals in brackets; * p < 0.05, ** p < 0.01, *** p < 0.001.
Table 7. Associations between frequency of feeling nervous, depressed, lonely, hopeless and the interaction of being laid off and government assistance in urban areas.
(1) (2) (3) (4)
Nervous Depressed Lonely Hopeless
Not Laid off No Assistance0.000[0.000,0.000]0.000[0.000,0.000]0.000[0.000,0.000]0.000[0.000,0.000]
Not Laid off with Assistance0.000[−0.152,0.153]0.143 *[0.009,0.278]0.037[−0.142,0.217]0.209 *[0.049,0.368]
Laid off No Assistance0.075[−0.093,0.243]0.148[−0.037,0.334]0.202 *[0.047,0.358]0.165[−0.003,0.334]
Laid off with Assistance0.196 **[0.053,0.339]0.094[−0.036,0.223]0.236 **[0.085,0.386]0.241 **[0.090,0.393]
Urban0.000[0.000,0.000]0.000[0.000,0.000]0.000[0.000,0.000]0.000[0.000,0.000]
African American−0.417 ***[−0.591,−0.244]−0.437 ***[−0.558,−0.316]−0.440 ***[−0.543,−0.337]−0.487 ***[−0.677,−0.298]
Self-rated Health0.241 ***[0.181,0.302]0.257 ***[0.198,0.317]0.250 ***[0.175,0.325]0.189 ***[0.123,0.255]
Age−0.684 ***[−0.884,−0.483]−0.623 ***[−0.828,−0.418]−0.645 ***[−0.808,−0.483]−0.642 ***[−0.793,−0.492]
Female0.343 ***[0.232,0.455]0.344 ***[0.278,0.410]0.330 ***[0.232,0.429]0.300 ***[0.213,0.388]
Household Income−0.067 ***[−0.094,−0.041]−0.034 *[−0.062,−0.006]−0.034 **[−0.058,−0.010]−0.066 ***[−0.097,−0.034]
Education0.233 ***[0.171,0.296]0.261 ***[0.199,0.323]0.244 ***[0.161,0.326]0.286 ***[0.218,0.354]
Single−0.050[−0.508,0.408]−0.150[−0.627,0.328]0.024[−0.338,0.387]−0.001[−0.204,0.202]
Intercept 10.050[−0.648,0.748]0.515[−0.197,1.226]0.491[−0.099,1.081]0.418[−0.034,0.869]
Intercept 21.409 ***[0.740,2.078]1.898 ***[1.213,2.583]1.898 ***[1.350,2.445]1.823 ***[1.409,2.236]
Intercept 32.618 ***[1.941,3.296]3.032 ***[2.337,3.728]3.091 ***[2.541,3.641]3.035 ***[2.632,3.439]
N7071 7069 7048 7057
95% confidence intervals in brackets; * p < 0.05, ** p < 0.01, *** p < 0.001.
Table 8. Associations between frequency of feeling nervous, depressed, lonely, hopeless and the interaction of being laid off and government assistance for non-AA employees.
(1) (2) (3) (4)
Nervous Depressed Lonely Hopeless
Not Laid off No Assistance0.000[0.000,0.000]0.000[0.000,0.000]0.000[0.000,0.000]0.000[0.000,0.000]
Not Laid off with Assistance−0.077[−0.219,0.065]0.119[−0.017,0.255]0.023[−0.126,0.172]0.141[−0.006,0.289]
Laid off No Assistance0.132[−0.001,0.266]0.179[−0.000,0.359]0.289 ***[0.148,0.430]0.194 *[0.028,0.360]
Laid off with Assistance0.170 *[0.015,0.326]0.065[−0.085,0.214]0.240 **[0.070,0.411]0.187 **[0.068,0.306]
Urban0.332 ***[0.208,0.456]0.380 ***[0.285,0.474]0.202 ***[0.086,0.319]0.250 ***[0.112,0.388]
African American0.000[0.000,0.000]0.000[0.000,0.000]0.000[0.000,0.000]0.000[0.000,0.000]
Self-rated Health0.244 ***[0.179,0.310]0.252 ***[0.196,0.309]0.261 ***[0.197,0.325]0.200 ***[0.130,0.269]
Age−0.593 ***[−0.773,−0.413]−0.518 ***[−0.668,−0.368]−0.623 ***[−0.742,−0.504]−0.558 ***[−0.708,−0.408]
Female0.326 ***[0.229,0.424]0.315 ***[0.257,0.373]0.339 ***[0.247,0.432]0.346 ***[0.281,0.411]
Household Income−0.058 ***[−0.090,−0.025]−0.047 **[−0.081,−0.013]−0.047 ***[−0.074,−0.020]−0.068 ***[−0.098,−0.038]
Education0.198 ***[0.138,0.258]0.242 ***[0.189,0.296]0.258 ***[0.173,0.344]0.288 ***[0.217,0.359]
Single0.014[−0.407,0.435]−0.106[−0.542,0.329]0.045[−0.309,0.398]0.024[−0.182,0.231]
Intercept 10.537[−0.127,1.202]0.957 ***[0.393,1.520]0.774 **[0.260,1.287]0.908 ***[0.495,1.322]
Intercept 21.915 ***[1.268,2.562]2.355 ***[1.820,2.890]2.206 ***[1.728,2.684]2.310 ***[1.917,2.703]
Intercept 33.112 ***[2.460,3.764]3.463 ***[2.931,3.994]3.369 ***[2.903,3.836]3.503 ***[3.077,3.928]
N7690 7688 7665 7677
95% confidence intervals in brackets; * p < 0.05, ** p < 0.01, *** p < 0.001.
Table 9. Associations between frequency of feeling nervous, depressed, lonely, hopeless and the interaction of being laid off and government assistance for African American employees.
(1) (2) (3) (4)
Nervous Depressed Lonely Hopeless
Not Laid off No Assistance0.000[0.000,0.000]0.000[0.000,0.000]0.000[0.000,0.000]0.000[0.000,0.000]
Not Laid off with Assistance0.238[−0.164,0.639]0.287[−0.310,0.883]−0.164[−0.672,0.345]0.392[−0.013,0.797]
Laid off No Assistance0.176[−0.225,0.576]0.154[−0.458,0.767]−0.071[−0.693,0.552]0.242[−0.318,0.802]
Laid off with Assistance0.420 *[0.069,0.772]0.296[−0.140,0.731]0.328[−0.200,0.856]0.587 *[0.052,1.122]
Urban−0.049[−0.887,0.789]0.192[−0.283,0.667]0.437[−0.208,1.081]0.489[−0.398,1.376]
African American0.000[0.000,0.000]0.000[0.000,0.000]0.000[0.000,0.000]0.000[0.000,0.000]
Self-rated Health0.268 **[0.090,0.446]0.217 **[0.074,0.360]0.266 *[0.037,0.496]0.114[−0.095,0.323]
Age−0.869 ***[−1.288,−0.450]−1.214 ***[−1.833,−0.596]−0.723 **[−1.196,−0.250]−1.105 ***[−1.662,−0.548]
Female0.354[−0.037,0.744]0.443 *[0.024,0.862]0.060[−0.312,0.432]0.012[−0.575,0.599]
Household Income−0.068[−0.141,0.006]0.002[−0.059,0.063]−0.041[−0.102,0.021]−0.023[−0.108,0.063]
Education0.290 ***[0.160,0.420]0.241 *[0.032,0.450]0.279 **[0.090,0.467]0.235 **[0.065,0.405]
Single−0.268[−0.762,0.227]−0.459[−1.185,0.267]−0.114[−0.537,0.308]−0.252[−0.783,0.278]
Intercept 10.463[−0.686,1.611]−0.042[−1.598,1.514]1.407 *[0.288,2.527]0.256[−1.002,1.514]
Intercept 21.732 **[0.485,2.980]1.180[−0.468,2.828]2.661 ***[1.498,3.823]1.681 **[0.409,2.954]
Intercept 32.875 ***[1.619,4.130]2.480 **[0.623,4.337]3.949 ***[2.700,5.198]2.988 ***[1.696,4.281]
N814 814 813 812
95% confidence intervals in brackets; * p < 0.05, ** p < 0.01, *** p < 0.001.
Table 10. Statistics on number of workplace-related restrictions that changed or affected personal plans across urban and non-urban areas.
StatisticsN10th Percentile25th PercentileMedian75th Percentile90th PercentileStandard Deviation
Non-Urban1487012451.788824
Urban7295013451.870244
Total8782013451.859613
Note: Appendix Note-1.
Table 11. Statistics on number of measures taken in response to coronavirus by working-age population in non-urban and urban areas.
StatisticsN10th Percentile25th PercentileMedian75th Percentile90th PercentileStandard Deviation
Non-Urban148746911133.554768
Urban7295581012143.303507
Total8782571012143.36222
Note: Appendix Note-2.
Table 12. Statistics on number of workplace-related restrictions that changed or affected personal plans for non-AA and AA working-age populations.
StatisticsN10th Percentile25th PercentileMedian75th Percentile90th PercentileStandard Deviation
Non-AA7940013451.829226
AA842013562.089384
Total8782013451.859613
Note: Appendix Note-1.
Table 13. Statistics on number of measures taken in response to coronavirus by non-AA and AA working-age populations.
StatisticsN10th Percentile25th PercentileMedian75th Percentile90th PercentileStandard Deviation
Non-AA7940571012143.35874
AA842581012143.387564
Total8782571012143.36222
Note: Appendix Note-1.

