Diffusion of Building Information Modeling in Building Projects and Firms in Singapore


1
Sino-Australia Joint Research Center in BIM and Smart Construction, Shenzhen University, Shenzhen 518060, China
2
Department of Building, National University of Singapore, Singapore 117566, Singapore
3
School of Architecture and Built Environment, The University of Adelaide, Adelaide 5005, Australia
4
School of Engineering and Technology, Central Queensland University, Sydney, NSW 2000, Australia
*
Author to whom correspondence should be addressed.
Sustainability 2020, 12(18), 7762; https://doi.org/10.3390/su12187762
Submission received: 31 July 2020
/
Revised: 17 September 2020
/
Accepted: 18 September 2020
/
Published: 20 September 2020
(This article belongs to the Special Issue Lean Design and Building Information Modelling)
Abstract
:Building information modeling (BIM) implementation has been mandated in building projects in Singapore, but a wider adoption is still desired. This study aims to investigate the factors influencing BIM diffusion and examine how the factors influence firms with different project roles, firm sizes, and BIM implementation experience. The results of a pilot study, a questionnaire survey with 89 professionals, and five post-survey interviews showed that hindrances related to inadequate multi-party collaboration (whether formal or informal), conservative mindset, limited skills, costly infrastructure and training, and multi-discipline model integration were the most influential, whereas drivers associated with project leadership team’s strategic consensus, multi-disciplinary design coordination, training, and government regulations were top-ranked. Subgroup analyses between pairs of firms with different characteristics revealed that while construction firms and less experienced stakeholders tended to underestimate BIM implementation difficulties, small-medium contractors might underestimate relevant benefits. The findings and managerial recommendations help different types of firms prioritize resources to overcome hindrances, seize opportunities (such as gaining a competitive edge from BIM practical experience), and obtain support from workers executing BIM daily. With major stakeholders’ recognition and implementation, BIM can be successfully diffused in building projects and firms. The Singapore government and other countries can refer to this study when further issuing BIM diffusion policies.
1. Introduction
Building information modeling (BIM) adoption has been recognized as a smart innovation to improve the delivery efficiency of building projects [1,2]. According to the National Institute of Building Sciences [3], compared with traditional two-dimensional (2D) computer-aided design (CAD) drafting practices, BIM enables the three-dimensional (3D) digital representation of physical and functional characteristics of a facility. A building information model serves as a shared knowledge pool for information about the facility, which catalyzes the integration of accurate information and facilitates decision-making from early design through project completion.
In recent years, governments have increasingly recognized the potential of BIM and rolled out relevant regulations in succession in the global construction industry [4]. For example, the United Kingdom government has issued many guidelines to specify information management procedures in the project lifecycle. It has been required that all centrally funded public projects have to adopt a minimum of Level 2 collaborative BIM since April 2016. In Germany, Planen-bauen 4.0 has been used to guide digital design, construction, operation, operations and maintenance processes in all types of projects. It has also been used in all procurement types and contract forms since December 2015. The government also requires all new projects to implement BIM from 2020 onwards. Other countries such as South Korea, France, and Spain have also included BIM adoption in all public sector projects since 2016, 2017, and March 2018. In conclusion, two typical strategies have been used in promoting BIM implementation. Take the United States (US), for example, where BIM implementation is largely industry-driven. Industry players initiate BIM adoption, prompting the government to make corresponding policies. In contrast with the US’s bottom-up approach, a top-down approach is adopted in countries such as the United Kingdom and Singapore, where the governments are dominant forces in diffusing BIM adoption [5,6]. Cheng and Lu [7] observed that Singapore has issued the most (12 out of 35) BIM standards in Asia, and by far has been the only country that has mandated all new building projects (both public and private) with a gross floor area (GFA) of 5000 m2 and above to submit building plans in BIM format since July 2015. Nevertheless, the Building and Construction Authority (BCA) identified lack of demand for BIM and pool of skilled BIM manpower as key challenges to BIM adoption; consequently, owners may not see beyond initial spending, consultants may overemphasize the mandate rather than prepare design models for downstream uses, general contractors have to re-build models, and subcontractors and facility managers rarely use BIM [8]. To transform the local industry, the local government has been driving collaboration throughout the construction value chain and subsidizing part of BIM implementation costs [9], as well as launched a new industry transformation map (ITM) in October 2017 [10]. Enabled by BIM, integrated digital delivery (IDD) is a key thrust in the ITM to integrate work processes and connect stakeholders working on the same project throughout the lifecycle (including digital design, fabrication and assembly on site, as well as operations and maintenance). Nevertheless, BIM implementation in Singapore, or the world at large, still grows slow, adopts a wait-and-see attitude, and needs guidance [5,11].
Many factors influence BIM implementation. Nonetheless, there is a lack of studies holistically investigating the factors hindering and driving the greater diffusion of BIM in Singapore, and more importantly, few studies have examined whether different types of organizations perceive the hindrances and drivers differently. This should be properly investigated, because the construction industry involves many organizations with different characteristics which may have divergent opinions on BIM implementation. Successful BIM diffusion in building projects requires major organizations’ widespread recognition and implementation. This study intends to provide a case study of these factors in building projects and relevant organizations in Singapore. Singapore’s Economic Strategies Committee [12] advocated that there is much room for efficiency improvement in the labor-intensive building and construction industry. The objectives of this study are to (1) investigate the critical factors hindering and driving building projects in Singapore to implement BIM; (2) compare these factors’ influence on BIM implementation between upfront and downstream stakeholders, between large and small-medium (SM) construction firms, and between experienced and less experienced firms; and (3) recommend managerial strategies for the greater diffusion of BIM.
In terms of practice and management, studying the hindrances allows project leadership teams to clearly understand the challenges and take measures to diminish their negative influence, and learning the drivers enables them to see the opportunities created by implementing BIM and thus obtain sufficient support from the workers who work daily on the shop floor [13]. Besides, firms with different roles, sizes, and experience can refer to specific findings to develop management strategies and prioritize resources. When making further BIM diffusion policies, the local government can refer to this study to clearly understand the hindrances and drivers perceived by different stakeholders. Moreover, although this study focuses on the Singapore context, overseas projects and firms can use the hindrances and drivers identified in this study to, with minor adjustments, customize their own lists of factors according to their characteristics and political contexts. Like the public sector in Singapore taking the lead in adopting BIM, publicly funded construction and building projects in other countries are also commonly encouraged, specified, or mandated to adopt BIM and thereafter may face similar BIM diffusion situations [4].
2. Literature Review
Previous studies have reported that many factors hinder BIM implementation. Through a literature review on previous global studies, this study identified a total of 58 potential hindrances encountered by various stakeholders. Confronted with the hindrances, project teams tended to find it difficult to fully implement BIM, and the percentage of building projects with a high BIM collaboration level was low. Lam [8] reported that 80% of BIM implementation in Singapore was firm-based, rather than project-based. The duplicate efforts for design consultants and contractors to create building information models, respectively, were common both in Singapore [2] and overseas [14]. Thus, it was necessary to investigate the hindrances facing the practitioners.
However, instead of holistically studying all the 58 hindrances, each of the previous studies tended to only explore some of them. Given the mandatory BIM submissions, it would be difficult for project teams in Singapore to implement BIM without considering all these hindrances. More importantly, there was little information about how the hindrances influenced BIM implementation in local firms with different characteristics. For example, Autodesk [13] revealed that executives’ inertia would reduce employees’ willingness and enthusiasm to work with BIM, while Zahrizan et al. [15] reported that in the Malaysian construction industry, the employees may entrench themselves in the traditional way of working even after being pushed to attend training programs. Sattineni and Mead [14] found that commonly used contractual structures would inevitably cause repeated efforts of different parties in design modeling in the global construction industry, but the previous study rarely examined cultural factors and individuals’ competencies. Kiani et al. [16] identified factors related to an unsupportive culture in Iran, but did not study the government’s active role in the design process to specify BIM uses. Juan et al. [5] studied the factors prohibiting architectural firms—rather than the whole construction value chain—in Taiwan from being ready to adopt BIM.
In terms of studies conducted in Singapore, Liao and Teo [17] interpreted factors affecting the interenterprise structure, corporate culture, and individuals and roles in BIM implementation from an organizational change perspective, which was restricted to people-related aspects and ignored other factors, such as those related to work processes and technological innovation. Zhao et al. [18] assessed potential risks in BIM adoption in Singapore at the firm level and did not evaluate the project-level risks. Liao et al. [6] assessed BIM implementation readiness in building projects in Singapore without identifying barriers to BIM diffusion.
People seek change, but do not want to be changed. Thus, it is vital to get major stakeholders to understand the potential value of full BIM implementation [19]. In this study, 41 potential factors driving BIM implementation have been identified from previous global studies. Because of these drivers, the percentage of BIM adoption in Singapore has been growing [9]. Likewise, each of these studies investigated only some specific merits that enhanced BIM implementation in specific countries. For example, among the references studying many drivers, Kunz and Fischer [20] focused on driving contractors and consultants to work collaboratively on design models so that construction issues could be virtually identified and solved before actual construction commences, but owners’ and facility managers’ involvement was limited in this process. Khosrowshahi and Arayici [19] suggested three structural patterns—namely, organizational culture, education and training, and information management—to tackle technology, process, and people issues in BIM implementation in the United Kingdom construction industry, and incorporated them into a roadmap for local organizations to consider when progressing on the BIM maturity ladder. Won et al. [21] investigated the critical factors commonly considered to enhance BIM implementation in organizations, especially in South Korea, which differed from the present research studying the factors at the project and firm levels. This previous study also did not consider government aspects and new construction methods such as off-site manufacture (OSM) and on-site assembly. Juan et al. [5] investigated the drivers for incorporating BIM-based e-submission into the building permit review process to revolutionize the construction industry, but only targeted Taiwanese architectural firms. Other previous studies investigated even fewer drivers.
Regarding research conducted in Singapore, Oo [22] identified critical cultural and individual factors for the architectural firms in Singapore to move from the traditional work practices, but did not identify the factors motivating collaborative relationships among the primary participants. Hwang et al. [23] found that BIM implementation had a significant impact on reducing reworks arising from various changes and errors/omissions in building projects in Singapore, but did not indicate how to promote BIM diffusion. Moreover, little was known about how the driving factors may influence different organizations’ BIM implementation.
To summarize, there is a serious lack of studies to holistically investigate the factors hindering and driving the greater diffusion of BIM, especially in the Singapore context, as well as to compare different types of firms’ perceptions of both the hindrances and drivers. With a deep understanding of the factors to which respective firms pay much more attention, BIM diffusion strategies and policies can be more purposively and effectively formulated.
3. Methodology
The methodology is shown in Figure 1. A pilot study, a questionnaire survey, and post-survey interviews were employed to investigate the hindrances and drivers to BIM implementation in Singapore. The questionnaire was designed from the hindrances and drivers identified from the previous studies. Before it was sent out, five BIM professionals who had implemented BIM for at least three years in Singapore were interviewed in a pilot study to help revise the questionnaire. In the interviews of the pilot study, the experts provided a critical analysis of the factors one by one to evaluate whether they were pertinent to the Singapore context, whether they could be further merged, and whether there were important factors not mentioned in previous studies. After the interviews, 47 hindrances and 32 drivers were listed as the final factors impacting BIM diffusion in Singapore, as shown in Table 1 and Table 2. The readability was also pretested by the interviewees. It can be seen from Table 1 that “lack of skilled employees and need for training them on BIM and OSM” (H04) and “contractual relationships among stakeholders and need for new frameworks” (H27) were the most frequently occurring hindrances, whereas hindrances such as those related to benefits (H17, H30, and H41) and OSM (H22–H26, H35, H37, and H39) occurred the least. In Table 2, “design coordination between disciplines through clash detection and resolution” (D17) enjoyed the highest popularity among the driving factors, whereas “integrating model management tools with stakeholders’ enterprise systems to exchange data” (D30) was only mentioned once.
Then, the final questionnaire invited respondents to rate the factors’ influence on BIM implementation according to the actual circumstances in one of their building projects using a five-point scale (1 = very insignificant; 2 = insignificant; 3 = neutral; 4 = significant; and 5 = very significant). The targeted respondents were all the organizations in the Singapore construction industry. The sampling frame shares a common stratum, including the Urban Redevelopment Authority, the BCA, the Housing and Development Board (HDB), the building developers registered with the Real Estate Developers’ Association of Singapore, the architectural consultancy firms registered with the Singapore Institute of Architects, the structural and mechanical, electrical, and plumbing (MEP) consultancy firms registered with the Association of Consulting Engineers Singapore, the larger contractors registered with the BCA, and the facility management firms registered with the Association of Property and Facility Managers. This study adopted simple random sampling, as each organization was as likely to be drawn as the others. Finally, this study contacted 692 organizations to participate in this study, of which 89 completed the survey, yielding a response rate of 12.86%. Because the general response rate of Singapore surveys was 10%–15% [53], this study’s response rate was acceptable. The profile of the 89 respondents and their organizations is summarized in Table 3. A total of 55.1% of the respondents had worked for over 10 years in the construction industry. In the “others” category, the 16 organizations consisted of the BCA, the HDB, developers, precasters, and other consultancy firms, such as multi-disciplinary consultancy firms, a project management consultancy firm, and a BIM consultancy firm. Thus, the sample had a good balance of stakeholders and represented major BIM implementers in Singapore.
To gain an in-depth understanding of the factors’ influence on different types of firms, face-to-face interviews were conducted with industry experts [23,54]. This mixed method reduced the bias originating from a single source of data and facilitated a comprehensive understanding of the factors [55]. These experts were selected from the respondents and possessed at least three years’ experience of implementing BIM in Singapore. Three of them are a project manager, a quantity surveying in charge, and a quantity surveyor of large general construction firms, with 15, 8, and 5 years’ work experience, respectively; the other two included one senior MEP engineer from a large multi-disciplinary design consultancy firm, and one deputy contracts manager from a construction and development firm, with more than 10 years’ work experience. They commented that, overall, the findings of this study were reasonable, and further elaborated the results.
Regarding data analysis process, firstly Cronbach’s alpha was calculated to examine the internal reliability of the ratings for the hindrances and drivers, respectively. Then, the mean ratings were normalized for critical factor selection. The hindrances (or drivers) that obtained mean scores closer to the maximum mean score of all the hindrances (or drivers) were deemed more influential. This principle was also adopted by Zhao et al. [56], who identified the factors with normalized values of 0.50 and above as critical factors. Subsequently, to identify if there was any divergence in the responses between different organization groups, the independent-samples t-test was employed. Specifically, if the p-value for the test was less than 0.05, the compared pairs of firms had substantially different mean ratings from each other. IBM SPSS Statistics 20 was used in the analysis.
4. Results and Discussion
The Cronbach’s coefficient values of the data related to the influence of the hindrances and drivers were 0.974 and 0.968, implying a high data reliability.
4.1. Hindrances to BIM Implementation
4.1.1. Critical Hindrances
As shown in Table 4, the overall mean scores of the 47 hindrances to BIM implementation ranged from 3.17 to 3.79. The normalization results indicated that 21 hindrances received the normalized values above 0.50, which were ranked. The ranking of these hindrances could enable practitioners to understand which areas of activities of BIM implementation were worthwhile to pay more attention to and prioritize for resource investment. The top 10 hindrances were analyzed and discussed.
This study identifies that the top two (H12 and H27) influential hindrances and another highly ranked hindrance (H28) were related to inadequate multi-party collaboration, whether formal or informal. Specifically, the top rank of “need for all key stakeholders to be on board to exchange information” (H12) echoed previous studies [11,38], which found that the involvement of all the major stakeholders in a building project, especially the contractors, in the design stage to share expertise and information is critical to creating optimal design models and fixing them early. Such models address the potential issues that would traditionally occur during construction, and pave the way for collaboration among the stakeholders in later stages. A basic premise of BIM is collaboration by different stakeholders at different phases of the lifecycle of a facility to insert, extract, update, or modify information [3]. Thus, BIM implementation would be efficient if the entire team, ranging from the owner to the design consultants, the specialty contractors, and the facility manager, can actively contribute from the early design through project completion. This result was also consistent with the findings of Kent and Becerik-Gerber [42] that the involvement of the manufacturers (suppliers) and trade contractors was limited in the design stage. “Contractual relationships among stakeholders and need for new frameworks” (H27) and “traditional contracts protect individualism rather than best-for-project thinking” (H28) were the second and seventh most critical hindrances, indicating that the contractual structure for building projects in Singapore was not collaborative and posed challenges in collaborative BIM implementation. This finding was in line with the argument of Fischer et al. [36] that, as disputes are raised, the lack of new contractual frameworks may thrust the primary participants into adversarial positions. Often, the parties’ recourse was to claim, which would force them to act in their own best interests, crippling the project team. For example, the upfront parties were cautious about providing incomplete or wrong design information to the downstream parties [34], whereas the latter was anxious about providing professional advice on the design modeling [47]. Besides, the downstream parties, if involved upfront, would work at risk in a financial manner and lack motivation and enthusiasm to collaborate with others [17]. Although the BIM Particular Conditions in Singapore have been drafted [57], the main form of contract in Singapore is still based on the adversarial system, leading to individualism and isolated working environments.
Besides, another four influential hindrances were associated with conservative mindset and limited skills. Specifically, “lack of skilled employees and need for training them on BIM and OSM” (H04) was ranked third, implying that the Singapore construction industry suffered from insufficient personnel who could lead BIM modeling and management teams. The employees tended to be reluctant to participate in the new workflow [15]. One example was that many firms could not take advantage of the commonly used data exchange format Industry Foundation Classes (IFC) and still used proprietary formats, resulting in less smooth data exchange with other team members. Besides, the experts involved in the post-survey interviews were also concerned about the management’s willingness to train their employees. This was in line with the influential hindrance “executives failing to recognize the value of BIM-based processes and needing training” (H01, ranked eighth). In most cases, the executives determine the allocation of capital investment to upgrade infrastructure and sponsor training programs. Meanwhile, “industry’s conservativeness, fear of the unknown, and resistance to changing comfortable routines” (H05) also occupied the third position, suggesting that such negative mindsets and behaviors were rooted in the local construction industry. This value proposition established a conservative and unsupportive culture in most firms, greatly hindering the local BIM implementation. This finding was consistent with a previous study [19], which found inadequate marginal utility to be realized using BIM. The stakeholders tended not to change their customized ways of working and blaming. The post-survey interviewees reported that although the executives of many local firms changed to use 3D tools, their leadership style appeared to keep a 2D mindset, and that as the costs and benefits of BIM implementation were difficult to foresee and estimate, the management tended to ensure things were under control as it previously did. In addition, “entrenchment in 2D drafting and unfamiliarity with using BIM” (H07) were also ranked third, revealing that many firms in Singapore had little expertise and experience in implementing BIM. This accorded with the survey result that 58.4% of the responding firms had no more than three years’ BIM implementation experience, and with the finding of Kiani et al. [16] that many firms were satisfied with their conventional methods to complete their work and therefore saw the use of BIM as extra effort. For example, upfront BIM operators lacked field knowledge of what they were modeling and its constraint in actual construction; consequently, the digital models may not be developed correctly [58].
Moreover, the hindrances “costly investment in BIM hardware and software solutions” (H42) and “firms’ unwillingness to invest in training due to initial cost and productivity loss” (H31) were ranked sixth and tenth, respectively, implying that costly BIM infrastructure and training significantly hindered BIM implementation. In the post-survey interviews, the experts reported that, currently, the hardware in their offices was not powerful enough to run relevant BIM software at an efficient speed. Huge file sizes and required storage space as well as high-speed data transmission between users posed challenges to the current office environment. The post-survey interviewees also emphasized the importance of financial capabilities. While the biggest firms can ride on the BIM wave, a huge number of SM firms and foreign firms based in Singapore may face financial challenges [8], although half of initial purchase costs (hardware, software, and training) were subsidized by the local government.
Another influential hindrance “technical needs for multiuser model access in multi-discipline integration” (H46) was ranked eighth. This result was consistent with previous studies [5,30], which found that multi-discipline model integration required technical expertise, protocols, and advanced infrastructure for multiuser model access. The post-survey interviewees pointed out that different parties tended to use various software or software versions, creating difficulties in the integration.
4.1.2. Comparison between Upfront and Downstream Stakeholders
Currently, the BIM-related policies (such as the mandatory BIM submissions) in Singapore tend to emphasize the design stage, while construction and facility management firms were not affected or less affected by these policies [2,8]. Thus, this study compared the influence of the hindrances on BIM implementation among different stakeholders. The organizations were categorized into upfront stakeholders (government agencies, owners/developers, and consultancy firms) and downstream stakeholders (construction firms, precasters, and facility management firms). Among the 89 surveyed organizations, the sample (44) of 42 contractors (with BCA financial grades) and two facility management firms was downstream stakeholders, while the remaining 45 organizations were combined into the upfront group. The independent-samples t-test results showed that the mean scores of three hindrances significantly differed between the two groups (see Table 4), which were subsequently analyzed, explained, and discussed. Specifically, two (H15–H16) of the three hindrances were related to poor consultant-subcontractor interaction. “Field staff dislike BIM coordination meetings looking at a screen” (H15) received a much higher mean score from the upfront stakeholders (mean = 3.67) than from the downstream stakeholders (mean = 3.18), implying that the upfront stakeholders thought that the field staff were not ready to implement BIM. The experts participating in the post-survey interviews stated that, in a project, the coordination of work among the key stakeholders using BIM models, whether in face-to-face meetings or via video conferencing, would have a greater lifecycle impact. However, experienced field staff might hesitate to learn new ways of working and might not see how they could benefit from such models [15]. The experts added that the staff even felt burdened, because BIM implementation was seen not as a mainstream activity on site but rather as an add-on to the existing meetings and site work on call. Meanwhile, “lack of consultants’ feedback on subcontractors’ model coordination” (H16) had a large mean difference between the upfront (mean = 3.64) and downstream firms (mean = 3.02). This result indicated that some consultants were not well prepared to use BIM and collaborate with the subcontractors. In a project that a post-survey interviewee participated in, the consultants focused only on the mandatory submissions, and the BIM models they created were not accurate enough for downstream uses. In addition, building a property virtually is as tough as building it on an actual site. Another interviewee pointed out that the contractors did not have a suitable candidate that could lead an in-house BIM team, and they put few resources into modeling. To reduce potential clashes and paperwork, the contractors’ drafters and site engineers expected that the owner and design consultants could provide useful feedback to help their model coordination at the construction level, but at times the upfront parties were not able to give adequate useful feedback in the coordination meetings. In this case, BIM implementation may not really be a helping hand for guiding construction activities, but rather be additional work.
Besides, the mean of “lack of effective data interoperability between project stakeholders” (H29) was vastly distinct between the upfront parties (mean = 3.69) and the downstream firms (mean = 3.16), suggesting that the upfront group had difficulties in exchanging data [28,30]. In the post-survey interviews, the professionals highlighted that although the design consultants used 3D software to produce submittals, different consultants concentrated on their own disciplines instead of collaborating with other disciplines. Moreover, the consultants still kept a 2D mindset, such as representing pipes with lines in the 3D models. Consequently, the designs could not match among disciplines.
Furthermore, the Spearman rank correlation was conducted to test whether there was agreement in the rankings of the hindrances between the two groups. Despite the significant differences in the mean scores of the three hindrances, the correlation coefficient of 0.534 with a p-value of 0.000 indicated remarkable agreement on the rankings between the two groups of organizations.
4.1.3. Comparison between Large and SM Construction Firms
Firm size also influences BIM implementation. Larger firms were more likely to implement BIM because they tended to be robust, participate in more projects, and have more resources and expertise. Liao et al. [2] found that, in Singapore, the largest contractors tended to be advanced in adopting BIM and thus reaped the benefits more fully, whereas the others were still in the beginning phase. The BCA financial grade is an indicator of a construction firm’s size [59]. The BIM adoption rate decreased steadily from A1 contractors to small contractors [8]. Thus, this study compared the influence of the hindrances between large and SM construction firms. According to the tendering limits of the BCA grades presented in Table 3, the sample of 34 construction firms without limit (A1, single grade, and L6) was considered as large firms, and the remaining eight construction firms were combined into the SM group. As only the minority of the responding contractors had tendering limits, they were merged into one group. This categorizing of contractors was also applied by Zhao et al. [59]. The independent-samples t-test results suggested that none of the 47 hindrances hugely differed between the two groups of contractors. This was probably because the mandatory BIM implementation, such as the mandated e-submissions and many BIM standards and guidelines, tended to be drastic for both the large and SM contractors involved in this study. A post-survey interviewee (senior MEP engineer) reported that people became more burdened to implement BIM along with design for manufacturing and assembly, as specified in the industry transformation map in Singapore:
“Building project teams work on tight schedules even without adding a technology known as BIM that creates more choices and decisions to be made. Unlike most engineering industries that can modify the environment to create optimum conditions for revenue, a project in the construction industry must modify its various parameters to suit evolving objectives, characteristics, and ‘egos’ of stakeholders. Besides, the industry relies heavily on human input and too many codes (from design, safety, to manufacturing standards). Every additional source of compliance adds to the probability for mistake and also the load on the output. The schedules also depend on subjective human input, which does not help alleviate the factors leading to schedule compression. Additionally, choosing from tons of Revit families accessible via the internet becomes an additional burden. In short, people become burdened by too many human choices and decisions, too little automation from technology, filtering of information, and so on”.
Besides this, another expert opined that the rules and guidelines for diffusing BIM adoption in Singapore may not necessarily encapsulate the best available knowledge of the BIM spirit and create expected consequences:
“The BIM e-submission policy itself might be wasteful because the submittals prepared in the design stage are at a higher level of detail and precision and thus cannot be reusable in later stages, but consume time and resources. Instead, incentives like extra GFA are more welcome motivations for BIM adoption”.
These views also were echoed by Forsythe et al. [38], who found that unless it was forced by policy, BIM would not be widely and frequently used to achieve its full potential in Australia. Nevertheless, the insignificant Spearman rank correlation coefficient of 0.216 (p-value = 0.144) implied that the hindrance rankings were not agreed upon between the large and SM contractors. In the subgroup analysis, the mean scores of the hindrances for the two groups of contractors were also calculated, according to the rating scores of the 34 large contractors and eight SM contractors, respectively. The largest mean difference (0.91) was obtained by “costly investment in BIM hardware and software solutions” (H42), which received a much higher score from the large contractors (mean = 3.79) than from the SM contractors (mean = 2.88). This was because the large firms usually involved more specializations or work crews, and thus needed more increasingly specialized costly infrastructure.
4.1.4. Comparison between Experienced and Less Experienced Stakeholders
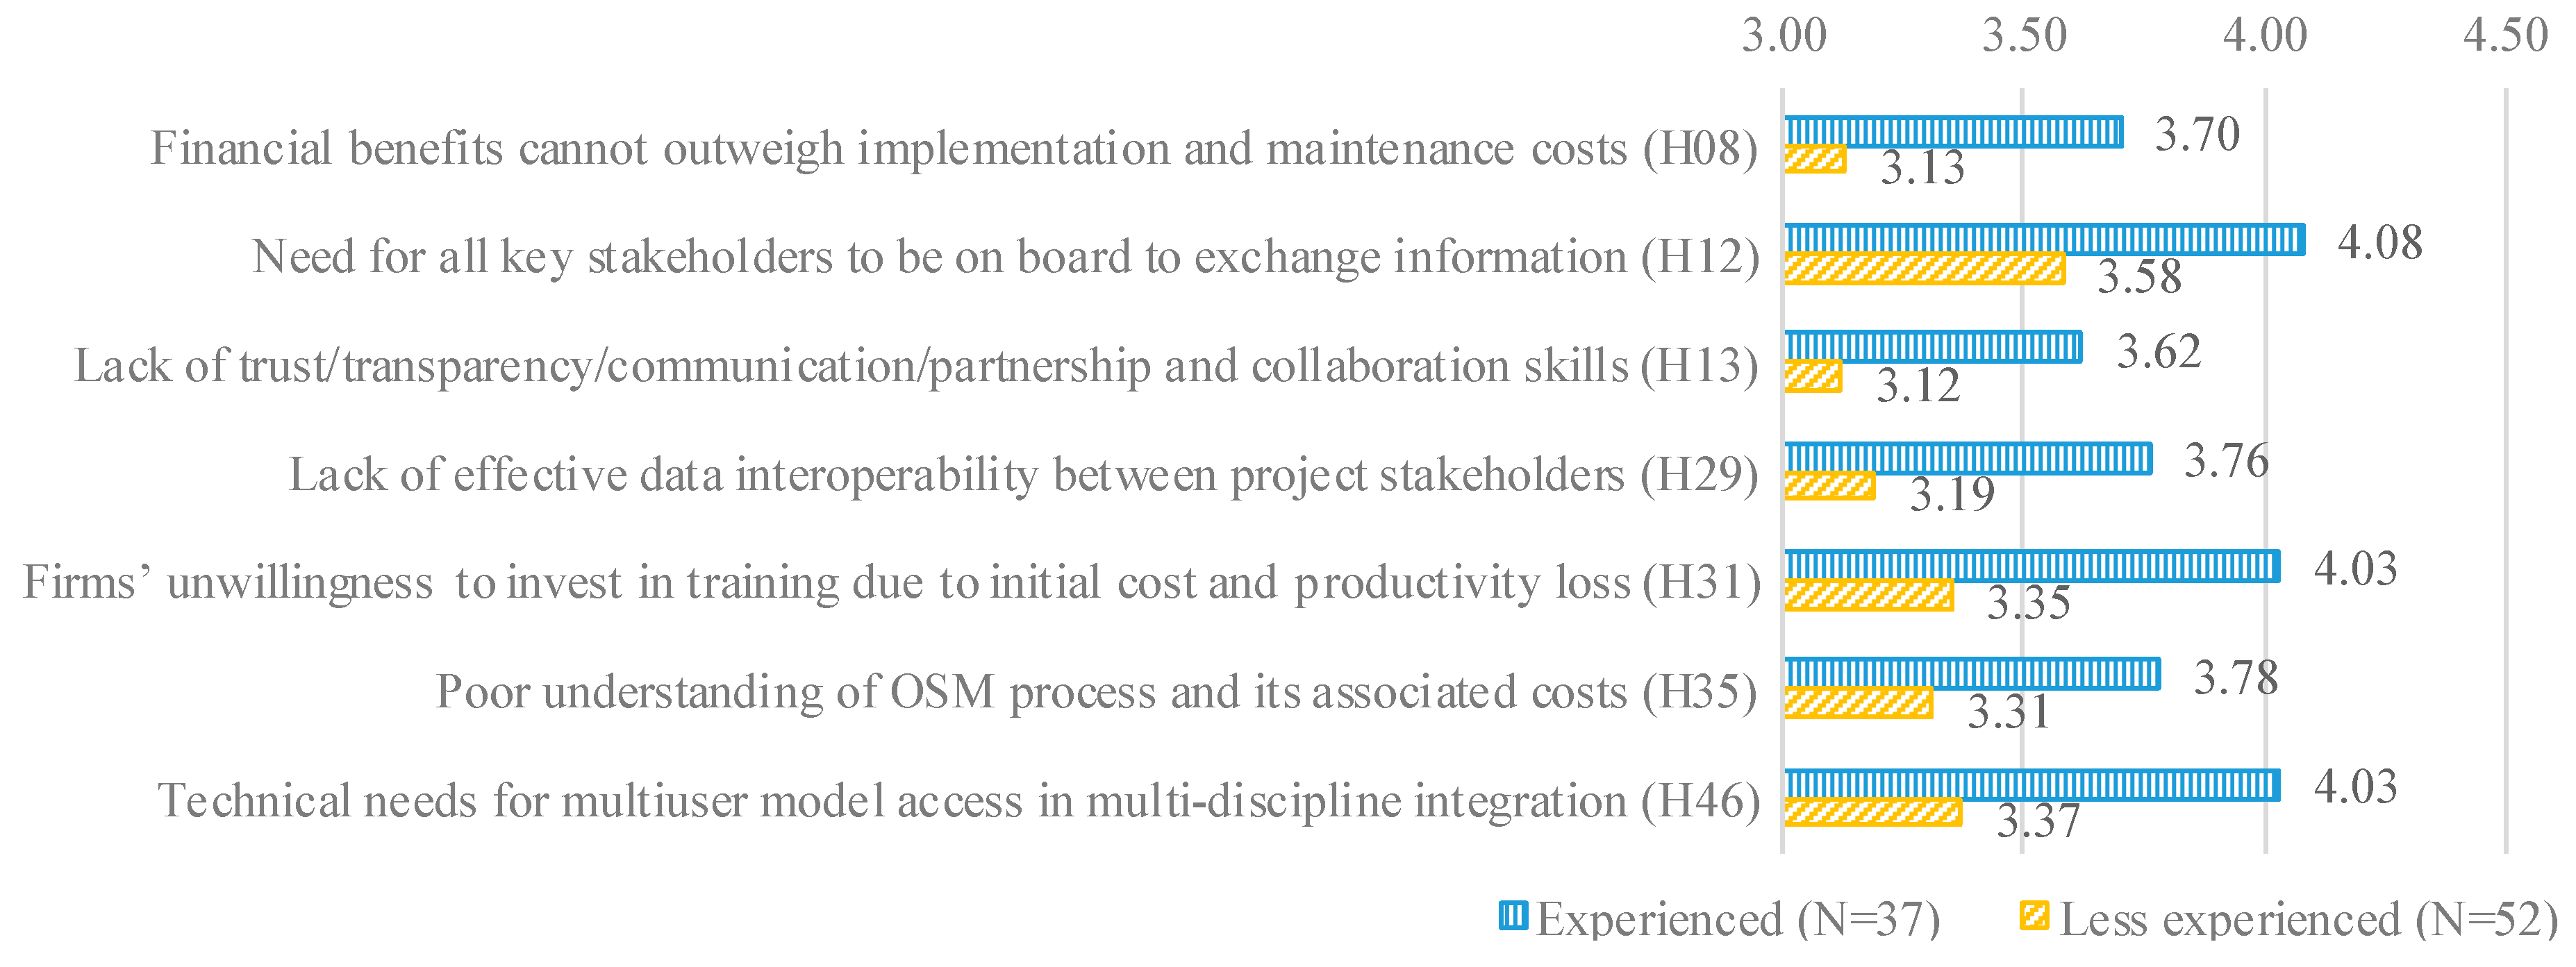
The capabilities of an organization to successfully implement BIM include resources, competencies (such as knowledge and skills), and experience [60]. While larger firms tended to have more resources to implement an innovative technology, firms with more implementation experience might be more capable and ready to adopt it. Juan et al. [5] observed that the Taiwanese architectural firms that had already adopted BIM were more ready to implement BIM than those that had not. This previous study found that the less experience of BIM submissions a firm had, the less likely it could conceive how BIM implementation would affect its work processes. Thus, this present study also compared the influence of the hindrances on BIM implementation between experienced and less experienced firms. It is believed that investigating differences between this pair of stakeholder groups can provide a good reference for local practitioners in their uptake of BIM. The inexperienced group, knowing the differences, can be more prepared for its BIM implementation practices. According to the experience of BIM implementation presented in Table 3, the 52 surveyed organizations that had implemented BIM for “0 year” and “1–3 years” were considered as less experienced organizations, while the remaining 37 organizations with four or more years’ experience were combined into the experienced group. This was because a building project usually spans two to three years, and those with four years’ experience and above had at least completed one project. As shown in Figure 2, the independent-samples t-test results indicated that the mean scores of seven hindrances drastically differed between the two groups. Among which, two (H08 and H31) of them were related to economic aspects. Specifically, “financial benefits cannot outweigh implementation and maintenance costs” (H08) exerted more negative influence on BIM implementation in the experienced firms (mean = 3.70) than in the less experienced firms (mean = 3.13). Apart from the partially subsidized fees of training, consultancy, and infrastructure purchase, subsequent upgrades or subscriptions and engaging skilled personnel to create, operate, and maintain BIM models were much costlier and not subsidized. It was likely that the experienced firms had invested much but had not yet gained considerable benefits in their projects because of the high learning curve and initial productivity loss [19,61]. While the less experienced firms may focus on long-term benefits and thus set aside investments, the experienced ones faced more pressures of reducing costs if they still could not fully reap the BIM benefits after completing several projects. The post-survey interviewees reported that the difficulty of foreseeing and estimating benefits may hinder the experienced firms in continuing to invest in training in the short term. Thus, it was not strange that “firms’ unwillingness to invest in training due to initial cost and productivity loss” (H31) was ranked second (mean = 4.03) and 22nd (mean = 3.35) in the experienced and less experienced groups, respectively.
Besides this, “need for all key stakeholders to be on board to exchange information” (H12) received a much higher mean score (mean = 4.08) from the experienced group than from the less experienced group (mean = 3.58). In first projects, the experienced firms may expect to collaborate with others. However, the more stakeholders there were on board, the more confusing and cumbersome the decision-making and data sharing process became, and the more important it was to have very clear rules of engagement [25,58]. Thus, the experienced firms would experience more problems from this process when implementing BIM [61].
Moreover, “lack of trust/transparency/communication/partnership and collaboration skills” (H13) exerted more negative influence on BIM implementation in the experienced firms (mean = 3.62) than in the less experienced firms (mean = 3.12). The experts participating in the interviews argued that some experienced firms were more likely to treat BIM as everything, but even perfect design modeling could not replace face-to-face communication. Without an all-rounder in-charge BIM expert, such firms may face issues from silo mentality [56].
In addition, another two distinct hindrances (H29 and H46) were associated with data integration. Specifically, “lack of effective data interoperability between project stakeholders” (H29) had more negative influence on BIM implementation in the experienced group (mean = 3.76) than in the less experienced group (mean = 3.19). Although the traditional CAD drafting and exchanging was considered less effective, the less experienced firms were familiar to using it [16]. Most interviewees reported that the incapacity of the computers in their offices of running BIM software at efficient speeds and storing huge files as well as the incompatibility of different parties’ software or software versions could not support effective data sharing. Meanwhile, due to the lack of standards to follow, the experienced parties came up with their BIM models using proprietary, incompatible formats, creating difficulties in interchanging data among the experienced firms. In addition, the interviewees added that as the Revit families increased steadily on the internet, designers and contractors could not easily choose when no data could be confirmed until a final purchase was made. Moreover, the technical support from local agencies, such as help desks, was inadequate. This was why “technical needs for multiuser model access in multi-discipline integration” (H46) was ranked third in the experienced firms, with a higher score (mean = 4.03) than that in the less experienced firms (mean = 3.37).
“Poor understanding of OSM process and its associated costs” (H35) gained mean scores of 3.78 and 3.31 from the experienced and less experienced firms, respectively. The post-survey interviewees found that, in Singapore, the incorporation of OSM into the BIM process was not mature due to its high cost, and that linking OSM to BIM was artificial. In particular, the senior MEP engineer reported:
“The quality of manufactured products continues to diverge and the construction industry does not evolve to catch up or curb the increasing market choices or limit the infinite outcomes; therefore, BIM implementation will still remain challenging without a well-defined, process orientated, and machine dependent manufacturing industry. Even the compliance of manufactured goods has to be checked against the codes as specified. In other words, the non-conformance of goods itself now becomes an additional burden to the construction industry”.
Thus, the experienced group was more likely to face adoption issues when incorporating OSM into BIM processes. Despite the huge differences in the mean scores of the seven hindrances, the Spearman rank correlation coefficient of 0.605 (p-value = 0.000) indicated significant agreement on the hindrance rankings between the two groups of firms.
4.2. Drivers for BIM Implementation
4.2.1. Critical Drivers
As indicated in Table 5, the overall mean scores of the 32 drivers for BIM implementation ranged from 2.88 to 3.99. The normalization results indicated that 21 drivers obtained normalized values greater than 0.50, implying that they had dramatically driven BIM implementation in Singapore. This study identifies that two of them were related to the management team’s strategic consensus in a project. Specifically, “BIM vision and leadership from the management” (D01) was recognized as the most critical driver for BIM implementation. This result substantiated the argument of Autodesk [13] and Miettinen and Paavola [44] that BIM implementation in the project starts with a well-articulated vision sponsored by the leadership team. Autodesk [13] advocated that top-down approaches are very important in individual organizations who are part of the project team. Thus, without the vision and mission from the management and executive leadership, dedicated resources assigned to adopt BIM would probably be wasted. Besides, “owner’s requirement and leadership to adopt BIM” (D05) occupied the third position. As the project team leader, the owner is key in requiring, via certain contract documents, and motivating its service providers to follow and implement BIM work practices [62,63]. Without the owner’s leadership, the service providers may continue to deliver their scopes of work in conventional ways, hindering project-wide collaboration. However, firms with successful BIM implementation experience would surely gain a competitive edge in meeting qualification requirements and winning bids in the future construction market, which, in turn, drove them to implement their part of BIM in the current project [26].
In addition, “design coordination between disciplines through clash detection and resolution” (D17) obtained the second position. Full BIM implementation would prompt the team to share data among disparate modeling and analysis applications reliably by using IFC. In the design stage, the key stakeholders physically co-locate in a “Big Room” to collaborate. The structural engineer uses the initial architectural model as a base to conduct structural analysis and adjust the model to create a structural model, while the MEP engineers create a MEP model on the same design. All these designers then produce a composite model by linking the structural and MEP models back to the architectural model [45]. This well-coordinated model could enable multiple downstream disciplines to document the construction intent of building systems and components, generate construction models and drawings, and collaborate with other trades on site in later stages.
Other highly ranked drivers, such as “training on new skillsets and new ways of working such as BIM management certification courses” (D04) and “governance of BIM-related policies, standards, and guidelines” (D13), were also influential. Singapore is one of the rare countries that provide certification courses on BIM management for industry professionals to implement and execute a BIM project. Apart from mandated BIM submissions, the local government has issued a series of BIM standards and guidelines. For example, the Singapore BIM Guide serves as a reference guide for the development of a BIM Execution Plan, outlining project members’ roles and responsibilities when using BIM at different stages of the project.
4.2.2. Comparison between Upfront and Downstream Stakeholders
The independent-samples t-test results revealed that none of the 32 drivers obtained hugely different mean scores between the two groups of surveyed organizations. This result was reasonable, because in a building project successful BIM implementation needs the entire team to participate, contribute, and collaborate with each other—for instance, staying in close communication and exchanging data of different disciplines [61]. The post-survey interviewees reported that, although the project stakeholders remained responsible for their respective deliverables, working on the same BIM platform was essential for effective project delivery. Besides, the high Spearman rank correlation coefficient of 0.807 (p-value = 0.000) indicated good agreement on the driver rankings between the upfront and downstream stakeholders. This substantiated the statistically insignificant differences in the mean scores.
4.2.3. Comparison between Large and SM Construction Firms
As shown in Table 6, the independent-samples t-test results indicated that the mean scores of six drivers greatly differed between the large and SM construction firms. The differences were analyzed, explained, and discussed. Specifically, “owner’s requirement and leadership to adopt BIM” (D05) exerted more influence on BIM implementation in the large construction firms (mean = 4.06) than in the SM construction firms (mean = 3.13). Owners’ requirements and the pressures of achieving owner satisfaction would compel contractors to adopt BIM more fully. As the Singapore construction market is not large, it is important to obtain a good reputation in this market. The large contractors were usually engaged in more projects than the SM firms, and thus were more likely to be motivated to obtain improved satisfaction of the owners, which would contribute to their reputation and increase their probability of winning contracts in the future [56].
Besides this, “all disciplines work together and share models” (D08) received a considerably higher mean score (mean = 3.94) from the large contractors than from the SM contractors (mean = 3.00). In the post-survey interviews, the experts found that, as collaboration is a basic premise of BIM, BIM would be more efficient for Engineering–Procurement–Construction projects, where all key parties are co-located in one place. The large contractors were more likely to serve in more than one role (such as general contractor and civil and structural subcontractors), and BIM implementation could help schedule the required co-location.
Moreover, another three drivers (D15–D17) were related to the inherent functions of BIM. “3D visualization enabling design communication” (D15) influenced BIM implementation more for the large contractors (mean = 3.91) than for the SM contractors (mean = 3.00). According to the BCA contractors’ registry, large firms were usually qualified as general contractors and SM firms as trade contractors. Kent and Becerik-Gerber [42] reported that large contractors were more likely to participate in the design stage to provide site knowledge and advice. Three-dimensional visualization is an engine of BIM and enables team members to communicate their design intent more effectively with each other and with the owner, who may not understand complex drawings [36]. Thus, to better visualize designs, the large contractors were more motivated to implement BIM. Meanwhile, “four-dimensional simulation before construction” (D16) exerted more influence on BIM implementation in the large construction firms (mean = 3.71) than in the SM firms (mean = 2.38). Four-dimensional simulation is another BIM engine [36] and helps the team easily understand the construction impact of any decisions [64]. The multiple roles of the large contractors meant more work processes, which necessitated better scheduling before construction. To plan well, the large contractors would implement BIM to better apply four-dimensional simulation. In contrast, this driver obtained a mean score much below 3.00 in the SM group, implying that most SM contractors tended to put resources into managing and building properties on actual sites, rather than design modeling and scheduling. In addition, the post-survey interviewees reported that, usually, insufficient time was given to full design development, and detailed design very often proceeded concurrently with the construction phase, which commenced after regulatory approvals of schematic design models were obtained [2]. To avoid the work processes being affected, the large contractors were more likely to implement BIM for better site coordination. This was why “design coordination between disciplines through clash detection and resolution” (D17) was ranked top (mean = 4.12) and 15th (mean = 3.00) in the large and SM contractor groups, respectively.
Furthermore, “lifecycle information management improving operations and maintenance” (D24) was also distinct between the large (mean = 3.38) and SM (mean = 2.50) construction firms. Compared with the SM contractors, the large ones were more likely to be involved in the operations and maintenance stage, where 3D models would have advantages over 2D drawings in managing properties. In addition, the SM group received a mean score below 3.00. Therefore, the large firms were more motivated to implement BIM for lifecycle information management.
The insignificant Spearman rank correlation coefficient of 0.280 (p-value = 0.121) suggested that the driver rankings were not agreed upon between the large and SM contractors, which justified the enormous differences in the six drivers’ influence.
4.2.4. Comparison between Experienced and Less Experienced Stakeholders
The independent-samples t-test results suggested that, among the 32 drivers, only “stakeholders seeing the value of adopting their own part of BIM” (D03) gained a drastically different mean score between the experienced (mean = 4.00) and less experienced (mean = 3.50) firms (see Table 6). This driver also received the largest mean difference (0.50) between the two groups. In a post-survey interview, the project manager who had implemented BIM for five years in a general construction firm reported:
“Compared with our first projects that only used BIM in the design stage for regulatory approvals, this current project aligns all key stakeholders and implements BIM from early design. Every Monday all the key stakeholders are co-located to work on the design modeling and coordination to guide construction activities three levels ahead versus actual site progress; data are openly shared. Compared with the first projects, by far the estimated time spent for preparing structural and architectural shop drawings saved by 40% and 42%, respectively, and the number of requests for information in the architecture, structure, and MEP disciplines substantially reduced by 70%. These benefits in turn drive us to continue to implement BIM collaboratively”.
This view echoed Liao and Teo [17] who found that short-term improvements would convince people to continue to behave in a BIM way. In contrast, BIM was relatively new and required time for the industry to update and synchronize [65]. Many skilled workers in conventional construction might hesitate to learn new things, and did not see how BIM could benefit their projects. Despite the drastic difference in the mean score of this driver, the Spearman rank correlation coefficient of 0.861 (p-value = 0.000) implied that the driver rankings were agreed upon between the two groups of firms.
5. Conclusions and Recommendations
This study investigated the critical factors hindering and driving BIM diffusion in building projects in Singapore and compared these factors’ influence on organizations with different characteristics. The data collected through a questionnaire survey and five post-survey interviews indicated that hindrances related to inadequate multi-party collaboration (whether formal or informal), conservative mindset, limited skills, costly infrastructure and training, and multi-discipline model integration were most influential, while drivers associated with project leadership team’s strategic consensus, multi-disciplinary design coordination, training, and government regulations were top-ranked. Besides this, huge differences were found in the mean scores of three and seven hindrances, respectively, between the upfront and downstream stakeholders and between the experienced and less experienced stakeholders, whereas no considerable difference was observed between those of the large and SM construction firms. In addition, while vast differences were found in the mean scores of six drivers and one driver, respectively, between the large and SM contractors and between the experienced and less experienced stakeholders, no great rating difference was observed between the upfront and downstream stakeholders. Thus, it could be concluded that the downstream construction firms and the less experienced stakeholders in Singapore tended to underestimate the difficulties of implementing BIM, considering their much smaller mean scores than those of the experienced group, and, similarly, that the SM construction firms might underestimate the benefits that BIM implementation could bring to themselves and their projects.
Managerial implications can be drawn from the ranking and subgroup analysis results. Firstly, this study recommends the project leadership team to continuously enhance collaboration and coordination among various firms participating in a building project, especially within the consultant team, as well as between the consultants and subcontractors of the same disciplines. This may be accomplished by establishing a multi-party contract or interlocking agreements, or aligning these firms’ corporate goals. Consensus among different firms greatly enhances project-wide collaboration. Secondly, it is recommended that the Singapore government should consider deliberately and cautiously subsidizing part of the BIM manpower cost as the project proceeds. This would address experienced firms’ economic concerns, because the manpower cost spanning the project lifecycle is much higher than the initial implementation costs funded under current policy. It is notable that the percentage of subsidy must be designed based on rigorous analysis, in case it causes fierce competition and overproduction by both experienced implementers and beginners. Besides this, apart from previously published BIM guides and standards, the local government should continue to develop detailed and workable IDD solutions involving the latest smart technologies and convey them to firms to camp up their competency levels. For instance, the concept of digital design in IDD can only be achieved through collaborative and coordinated efforts by the whole team. Thirdly, considering that many SM construction firms serve as subcontractors in the project and underestimate BIM benefits, the core team (owner and key consultants and contractors) can spread design modeling for SM contractors by setting contractual requirements, training their technical teams, or demonstrating short-term improvements to them [66]. Furthermore, on top of all these strategies is an ecosystem with strategic consensus on BIM-based digital delivery, where BIM diffusion policies continuously come up in Singapore in recent years and the use of innovative technologies and management initiatives becomes normal. Thus, each firm should follow the government’s regulations in case of lagging behind and losing opportunities in the future.
Although the objectives were achieved, there are limitations to the conclusions. Firstly, the hindrances and drivers identified in this study may not continue to hold true as time passes. Secondly, as the sample size of the SM construction firms was not large, one should be cautious when generalizing relevant findings. Lastly, the results were interpreted in the context of Singapore, which might differ from other countries. Nonetheless, the implications of this study are not limited to the Singapore construction industry, because Singapore, one of the leading countries in diffusing BIM, serves as one of the benchmark countries. Overseas projects and firms are very likely to face similar BIM diffusion situations in the near future, and thus can refer to the hindering and driving factors and follow the method adopted in this study to investigate their own hindrances and drivers. Governmental agencies not only in Singapore but also in other countries can refer to this study when they further issue targeted BIM diffusion polices. The findings of this study also provide a comprehensive picture of the hindrances and drivers for international companies intending to bid for building projects in Singapore. Thus, this study contributes to the scholarship and practices related to BIM diffusion.
Author Contributions
Conceptualization, L.L. and E.A.L.T.; methodology, L.L.; validation, R.C.; formal analysis, L.L. and R.C.; investigation, L.L. and E.A.L.T.; resources, L.L. and E.A.L.T.; data curation, L.L. and E.A.L.T.; writing—original draft preparation, L.L. and R.C.; writing—review and editing, E.A.L.T. and X.Z.; visualization, L.L. and R.C.; supervision, E.A.L.T.; project administration, L.L.; funding acquisition, L.L. and E.A.L.T. All authors have read and agreed to the published version of the manuscript.
Funding
This research was initially supported by the full-time research scholarship of the National University of Singapore and subsequently funded by the Guangdong Basic and Applied Basic Research Foundation, grant number 2019A1515010719, and the Shenzhen Philosophy and Social Sciences Planning project, grant number SZ2019D016.
Conflicts of Interest
The authors declare no conflict of interest.
References
- Turk, Ž. Ten questions concerning building information modelling. Build. Environ. 2016, 107, 274–284. [Google Scholar] [CrossRef]
- Liao, L.; Teo, E.A.L.; Low, S.P. A project management framework for enhanced productivity performance using building information modelling. Constr. Econ. Build. 2017, 17, 1–26. [Google Scholar] [CrossRef] [Green Version]
- NIBS. United States National Building Information Modeling Standard Version 1-Part 1: Overview, Principles, and Methodologies; National Institute of Building Sciences: Washington, DC, USA, 2007. [Google Scholar]
- McAuley, B.; Hore, A.; West, R. BICP Global BIM Study–Lessons for Ireland’s BIM Programme; Dublin Institute of Technology: Dublin, Ireland, 2017. [Google Scholar]
- Juan, Y.K.; Lai, W.Y.; Shih, S.G. Building information modeling acceptance and readiness assessment in Taiwanese architectural firms. J. Civ. Eng. Manag. 2017, 23, 356–367. [Google Scholar] [CrossRef] [Green Version]
- Liao, L.; Teo, E.A.L.; Low, S.P. Assessing building information modeling implementation readiness in building projects in Singapore: A fuzzy synthetic evaluation approach. Eng. Constr. Archit. Manag. 2020, 27, 700–724. [Google Scholar] [CrossRef]
- Cheng, J.C.; Lu, Q. A review of the efforts and roles of the public sector for BIM adoption worldwide. J. Inf. Technol. Constr. 2015, 20, 442–478. [Google Scholar]
- Lam, S.W. The Singapore BIM Roadmap. In Proceedings of the Government BIM Symposium 2014, Singapore, 13 October 2014; Available online: http://bimsg.org/wp-content/uploads/2014/10/BIM-SYMPOSIUM_MR-LAM-SIEW-WAH_Oct-13-v6.pdf (accessed on 18 December 2019).
- BCA. Reaching New Milestones with Design for Manufacturing and Assembly, Build Smart; Building and Construction Authority: Singapore, 2016. [Google Scholar]
- BCA. Construction Industry Transformation Map 2017. Available online: https://www1.bca.gov.sg/buildsg/construction-industry-transformation-map-ITM (accessed on 18 December 2019).
- Love, P.E.D.; Irani, Z.; Smith, J.; Regan, M.; Liu, J. Cost performance of public infrastructure projects: The nemesis and nirvana of change-orders. Prod. Plan. Control 2017, 28, 1081–1092. [Google Scholar] [CrossRef] [Green Version]
- Economic Strategies Committee. Report of the Economic Strategies Committee; Economic Strategies Committee: Singapore, 2010. [Google Scholar]
- Autodesk. A Framework for Implementing A BIM Business Transformation; Autodesk, Inc.: San Rafael, CA, USA, 2012. [Google Scholar]
- Sattineni, A.; Mead, K. Coordination Guidelines for Virtual Design and Construction. In Proceedings of the 30th International Symposium on Automation and Robotics in Construction, Montreal, MTL, Canada, 11–15 August 2013. [Google Scholar]
- Zahrizan, Z.; Ali, N.M.; Haron, A.T.; Marshall-Ponting, A.; Hamid, Z.A. Exploring the adoption of building information modelling (BIM) in the Malaysian construction industry: A qualitative approach. Int. J. Res. Eng. Technol. 2013, 2, 384–395. [Google Scholar]
- Kiani, I.; Sadeghifam, A.N.; Ghomi, S.K.; Marsono, A.K.B. Barriers to implementation of building information modeling in scheduling and planning phase in Iran. Aust. J. Basic Appl. Sci. 2015, 9, 91–97. [Google Scholar]
- Liao, L.; Teo, E.A.L. Organizational change perspective on people management in BIM implementation in building projects. J. Manag. Eng. 2018, 34, 04018008. [Google Scholar] [CrossRef]
- Zhao, X.; Pienaar, J.; Gao, S. Critical risks associated with BIM adoption: A case of Singapore. In Proceedings of the 21st International Symposium on Advancement of Construction Management and Real Estate; Springer: Singapore, 2018; pp. 585–596. [Google Scholar]
- Khosrowshahi, F.; Arayici, Y. Roadmap for implementation of BIM in the UK construction industry. Eng. Constr. Archit. Manag. 2012, 19, 610–635. [Google Scholar] [CrossRef] [Green Version]
- Kunz, J.; Fischer, M. Virtual Design and Construction: Themes, Case Studies and Implementation Suggestions; Stanford University: Stanford, CA, USA, 2012. [Google Scholar]
- Won, J.; Lee, G.; Dossick, C.; Messner, J. Where to focus for successful adoption of building information modeling within organization. J. Constr. Eng. Manag. 2013, 139, 04013014. [Google Scholar] [CrossRef] [Green Version]
- Oo, T.Z. Critical Success Factors for Application of BIM for Singapore Architectural Firms. Master’s Thesis, Heriot-Watt University, Edinburgh, UK, 2014. [Google Scholar]
- Hwang, B.G.; Zhao, X.; Yang, K.W. Effect of BIM on rework in construction projects in Singapore: Status quo, magnitude, impact, and strategies. J. Constr. Eng. Manag. 2019, 145, 04018125. [Google Scholar] [CrossRef]
- AIA. AIACC. Integrated Project Delivery: A Guide; American Institute of Architects: Sacramento, CA, USA, 2007. [Google Scholar]
- AIA. AIACC. Experiences in Collaboration: On the Path to IPD; American Institute of Architects: Sacramento, CA, USA, 2009. [Google Scholar]
- Almuntaser, T.; Sanni-Anibire, M.O.; Hassanain, M.A. Adoption and implementation of BIM–case study of a Saudi Arabian AEC firm. Int. J. Manag. Proj. Bus. 2018, 11, 608–624. [Google Scholar] [CrossRef]
- Aranda-Mena, G.; Crawford, J.; Chevez, A.; Froese. T. Building information modelling demystified: Does it make business sense to adopt BIM? Int. J. Manag. Proj. Bus. 2009, 2, 419–434. [Google Scholar] [CrossRef] [Green Version]
- Arayici, Y.; Coates, P.; Koskela, L.; Kagioglou, M.; Usher, C.; O’Reilly, K. BIM adoption and implementation for architectural practices. Struct. Surv. 2011, 29, 7–25. [Google Scholar] [CrossRef] [Green Version]
- Autodesk. Improving Building Industry Results through Integrated Project Delivery and Building Information Modeling; Autodesk, Inc.: San Rafael, CA, USA, 2008. [Google Scholar]
- Azhar, N.; Kang, Y.; Ahmad, I.U. Factors influencing integrated project delivery in publicly owned construction projects: An information modelling perspective. Procedia Eng. 2014, 77, 213–221. [Google Scholar] [CrossRef] [Green Version]
- Bernstein, H.M.; Jones, S.A.; Russo, M.A. The Business Value of BIM in North America: Multi-Year Trend Analysis and User Rating; McGraw-Hill Construction: Bedford, MA, USA, 2012. [Google Scholar]
- Blismas, N.; Wakefield, R. Drivers, constraints and the future of offsite manufacture in Australia. Constr. Innov. 2009, 9, 72–83. [Google Scholar] [CrossRef] [Green Version]
- Chelson, D.E. The Effects of Building Information Modeling on Construction Site Productivity. Ph.D. Thesis, University of Maryland, College Park, MD, USA, 2010. [Google Scholar]
- Eastman, C.; Teicholz, P.; Sacks, R.; Liston, K. BIM Handbook: A Guide to Building Information Modeling for Owners, Managers, Designers, Engineers and Contractors, 2nd ed.; John Wiley & Sons: New Jersey, NJ, USA, 2011. [Google Scholar]
- Fan, S.L.; Lee, C.Y.; Chong, H.Y.; Skibniewski, M.J. A critical review of legal issues and solutions associated with building information modelling. Technol. Econ. Dev. Econ. 2018, 24, 2098–2130. [Google Scholar] [CrossRef] [Green Version]
- Fischer, M.; Reed, D.; Khanzode, A.; Ashcraft, H. A Simple Framework for Integrated Project Delivery. In Proceedings of the 22nd Annual Conference of the International Group for Lean Construction, Oslo, Norway, 25–27 June 2014; Kalsaas, B.T., Koskela, L., Saurin, T.A., Eds.; pp. 1319–1330. [Google Scholar]
- Fischer, M. Reshaping the Life Cycle Process with Virtual Design and Construction Methods. In Virtual Futures for Design, Construction and Procurement; Brandon, P., Kocatürk, T., Eds.; Blackwell Publishing Ltd: Malden, MA, USA, 2008; pp. 104–112. [Google Scholar]
- Forsythe, P.; Sankaran, S.; Biesenthal, C. How far can BIM reduce information asymmetry in the Australian construction context? Proj. Manag. J. 2015, 46, 75–87. [Google Scholar] [CrossRef]
- Gao, J.; Fischer, M. Case Studies on the Implementation and Impacts of Virtual Design and Construction (VDC) in Finland; Stanford University: Stanford, CA, USA, 2006. [Google Scholar]
- Ghaffarianhoseini, A.; Tookey, J.; Ghaffarianhoseini, A.; Naismith, N.; Azhar, S.; Efimova, O.; Raahemifar, K. Building information modelling (BIM) uptake: Clear benefits, understanding its implementation, risks and challenges. Renew. Sustain. Energy Rev. 2017, 75, 1046–1053. [Google Scholar] [CrossRef]
- Gibb, A.; Isack, F. Re-engineering through pre-assembly: Client expectations and drivers. Build. Res. Inf. 2003, 31, 146–160. [Google Scholar] [CrossRef] [Green Version]
- Kent, D.C.; Becerik-Gerber, B. Understanding construction industry experience and attitudes toward integrated project delivery. J. Constr. Eng. Manag. 2010, 136, 815–825. [Google Scholar] [CrossRef]
- McFarlane, A.; Stehle, J. DfMA: Engineering the Future. In Proceedings of the Council on Tall Buildings and Urban Habitat (CTBUH) 2014 Shanghai Conference, Shanghai, China, 16 September 2014; pp. 508–516. [Google Scholar]
- Miettinen, R.; Paavola, S. Beyond the BIM utopia: Approaches to the development and implementation of building information modeling. Autom. Constr. 2014, 43, 84–91. [Google Scholar] [CrossRef]
- Porwal, A.; Hewage, K.N. Building information modeling (BIM) partnering framework for public construction projects. Autom. Constr. 2013, 31, 204–214. [Google Scholar] [CrossRef]
- Ross, K.; Cartwright, P.; Novakovic, O. A Guide to Modern Methods of Construction; NHBC Foundation, IHS BRE Press: Bucks, UK, 2006. [Google Scholar]
- AIACC. Integrated Project Delivery: An Updated Working Definition; American Institute of Architects, California Council: Sacramento, CA, USA, 2014. [Google Scholar]
- BCA. Singapore BIM Guide Version 2; Building and Construction Authority: Singapore, 2013. [Google Scholar]
- Blismas, N.; Pasquire, C.; Gibb, A. Benefit evaluation for off-site production in construction. Constr. Manag. Econ. 2006, 24, 121–130. [Google Scholar] [CrossRef] [Green Version]
- Chua, D.K.; Yeoh, J.K. Understanding the Science of Virtual Design and Construction: What It Takes to Go Beyond Building Information Modelling. In Proceedings of the 2015 ASCE International Workshop on Computing in Civil Engineering, Austin, TX, USA, 21–23 June 2015; O’Brien, W.J., Ponticelli, S., Eds.; American Society of Civil Engineers: Reston, VA, USA, 2015; pp. 692–699. [Google Scholar]
- Khanzode, A.; Fisher, M.; Reed, D. Challenges and Benefits of Implementing Virtual Design and Construction Technologies for Coordination of Mechanical, Electrical, and Plumbing Systems on Large Healthcare Project. In Proceedings of 24th CIB W78 Conference; University of Maribor: Maribor, Slovenia, 2007; pp. 205–212. [Google Scholar]
- Li, H.; Lu, W.; Huang, T. Rethinking project management and exploring virtual design and construction as a potential solution. Constr. Manag. Econ. 2009, 27, 363–371. [Google Scholar] [CrossRef]
- Teo, E.A.L.; Chan, S.L.; Tan, P.H. Empirical investigation into factors affecting exporting construction services in SMEs in Singapore. J. Constr. Eng. Manag. 2007, 133, 582–591. [Google Scholar] [CrossRef]
- Hwang, B.G.; Zhu, L.; Tan, J.S.H. Identifying critical success factors for green business parks: Case study of Singapore. J. Manag. Eng. 2017, 33, 04017023. [Google Scholar] [CrossRef]
- Shan, M.; Chan, A.P.C.; Le, Y.; Hu, Y. Investigating the effectiveness of response strategies for vulnerabilities to corruption in the Chinese public construction sector. Sci. Eng. Ethics 2015, 21, 683–705. [Google Scholar] [CrossRef]
- Zhao, X.; Hwang, B.G.; Low, S.P. Enterprise risk management in international construction firms: Drivers and hindrances. Eng. Constr. Archit. Manag. 2015, 22, 347–366. [Google Scholar] [CrossRef]
- BCA. BIM Particular Conditions Version 2; Building and Construction Authority: Singapore, 2015. [Google Scholar]
- Zhao, X.; Feng, Y.; Pienaar, J.; O’Brien, D. Modelling paths of risks associated with BIM implementation in architectural, engineering and construction projects. Archit. Sci. Rev. 2017, 60, 472–482. [Google Scholar] [CrossRef]
- Zhao, X.; Hwang, B.G.; Yu, G.S. Identifying the critical risks in underground rail international construction joint ventures: Case study of Singapore. Int. J. Proj. Manag. 2013, 31, 554–566. [Google Scholar] [CrossRef]
- Anumba, C.; Dubler, C.; Goodman, S.; Kasprzak, C.; Kreider, R.; Messner, J.; Saluja, C.; Zikic, N. BIM Project Execution Planning Guide-Version 2.0; Pennsylvania State University: University Park, PA, USA, 2010. [Google Scholar]
- Matthews, J.; Love, P.E.D.; Mewburn, J.; Stobaus, C.; Ramanayaka, C. Building information modelling in construction: Insights from collaboration and change management perspectives. Prod. Plan. Control 2018, 29, 202–216. [Google Scholar] [CrossRef]
- Yuan, H.; Yang, Y.; Xue, X. Promoting owners’ BIM adoption behaviors to achieve sustainable project management. Sustainability 2019, 11, 3905. [Google Scholar] [CrossRef] [Green Version]
- Liao, L.; Teo, E.A.L.; Chang, R.; Li, L. Investigating critical non-value adding activities and their resulting wastes in BIM-based project delivery. Sustainability 2020, 12, 355. [Google Scholar] [CrossRef] [Green Version]
- Shou, W.; Wang, J.; Wu, P.; Wang, X. Lean management framework for improving maintenance operation: Development and application in the oil and gas industry. Prod. Plan. Control 2020, 1–18. [Google Scholar] [CrossRef]
- Walker, D.; Lloyd-Walker, B. The future of the management of projects in the 2030s. Int. J. Manag. Proj. Bus. 2019, 12, 242–266. [Google Scholar] [CrossRef]
- Zhao, X.; Ke, Y.; Zuo, J.; Xiong, W.; Wu, P. Evaluation of sustainable transport research in 2000–2019. J. Clean. Prod. 2020, 256, 120404. [Google Scholar] [CrossRef]
Figure 1.
Research methodology.
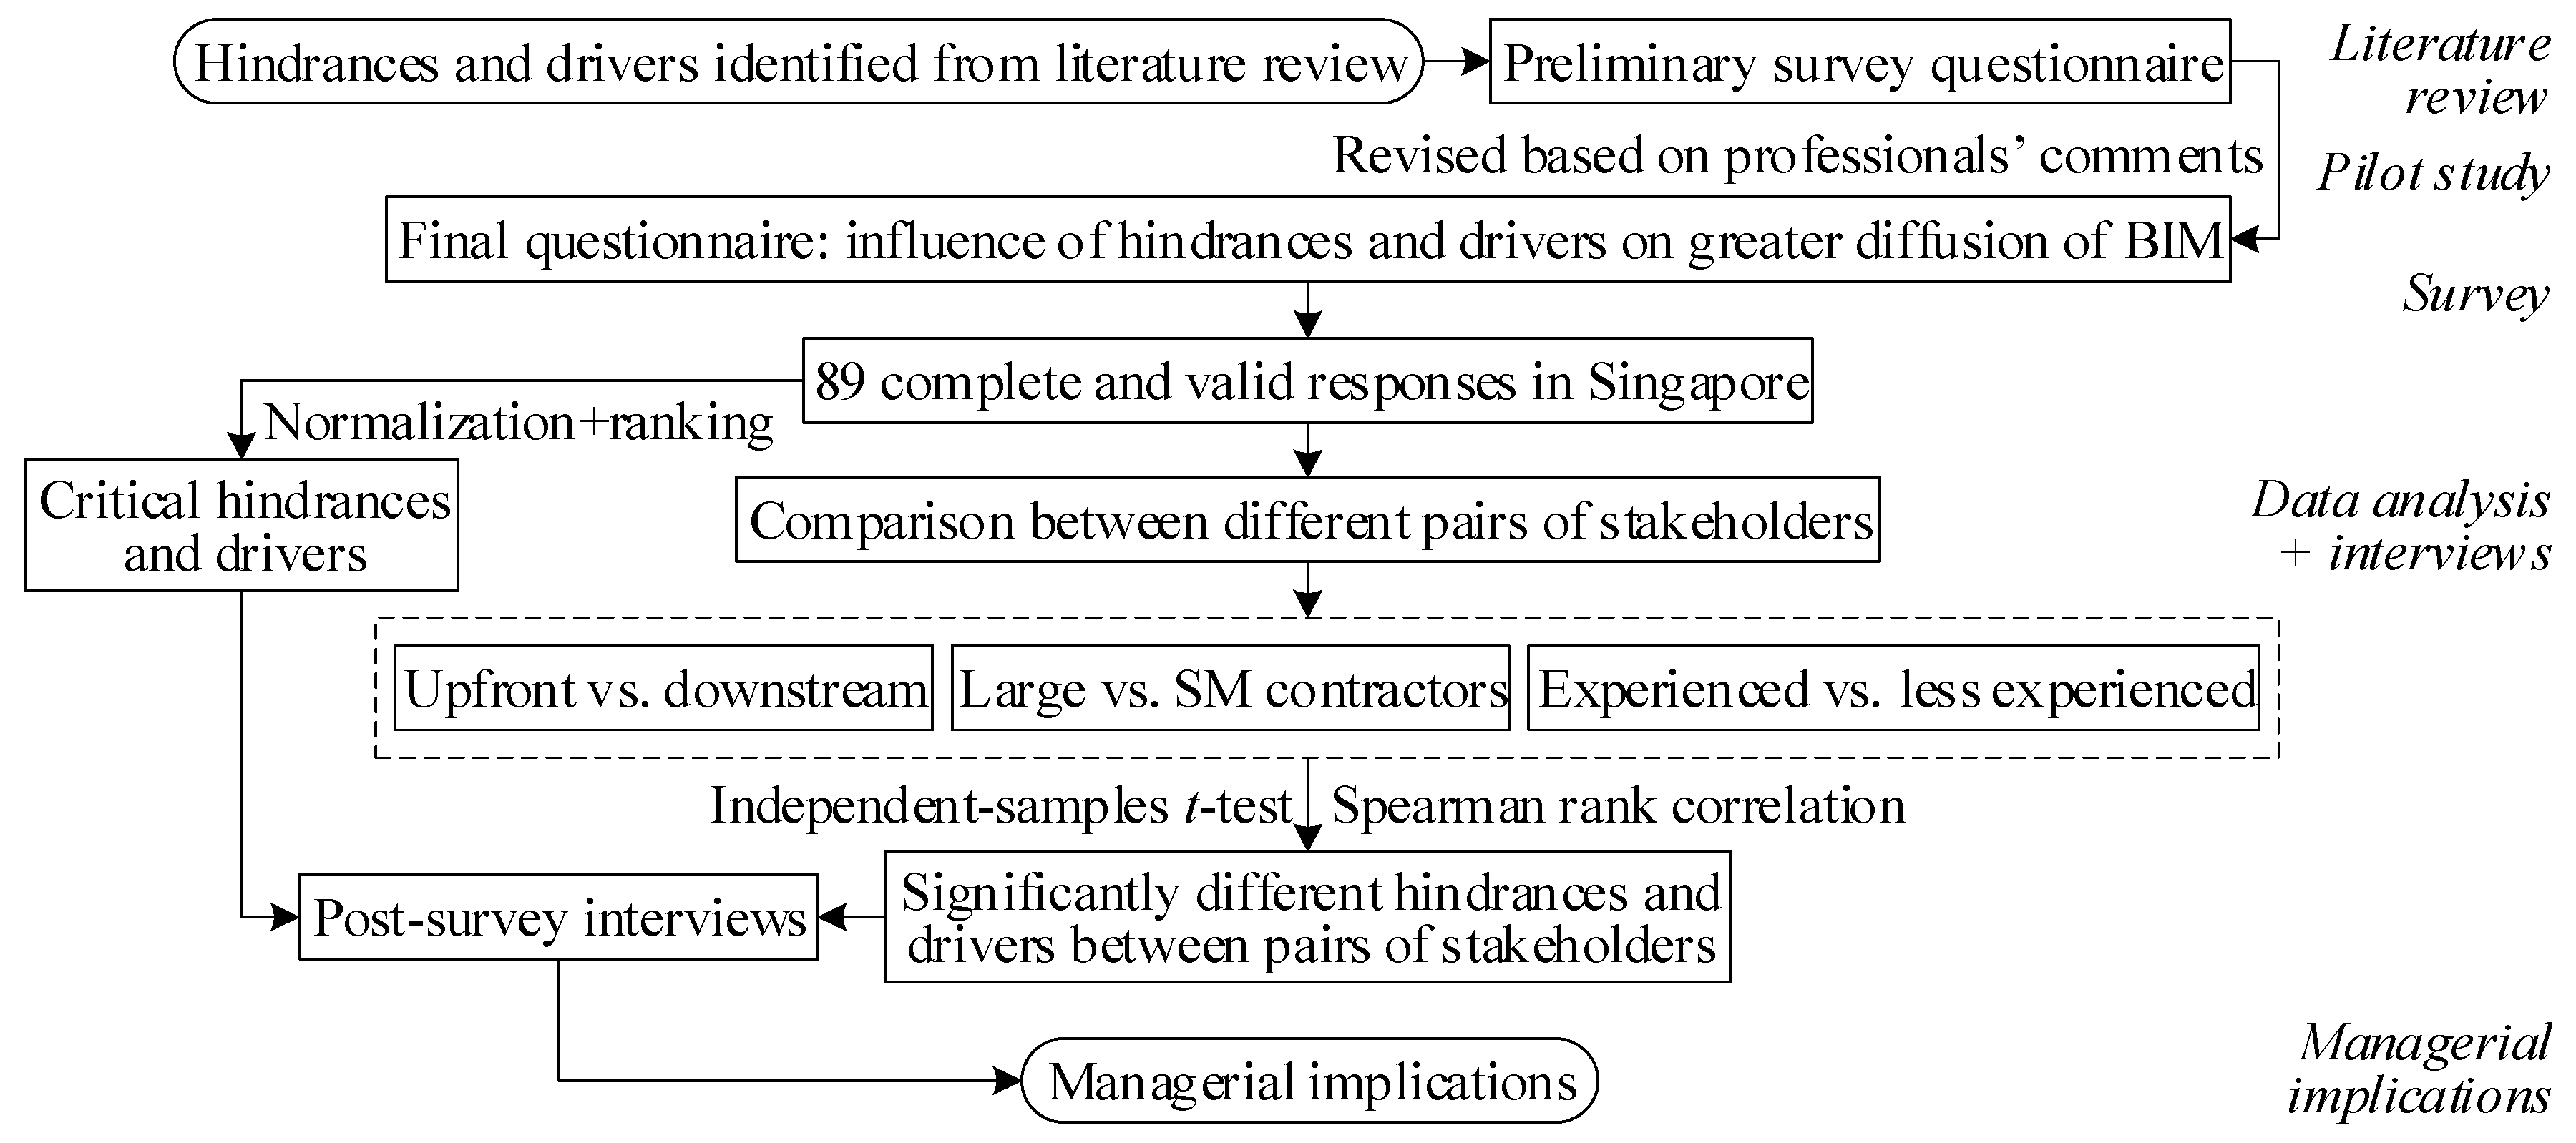
Figure 2.
Mean score comparison of hindrances to BIM implementation by BIM implementation experience.
Figure 2.
Mean score comparison of hindrances to BIM implementation by BIM implementation experience.

Table 1.
Hindrances to BIM implementation.
| Code | Hindrances to BIM Implementation | References | ||||||||||||||||||||||||||||||
|---|---|---|---|---|---|---|---|---|---|---|---|---|---|---|---|---|---|---|---|---|---|---|---|---|---|---|---|---|---|---|---|---|
| 1 | 2 | 3 | 4 | 5 | 6 | 7 | 8 | 9 | 10 | 11 | 12 | 13 | 14 | 15 | 16 | 17 | 18 | 19 | 20 | 21 | 22 | 23 | 24 | 25 | 26 | 27 | 28 | 29 | 30 | 31 | ||
| H01 | Executives failing to recognize the value of BIM-based processes and needing training | √ | √ | √ | √ | √ | √ | √ | ||||||||||||||||||||||||
| H02 | Concerns over or uninterested in sharing liabilities and financial rewards | √ | √ | √ | √ | √ | ||||||||||||||||||||||||||
| H03 | Construction lawyers and insurers lacking understanding of roles/responsibilities in BIM practices | √ | √ | √ | √ | |||||||||||||||||||||||||||
| H04 | Lack of skilled employees and need for training them on BIM and OSM | √ | √ | √ | √ | √ | √ | √ | √ | √ | √ | √ | √ | √ | √ | √ | √ | √ | ||||||||||||||
| H05 | Industry’s conservativeness, fear of the unknown, and resistance to changing comfortable routines | √ | √ | √ | √ | √ | √ | √ | √ | √ | √ | |||||||||||||||||||||
| H06 | Employees still being reluctant to use new technology after being pushed to training programs | √ | √ | √ | ||||||||||||||||||||||||||||
| H07 | Entrenchment in two-dimensional drafting and unfamiliarity with using BIM | √ | √ | √ | √ | √ | √ | √ | √ | √ | √ | √ | ||||||||||||||||||||
| H08 | Financial benefits cannot outweigh implementation and maintenance costs | √ | √ | √ | √ | √ | √ | |||||||||||||||||||||||||
| H09 | Lack of sufficient evidence to warrant BIM use | √ | √ | √ | √ | √ | √ | |||||||||||||||||||||||||
| H10 | Liability of BIM, such as the liability for common data for subcontractors | √ | √ | √ | √ | √ | ||||||||||||||||||||||||||
| H11 | Resistance to corporate culture and structure changes in BIM wave | √ | √ | √ | √ | √ | √ | √ | √ | |||||||||||||||||||||||
| H12 | Need for all key stakeholders to be on board to exchange information | √ | √ | √ | √ | √ | √ | √ | √ | √ | √ | √ | ||||||||||||||||||||
| H13 | Lack of trust/transparency/communication/partnership and collaboration skills | √ | √ | √ | √ | √ | √ | √ | √ | √ | √ | √ | √ | √ | ||||||||||||||||||
| H14 | BIM operators lacking field knowledge | √ | √ | √ | √ | |||||||||||||||||||||||||||
| H15 | Field staff dislike BIM coordination meetings looking at a screen | √ | √ | √ | √ | |||||||||||||||||||||||||||
| H16 | Lack of consultants’ feedback on subcontractors’ model coordination | √ | ||||||||||||||||||||||||||||||
| H17 | Few benefits from BIM go to designers while most to contractors and owners | √ | ||||||||||||||||||||||||||||||
| H18 | Lack of legal support from authorities | √ | √ | √ | √ | √ | √ | |||||||||||||||||||||||||
| H19 | Lack of owner requests or initiative to adopt BIM | √ | √ | √ | √ | √ | ||||||||||||||||||||||||||
| H20 | Decision-making depending on relationships between project stakeholders | √ | √ | |||||||||||||||||||||||||||||
| H21 | Owners set minimal risk and minimum first cost as crucial selection criteria | √ | √ | √ | √ | |||||||||||||||||||||||||||
| H22 | Poor knowledge of using OSM and assessing its benefits | √ | ||||||||||||||||||||||||||||||
| H23 | Requiring higher onsite skills to deal with low-tolerance OSM interfaces | √ | ||||||||||||||||||||||||||||||
| H24 | OSM relies on suppliers to train contractors to install correctly | √ | ||||||||||||||||||||||||||||||
| H25 | Owners’ desire for particular structures or finishes when considering OSM | √ | ||||||||||||||||||||||||||||||
| H26 | Limited OSM expertise and market protection from traditional suppliers/manufacturers | √ | ||||||||||||||||||||||||||||||
| H27 | Contractual relationships among stakeholders and need for new frameworks | √ | √ | √ | √ | √ | √ | √ | √ | √ | √ | √ | √ | √ | √ | √ | √ | √ | ||||||||||||||
| H28 | Traditional contracts protect individualism rather than best-for-project thinking | √ | √ | √ | √ | |||||||||||||||||||||||||||
| H29 | Lack of effective data interoperability between project stakeholders | √ | √ | √ | √ | √ | √ | √ | √ | √ | √ | |||||||||||||||||||||
| H30 | Owners cannot receive low-price bids if requiring 3D models | √ | ||||||||||||||||||||||||||||||
| H31 | Firms’ unwillingness to invest in training due to initial cost and productivity loss | √ | √ | √ | √ | |||||||||||||||||||||||||||
| H32 | Assignment of responsibility/risk to constant updating for broadly accessible BIM information | √ | √ | √ | √ | |||||||||||||||||||||||||||
| H33 | Lack of standard contracts to deal with responsibility/risk assignment and BIM ownership | √ | √ | √ | √ | √ | √ | √ | √ | |||||||||||||||||||||||
| H34 | BIM model issues (such as ownership and management) | √ | √ | √ | √ | √ | ||||||||||||||||||||||||||
| H35 | Poor understanding of OSM process and its associated costs | √ | ||||||||||||||||||||||||||||||
| H36 | OSM requires design to be fixed early using BIM | √ | √ | |||||||||||||||||||||||||||||
| H37 | Seeing design fees of OSM as more expensive than the traditional process | √ | ||||||||||||||||||||||||||||||
| H38 | Difficulty in logistics and stock management of OSM | √ | √ | |||||||||||||||||||||||||||||
| H39 | Unclear legislations and qualifications for precasters and inadequate codes for OSM varieties | √ | ||||||||||||||||||||||||||||||
| H40 | Interpretations resulted from unclear contract documents | √ | ||||||||||||||||||||||||||||||
| H41 | Using monetary incentives for team collaboration results in blaming rather than resolving issues | √ | ||||||||||||||||||||||||||||||
| H42 | Costly investment in BIM hardware and software solutions | √ | √ | √ | √ | √ | √ | √ | √ | √ | ||||||||||||||||||||||
| H43 | Interoperability issues such as software selection and insufficient standards | √ | √ | √ | √ | √ | ||||||||||||||||||||||||||
| H44 | Need for increasingly specialized software for specialized functions | √ | √ | √ | √ | |||||||||||||||||||||||||||
| H45 | Difficulty in multi-discipline and construction-level integration | √ | √ | |||||||||||||||||||||||||||||
| H46 | Technical needs for multiuser model access in multi-discipline integration | √ | √ | √ | ||||||||||||||||||||||||||||
| H47 | Firms cannot make most use of Industry Foundation Classes and use proprietary formats | √ | √ | √ | ||||||||||||||||||||||||||||
References: 1 = American Institute of Architects and American Institute of Architects, California Council (AIA and AIACC) [24]; 2 = AIA and AIACC [25]; 3 = Almuntaser et al. [26]; 4 = Aranda-Mena et al. [27]; 5 = Arayici et al. [28]; 6 = Autodesk [29]; 7 = Autodesk [13]; 8 = Azhar et al. [30]; 9 = Bernstein et al. [31]; 10 = Blismas and Wakefield [32]; 11 = Chelson [33]; 12 = Eastman et al. [34]; 13 = Fan et al. [35]; 14 = Fischer et al. [36]; 15 = Fischer [37]; 16 = Forsythe et al. [38]; 17 = Gao and Fischer [39]; 18 = Ghaffarianhoseini et al. [40]; 19 = Gibb and Isack [41]; 20 = Juan et al. [5]; 21 = Kent and Becerik-Gerber [42]; 22 = Khosrowshahi and Arayici [19]; 23 = Kiani et al. [16]; 24 = Kunz and Fischer [20]; 25 = McFarlane and Stehle [43]; 26 = Miettinen and Paavola [44]; 27 = Porwal and Hewage [45]; 28 = Ross et al. [46]; 29 = Sattineni and Mead [14]; 30 = Turk [1]; 31 = Zahrizan et al. [15].
Table 2.
Drivers for BIM implementation.
| Code | Drivers for BIM Implementation | References | ||||||||||||||||||||||||||||||||
|---|---|---|---|---|---|---|---|---|---|---|---|---|---|---|---|---|---|---|---|---|---|---|---|---|---|---|---|---|---|---|---|---|---|---|
| 1 | 2 | 3 | 4 | 5 | 6 | 7 | 8 | 9 | 10 | 11 | 12 | 13 | 14 | 15 | 16 | 17 | 18 | 19 | 20 | 21 | 22 | 23 | 24 | 25 | 26 | 27 | 28 | 29 | 30 | 31 | 32 | 33 | ||
| D01 | BIM vision and leadership from the management | √ | √ | √ | √ | √ | √ | √ | √ | √ | ||||||||||||||||||||||||
| D02 | Organizational structure and culture changes in BIM wave | √ | √ | √ | √ | √ | √ | √ | √ | |||||||||||||||||||||||||
| D03 | Stakeholders seeing the value of adopting their own part of BIM | √ | √ | √ | √ | √ | √ | √ | √ | √ | ||||||||||||||||||||||||
| D04 | Training on new skillsets and new ways of working such as BIM management certification courses | √ | √ | √ | √ | √ | √ | √ | √ | √ | √ | √ | √ | √ | √ | √ | ||||||||||||||||||
| D05 | Owner’s requirement and leadership to adopt BIM | √ | √ | √ | √ | √ | √ | √ | √ | |||||||||||||||||||||||||
| D06 | Regulatory agencies’ early participation in BIM use | √ | √ | √ | √ | |||||||||||||||||||||||||||||
| D07 | Gaining competitive advantages from successful BIM use | √ | √ | √ | √ | |||||||||||||||||||||||||||||
| D08 | All disciplines work together and share models | √ | √ | √ | √ | √ | √ | √ | √ | √ | √ | √ | √ | √ | ||||||||||||||||||||
| D09 | Government support such as subsidizing training, software, and consultancy costs | √ | √ | √ | √ | √ | √ | |||||||||||||||||||||||||||
| D10 | Enabling subcontractors to use lower-skilled labor on site | √ | √ | √ | ||||||||||||||||||||||||||||||
| D11 | OSM lowering safety risks by controlling work in factory | √ | √ | √ | √ | |||||||||||||||||||||||||||||
| D12 | Alignment of all stakeholders’ interests | √ | √ | |||||||||||||||||||||||||||||||
| D13 | Governance of BIM-related policies, standards, and guidelines | √ | √ | √ | √ | √ | ||||||||||||||||||||||||||||
| D14 | Data sharing and access on BIM platforms | √ | √ | √ | √ | √ | √ | √ | √ | √ | √ | |||||||||||||||||||||||
| D15 | 3D visualization enabling design communication | √ | √ | √ | √ | √ | √ | √ | √ | √ | ||||||||||||||||||||||||
| D16 | Four-dimensional simulation before construction | √ | √ | √ | √ | √ | √ | √ | √ | |||||||||||||||||||||||||
| D17 | Design coordination between disciplines through clash detection and resolution | √ | √ | √ | √ | √ | √ | √ | √ | √ | √ | √ | √ | √ | √ | √ | √ | √ | ||||||||||||||||
| D18 | Complex design analysis in sustainability, material selection, and constructability | √ | √ | √ | √ | √ | √ | √ | √ | √ | √ | |||||||||||||||||||||||
| D19 | Better cost estimation and control in project lifecycle | √ | √ | √ | √ | |||||||||||||||||||||||||||||
| D20 | Enabling convenient production of models and drawings for construction and fabrication | √ | √ | √ | √ | √ | √ | √ | √ | √ | ||||||||||||||||||||||||
| D21 | High accuracy of model-based documentation | √ | √ | √ | ||||||||||||||||||||||||||||||
| D22 | Enabling more off-site fabrication and assembly of standard elements | √ | √ | √ | √ | √ | √ | √ | ||||||||||||||||||||||||||
| D23 | Automatic model updating and drawing production to deal with design changes and their implications | √ | √ | √ | ||||||||||||||||||||||||||||||
| D24 | Lifecycle information management improving operations and maintenance | √ | √ | √ | √ | √ | √ | |||||||||||||||||||||||||||
| D25 | Increasing use of design-build and fast-track approach | √ | √ | |||||||||||||||||||||||||||||||
| D26 | On-site work proceeds in parallel with off-site production | √ | √ | √ | √ | |||||||||||||||||||||||||||||
| D27 | OSM standardizes design and manufacturing processes, simplifying construction and testing and commissioning processes | √ | √ | √ | √ | |||||||||||||||||||||||||||||
| D28 | OSM produces building elements with better quality and consistency | √ | √ | √ | ||||||||||||||||||||||||||||||
| D29 | OSM reduces building waste, especially on-site waste | √ | √ | √ | ||||||||||||||||||||||||||||||
| D30 | Integrating model management tools with stakeholders’ enterprise systems to exchange data | √ | ||||||||||||||||||||||||||||||||
| D31 | Increasing complexity in buildings, project delivery, and marketplace | √ | √ | √ | √ | |||||||||||||||||||||||||||||
| D32 | New technologies such as computer numerically controlled machines | √ | √ | √ | √ | √ | ||||||||||||||||||||||||||||
References: 1 = AIACC [47]; 2 = Almuntaser et al. [26]; 3 = Aranda-Mena et al. [27]; 4 = Arayici et al. [28]; 5 = Autodesk [13]; 6 = Azhar et al. [30]; 7 = BCA [48]; 8 = Blismas and Wakefield [32]; 9 = Blismas et al. [49]; 10 = Cheng and Lu [7]; 11 = Chua and Yeoh [50]; 12 = Eastman et al. [34]; 13 = Fischer [37]; 14 = Forsythe et al. [38]; 15 = Gao and Fischer [39]; 16 = Ghaffarianhoseini et al. [40]; 17 = Gibb and Isack [41]; 18 = Juan et al. [5]; 19 = Kent and Becerik-Gerber [42]; 20 = Khanzode et al. [51]; 21 = Khosrowshahi and Arayici [19]; 22 = Kiani et al. [16]; 23 = Kunz and Fischer [20]; 24 = Li et al. [52]; 25 = McFarlane and Stehle [43]; 26 = Miettinen and Paavola [44]; 27 = Oo [22]; 28 = Porwal and Hewage [45]; 29 = Ross et al. [46]; 30 = Sattineni and Mead [14]; 31 = Turk [1]; 32 = Won et al. [21]; 33 = Zahrizan et al. [15].
Table 3.
Profile of the respondents and their organizations.
| Characteristics | Categorization | N | % |
|---|---|---|---|
| Respondents | |||
| Work experience | 5–10 years | 40 | 44.9 |
| 11–15 years | 11 | 12.4 | |
| 16–20 years | 8 | 9.0 | |
| 21–25 years | 9 | 10.1 | |
| >25 years | 21 | 23.6 | |
| Organizations | |||
| Main business | Architectural firm | 18 | 20.2 |
| Structural engineering firm | 6 | 6.7 | |
| MEP engineering firm | 13 | 14.6 | |
| General construction firm | 30 | 33.7 | |
| Trade construction firm | 3 | 3.4 | |
| Facility management firm | 3 | 3.4 | |
| Others | 16 | 18.0 | |
| Years of BIM implementation | 0 year | 10 | 11.2 |
| 1–3 years | 42 | 47.2 | |
| 4–5 years | 22 | 24.7 | |
| 6–10 years | 13 | 14.6 | |
| >10 years | 2 | 2.2 | |
| BCA financial grade * | A1 | 27 | 30.3 |
| A2 | 2 | 2.2 | |
| B1 | 1 | 1.1 | |
| C1 | 1 | 1.1 | |
| C3 | 3 | 3.4 | |
| Single grade | 2 | 2.2 | |
| L6 | 5 | 5.6 | |
| L3 | 1 | 1.1 | |
| Not applicable | 47 | 52.8 | |
* A1/L6/Single grade contractors enjoyed no tendering limit; A2, B1, C1/L3, and C3 contractors could bid for projects worth up to S$90 million, S$42 million, S$4.2 million, and S$0.7 million, respectively.
Table 4.
Overall ranking of the hindrances to BIM implementation and comparison by project stakeholder.
Table 4.
Overall ranking of the hindrances to BIM implementation and comparison by project stakeholder.
| Code | Overall (N = 89) | Mean Comparison | p-Value | |||
|---|---|---|---|---|---|---|
| Mean | Rank | Normalization * | Upfront (N = 45) | Downstream (N = 44) | ||
| H01 | 3.64 | 8 | 0.76 | 3.71 | 3.57 | 0.550 |
| H02 | 3.48 | 21 | 0.51 | 3.62 | 3.34 | 0.242 |
| H03 | 3.26 | 41 | 0.15 | 3.36 | 3.16 | 0.399 |
| H04 | 3.69 | 3 | 0.84 | 3.84 | 3.52 | 0.201 |
| H05 | 3.69 | 3 | 0.84 | 3.80 | 3.57 | 0.338 |
| H06 | 3.42 | 28 | 0.40 | 3.56 | 3.27 | 0.221 |
| H07 | 3.69 | 3 | 0.84 | 3.82 | 3.55 | 0.268 |
| H08 | 3.37 | 33 | 0.33 | 3.49 | 3.25 | 0.339 |
| H09 | 3.54 | 13 | 0.60 | 3.76 | 3.32 | 0.075 |
| H10 | 3.33 | 37 | 0.25 | 3.44 | 3.20 | 0.334 |
| H11 | 3.43 | 23 | 0.42 | 3.49 | 3.36 | 0.606 |
| H12 | 3.79 | 1 | 1.00 | 4.00 | 3.57 | 0.067 |
| H13 | 3.33 | 37 | 0.25 | 3.47 | 3.18 | 0.243 |
| H14 | 3.62 | 11 | 0.73 | 3.78 | 3.45 | 0.220 |
| H15 | 3.43 | 23 | 0.42 | 3.67 | 3.18 | 0.033 ** |
| H16 | 3.34 | 35 | 0.27 | 3.64 | 3.02 | 0.007 ** |
| H17 | 3.17 | 46 | 0.00 | 3.36 | 2.98 | 0.128 |
| H18 | 3.20 | 45 | 0.05 | 3.24 | 3.16 | 0.714 |
| H19 | 3.43 | 23 | 0.42 | 3.47 | 3.39 | 0.751 |
| H20 | 3.28 | 40 | 0.18 | 3.44 | 3.11 | 0.160 |
| H21 | 3.35 | 34 | 0.29 | 3.31 | 3.39 | 0.744 |
| H22 | 3.34 | 35 | 0.27 | 3.31 | 3.36 | 0.808 |
| H23 | 3.42 | 28 | 0.40 | 3.33 | 3.50 | 0.417 |
| H24 | 3.26 | 41 | 0.15 | 3.27 | 3.25 | 0.946 |
| H25 | 3.17 | 46 | 0.00 | 3.20 | 3.14 | 0.787 |
| H26 | 3.42 | 28 | 0.40 | 3.36 | 3.48 | 0.606 |
| H27 | 3.71 | 2 | 0.87 | 3.73 | 3.68 | 0.831 |
| H28 | 3.65 | 7 | 0.78 | 3.69 | 3.61 | 0.763 |
| H29 | 3.43 | 23 | 0.42 | 3.69 | 3.16 | 0.019 ** |
| H30 | 3.31 | 39 | 0.24 | 3.51 | 3.11 | 0.105 |
| H31 | 3.63 | 10 | 0.75 | 3.82 | 3.43 | 0.085 |
| H32 | 3.52 | 17 | 0.56 | 3.62 | 3.41 | 0.307 |
| H33 | 3.54 | 13 | 0.60 | 3.60 | 3.48 | 0.583 |
| H34 | 3.53 | 15 | 0.58 | 3.71 | 3.34 | 0.078 |
| H35 | 3.51 | 19 | 0.55 | 3.49 | 3.52 | 0.884 |
| H36 | 3.49 | 20 | 0.53 | 3.53 | 3.45 | 0.737 |
| H37 | 3.45 | 22 | 0.45 | 3.51 | 3.39 | 0.564 |
| H38 | 3.40 | 31 | 0.38 | 3.47 | 3.34 | 0.584 |
| H39 | 3.25 | 43 | 0.13 | 3.40 | 3.09 | 0.152 |
| H40 | 3.39 | 32 | 0.36 | 3.58 | 3.20 | 0.080 |
| H41 | 3.22 | 44 | 0.09 | 3.38 | 3.07 | 0.153 |
| H42 | 3.66 | 6 | 0.80 | 3.73 | 3.59 | 0.568 |
| H43 | 3.52 | 17 | 0.56 | 3.58 | 3.45 | 0.603 |
| H44 | 3.43 | 23 | 0.42 | 3.49 | 3.36 | 0.596 |
| H45 | 3.53 | 15 | 0.58 | 3.73 | 3.32 | 0.074 |
| H46 | 3.64 | 8 | 0.76 | 3.73 | 3.55 | 0.444 |
| H47 | 3.56 | 12 | 0.64 | 3.69 | 3.43 | 0.232 |
* Normalized value = (mean − minimum mean)/(maximum mean − minimum mean); ** the independent-samples t-test was statistically significant at the 0.05 level (two-tailed).
Table 5.
Overall ranking of the drivers for BIM implementation.
| Code | Overall (N = 89) | Code | Overall (N = 89) | ||||
|---|---|---|---|---|---|---|---|
| Mean | Rank | Normalization * | Mean | Rank | Normalization * | ||
| D01 | 3.99 | 1 | 1.00 | D17 | 3.92 | 2 | 0.94 |
| D02 | 3.64 | 11 | 0.69 | D18 | 3.45 | 19 | 0.52 |
| D03 | 3.71 | 9 | 0.75 | D19 | 3.26 | 30 | 0.34 |
| D04 | 3.82 | 4 | 0.85 | D20 | 3.75 | 7 | 0.79 |
| D05 | 3.90 | 3 | 0.92 | D21 | 3.58 | 15 | 0.64 |
| D06 | 3.76 | 6 | 0.80 | D22 | 3.53 | 17 | 0.59 |
| D07 | 3.79 | 5 | 0.82 | D23 | 3.48 | 18 | 0.55 |
| D08 | 3.63 | 12 | 0.68 | D24 | 3.29 | 27 | 0.37 |
| D09 | 3.69 | 10 | 0.73 | D25 | 3.35 | 23 | 0.42 |
| D10 | 2.88 | 32 | 0.00 | D26 | 3.28 | 28 | 0.36 |
| D11 | 3.30 | 26 | 0.38 | D27 | 3.26 | 30 | 0.34 |
| D12 | 3.44 | 21 | 0.51 | D28 | 3.31 | 24 | 0.39 |
| D13 | 3.57 | 16 | 0.63 | D29 | 3.27 | 29 | 0.35 |
| D14 | 3.62 | 13 | 0.67 | D30 | 3.60 | 14 | 0.65 |
| D15 | 3.75 | 7 | 0.79 | D31 | 3.40 | 22 | 0.47 |
| D16 | 3.45 | 19 | 0.52 | D32 | 3.31 | 24 | 0.39 |
* Normalized value = (mean − minimum mean)/(maximum mean − minimum mean).
Table 6.
Comparison of drivers for BIM implementation by construction firm size and BIM experience.
| Code | Mean Comparison | p-Value | Mean Comparison | p-Value | ||
|---|---|---|---|---|---|---|
| Large Contractors (N = 34) | Small-Medium Contractors (N = 8) | Experienced (N = 37) | Less Experienced (N = 52) | |||
| D01 | 3.91 | 4.25 | 0.487 | 4.24 | 3.81 | 0.102 |
| D02 | 3.56 | 3.25 | 0.524 | 3.89 | 3.46 | 0.093 |
| D03 | 3.59 | 3.38 | 0.666 | 4.00 | 3.50 | 0.048 * |
| D04 | 3.91 | 3.13 | 0.074 | 4.05 | 3.65 | 0.089 |
| D05 | 4.06 | 3.13 | 0.034 * | 4.08 | 3.77 | 0.201 |
| D06 | 3.79 | 3.00 | 0.083 | 4.00 | 3.60 | 0.066 |
| D07 | 4.09 | 3.38 | 0.107 | 3.95 | 3.67 | 0.209 |
| D08 | 3.94 | 3.00 | 0.024 * | 3.73 | 3.56 | 0.453 |
| D09 | 3.71 | 2.88 | 0.081 | 3.76 | 3.63 | 0.642 |
| D10 | 2.76 | 2.25 | 0.227 | 3.00 | 2.79 | 0.398 |
| D11 | 3.50 | 2.75 | 0.089 | 3.49 | 3.17 | 0.166 |
| D12 | 3.44 | 2.75 | 0.086 | 3.59 | 3.33 | 0.230 |
| D13 | 3.71 | 2.88 | 0.076 | 3.78 | 3.42 | 0.138 |
| D14 | 3.62 | 3.00 | 0.151 | 3.84 | 3.46 | 0.110 |
| D15 | 3.91 | 3.00 | 0.038 * | 3.97 | 3.60 | 0.105 |
| D16 | 3.71 | 2.38 | 0.001 * | 3.43 | 3.46 | 0.901 |
| D17 | 4.12 | 3.00 | 0.008 * | 4.08 | 3.81 | 0.241 |
| D18 | 3.56 | 2.88 | 0.094 | 3.54 | 3.38 | 0.512 |
| D19 | 3.24 | 2.63 | 0.119 | 3.38 | 3.17 | 0.340 |
| D20 | 3.85 | 3.25 | 0.201 | 4.00 | 3.58 | 0.063 |
| D21 | 3.68 | 3.00 | 0.122 | 3.73 | 3.48 | 0.307 |
| D22 | 3.71 | 3.00 | 0.098 | 3.76 | 3.37 | 0.095 |
| D23 | 3.68 | 3.00 | 0.099 | 3.70 | 3.33 | 0.112 |
| D24 | 3.38 | 2.50 | 0.023 * | 3.43 | 3.19 | 0.262 |
| D25 | 3.41 | 3.25 | 0.719 | 3.30 | 3.38 | 0.714 |
| D26 | 3.35 | 3.13 | 0.577 | 3.38 | 3.21 | 0.425 |
| D27 | 3.44 | 3.38 | 0.876 | 3.30 | 3.23 | 0.763 |
| D28 | 3.44 | 3.13 | 0.498 | 3.46 | 3.21 | 0.280 |
| D29 | 3.38 | 2.88 | 0.309 | 3.43 | 3.15 | 0.243 |
| D30 | 3.82 | 3.13 | 0.075 | 3.70 | 3.52 | 0.406 |
| D31 | 3.59 | 3.38 | 0.548 | 3.51 | 3.33 | 0.418 |
| D32 | 3.44 | 3.25 | 0.600 | 3.38 | 3.27 | 0.609 |
* The independent-samples t-test was statistically significant at the 0.05 level (two-tailed).
© 2020 by the authors. Licensee MDPI, Basel, Switzerland. This article is an open access article distributed under the terms and conditions of the Creative Commons Attribution (CC BY) license (http://creativecommons.org/licenses/by/4.0/).
Share and Cite
MDPI and ACS Style
Liao, L.; Teo, E.A.L.; Chang, R.; Zhao, X. Diffusion of Building Information Modeling in Building Projects and Firms in Singapore. Sustainability 2020, 12, 7762. https://doi.org/10.3390/su12187762
AMA Style
Liao L, Teo EAL, Chang R, Zhao X. Diffusion of Building Information Modeling in Building Projects and Firms in Singapore. Sustainability. 2020; 12(18):7762. https://doi.org/10.3390/su12187762
Chicago/Turabian StyleLiao, Longhui, Evelyn Ai Lin Teo, Ruidong Chang, and Xianbo Zhao. 2020. "Diffusion of Building Information Modeling in Building Projects and Firms in Singapore" Sustainability 12, no. 18: 7762. https://doi.org/10.3390/su12187762
Note that from the first issue of 2016, this journal uses article numbers instead of page numbers. See further details here.