1. Introduction
Citizen science supports sustainable development by communicating environmental awareness to citizens and facilitating participation in scientific research. Traditionally, scientific data were collected by scientists. Citizen science is based on collaboration between scientists and citizens, and the data are collected by voluntary participants [
1]. If well designed, a citizen science project facilitates environmental monitoring, promotes citizens’ awareness of environmental issues, improves background knowledge, and can be a basis for taking positive action [
2,
3].
Repeated campaigns and continuous data collection in citizen science projects can generate data with a high temporal resolution and frequent update cycles. Citizen science prevents the large costs that would otherwise be the consequence of generating data with such a high temporal and spatial resolution. Presently, most of the data collected within citizen science projects have a geospatial reference, thus these data can be part of geospatial indicators. Geospatial indicators are used to monitor and assess the progress of the United Nations Sustainable Development Goals (SDGs). The SDGs address the global challenges including climate change and environmental degradation and were developed to achieve a better and more sustainable future [
4]. Data generated in citizen science projects can contribute to the SDGs, by the provision of high-resolution data for monitoring and development of indicators (e.g., validation of remote sensing data) [
3].
Data quality [
5] and participants’ privacy [
6] require further attention. If projects are appropriately designed, the data collected by voluntary participants should adhere to the scientific standards for research [
7]. The key determining factors for data quality include clear instructions, training sessions, and expert validation [
7,
8]. As data are collected by voluntary participants, strict rules have to be applied to maintain participants’ privacy. Both technical and policy-oriented solutions can be used to reduce the risk of privacy disclosures [
6].
In Germany, “Bürger schaffen Wissen” is the central platform for citizen science. It gives an overview of citizen science projects within Germany, introduces general policies [
1], and provides practical guidelines [
9]. Citizen science practitioners can present their projects on
https://www.buergerschaffenwissen.de/projekte. Miyashita-Ostermann et al. (2019) analyzed the state of citizen science in Germany based on the projects registered on the platform before 2017. According to this study, 72% of the projects were started between 2013 and 2017 mainly driven by the evolution in digitalization and the promotion of citizen science by the government during that period [
10].
In modern citizen science, web and mobile applications are of increasing importance. This element of citizen science, using such technologies, is called “participatory sensing” [
6,
11]. One decade ago, participatory sensing was expected to open up a new capacity for data collection [
11]. Participatory sensing is already incorporated within various fields, such as health (e.g., HealthMap www.healthmap.org and Mosquito Alert www.mosquitoalert.com), disaster management (e.g., GLOBE Observer www.globe.gov and Landslide Reporter landslides.nasa.gov), and environmental observation (e.g., iNaturalist www.inaturalist.org and eBird ebird.org).
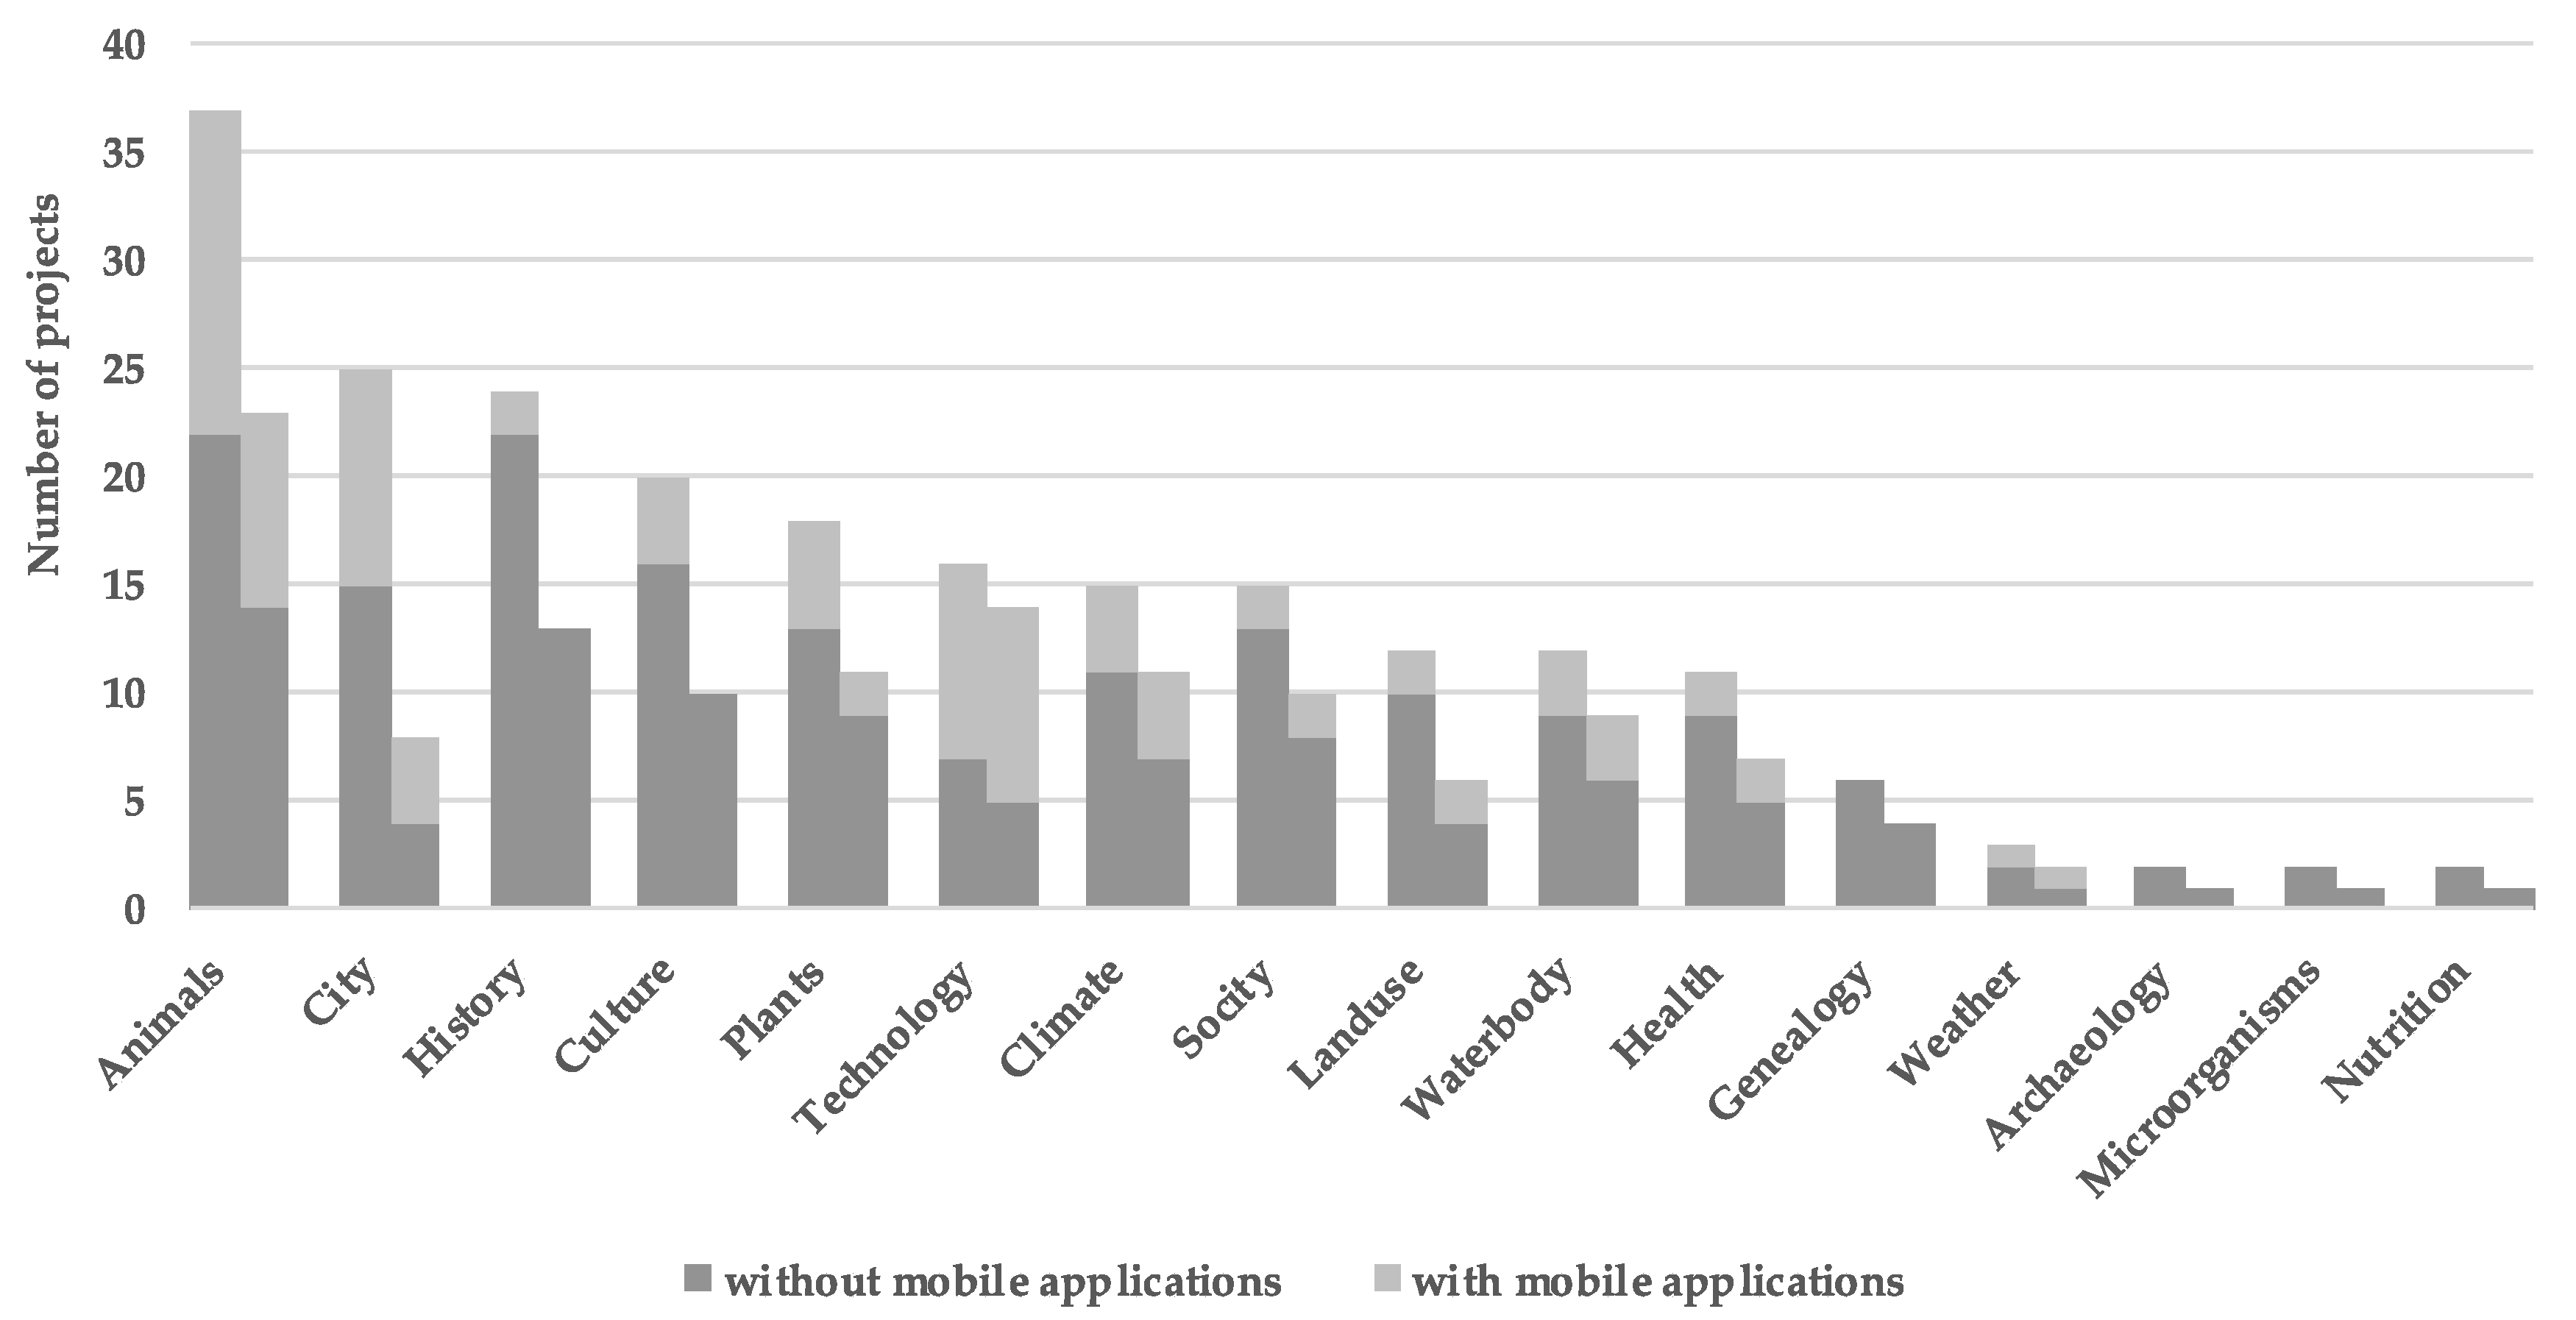
Most of the German citizen science projects provide websites and web applications, but only a small number of projects (30%) provide mobile applications. The reasons for this low rate may be the high financial costs and programming effort required and the need for continuous technical maintenance. Since projects’ purposes can be quite different, they may not always require mobile applications. As seen in
Figure 1, only the category “technology”, which deals with the development of new (digital) technologies, for instance utilizing hardware features, has a high proportion of projects (56.3%) providing mobile applications. The second and third highest numbers can be found in the category “animals” (40.5%) and “weather” (33.3%). From the technical point of view, a mobile application might not always be necessary, as web applications can nowadays run on tablet computers and mobile phones as well. This can be enabled through the implementation of a responsive web design, which has the advantage that the layout (screen sizes and viewpoints) can be automatically adapted on different digital devices. Therefore, a web application can now offer an optimal user experience on desktops, tablet computers, and mobile phones.
This paper aims to provide an overview of web technologies in citizen science and illustrate how these technologies were used in the BAYSICS (Bavarian Citizen Science Information Platform for Climate Research and Science Communication) project. The BAYSICS project was initialized through the cooperation of the Technical University of Munich, Leibniz Supercomputing Centre of the Bavarian Academy of Sciences and Humanities (LRZ), Catholic University of Eichstätt-Ingolstadt, Weihenstephan-Triesdorf University of Applied Sciences, University of Augsburg, University of Regensburg, and Ludwig-Maximilians-University of Munich in 2018. This citizen science project, which is based in Bavaria (Germany), seeks to create hands-on experiences for students and citizens interested in nature dynamics and conservation and climate change. Since the project partners involved have inter-disciplinary backgrounds, a broad field of research topics is covered, including diverse plant and animal-specific aspects. As central themes, four research topics were picked out and citizen science data has been collected: “plants”, “allergenic species”, “tree lines”, and “animals”. Specifically, the research topic “plants” uses plant phenology to detect the impact of climate change, “allergenic species” explores climate-induced variations in pollen load, “tree lines” focuses on altitudinal limits of tree species in mountain areas to investigate the effect of climate change, and “animals” surveys the changes in distribution and behaviors of animals inside and outside cities under climate change. The relevance of the collected citizen science data to SDGs can be found in the discussion part.
The research topics are brought together on the project’s digital platforms, where participants get a detailed overview of the research topics and can start making observations. Strengthening this participatory sensing is the task of the project partner LRZ, who is responsible for developing the IT infrastructure of the project. Within the project, different digital platforms have been developed, based on project-specific goals. By taking a participatory sensing-based approach, the scientific and educational aims can be better brought together.
In the next section, an overview of current web technologies in citizen science is given. The subsequent section details the goals of the BAYSICS project and shows which technologies were applied to fulfill these goals. The current status and the outcomes so far are evaluated in the discussion.
3. The BAYSICS Project
3.1. Aims
BAYSICS has the overall aim to promote environmental learning and education in the context of climate research, under the special consideration of climate change. For this purpose, the project focuses on the regional scale as people pay the most attention to their immediate surroundings. Thus, the geographical area for data collection is limited to Bavaria, in the south-eastern part of Germany. The learning process is promoted by giving participants the possibility of adding their observations to the project. With the help of digital platforms, the observations will be put into the larger context of climate change. To support the participatory process, three types of digital platforms are available: a website, a web portal, and a mobile application. These digital platforms have the aims: (1) informing visitors about the project, (2) providing information on how people can get involved, and (3) enabling participation. If visitors to the digital platforms want to participate in the project, a step by step guide is necessary for setting up an account, making their observations, and submitting them to the database. A communication system will be implemented which allows participants to interact with each other, and to communicate with scientists who provide expert knowledge for the observation process.
From the scientific point of view, the observation data collected within the project will be used in climate research. Thus, the digital platforms are designed in such a way that the observation data helps to answer specific research questions. For this, a systematic structure for data collection is required. To preserve data quality from the beginning, clear instructions on data entry are provided for the participants. Once the data collection starts, participants and scientists must have easy and up-to-date access to the observation data. This requires a database that is updated whenever a new observation is made. Furthermore, the observation data should also be prepared and open for further scientific usage by third parties. Those points can be strengthened following the FAIR principles [
18]. Data distribution has to be regulated under the consideration of a transparent data policy that secures the privacy-relevant data of the participants.
3.2. Methodological Framework
3.2.1. Website
For many people in the digital era, the first contact with a project is often made by visiting the project’s website. This gives a general introduction to the research focus, educational aims, and the structure of the BAYSICS project. The partners involved in the project give a brief overview of their activities. News and updates on the project are displayed on the website. The information on how to participate in the project and the link to the web portal is highlighted for visitors. Already, at a very early stage of the project, the website is being used to promote the project and gather test users for the web portal. Making the project known to the local communities was one of the main reasons to fully establish the website within the first few months of the project. The website serves static content online, which does not involve collecting, managing, and displaying the observation data. The CMS software WordPress was chosen for the development of the website, contributing to its timely development.
3.2.2. Web Application: Web Portal
The environmental learning and human-data interaction take place on the web portal. For its development, the web application framework Django was used, under which the functions necessary for the interaction were created [
19,
20,
21].
The web application framework can be divided into two parts: the backend server (database server) and the frontend server (application server). The backend server handles the data storage, while the frontend server enables participants to submit their observation data and makes the data visible to users via a user interface. The infrastructure is built on open-source tools, whereby a modular approach for the development was chosen. The focus was first put on the core components of the web portal; user registration and observation data collection and management. Subcomponents were then subsequently added to the web portal and will be adjusted along with the project.
Backend Server
The main function of the database in the backend server is storing the data observed by the users. To make the data collection more effective, real-time data collection is enabled, including the user’s GPS location, numbers, text, and integration of pictures. Pictures can increase the reliability of the data significantly [
22]. The kind of information and the data types to be collected were discussed and agreed upon within the project. For data storage, PostgreSQL, along with PostGIS, were used, based on the needs of the project [
23]. PostgreSQL is an open-source relational database, where data storage is simplified by using tables with rows and columns. It allows easy access to the data. The spatial extension PostGIS makes managing spatial data more efficient, for example, by adding extra geospatial data types and functions which determine spatial relationships.
Figure 2 shows the general architecture of the database. User authentication and authorization-related information (e.g., username, email address, and password) are stored in one data table. For storing passwords, a hashing system is applied, which is part of the web application framework. The participants need to sign up first and log in to the web portal when they want to make observations [
23]. Three different types of information from the observations are saved in the database: in-situ observations, geolocation, and metadata. In-situ observations can, for instance, include species, tree height, and pictures (topic: tree lines). The geolocation of the observation is derived from the smartphone GPS or manual entry on the observation form. Metadata includes information such as the data license (CC-BY), and dates when the data was first created and last edited.
Most of the entries during the observation are mandatory and only a few are optional, for example, sea-level (topic: tree lines) and recording time (topic: animals).
In addition to the four main topics (plants, allergenic species, tree lines, and animals), there are separate tables for demographic surveys, pollen allergy symptoms, and scientific lexicon. Pictures are stored in separate databases.
Frontend Server
The frontend server is the interface for users. Through this interface, users can create their accounts and manage their observations. The frontend was developed for multiple digital devices, applying a responsive web design, and was designed to be user friendly with self-explaining guidance.
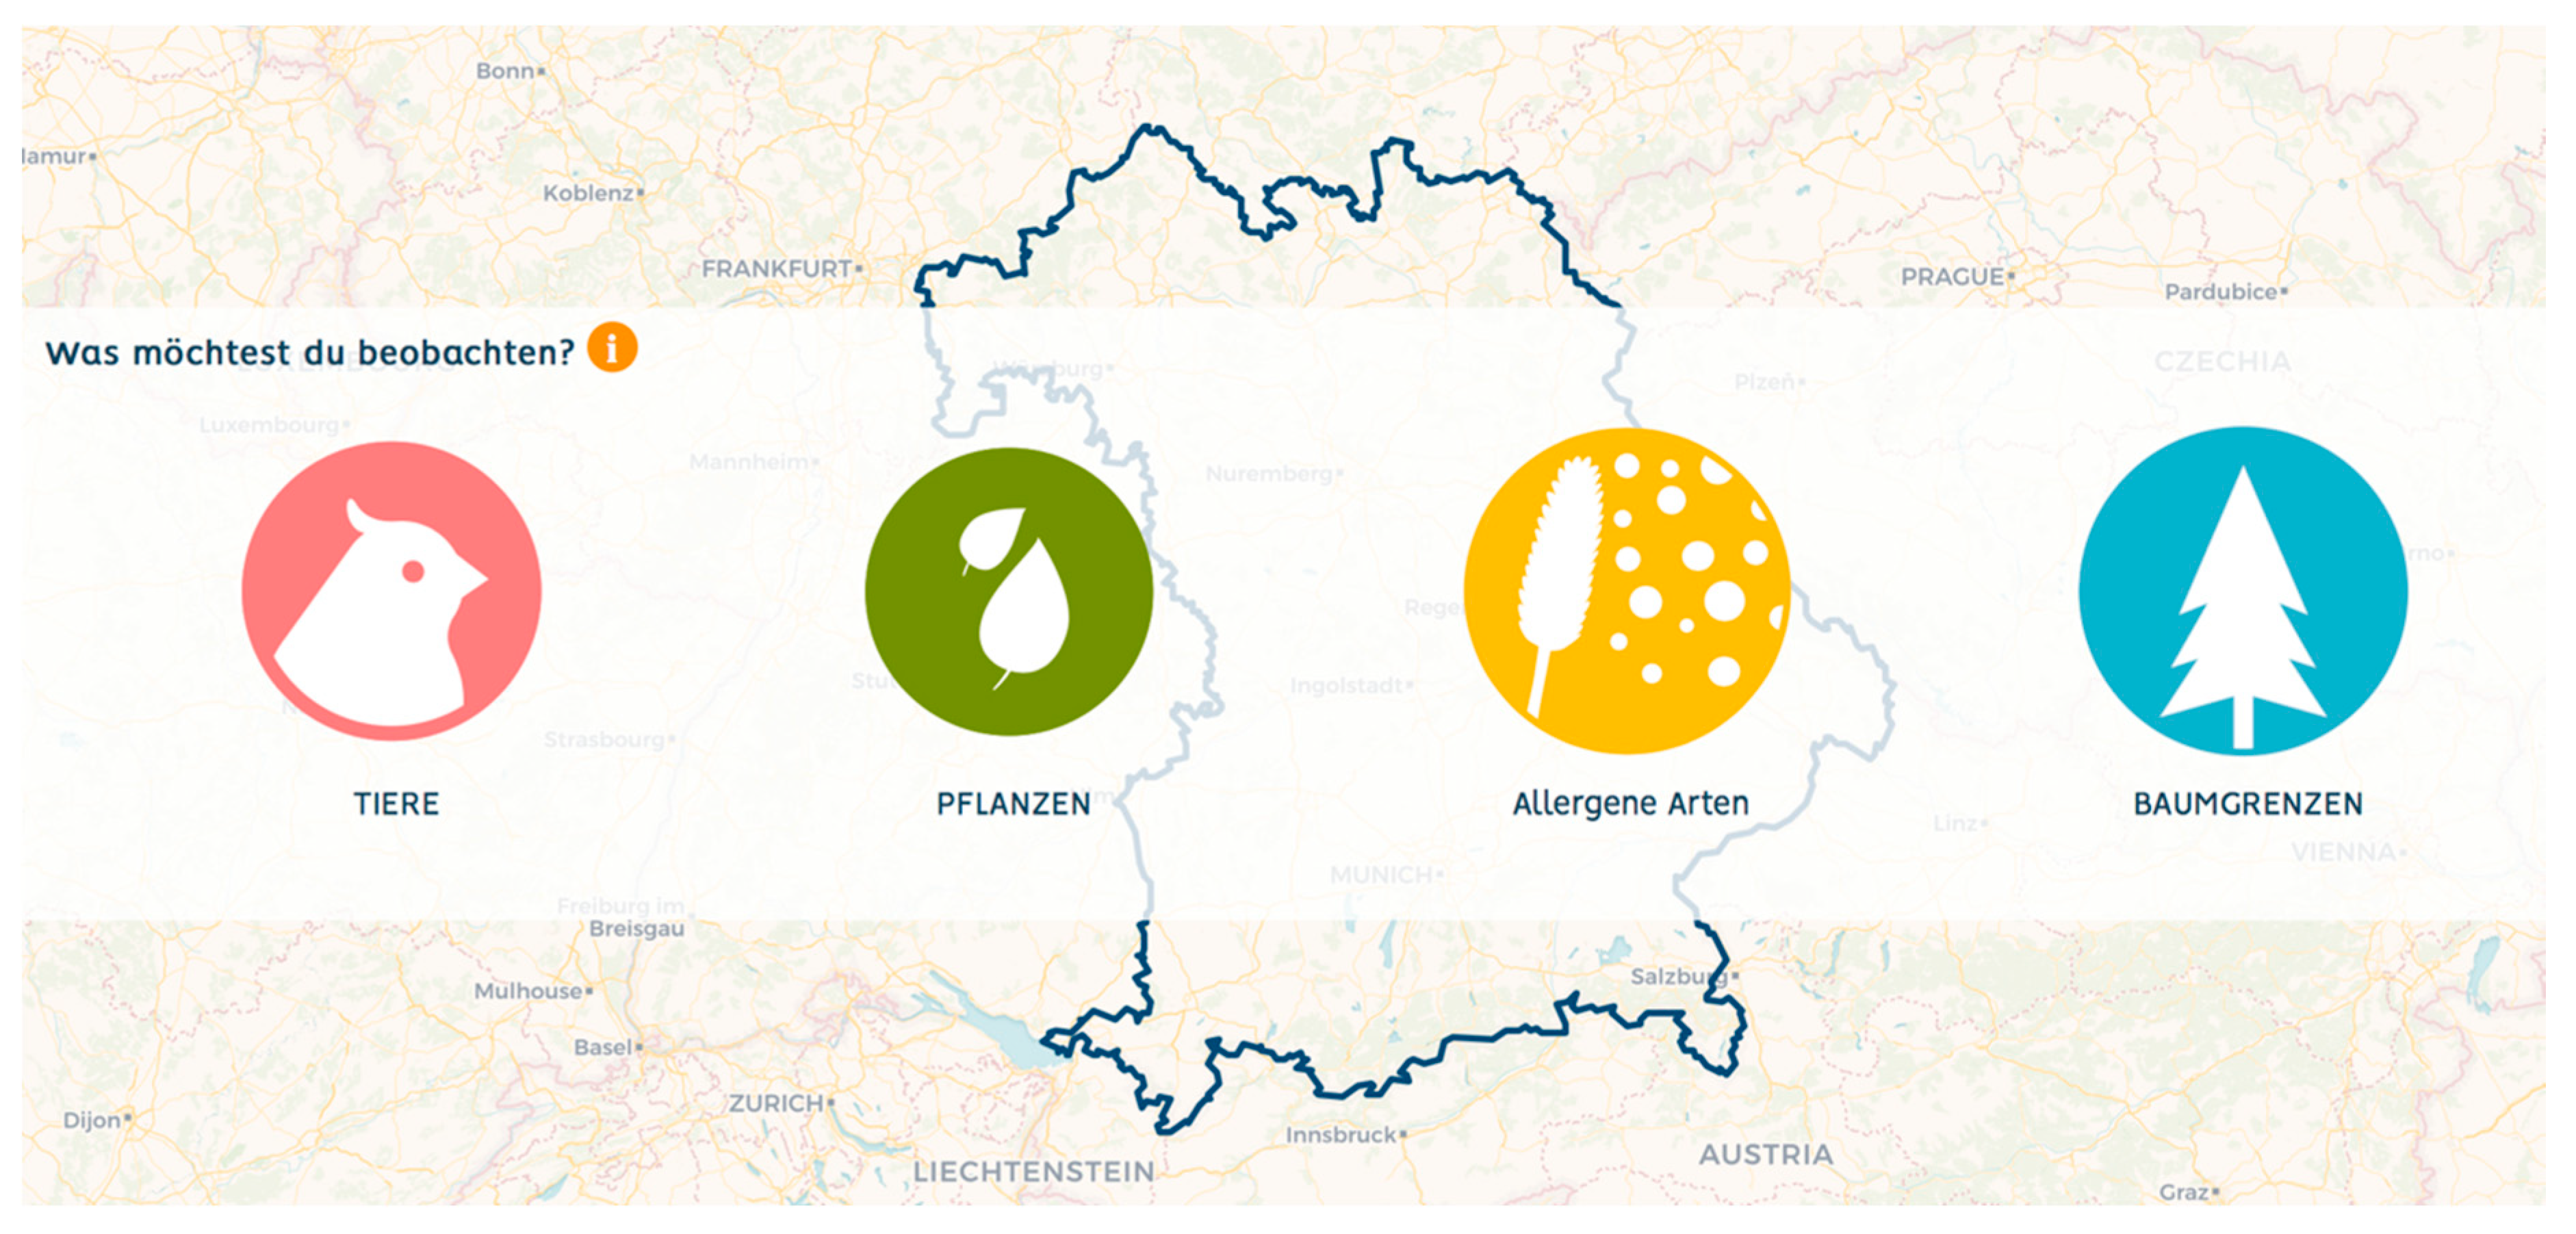
Users first choose the research topic on the frontend (
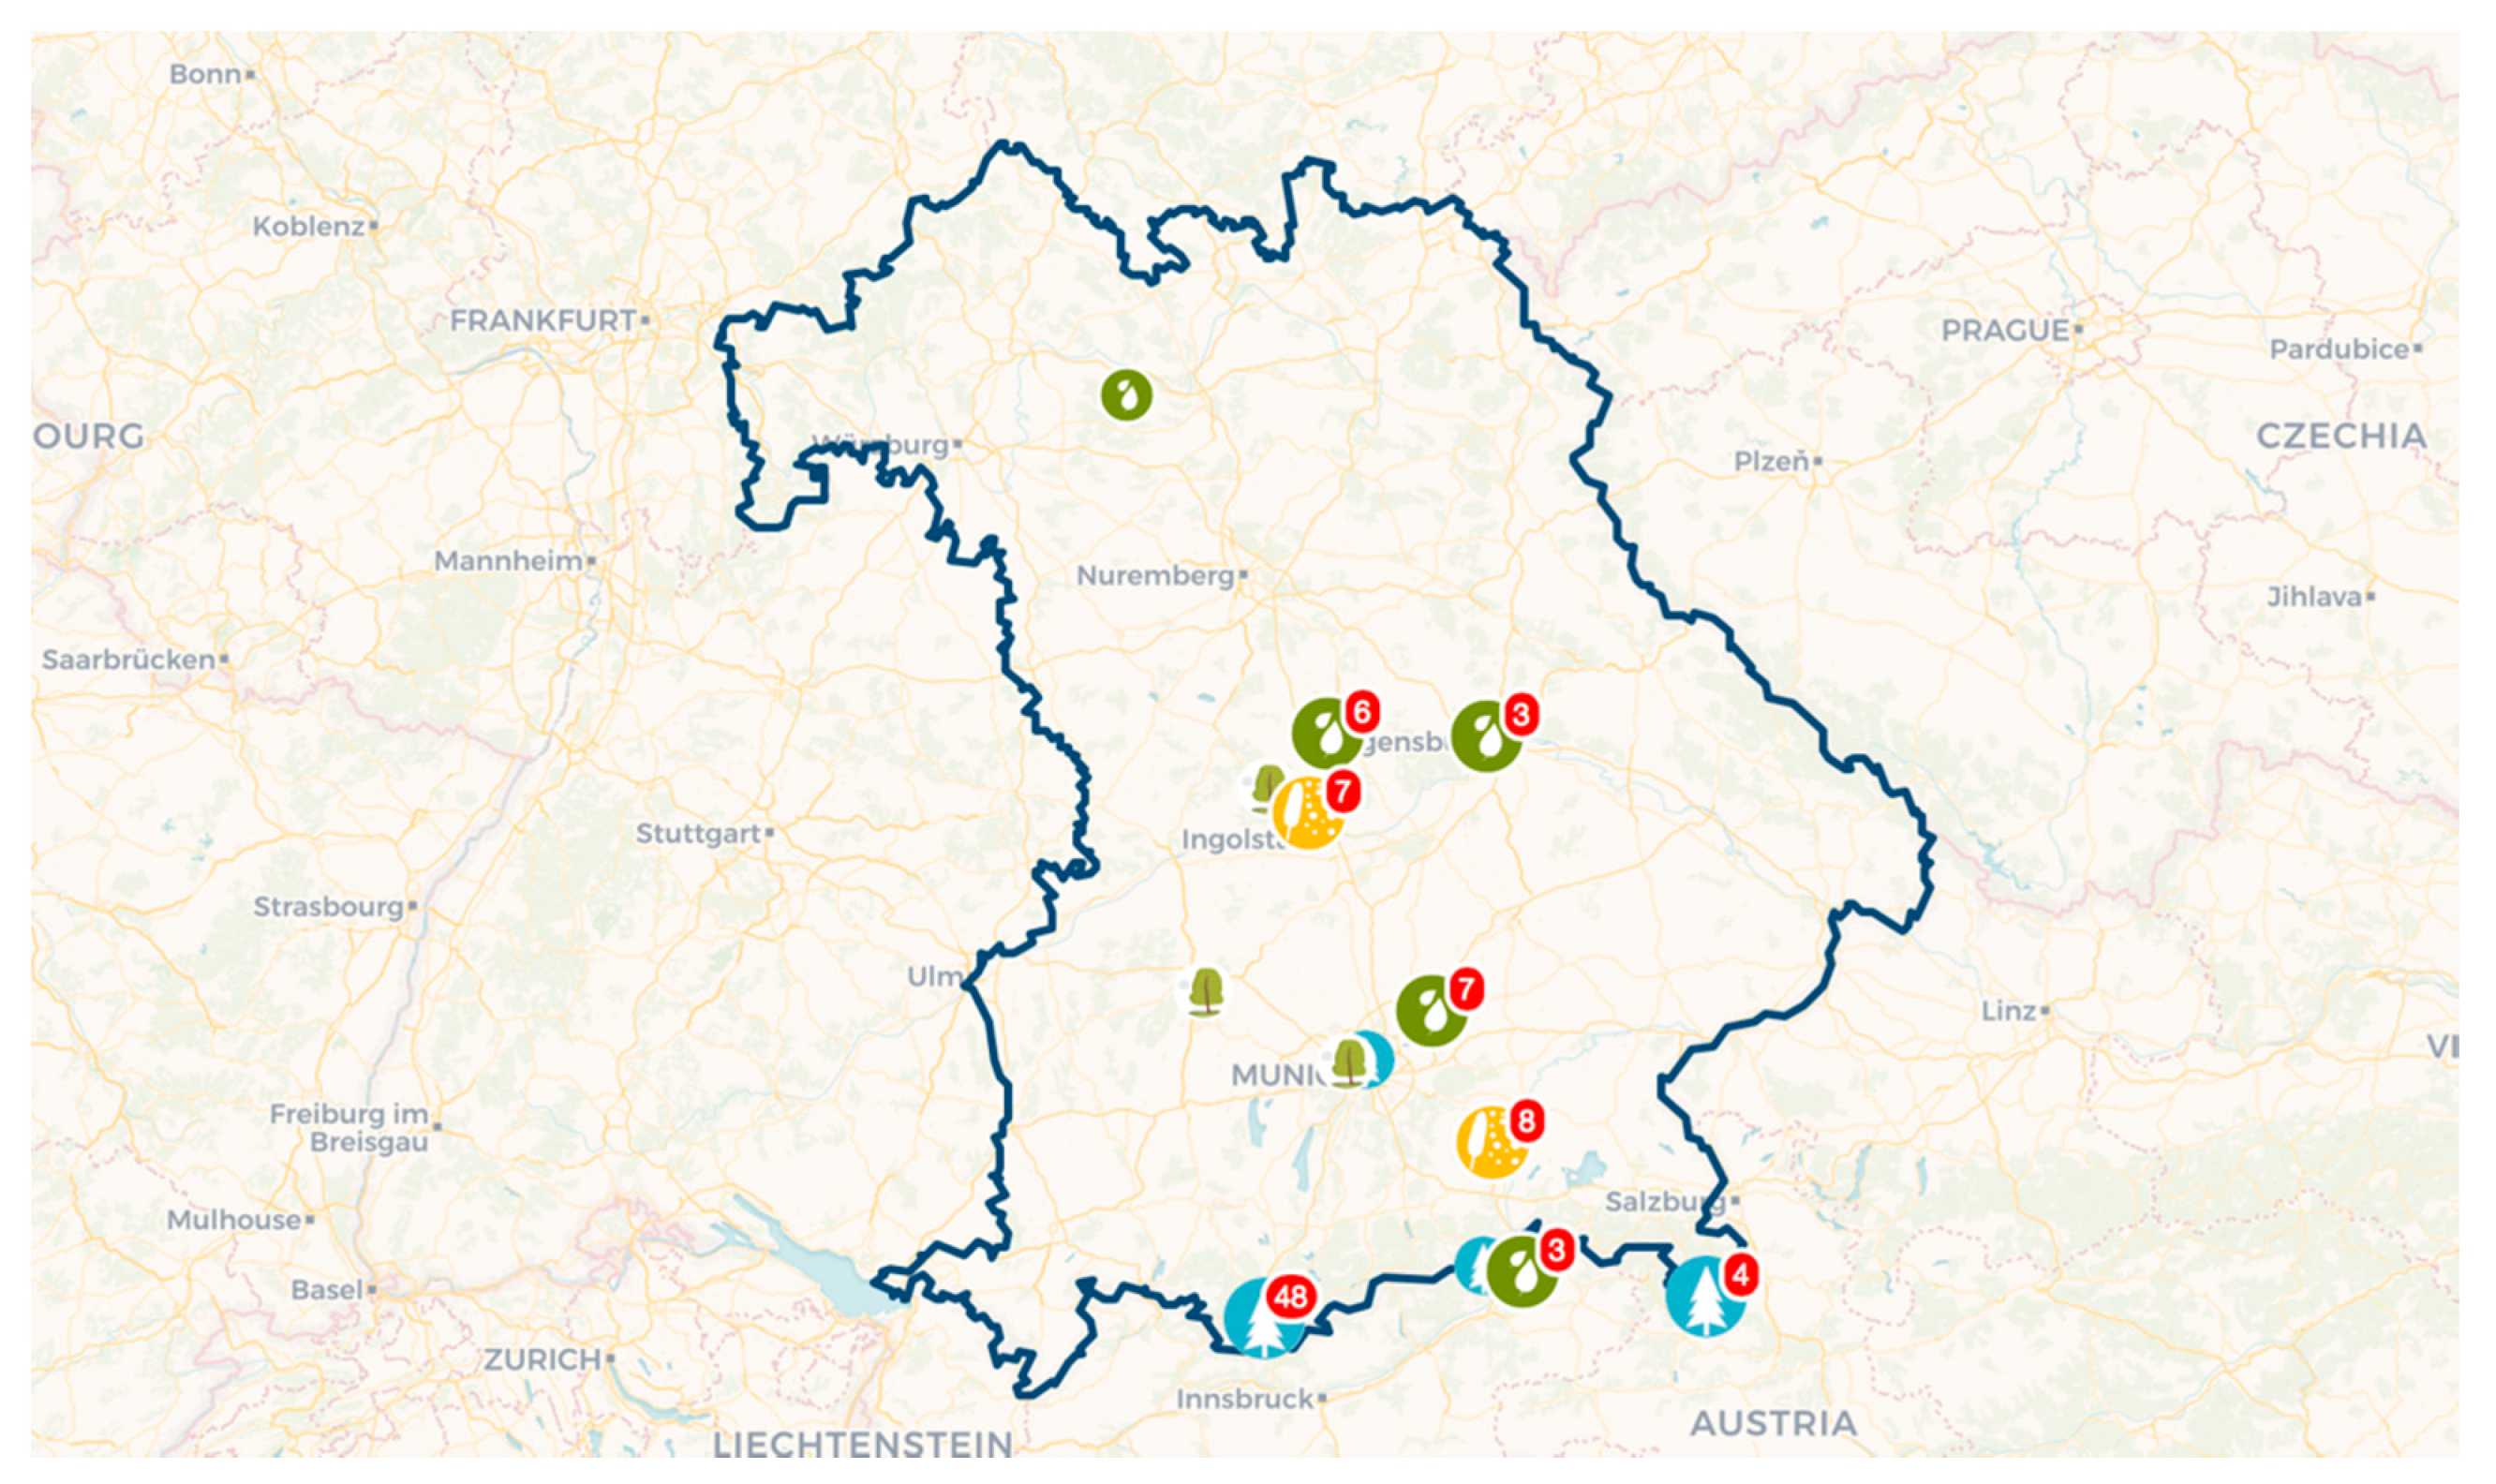
Figure 3) and move on to the specific observation entry form. The questions on the observation entry forms were formulated together with the scientists involved with the project. To support the observation process and share expert knowledge, information on the species and the relevant terms was collected from the scientists within the project in a scientific lexicon. Information on selected species from this lexicon is given by pictures and descriptions attached to the observation entry forms. Once an observation is submitted, it is then sent to the backend server. Users can view the list of their observation data and update or delete them on the frontend server, and these changes are directly reflected in the database. The observation data are additionally displayed on a map (
Figure 4). A summary of each observation is displayed on an info-panel that shows up on the map. The user can choose, for the background of the map, between the Open Street Map, a topographic map, and an aerial image [
24]. The users can make their analysis by applying analytic tools in the web portal. For example, it is possible to create a time series from the data, giving an overview from the past to the present [
24]. If a user deletes his/her account, the observation data will be anonymized, and still kept in the database. The terms for the handling of personal data are stated in the data policy, whereas the handling of the observation data is outlined in the terms of use. When users create an account, they have to confirm agreement with the data regulations. Without being registered, visitors also can see the map with the observation data, the summaries on the info-panel, and the scientific lexicon.
The options for interactions between the participants need to be developed further. So far, participants can create a group, send invitations to other registered users, and view the observation data from members of their group. The group function was mainly intended for classroom settings, wherein the teacher becomes the group host. This function is also available for other settings for different purposes. To facilitate the communication between scientists and participants, scientific questions from the participants are planned to be gathered through the web portal, which can then be regularly answered by the scientists.
Test Phase
To evaluate the web portal before opening it for public use, two test phases were conducted. The first test phase (December 2019–April 2020) aimed to troubleshoot and took place project-internally with the participation of early members (up to 30 people). The members had online access to the web portal and were able to leave comments on a separate wiki page. Before the test phase started, the backend had to be fully developed. Due to time limitations, frontend development was mainly conducted during the first test phase.
Only 10% of the issues reported during the first test phase were attributed to technical errors (
Table 1). In contrast, more than half of the reported issues were related to design and the user interface. The remaining one-third were related to text adjustments. The issues regarding the user interface were partly recognized and thus reported as technical errors. Those issues appeared mostly within the user-web-portal interactions (data input and output) and could be solved by adding additional information to the user instructions.
By the end of the first test phase, most of the technical issues were solved and the core part of the frontend design was successfully implemented. The second test phase was carried out in May 2020. Around 20 test users were gathered through the website, by other media such as online articles about the project, or were directly contacted by project members. The second test phase focused specifically on the user-friendliness of the web portal. The incoming feedback from the test users was mainly related to the observation forms and maps, implying the necessity of additional or more instructive descriptions. There were requests for a printable version of the observation forms, as well as a mobile application that could also be used in an offline environment.
3.3. Mobile Application
When devising an infrastructural design for a mobile application within a project, basic technologies have to be selected. Key factors to be considered are the capability to enable an optimal user experience, the ability to access the necessary hardware features, and the available resources for development.
It was expected that a progressive web application would be able to provide a fast and smooth user experience for BAYSICS. This has to be verified by the collection of feedback from real usage. The core hardware features necessary for BAYSICS are the camera and geolocation. Access to these is supported by HTML5 if adequate browsers are used, which is the case on most mobile phones. Offline support is required at times for data collection, such as in mountain areas. This can be applied by adding IndexedDB implemented in JavaScript to a progressive web application. Thus, technically, a progressive web application satisfies the basic project needs. Since the BAYSICS project web portal was developed based on web technologies, a progressive web application or a hybrid application could be developed based on the existing codes. The basic parts of the progressive web application have already been implemented in the web portal, allowing their installation on the home screen of a mobile phone and enabling offline access to the static content. In the next step, the JavaScript-based IndexedDB will be added, which will enable offline data collection.
3.4. Data Distribution
Open access to the collected data given the legal and ethical issues is one of the main discussion points in citizen science and is also found in the “10 principles of citizen science” by the European Citizen Science Association [
25]. In BAYSICS, the observation data are licensed under the CC-BY license and are actively made available to scientists within the project and to registered users. Scientists within the project can directly access the database and view, manage, and download the data. A summary of the data from each observation is viewable through an info-panel shown on the map of the web portal. Registered users do not have direct access to the database; instead, a topic-specific interface for download is available on the web portal. After selecting a topic, the data is downloadable as a table and pictures. A downloaded table includes in-situ observations, geolocation, and metadata. All relevant information on the data download is available in a separate instruction document. The data for download do not comprise privacy-relevant information to avoid identity disclosure and tracking, making it impossible to identify users from their observation data. Interactions involving two or more platforms (third-party applications) are enabled through the Application Programming Interface (API) implemented within the web application framework. The basic idea is to expand the sharing, integrating, and exploiting of the data [
26,
27]. To promote further usage of the observation data, the dataset could be equipped with persistent identifiers (e.g., DOIs) which make the data findable via data search portals. This will be an important step to fulfill the FAIR criteria [
18].
4. Discussion
Information and communication technologies (ICTs) such as web platforms and mobile phones have become increasingly important in society (SDG 11 “Sustainable cities and communities”) [
28]. Besides, ICTs support the provision of high temporal and spatial resolution data for environmental monitoring and reporting (SDG 15 “Life on Land”) [
28]. This paper describes how modern web technologies can be applied to a citizen science project (BAYSICS).
The IT infrastructure for the BAYSICS project has three platforms: a website, a web portal, and a mobile application. The website informs visitors about the project structure and advertises the latest activities. It, therefore, had a huge role in making the project known to the community. The CMS system, used for the development, allowed the project to establish the website quickly at the beginning of the project. Before the test phase for the web portal started, the call for test users was announced on the website first. The test users were informed about the web portal’s URL. Two of the aims regarding digital platforms were fulfilled through the website: (1) to inform visitors about the project and (2) to provide information on how people can get involved.
The web portal is the most important of the digital platforms, and its task is to convey environmental learning and education in the context of climate research. In comparison to the website, general information on the project was kept to a minimum. Instead, the focus was put on practical guidelines for the observations, and preparing background knowledge. Environmental learning and education were facilitated first by making observations, secondly by a map linking the gathered observation data in the context of climate change, and third by the scientific lexicon providing additional information. Recording one’s own observations in the local environment, and the possibility of reviewing observations made by others, provided insights to the participants into the surrounding nature, helping to build awareness of changes due to climate change. Improving citizens’ capacity to engage in environmental monitoring supports the SDG 13 “Climate Action”, Target 13.3. The link between observation data and climate change could be achieved by combining the observation data and selected climatic parameters, such as temperature and precipitation, on a map covering all of Bavaria [
24]. Taking into account possible concerns regarding the data quality, entry forms for observations were designed together with the project scientists. This enabled collection of data adequate for scientific research. Detailed explanations, for example, on the species in the scientific lexicon, can furthermore decrease errors during the observation process. For the development of the web portal, the application framework Django was chosen. Django has advantages in generating and managing relational databases and provides a built-in authentication and authorization system. Overall, the third aim—to enable active participation—was achieved through the web portal. The web portal builds a permanent interface that is in a continuous development stage, offering the opportunity for the improvement of the learning experience by implementing new analysis features and further development of the existing tools. To guarantee the technical sustainability of the project’s digital platforms, the developed IT follows easy and clear structures, ensuring persistence even if the project period ends.
The planned mobile application could even extend the possibilities for environmental learning. It offers not only all the functions of the web portal, but also the ability to be installed on the home screen of a mobile phone, offline access, and the use of push notifications. The project is currently developing a progressive web application in which usability will be tested.
The collected data within the project have relevance to the SDGs, whereby the topics “plants” and “tree lines” fall under the SDG 15 “Life on Land”, and topics “animals” and “allergenic species” are SDG 11 “Sustainable cities and communities”. In particular, “plants” and “tree lines” can contribute to Indicator 15.4.2 “Mountain Green Cover Index” of Target 15.4 by providing in-situ information on mountain forest structures, altitudinal limits of trees (topic: tree lines), and plant species and phenology (topic: plants). The observation data can be used for the validation of remote sensing information. The topic “animals” has relevance to Indicator 11.4.1 “Total expenditure (public and private) per capita spent on the preservation, protection, and conservation of all cultural and natural heritage…” of Target 11.4. by providing information on animal distribution and behavior with respect to climate change. This data can, for instance, be taken into account when new urban greenspaces are planned. The topic “allergenic species” has relevance for Target 11.6 “By 2030, reduce the adverse per capita environmental impact of cities, including by paying special attention to air quality and municipal and other waste management”. For Target 11.6 Samulowska et al. (2020) proposed a new indicator on the air quality assessment based on pollen allergy [
29]. The BAYSICS data can be used when green areas are planned or redesigned by providing information on allergenic species and flowering phenology.


