Assessing the Relationship between Social Vulnerability, Social Capital, and Housing Resilience


Abstract
:1. Introduction
2. Background
- How well do the SVI and SoCI (including their sub-indices) explain variance in housing damage from a hurricane?
- How well do these indices explain variance in rates of housing recovery?
3. Study Context
3.1. Florida—Hurricane Irma
3.2. Puerto Rico—Hurricane Maria
4. Methods
4.1. Data
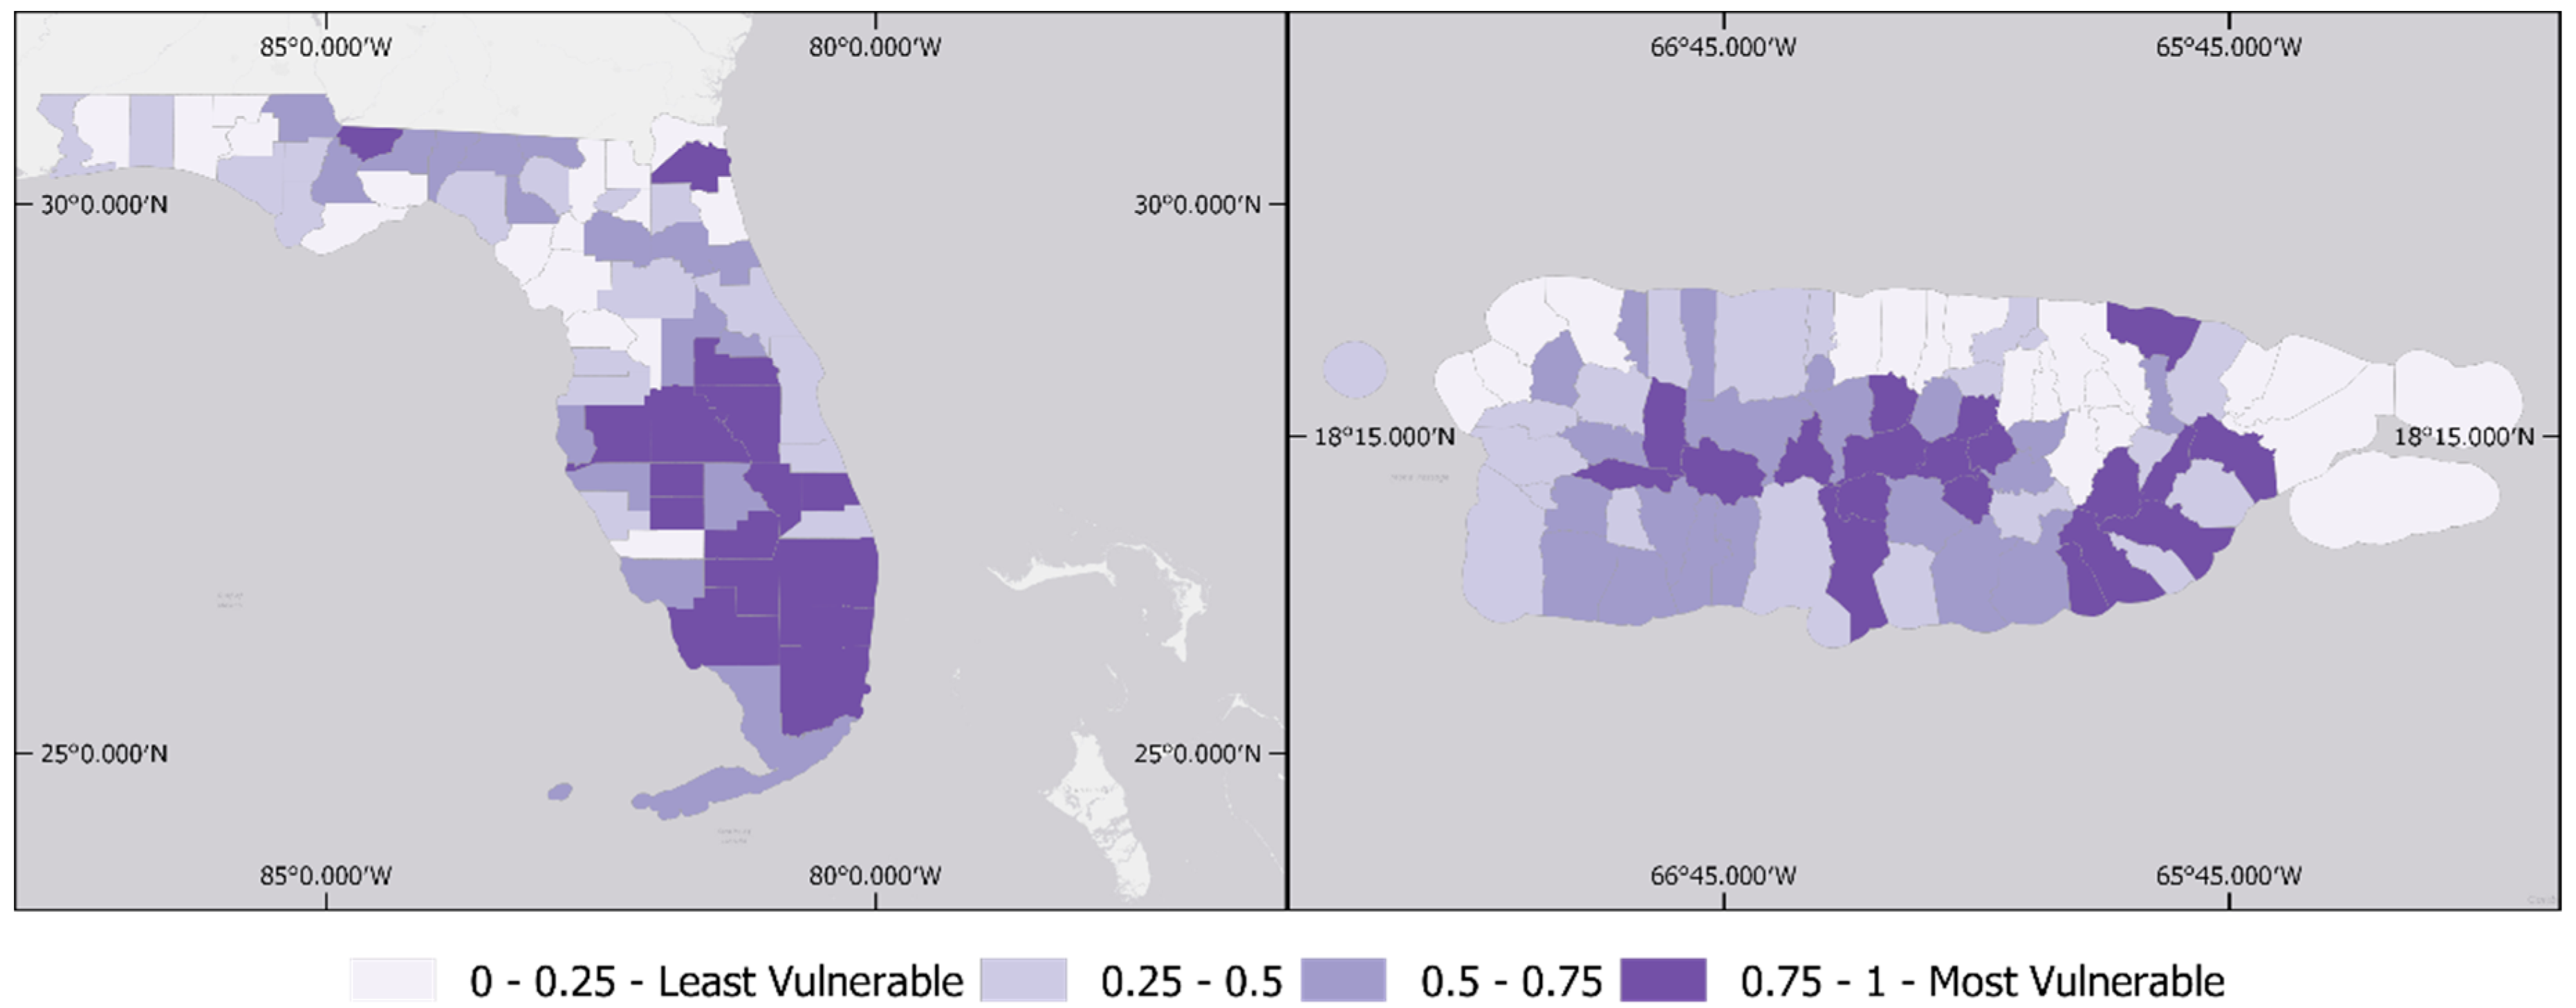
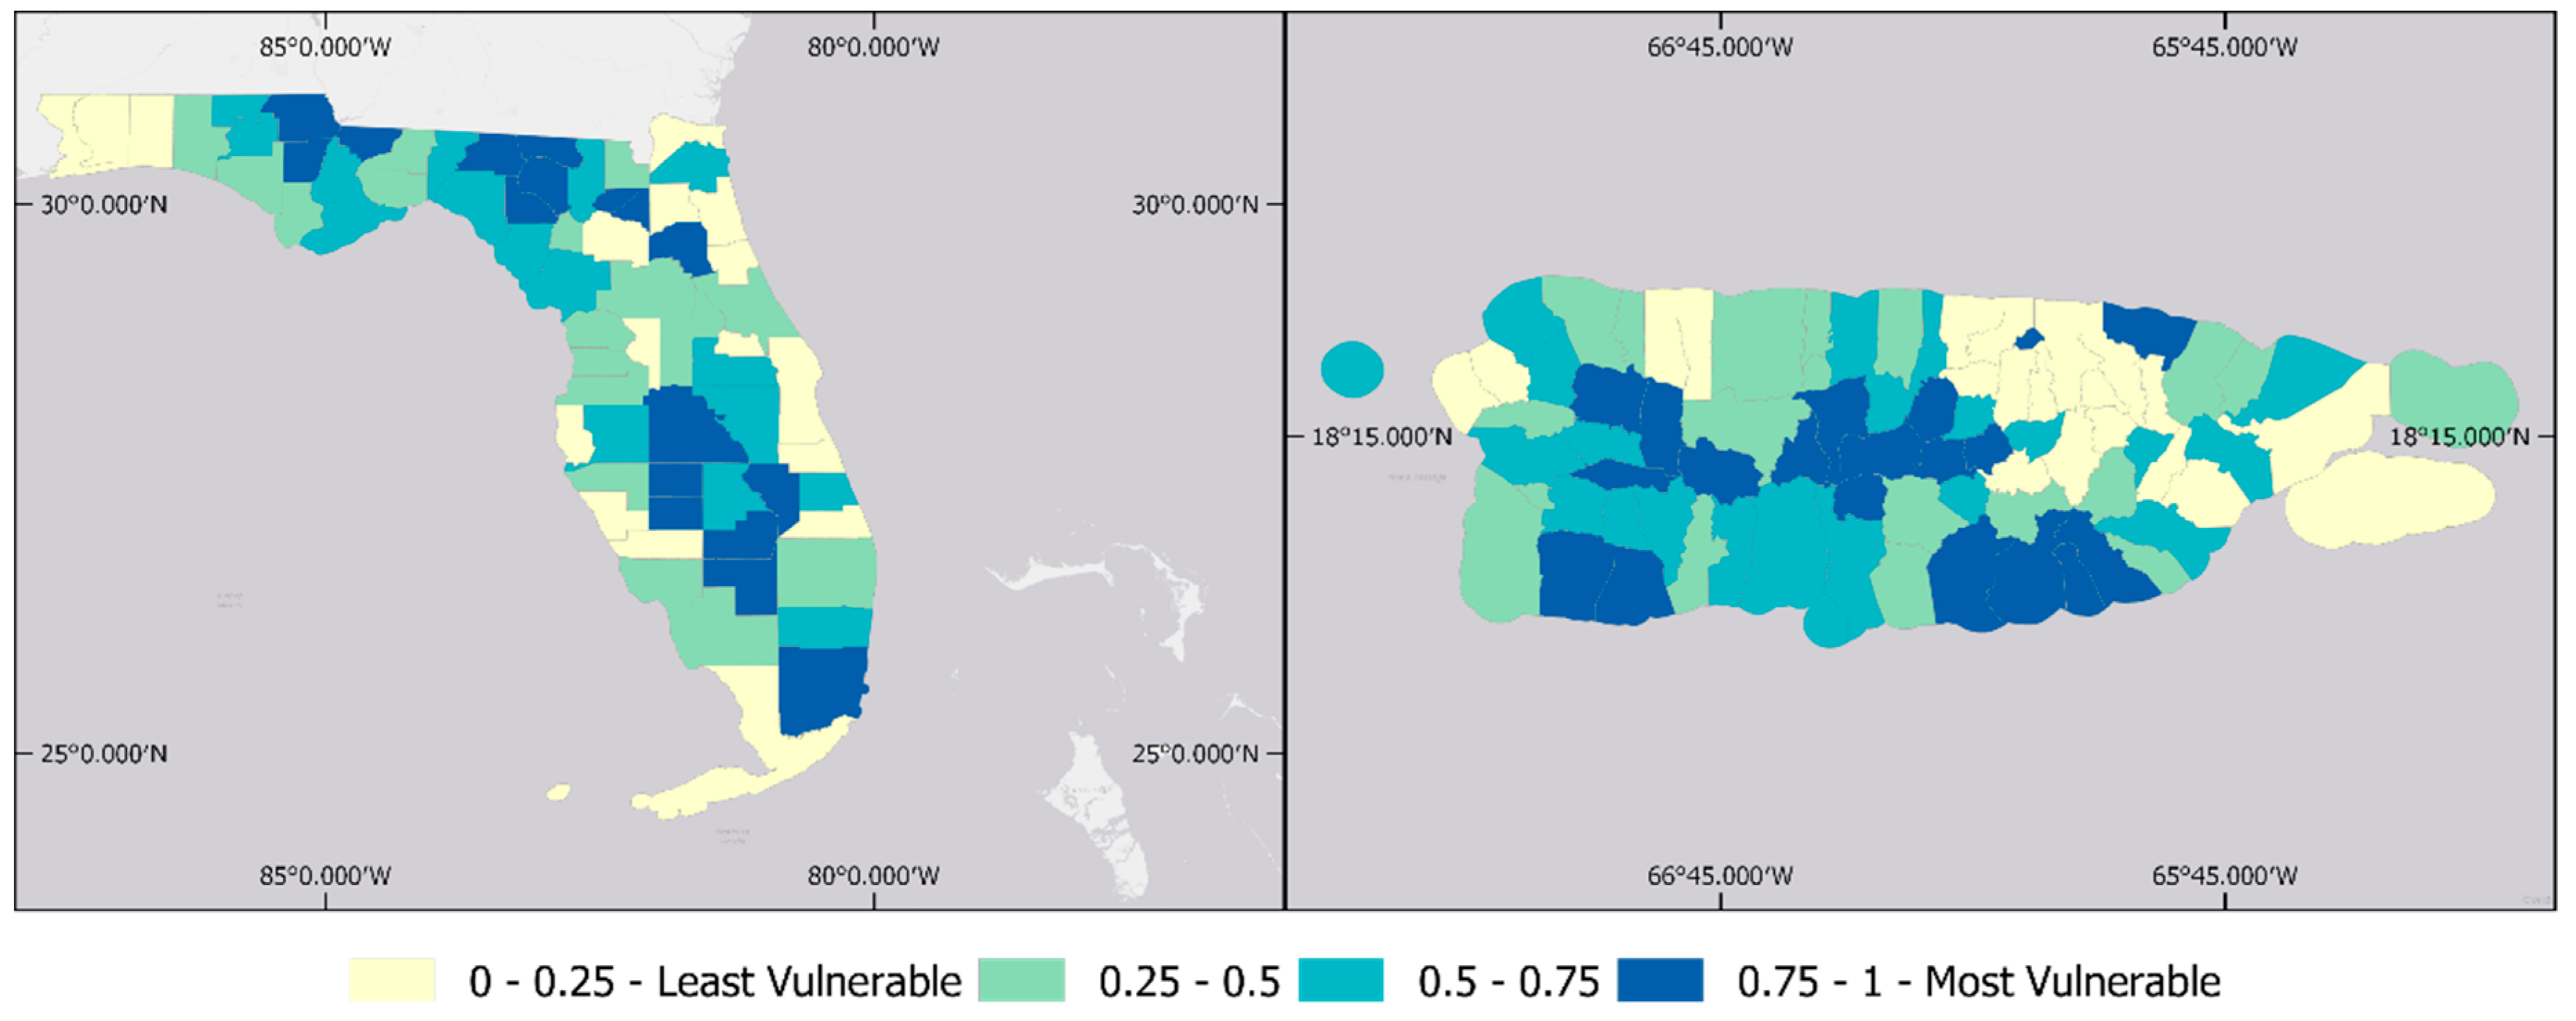
4.1.1. Social Vulnerability Index
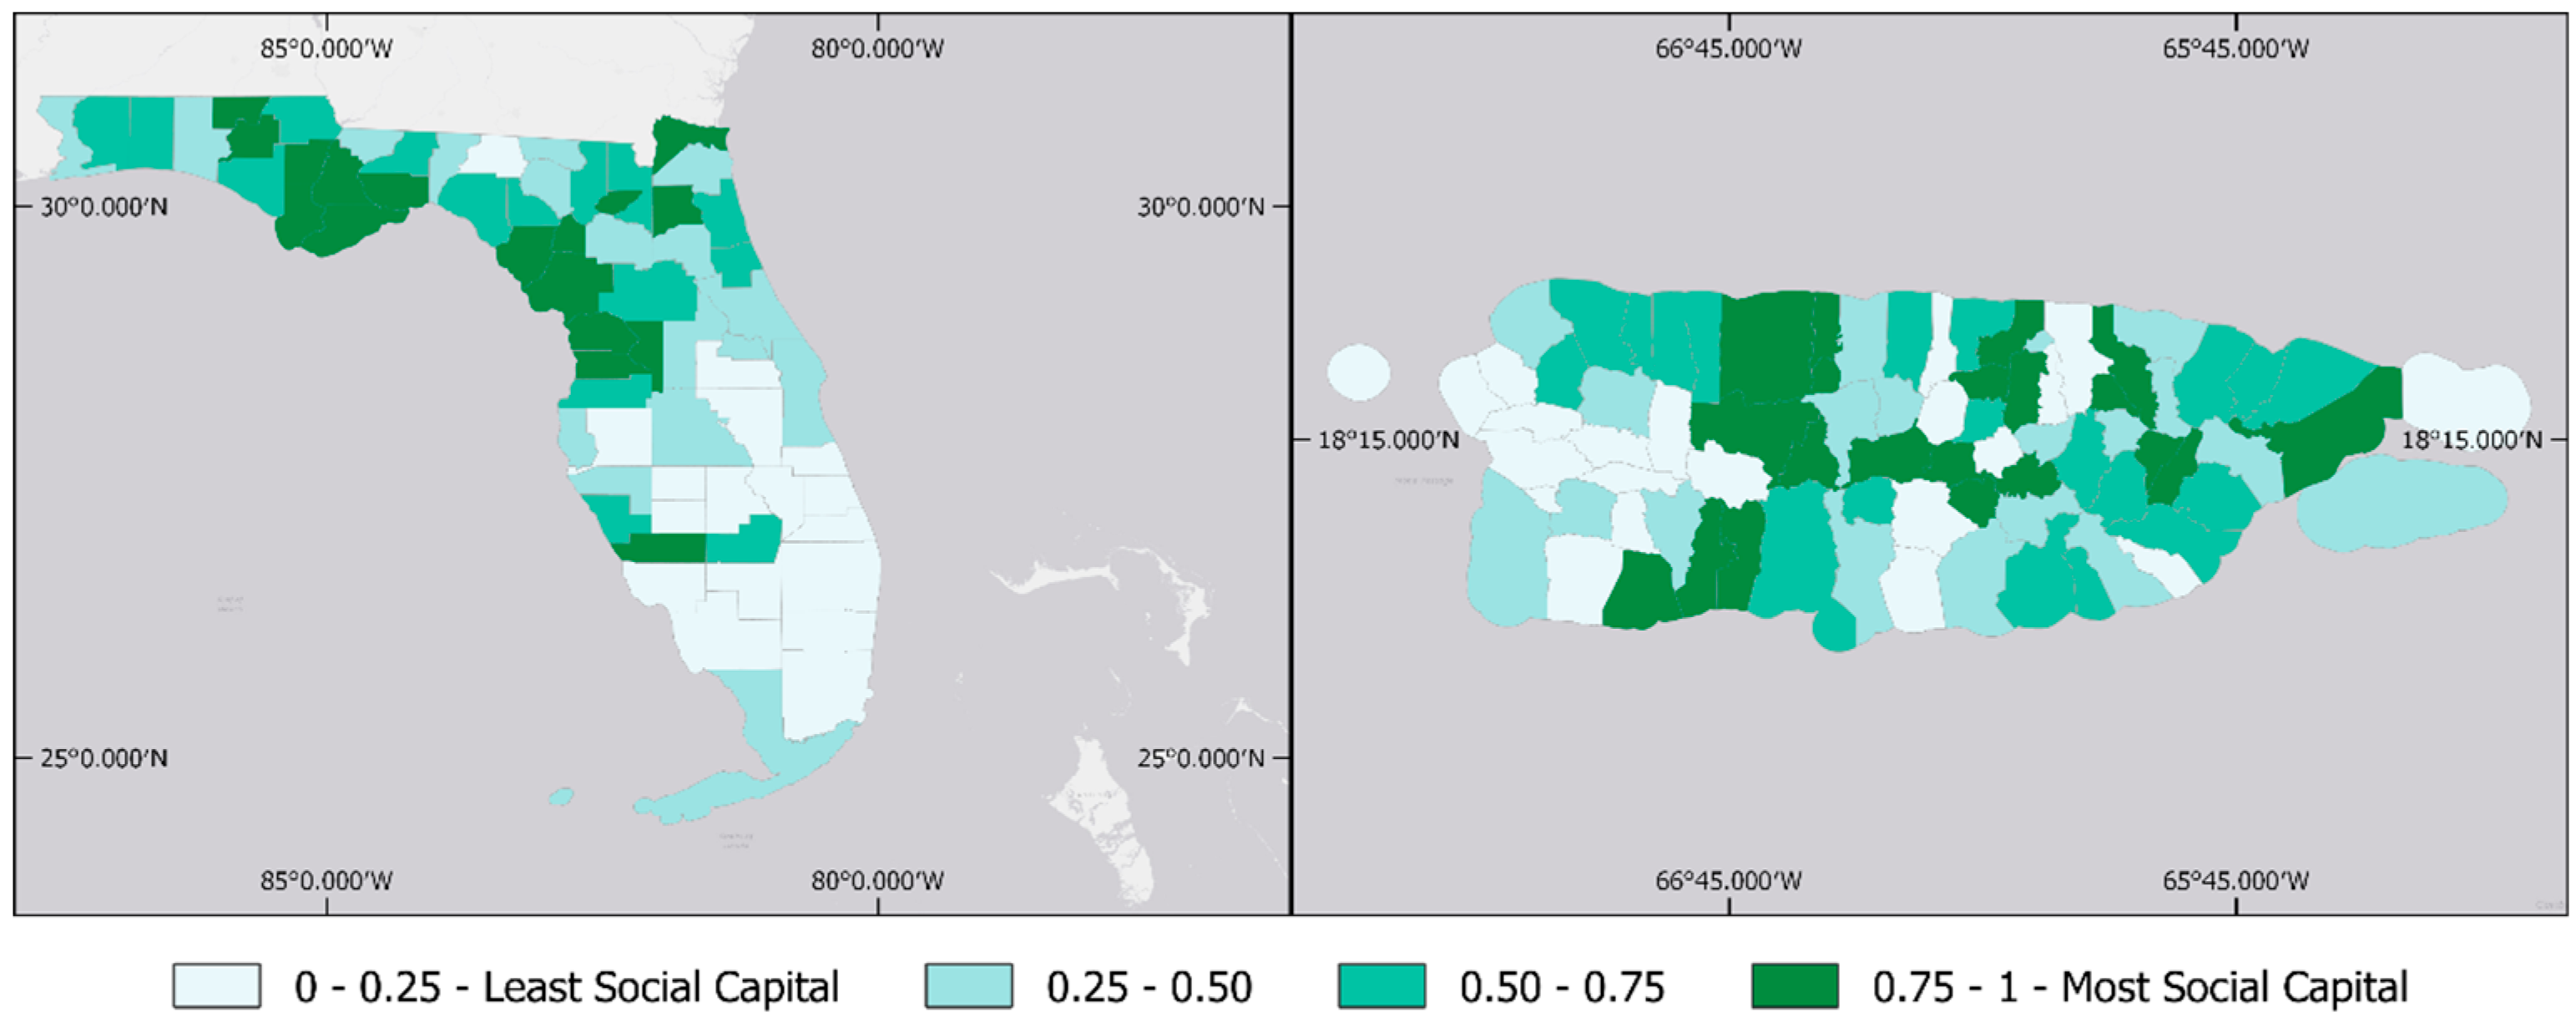
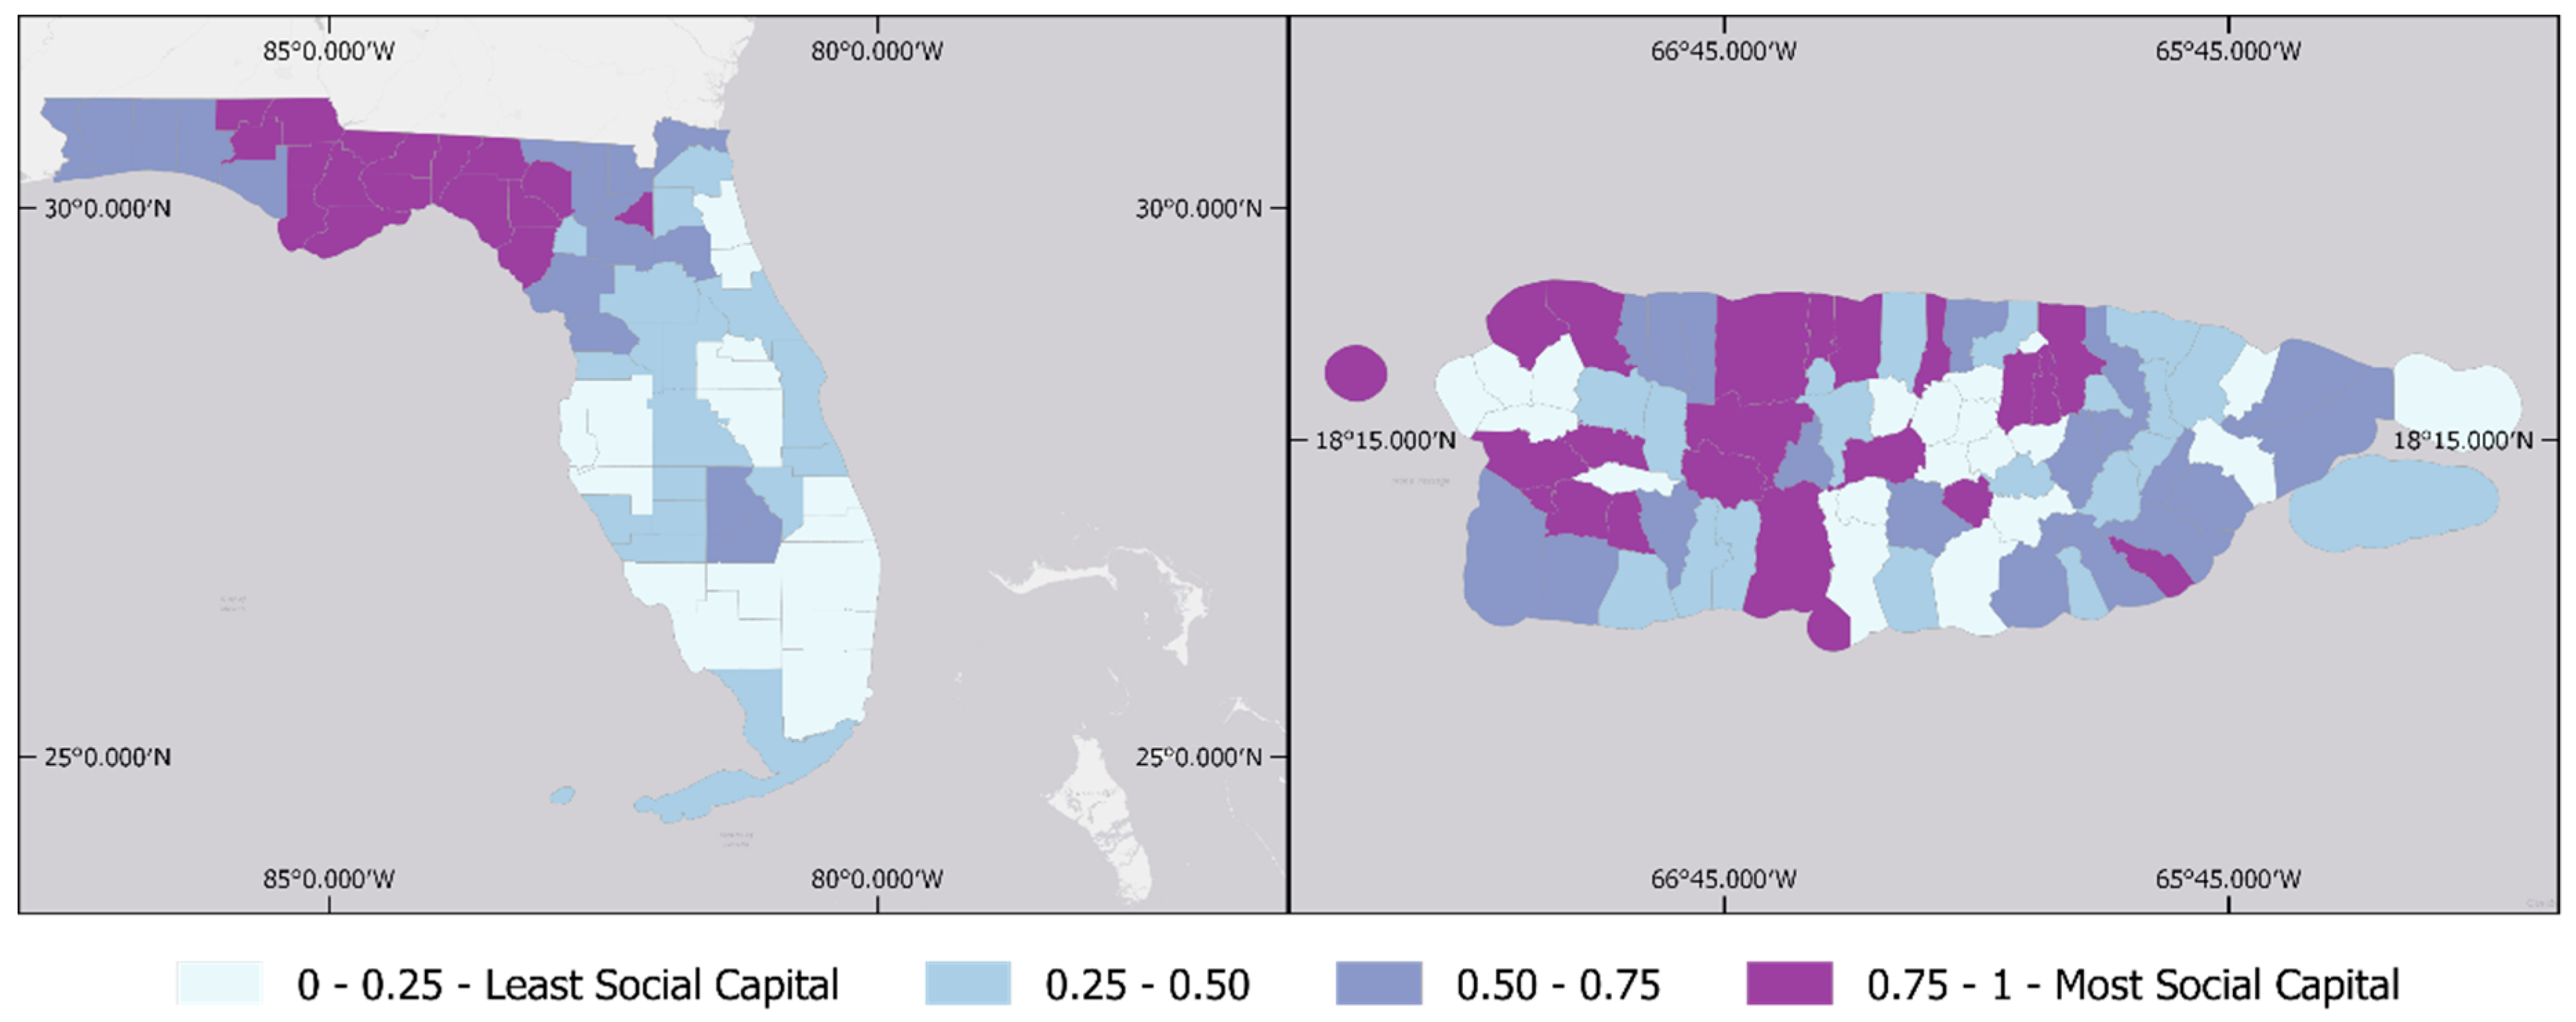
4.1.2. Social Capital Index
4.1.3. Wind Speed
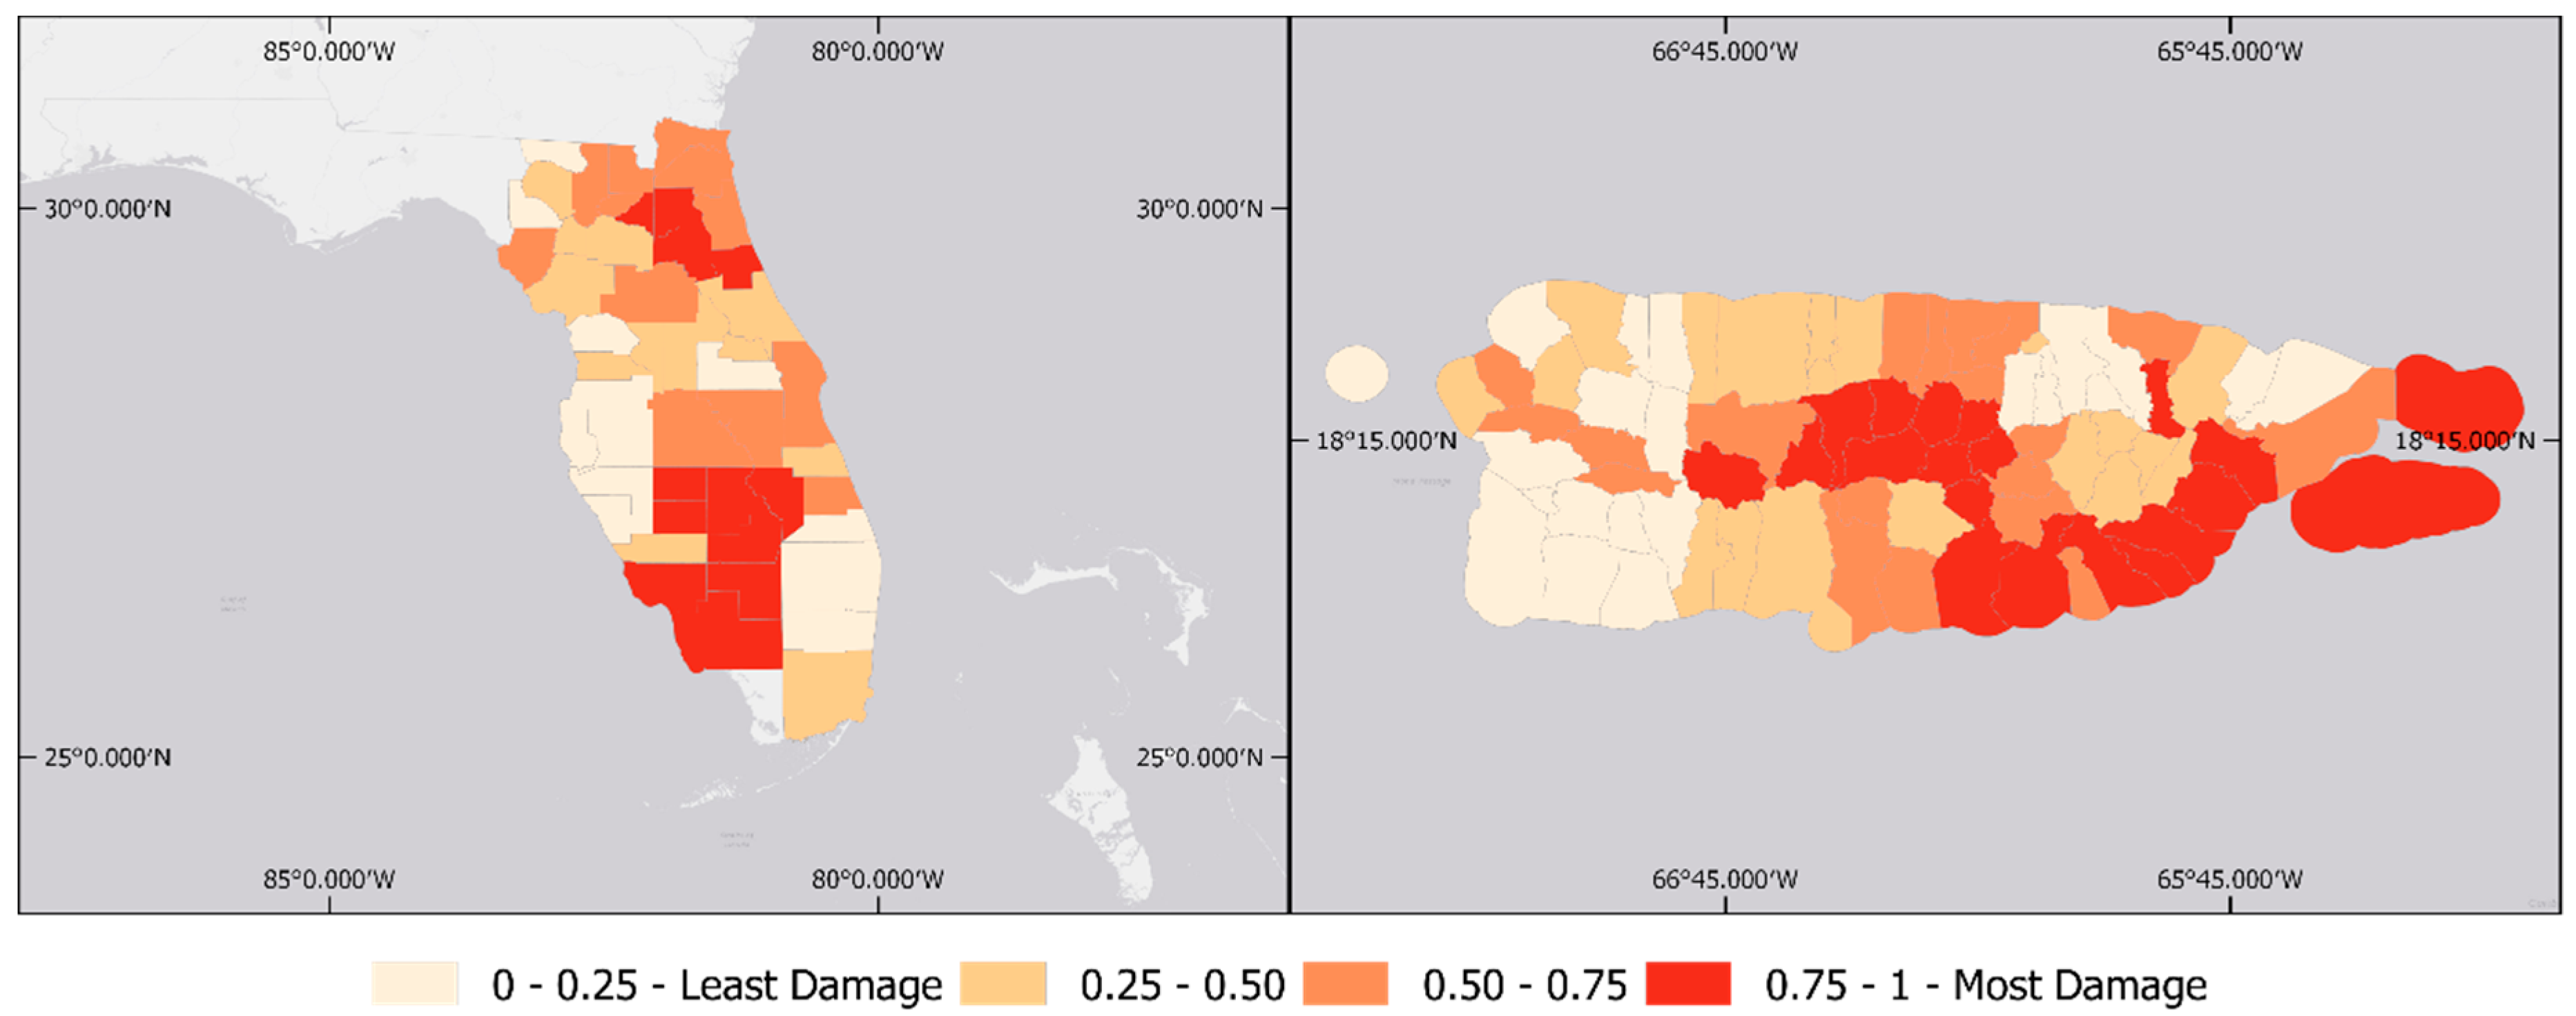
4.1.4. Housing Impacts
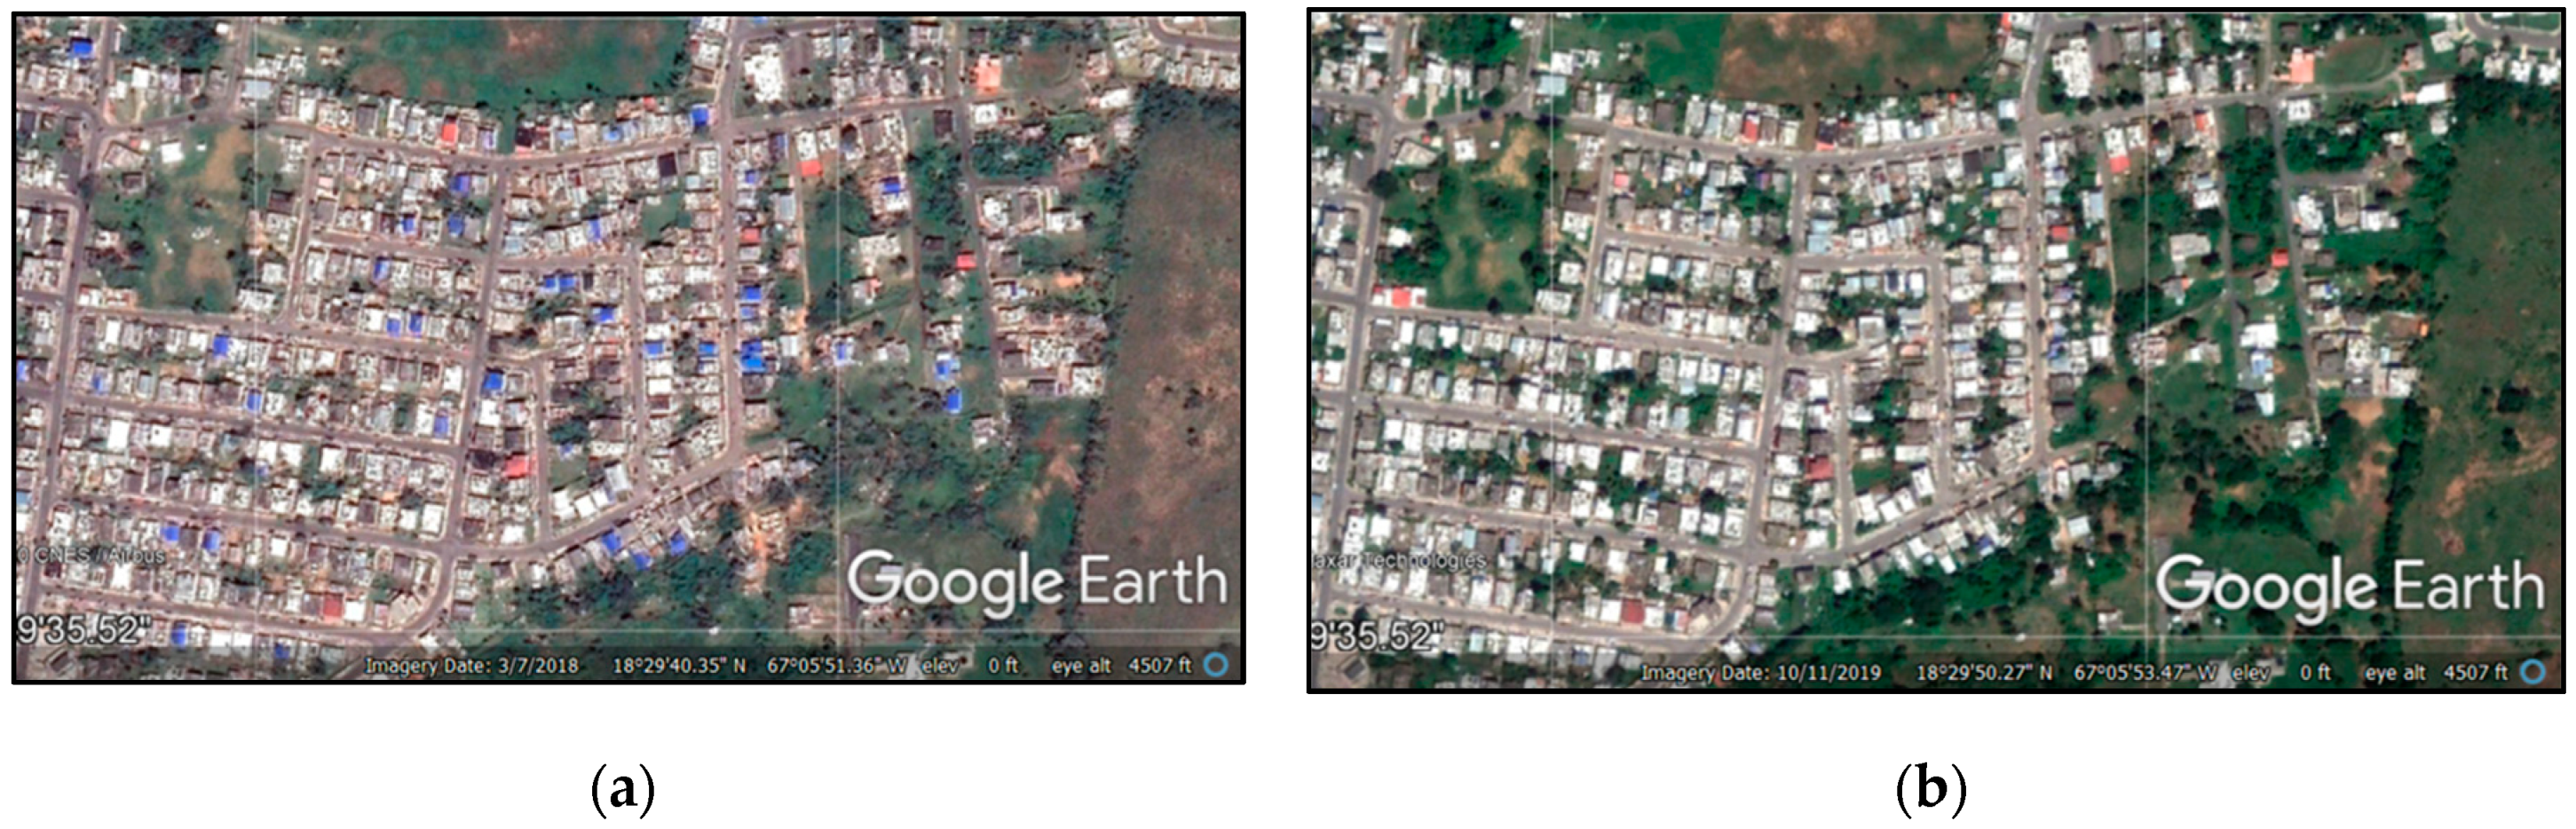
4.1.5. Housing Recovery
4.2. Impact Analysis
4.3. Recovery Analysis
5. Results
5.1. Impact Analysis
5.2. Recovery Analysis
6. Discussion
Limitations and Future Work
7. Conclusions
Author Contributions
Funding
Acknowledgments
Conflicts of Interest
Appendix A

| Social Vulnerability Theme | SVI Variable |
|---|---|
| Socioeconomic Status | Percentage of persons below poverty line |
| Percentage of civilians (age 16+) unemployed | |
| Per capita income | |
| Percentage of persons (age 25+) with no high school diploma | |
| Household Composition/Disability | Percentage of population 65 years of age or older |
| Percentage of population 17 years of age or younger | |
| Percentage of population more than 5 years old with a disability | |
| Percentage male or female householder, no spouse present, with children under 18 | |
| Minority Status and Language | Percentage minority |
| Percentage of population 5 years of age or older who speak English less than “well” | |
| Housing and Transportation | Percentage multi-unit housing |
| Percentage mobile homes | |
| Crowding | |
| Percentage no vehicle available | |
| Percentage of population in group quarters |


| Social Capital Type | SoCI Variable |
|---|---|
| Bonding | Race similarity |
| Ethnicity similarity | |
| Education equality 1 | |
| Income equality | |
| Employment equality 1 | |
| Gender income equality 1 | |
| Language competency | |
| Communication capacity | |
| Non-elder population | |
| Bridging | Religious organizations |
| Civic organizations | |
| Charitable ties 1 | |
| Fraternal ties 2 | |
| Union ties 1 | |
| Linking | Political linkage (voting-age population) |
| Local government linkage | |
| State government linkage | |
| Federal government linkage | |
| Political activities 1 |

Appendix B
- EL is the education Gini based on educational attainment distribution,
- µ is the average years of schooling for the concerned population,
- pi and pj stand for the proportions of population with certain levels of schooling,
- yi and yj are the years of schooling at different educational attainment levels,
- n is the number of levels/categories in attainment data, n = 7 in this paper (less than 9th grade, 9th to 12th grade (no diploma), high school graduate (including equivalency), some college (no degree), associate’s degree, bachelor’s degree, graduate or professional degree).
- p1 is the portion of population with less than 9th grade education,
- p2 is the portion of population with 9th to 12th grade education,
- ……
- p7 is the portion of population with a graduate or professional degree.
- y1 is the years of schooling for an individual with less than 9th grade education, y1 = 4.5,
- y2 is the years of schooling for an individual with 9th to 12th grade education, y2 = 10,
- y3 is the years of schooling for an individual with high school education, y3 = 12,
- y4 is the years of schooling for an individual with some college education, y4 = 13,
- y5 is the years of schooling for an individual with an associate’s degree, y5 = 14,
- y6 is the years of schooling for an individual a bachelor’s degree, y6 = 16,
- y7 is the years of schooling for an individual with a graduate or professional degree, y7 = 18.
References
- CRED. Natural Disasters 2018; Centre for Research on the Epidemiology of Disasters: Brussels, Belgium, 2019. [Google Scholar]
- IPCC. Summary for Policymakers. In Climate Change 2014: Impacts, Adaptation, and Vulnerability. Part A: Global and Sectoral Aspects. Contribution of Working Group II to the Fifth Assessment Report of the Intergovernmental Panel on Climate Change; Field, C.B., Barros, V.R., Dokken, D.J., Mach, K.J., Mastrandrea, M.D., Bilir, T.E., Chatterjee, M., Ebi, K.L., Estrada, Y.O., Genova, R.C., et al., Eds.; Cambridge University Press: Cambridge, UK; New York, NY, USA, 2014; pp. 1–32. [Google Scholar]
- Knutson, T.; Camargo, S.J.; Chan, J.C.L.; Emanuel, K.; Ho, C.-H.; Kossin, J.; Mohapatra, M.; Satoh, M.; Sugi, M.; Walsh, K.; et al. Tropical Cyclones and Climate Change Assessment: Part II: Projected Response to Anthropogenic Warming. Bull. Am. Meteorol. Soc. 2020, 101, E303–E322. [Google Scholar] [CrossRef]
- Agency for Toxic Substances and Disease Registry. CDC’s Social Vulnerability Index (SVI); Agency for Toxic Substances and Disease Registry: Atlanta, GA, USA, 2018. [Google Scholar]
- Flanagan, B.E.; Hallisey, E.J.; Adams, E.; Lavery, A. Measuring Community Vulnerability to Natural and Anthropogenic Hazards: The Centers for Disease Control and Prevention’s Social Vulnerability Index. J. Environ. Health 2018, 80, 34–36. [Google Scholar] [PubMed]
- Kyne, D.; Aldrich, D.P. Capturing Bonding, Bridging, and Linking Social Capital through Publicly Available Data. Risk Hazards Crisis Public Policy 2020, 11, 61–86. [Google Scholar] [CrossRef]
- Cutter, S.L. Vulnerability to environmental hazards. Prog. Hum. Geogr. 1996, 20, 529–539. [Google Scholar] [CrossRef]
- White, G.F. Assessment of Research on Natural Hazards; The MIT Press environmental studies series; MIT Press: Cambridge, MA, USA, 1975; ISBN 0-262-08083-4. [Google Scholar]
- Flanagan, B.E.; Gregory, E.W.; Hallisey, E.J.; Heitgerd, J.L.; Lewis, B. A Social Vulnerability Index for Disaster Management. J. Homel. Secur. Emerg. Manag. 2011, 8. [Google Scholar] [CrossRef]
- Morrow, B.H. Identifying and Mapping Community Vulnerability. Disasters 1999, 23, 1–18. [Google Scholar] [CrossRef] [PubMed]
- Cutter, S.L.; Boruff, B.J.; Shirley, W.L. Social Vulnerability to Environmental Hazards. Soc. Sci. Q. 2003, 84, 242–261. [Google Scholar] [CrossRef]
- Federal Emergency Management Agency. The Disaster Declaration Process; Federal Emergency Management Agency: Washington, DC, USA, 2020.
- Davies, G. Pre-Modern Disaster Politics: Combating Catastrophe in the 1950s. Publius J. Fed. 2017, 47, 260–281. [Google Scholar] [CrossRef]
- Sherrieb, K.; Norris, F.H.; Galea, S. Measuring Capacities for Community Resilience. Soc. Indic. Res. 2010, 99, 227–247. [Google Scholar] [CrossRef]
- Aldrich, D.P. Building Resilience: Social Capital in Post-Disaster Recovery; University of Chicago Press: Chicago, IL, USA, 2012; ISBN 0–226–01287–5. [Google Scholar]
- Nakagawa, Y.; Shaw, R. Social Capital: A Missing Link to Disaster Recovery. Int. J. Mass Emergencies Disasters 2004, 22, 5–34. [Google Scholar]
- Norris, F.H.; Stevens, S.P.; Pfefferbaum, B.; Wyche, K.F.; Pfefferbaum, R.L. Community Resilience as a Metaphor, Theory, Set of Capacities, and Strategy for Disaster Readiness. Am. J. Community Psychol. 2008, 41, 127–150. [Google Scholar] [CrossRef] [PubMed]
- Putnam, R.D. Bowling alone: The Collapse and Revival of American Community; Simon & Schuster: New York, NY, USA, 2000; ISBN 978-0-684-83283-8. [Google Scholar]
- Aldrich, D.P.; Meyer, M.A. Social Capital and Community Resilience. Am. Behav. Sci. 2015, 59, 254–269. [Google Scholar] [CrossRef]
- MacGillivray, B.H. Beyond social capital: The norms, belief systems, and agency embedded in social networks shape resilience to climatic and geophysical hazards. Environ. Sci. Policy 2018, 89, 116–125. [Google Scholar] [CrossRef]
- Rupasingha, A.; Goetz, S.J.; Freshwater, D. The production of social capital in US counties. J. Socio-Econ. 2006, 35, 83–101. [Google Scholar] [CrossRef]
- Cangialosi, J.P.; Latto, A.S.; Berg, R. Tropical Cyclone Report: Hurricane Irma; National Hurricane Center: Miami, FL, USA, 2018. [Google Scholar]
- NOAA. Costliest U.S. Tropical Cyclones; NOAA, National Hurricane Center: Miami, FL, USA, 2020.
- Pasch, R.J.; Penny, A.B.; Berg, R. Tropical Cyclone Report: Hurricane Maria; National Hurricane Center: Miami, FL, USA, 2019.
- Thomas, V.; Wang, Y.; Fan, X. Measuring Education Inequality—Gini Coefficients of Education; World Bank: Washington, DC, USA, 2000. [Google Scholar]
- U.S. Census Bureau. American Community Survey, 2016 American Community Survey 5-year Estimates; U.S. Census Bureau: Suitland, MD, USA, 2017.
- ARA. ARA Hurricane Irma Wind Maps v12; ARA: Albuquerque, NM, USA, 2017. [Google Scholar]
- ARA. ARA Hurricane Maria Wind Maps v17; ARA: Albuquerque, NM, USA, 2017. [Google Scholar]
- Vugrin, E.D.; Warren, D.E.; Ehlen, M.A.; Camphouse, R.C. A Framework for Assessing the Resilience of Infrastructure and Economic Systems. In Sustainable and Resilient Critical Infrastructure Systems; Gopalakrishnan, K., Peeta, S., Eds.; Springer: Berlin/Heidelberg, Germany, 2010; pp. 77–116. ISBN 978–3-642–11404–5. [Google Scholar]
- Brown, D.; Saito, K.; Spence, R.; Chenvidyakarn, T.; Adams, B.; Mcmillan, A.; Ltd, I.; Platt, S. Indicators for Measuring, Monitoring and Evaluating Post-Disaster Recovery. In Proceedings of the 6th International Workshop on Remote Sensing for Disaster Applications, Pavia, Italy, 11–12 September 2008; p. 8. [Google Scholar]
- Brown, D.; Platt, S.; Bevington, J. Disaster Recovery Indicators; CURBE, Cambride University Centre for Risk in the Built Environment: Cambridge, UK, 2010; p. 134. [Google Scholar]
- Archer, R.S. Measuring and Monitoring Long Term Disaster Recovery Using Remote Sensing: A Case Study of Post Katrina New Orleans. In Proceedings of the AutoCarto 2012, Columbus, OH, USA, 16–18 September 2012. [Google Scholar]
- USACE. Corps Installs Last Blue Roof in Puerto Rico. Available online: https://www.army.mil/article/202599/corps_installs_last_blue_roof_in_puerto_rico (accessed on 29 April 2019).
- Florido, A. Two Years After Hurricane Maria, Blue Tarps Are Symbol of Island’s Slow Recovery; National Public Radio: Washington, DC, USA, 2019. [Google Scholar]


| Florida | Puerto Rico | |||||||||
|---|---|---|---|---|---|---|---|---|---|---|
| Factor | F1 | F2 | F3 | F4 | F5 | P1 | P2 | P3 | P4 | P5 |
| Intercept | −24.050 | −35.592 | −47.651 | −18.768 | −27.842 | −556.804 | −922.07 | −205.291 | −464.167 | −121.328 |
| Peak Gust | 0.418 | 0.520 | 0.686 | 0.510 | 0.502 | 8.007 | 10.43 | 6.444 | 6.970 | 6.659 |
| Overall SVI | 32.454 | 366.934 | ||||||||
| SVI Theme 1—Socioeconomic status | 37.823 | 527.93 | ||||||||
| SVI Theme 2—Household composition and disability | 31.073 | 31.519 | ||||||||
| SVI Theme 3—Minority Status and language | 4.689 | 426.763 | ||||||||
| SVI Theme 4—Housing and transportation | 26.227 | −187.174 | ||||||||
| N (observations) | 48 | 48 | 48 | 48 | 48 | 78 | 78 | 78 | 78 | 78 |
| R-squared | 0.248 | 0.302 | 0.222 | 0.094 | 0.1963 | 0.2269 | 0.2923 | 0.1343 | 0.269 | 0.1597 |
| Model F-statistic | 7.411 ** | 9.735 *** | 6.403 ** | 2.323 | 5.495 ** | 11.0 *** | 15.49 *** | 5.816 ** | 13.8 *** | 7.125 ** |
| Δ R-squared 1 | 0.157 | 0.211 | 0.131 | 0.003 | 0.1053 | 0.0929 | 0.1583 | 0.0003 | 0.135 | 0.0257 |
| Comparative F-statistic 1 | 9.371011 ** | 13.57736 *** | 7.553985 ** | 0.129139 | 5.87346 * | 9.060924 ** | 16.82916 *** | 0.069308 | 13.90219 *** | 2.338451 |
| Florida | Puerto Rico | |||||||
|---|---|---|---|---|---|---|---|---|
| Factor | F6 | F7 | F8 | F9 | P6 | P7 | P8 | P9 |
| Intercept | −92.7777 | 5.3577 | −58.7034 | −52.7140 | −20.920 | 29.272 | 13.357 | −1048 |
| Peak Gust | 1.0861 | 0.4726 | 0.8252 | 0.7974 | 5.989 | 6.631 | 6.526 | 9.037 |
| Overall SoCI | 61.9914 | −327.874 | ||||||
| Bonding SoCI | −28.5732 | −422.943 | ||||||
| Bridging SoCI | 58.3416 | −698.423 | ||||||
| Linking SoCI | 41.586 | 1503 | ||||||
| N (observations) | 48 | 48 | 48 | 48 | 78 | 78 | 78 | 78 |
| R-squared | 0.2234 | 0.1042 | 0.2838 | 0.1161 | 0.196 | 0.1358 | 0.307 | 0.3 |
| Model F-statistic | 6.473 ** | 2.617 | 8.915 *** | 2.954 | 9.144 *** | 5.893 ** | 16.6 *** | 16.07 *** |
| Δ R-squared 1 | 0.12519 | 0.00599 | 0.18559 | 0.01789 | 0.064 | 0.0038 | 0.175 | 0.168 |
| Comparative F-statistic 1 | 7.254 ** | 0.3 | 11.66 ** | 0.911 | 5.97 * | 0.33 | 18.94 *** | 18 *** |
| Puerto Rico Sample Tracts | |||||
|---|---|---|---|---|---|
| Factor | P1 | P2 | P3 | P4 | P5 |
| Overall SVI | 0.148 | ||||
| SVI Theme 1—Socioeconomic status | 0.187 | ||||
| SVI Theme 2—Household composition and disability | 0.033 | ||||
| SVI Theme 3—Minority Status and language | −0.045 | ||||
| SVI Theme 4—Housing and transportation | 0.155 | ||||
| Intercept | 0.584 | 0.565 | 0.640 | 0.677 | 0.572 |
| N (observations) | 36 | 36 | 36 | 36 | 36 |
| R-squared | 0.057 | 0.084 | 0.002 | 0.006 | 0.084 |
| F-statistic | 2.072 | 3.107 | 0.081 | 0.193 | 3.126 |
| Puerto Rico Sample Tracts | ||||
|---|---|---|---|---|
| Factor | P6 | P7 | P8 | P9 |
| Overall SoCI | 0.133 | |||
| Bonding SoCI | −0.686 | |||
| Bridging SoCI | 0.167 | |||
| Linking SoCI | 0.352 | |||
| Intercept | 0.591 | 1.071 | 0.589 | 0.532 |
| N (observations) | 36 | 36 | 36 | 36 |
| R-squared | 0.050 | 0.026 | 0.044 | 0.020 |
| F-statistic | 1.775 | 0.927 | 1.564 | 0.707 |
© 2020 by the authors. Licensee MDPI, Basel, Switzerland. This article is an open access article distributed under the terms and conditions of the Creative Commons Attribution (CC BY) license (http://creativecommons.org/licenses/by/4.0/).
Share and Cite
Rowan, S.; Kwiatkowski, K. Assessing the Relationship between Social Vulnerability, Social Capital, and Housing Resilience. Sustainability 2020, 12, 7718. https://doi.org/10.3390/su12187718
Rowan S, Kwiatkowski K. Assessing the Relationship between Social Vulnerability, Social Capital, and Housing Resilience. Sustainability. 2020; 12(18):7718. https://doi.org/10.3390/su12187718
Chicago/Turabian StyleRowan, Sebastian, and Kyle Kwiatkowski. 2020. "Assessing the Relationship between Social Vulnerability, Social Capital, and Housing Resilience" Sustainability 12, no. 18: 7718. https://doi.org/10.3390/su12187718
APA StyleRowan, S., & Kwiatkowski, K. (2020). Assessing the Relationship between Social Vulnerability, Social Capital, and Housing Resilience. Sustainability, 12(18), 7718. https://doi.org/10.3390/su12187718