Article

How Is Progress towards the Sustainable Development Goals Measured? Comparing Four Approaches for the EU

by
Guillaume Lafortune
1,*,
Grayson Fuller
1,
Guido Schmidt-Traub
1 and
Christian Kroll
2
1
Sustainable Development Solutions Network, 75009 Paris, France
2
SDG Index & Dashboards, Bertelsmann Stiftung, 10117 Berlin, Germany
*
Author to whom correspondence should be addressed.
Sustainability 2020, 12(18), 7675; https://doi.org/10.3390/su12187675
Submission received: 3 August 2020 / Revised: 10 September 2020 / Accepted: 11 September 2020 / Published: 17 September 2020
(This article belongs to the Special Issue Scientific Research on Sustainable Development Goals)

Abstract

:
Evidence-based policymaking must be rooted in sound data to inform policy priorities, budget allocations, and tracking of progress. This is especially true in the case of the Sustainable Development Goals (SDGs), as they provide the policy framework that all 193 UN member states have pledged to achieve by 2030. Good data and clear metrics are critical for each country to take stock of where it stands, devise pathways for achieving the goals, and track progress. Current assessments of the EU’s performance on the SDGs, however, tend to reach different findings and policy conclusions on where the priorities for further action lie, which can be confusing for researchers and policymakers. In order to demystify the drivers of such differences and make them transparent, this paper compares and contrasts the results obtained by four SDG monitoring approaches. We identify three main elements that are responsible for most of the differences: (i) the use of pre-defined targets for calculating baseline assessments and countries’ trajectories; (ii) the inclusion of measures that track not only domestic performance, but also the EU’s transboundary impacts on the rest of the world; and (iii) the use of non-official statistics to bridge data gaps, especially for biodiversity goals. This paper concludes that there is not one “correct” way of providing an assessment of whether the EU and EU member states are on track to achieve the goals, but we illustrate how the different results are the outcomes of certain methodological choices. More “forward-looking” policy trackers are needed to assess implementation efforts on key SDG transformations.

1. Introduction

Evidence-based policymaking means that decisions are guided by statistics and data that highlight remaining challenges and allow the identification of best practices. In other words, “what we measure affects what we do; and if our measurements are flawed, decisions may be distorted” [1]. The 17 Sustainable Development Goals (SDGs), adopted by all 193 UN member states, are the most prominent example at present that lay out quantitative targets for sustainable development to be achieved by 2030. They have enlarged the definition of sustainability to encompass economic, social, and environmental factors and are firmly rooted in the concept of sustainable development, i.e., “development that meets the needs of the present without compromising the ability of future generations to meet their own needs” [2,3]. The SDGs are linked with the Paris Climate Agreement (which is incorporated in SDG 13). They apply to developing and developed countries alike.
The European Union (EU), its institutions, and member states have played a key role in the adoption of the Agenda 2030, the SDGs, and the Paris Agreement. In particular, the EU and its member states were critical in pushing for an integrated, universal agenda that continues the Millennium Development Goals’ (MDGs’) focus on extreme poverty in all its forms and adds critical issues of environmental sustainability, social inclusion, economic development, and governance [4]. The EU, including the President of the European Commission (EC), have committed to achieving the SDGs in the EU [5,6] through the European Green Deal and other policy instruments [7]. In particular, the European Green Deal recognizes that “climate change and environmental degradation are an existential threat to Europe and the world” [7] and the need for a fair and just transition of energy systems and other sectors [8]. The EU recognizes that it faces major challenges in achieving the SDGs, and has committed to using the SDGs as a framework for its long-term strategy [9].
Good data and clear metrics are critical for each country to take stock of where it stands, devise pathways for achieving the goals, and track progress [10]. To this end, the UN Statistical Commission (UNSD) has identified, as of March 2020, 231 SDG indicators [11]. However, for many suggested indicators, data availability is poor, and several lack agreed statistical definitions. All countries should strive to improve data availability across all the SDG targets. In parallel to these efforts to strengthen data capacity and availability, as stated in the 2030 Agenda [12], countries need to measure their SDG performance based on available data and to adapt the SDG indicator set to their context.
Countries are invited to report their progress towards the SDGs in the form of Voluntary National Reviews (VNRs). Since 2016, some 218 VNRs have been presented [13], including one by the EU in July 2019. However, SDG performance cannot be compared across countries using VNR data, since they use indicators that are not harmonized and lack comparability. Moreover, many VNRs lack internationally comparable assessments of progress across all SDGs [14,15,16].
As a result, several reports track and compare countries’ performance against the SDGs using a mix of data sources. At the global level, the United Nations Department of Economic and Social Affairs (UNDESA) has released progress charts [17] and Sachs et al. an SDG Index and Dashboards [18,19,20,21]. The Organization for Economic Cooperation and Development (OECD) tracks SDG progress in OECD member countries [22,23,24]. For the EU, Eurostat releases an annual monitoring report [25,26,27]. In 2020, the Alleanza Italiana per lo Sviluppo Sostenibile (ASviS) published a first assessment of progress towards the SDGs in the EU [28]. The Sustainable Development Solutions Network (SDSN), in partnership with the Institute for European Environmental Policy (IEEP), released the European Sustainable Development Report 2019 (ESDR) [29].
For EU countries, available assessments generate different results. For instance, the SDSN analysis concludes that the EU faces major challenges on environmental and biodiversity goals (SDG12–15) and that progress towards these goals is too slow. Meanwhile, the OECD assessment considers that high-income countries (including many EU countries) perform best against these goals, with the largest achievement gaps in the areas of gender equality and education. Clearly, it is important for policymakers and the public to understand such differences in findings in order to evaluate policy action resulting from the findings.
The objective of this paper is therefore to uncover the drivers of the differing results obtained by the measurement choices under study. More specifically, our goal is to identify the key elements of the methodology and indicator selection that explain the difference between the SDSN’s results and those of other SDG monitoring instruments. Our paper will do so in the following three steps: First, it will identify the key differences in findings across four major assessments of SDG progress in EU countries. Second, it aims to determine how differences in methodology and indicator selection explain these differences. Third, it explores the role of organizational mandates in the choice of methodologies and indicators to track SDG performance at the country level. The paper concludes with a synthesis of lessons and areas for future research on how to track progress towards the SDGs in the European Union and elsewhere.

2. Background

2.1. Global Level

This paper aims to contribute to the knowledge on measuring sustainable development at the country level, especially on how to measure progress towards the SDGs. We build on a rapidly growing body of literature since the adoption of the 2030 Agenda and the SDGs in 2015 [10,30,31]. Many methodological and data discussions on defining sustainable development and how to measure it using comprehensive indicator frameworks predate the adoption of the SDGs [32,33,34].
The adoption of the SDGs was associated from the start with efforts to monitor these goals. Experiences with earlier global goals, including the Millennium Development Goals (MDGs), suggest that such goals can focus attention on complex sustainable development outcomes and accelerate progress towards these outcomes if they are supported by good data and accountability mechanisms [10,35]. In response, the Inter-Agency and Expert Group on SDG Indicators was established in March 2015 by the UN Statistics Division to recommend an SDG monitoring framework. In addition to this official process, numerous non-official initiatives track progress towards the SDGs at the level of countries [36,37], cities [38,39], businesses [40,41], and projects [42].
The Sustainable Development Report (SDR) 2020 identifies seven broad types of SDG data initiatives at the global level [43]: (i) international SDG monitoring reports; (ii) national SDG indicator and monitoring reports (e.g., VNRs); (iii) goal-specific monitoring initiatives; (iv) policy trackers; (v) subnational and city-level SDG assessments; (vi) corporate benchmarks and sustainability metrics; (vii) capacity-building and partnerships to develop alternative data sources.
This paper focuses on international SDG monitoring reports, which raises the question of how to compare results across multiple countries and goals. This, in turn, requires answers to two sets of issues: (i) data sources and indicator selection; (ii) methodological approaches for aggregating results by goals and by country.
The official SDG indicator framework currently comprises 231 indicators, which are divided into three tiers (1—method established and data widely available, 2—method established but limited data, 3—no internationally agreed-upon method) [44,45]. Only 123 indicators (53%) belong to tier 1, and the rest are assigned to tier 2 [46]. As a result, the official global SDG indicator framework is only partially operational, particularly in countries that have weak official data collection systems. Recognizing the difficulties of adopting a global indicator framework that works for all countries, the 2030 Agenda states that member states will develop their national indicators in line with the principle of the 2030 Agenda and that targets are defined as aspirational and global, with each government setting its own national targets guided by the global level of ambition, but taking into account national circumstances [12] (para 55).
The need for local adaptation of the indicators raises three sets of technical issues on which there is no consensus. The first issue relates to the choice of indicators. Some recommend to use no more than 100 indicators in order to keep national SDG monitoring manageable [47,48]. Others contend that monitoring only a subset of official global SDG indicators introduces biases, and criticize the SDG Index [43] for using only 40% of the global SDG indicators [49]. On the other hand, many tier 2 SDG indicators are currently not operational owing to a lack of data, so they need to be replaced with proxies. At the same time, the global SDG indicator framework has been criticized for missing critical metrics, such as for greenhouse gas emissions or international spillovers [10]. Indeed, the environmental global SDG indicators are only weakly aligned with well-established measures of environmental protection. If the SDGs are measured only using official global indicators, they cannot avoid environmental destruction [50].
The second question is how to compute the distance to SDG targets for each metric. The 2030 Agenda and the global SDG indicator framework provide no guidance on how to compute the distance to SDG targets. As a result, observers have developed a range of methodologies to quantify progress towards each SDG metric. They typically rely on identifying an upper threshold that corresponds to SDG achievement and can then be used to determine the distance to the target [10,51]. Other authors argue that where no quantitative SDG targets have been specified in the 2030 Agenda, the absolute distance to the target cannot be quantified [27]. The decision of whether to identify pre-defined targets has significant impacts on the interpretation of countries’ performance and pace of progress on the SDGs.
The third issue is how to aggregate information across several metrics, e.g., for each SDG. Many SDG tracking frameworks develop composite indices, which have well-known weaknesses but can synthesize complex information into a single number [52]. Such indices may be more effective in stimulating public debates than a large number of individual scores, which could result in cherry picking [10]. At the same time, composite indices are sensitive to methods selected at various stages of their construction, including indicator standardization (e.g., per capita, percent of GDP, absolute values), indicator normalization (min–max, Z-Score, Mazziotta–Pareto index, etc.), aggregation (e.g., arithmetic average, geometric average, etc.), and weights (equal, mathematical, expert-based).

2.2. SDG Monitoring for the EU

The EU had integrated sustainable development into its activities, including data and statistics, long before the adoption of the SDGs. Article 11 of the Treaty on the Functioning of the European Union (TFEU) stipulates that “Environmental protection requirements must be integrated into the definition and implementation of the Union’s policies and activities, in particular with a view to promote sustainable development” [53]. The first European strategy to promote sustainable development was adopted in 2001 and revised in 2006. Between 2007 and 2015, the European Commission published a biennial report on progress made in implementing the strategies based on a dashboard of Sustainable Development Indicators (SDIs). The “Europe 2020” strategy, the ten-year framework of the European Union to coordinate economic policies, also integrated sustainability targets and objectives.
As a data-rich environment, the EU is driving many of the improvements in data and statistics on the SDGs. In particular, Eurostat, the European Environmental Agency, DG Environment, and the Joint Research Centre have contributed to SDG monitoring. As one example, the EU is mobilizing Copernicus, the European Union’s flagship program for Earth Observation and Monitoring, to strengthen data availability and quality and to support the achievement of the SDGs [54].
Four major reports provide a comparative assessment of the performance of the European Union and its member countries (or most of the EU member countries) on the 17 SDGs.
  • Europe Sustainable Development Report [29]: Produced by the SDSN and IEEP, the report tracks the performance of all EU member states and the United Kingdom, as well as the European Union as a whole. It was released for the first time in 2019. It is based on a peer-reviewed and statistically audited methodology.
  • Measuring Distance to SDG Targets 2019 [24]: Produced by the OECD in 2016, 2017, and 2019, the report tracks the performance of OECD countries on the SDGs. It calculates distance to targets and groups countries according to whether trends are moving in the right or wrong direction.
  • Monitoring Report on Progress Towards the SDGs in an EU Context [27]: This report, produced by Eurostat every year since 2016, provides a snapshot of progress of the EU on the SDGs. Unlike the SDSN and OECD reports, it focuses only on trends over time rather than performance at one point in time. Individual indicators are presented for individual EU member states, but until the 2019 edition aggregate results at the goal level are only available at the level of the Union as a whole.
  • Measuring the Situation of the European Union with regard to the SDGs [28]: Produced in 2019 by ASviS, the report tracks the progress of the EU on each of the SDGs using a subset of Eurostat’s SDG indicators covering the period 2010–2017. The year 2010 represents the reference value (equal to 100), while the evolution of the indicators shows the improvement (if the value rises) or the deterioration (if it falls) of the situation compared to the value for 2010.
Some of these reports are used extensively as input for communication on SDGs, for reference in VNRs presented at the UN High-Level Political Forum, and for identifying data and research gaps. They are also cited in the EU’s official communications and policy reports [55] and are used extensively by civil society for advocacy [56,57,58].
In addition to these four major reports, UNDESA released the SDG Progress Chart 2019, which presents aggregate summary results for “Europe and North America” [17]. The Sustainable Development Index (SDI) also covers European countries, but it does not aim to strictly measure the SDGs [59].
To our knowledge, only two papers compare findings across SDG monitoring reports for EU countries. Lafortune and Schmidt-Traub (2019) provide a qualitative comparison of the findings obtained by the SDSN global report and Eurostat’s report [51], with some references to the OECD report, as well. The authors propose a three-pillar framework to gauge the robustness and fitness of SDG monitoring in the EU. This framework underlines the role of methodological choices (including setting targets and indicator selection) in explaining differences between SDSN’s and Eurostat’s assessments. It emphasizes the importance of stakeholder engagement in designing composite indicators for robustness and impact. However, this paper was published before the release of the European edition of the SDSN SDR, and does not include a comparison with the findings from the OECD and ASviS reports.
Miola and Schiltz (2019) have applied three calculation methods to the Eurostat SDG indicator set and the SDSN global indicator set to evaluate the sensitivity of the results to the methodology and indicator selection [60]. The authors find that countries’ relative positions depend almost entirely on the chosen method and indicators. The authors conclude that ranking countries is not a suitable approach for tracking the 2030 Agenda, and that efforts should be concentrated on identifying context-specific indicators and interlinkages across SDGs.
In this paper, we aim to expand on the work of Lafortune and Schmidt-Traub (2019) and Miola and Fritz (2019) in three ways: first, by updating and expanding the quantitative assessment to compare and contrast findings across four monitoring reports covering EU countries; second, by digging deeper into which elements of the methodology and indicator selection explain most of the differences in findings; and third, by conducting a meta-analysis of the role of organizational mandates and status that might explain the adoption of a certain method and indicator set to track the SDGs. The paper also identifies opportunities for further research to assess countries’ progress on the SDGs.

3. Data and Methods

3.1. Data

This paper focuses on four SDG reports produced by the SDSN, the OECD, Eurostat, and ASviS that aggregate summary results on the performance of the EU and its member states with respect to the 17 SDGs. All four reports provide (i) a list of SDG indicators considered in the assessment; (ii) a methodology for transforming the raw data into actionable insights (scores, arrows, trend lines, etc.); and (iii) results aggregated at the goal level. In their 2019 editions, the SDSN, Eurostat, and ASviS reports cover all 28 EU member states (published before Brexit), whereas the OECD report covers the 23 EU countries that are members of the OECD. Many other reports and initiatives track the EU’s actions on sustainability and the SDGs, but they either focus on specific SDGs (e.g., climate, inequalities, etc.) or do not generate aggregate summary results for each goal.
All four reports use a different methodology and indicator set. Table 1 summarizes key characteristics of each assessment. The number of SDG indicators varies from 77 in ASviS to 132 in the OECD. Eurostat uses 99 single-use indicators, and SDSN uses 113 indicators. The SDSN, Eurostat, and ASviS reports only focus on EU countries. The OECD report covers 23 EU member states and 13 non-EU countries. The SDSN reports provide both a “static” assessment (distance of EU member states to SDG targets at one point in time) and a “dynamic” assessment (progress of EU member states towards the SDG targets over time). Eurostat and ASviS focus only on “dynamic” assessments of countries’ trajectories. Each report uses different methodologies to treat outliers, normalize indicators (min–max in SDSN, modified Z-Scores in OECD), or aggregate results (arithmetic average in SDSN, Adjusted Mazziotta–Pareto Index in ASviS).
Due to data limitations, the four reports do not present aggregate results for some goals. The SDSN report does not compute trends for SDG12. The Eurostat report does not report summary trends for SDG6, SDG12, SDG14, and SDG16. The ASviS report does not cover trends for SDG6. The SDSN EU aggregate covers the EU27, whereas it is for EU28 for Eurostat and ASviS. The OECD covers all goals in its static and dynamic assessment, but has a dedicated section on data gaps and limitations.
Trajectories are presented in different ways across the four reports. They are presented as “arrows” (SDSN and Eurostat), country “clusters” (OECD), or “curves” (ASviS). The SDSN and Eurostat approaches use five trend categories (including a “not available” category). The SDSN includes a “stagnating” category, whereas Eurostat’s categories always denote progress towards the SDGs (significant or moderate) or movement away from the SDGs (significant or moderate). The OECD includes three “clusters” that capture progress, movement away, and no identified trend. ASviS uses charts to track goal and indicator trajectories for each year covered. Table 2 summarizes the approaches used across the four reports.

3.2. Method

Our objective is to understand the role of methodological choices and indicator selection in explaining differences in published assessments of the SDG performance in the EU as a whole and in EU member states. In particular, we aim to explain difference in results for the EU between the SDSN’s report and other reports. We use a mix of quantitative and qualitative methods. The full details of the method are provided in the Supplementary Materials section.
We start by presenting a snapshot of synergies and differences in “baseline assessments” (or static assessments). To disentangle the effects of methodology versus indicator selection on baseline assessments, we apply the SDSN’s methodology to the OECD, Eurostat, and ASviS indicator sets. This approach allows us to control for differences in methodology (relating to indicator standardization, normalization, and data aggregation) and, therefore, to isolate the impact of the indicator selection in explaining differences between the SDSN’s results and those of other reports. We then look at the impact of various adjustment scenarios on correlation coefficients of goal scores. We focus on the aggregate results presented for the 23 EU member states covered in all reports. Although Eurostat’s and ASviS’s reports were not designed to track distance to targets at one point in time (baseline assessment), an indicative comparison with results obtained with these two reports for the same 23 EU member states is provided.
As further described in the Supplementary Materials, we design three adjustment scenarios (basic, moderate, and high) to control for the effects of methodologies. This is meant to help identify the marginal impact of specific adjustments to the methodology and indicator selection. Each scenario is cumulative and adds on top of the other (Table 3). The basic scenario only focuses on applying the SDSN’s methodology (normalization and aggregation) to the indicator selection used in other reports. The moderate scenario makes some additional adjustments, including the use of per capita as the main denominator when applicable, the removal of multi-purpose indicators, and the removal of indicators for which goal achievement cannot be unambiguously specified because the normative direction (what is good performance and what is poor performance) is unclear. This moderate adjustment scenario implies more expert judgement from the authors. Finally, in the third scenario, we remove transboundary impact indicators from the SDSN’s methodology to evaluate to what extent the inclusion of these indicators explains the difference in baseline assessments for environmental, biodiversity, and other goals.
The comparison of trajectories uses a different methodological approach. It is not possible to quantitatively compare trajectories across the four reports. The main challenge is that the reports do not assess trajectories as scores, but rather as arrows (SDSN and Eurostat), clusters of countries (OECD), or line charts (ASviS). We therefore use qualitative approaches to highlight the impacts of different methods to the compute trajectories of the overall findings. The analysis primarily compares trajectories presented by the SDSN, Eurostat, and ASviS across the EU member states covered in each report. This is because, unlike for baseline assessments, it was not possible to replicate the OECD’s trend assessment just for the 23 EU member states using publicly available information. The OECD’s findings are still included in the comparative assessment, but should be considered as illustrative.
Further details on the method are available in the Supplementary Materials section.

4. Results

4.1. Overall Findings across the Four SDG Monitoring Instruments

All four SDG monitoring reports conclude that the EU and its member states have not achieved the SDGs and are not on track to achieve some of the goals and targets. The SDSN writes that “no European country is on track towards achieving the goals.” The OECD considers that “for seven indicators, more than one third of OECD countries have been moving in recent years away from their 2030 targets.” Eurostat finds that the EU’s progress is neutral or moving away from the targets on two SDGs. ASviS concludes that the EU’s performance is stagnating for one goal and has worsened for two goals. Other international reports also call for further efforts from high-income countries, including EU countries, to strengthen their commitment and policies towards sustainable development [61,62].

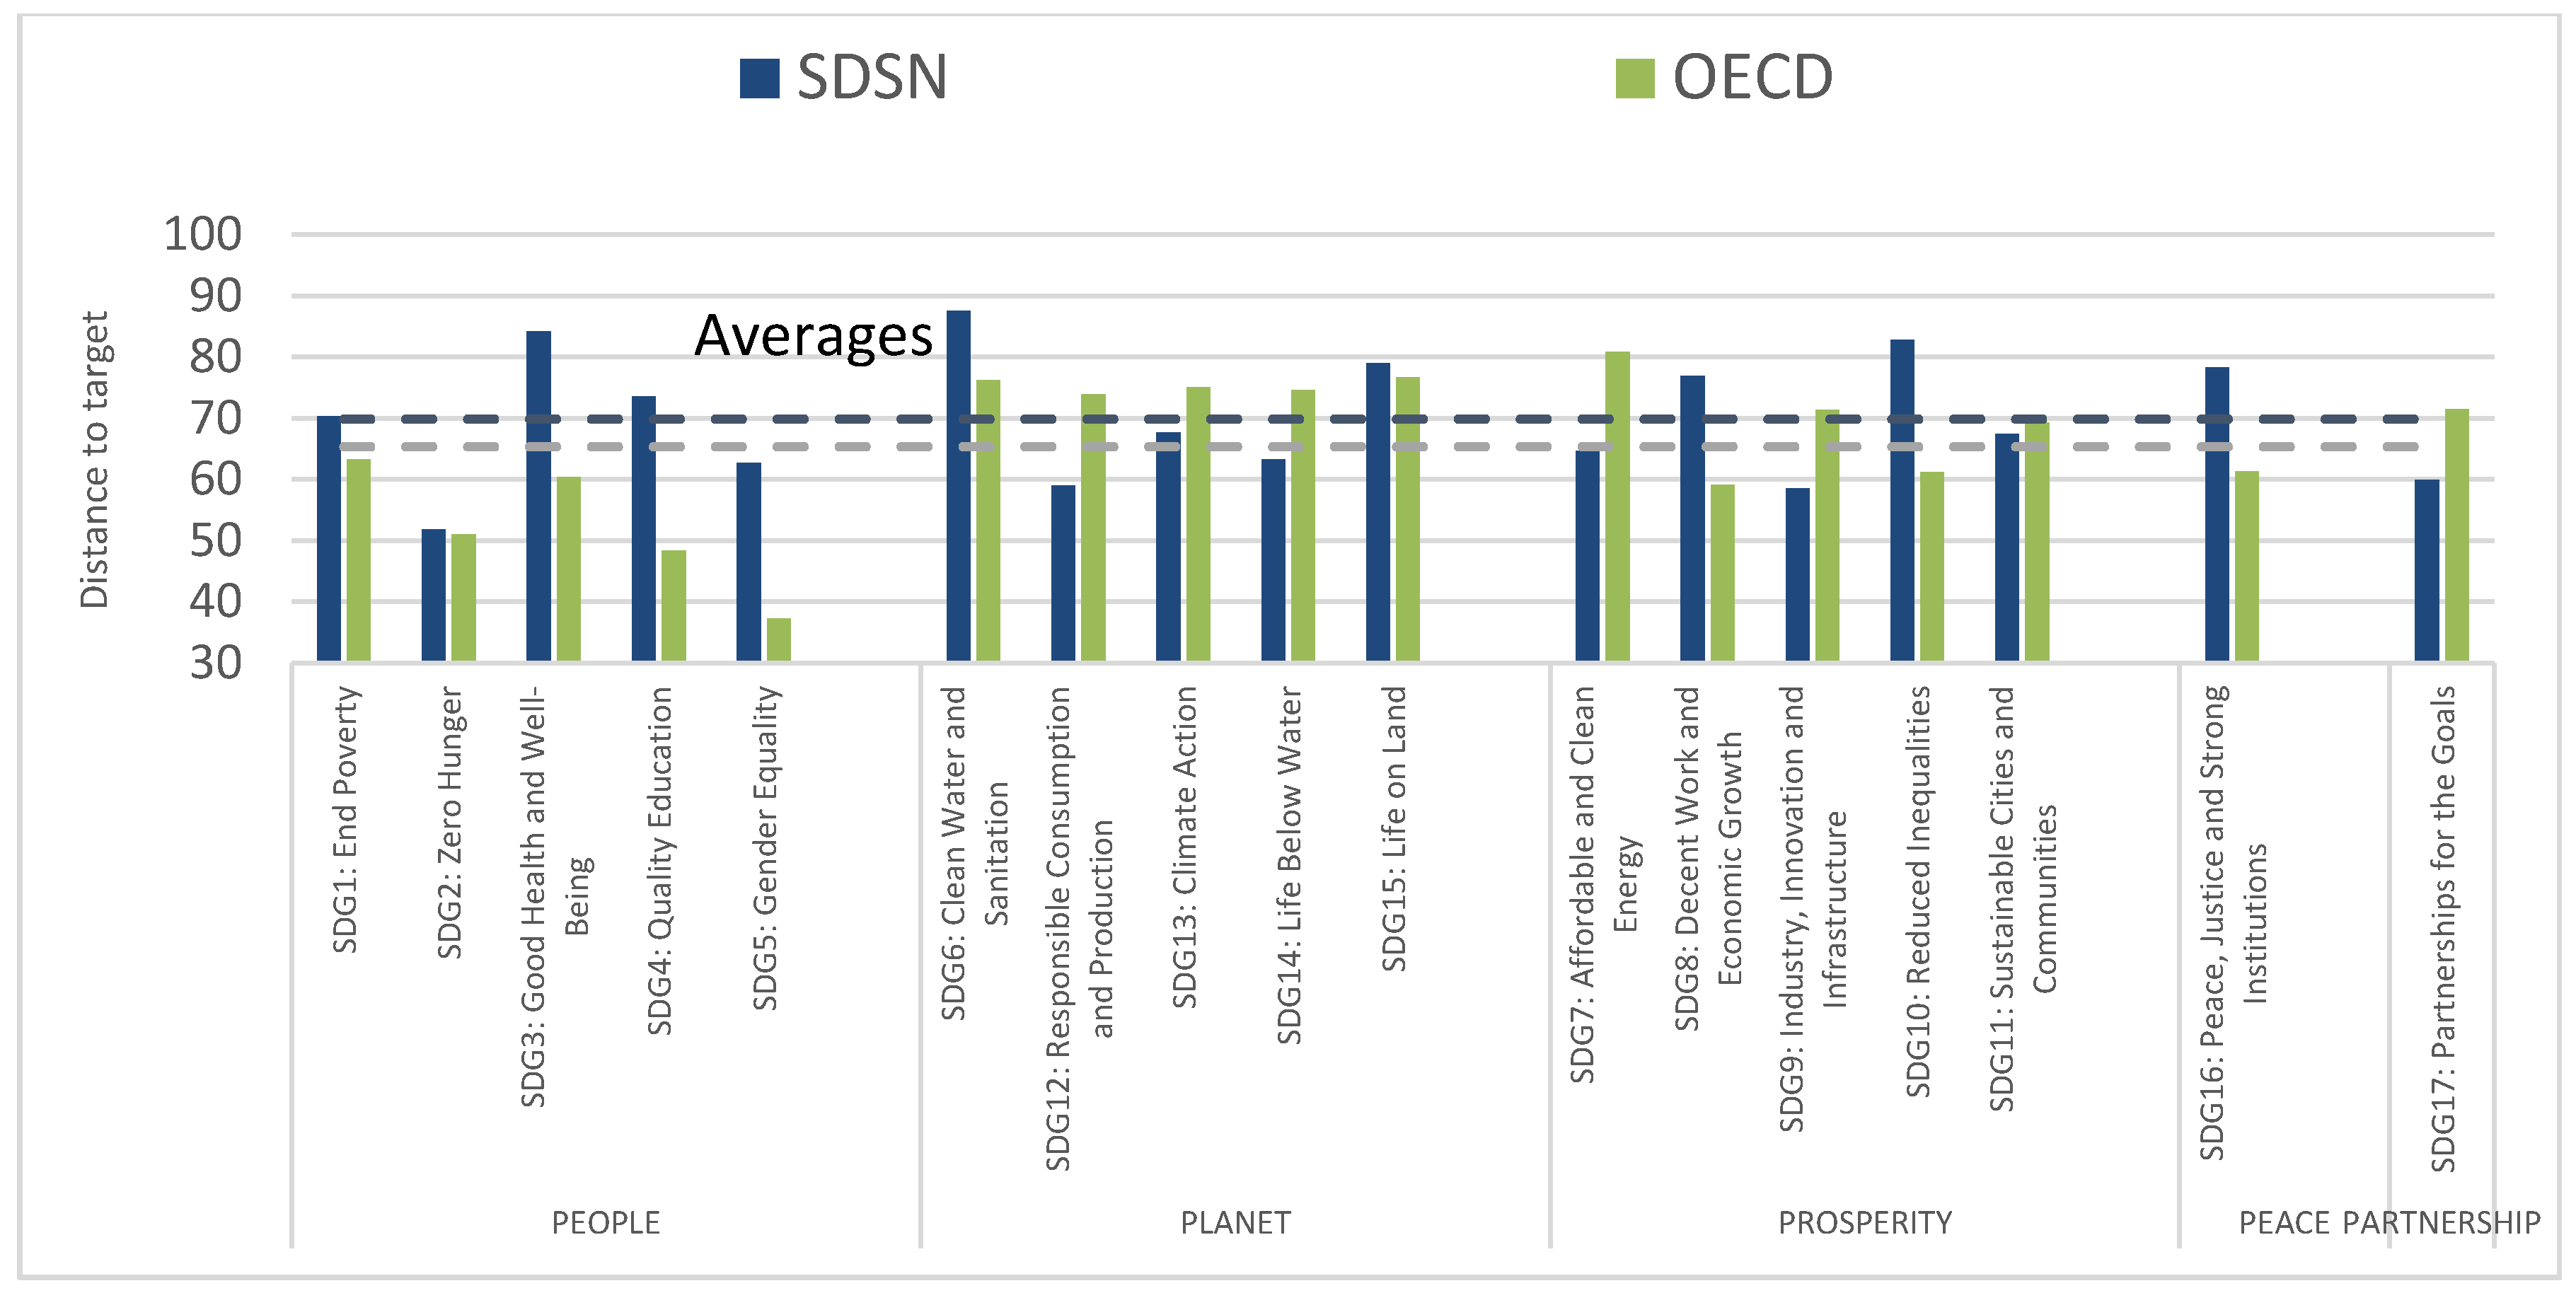
4.2. Main Differences in Baseline Assessments

The SDSN and OECD reports assess how far countries have progressed towards each SDG at a given point in time (so called baseline or static assessments). We compare average results obtained for the 23 EU member states covered in both reports. At the time when the reports were launched, Brexit was not yet completed, so the United Kingdom was retained. Bulgaria, Croatia, Cyprus, Malta, and Romania are not members of the OECD and are not covered in the OECD SDG report. For the SDSN, scores were obtained by calculating the arithmetic average of all goal scores for all 23 countries. The same approach was used to generate the OECD scores, but in addition, OECD scores were rescaled from 0–100 (originally from 0 to 3). Figure 1 compares the estimated average performance of EU member states for each goal.
The EU average performance in both reports is rather similar for five out of the seventeen SDGs. In both reports, the scores for SDG2 and SDG5 are below average. In both reports, scores for SDG6 and SDG15 are above average. Scores obtained in both reports for SDG11 are rather similar and close to the average.
However, there are major differences in scores and relative SDG ranks between the two reports. The overall score and SDG ranks show no significant correlation—0.05 and 0.04, respectively. On one hand, the 23 EU member states perform worse according to the SDSN methodology than according to the OECD methodology on most SDGs related to “Planet”, including SDG12, SDG13, and SDG14. In the SDSN methodology, the scores obtained on these three goals are much lower than the average SDG score, whereas the OECD report concludes the reverse. Similarly, the estimated performance against SDG7, SDG9, and SDG17 is also much higher in the OECD report than in the SDSN report. Conversely, countries perform better in the SDSN report on the goals related to “People”, including SDG3, and SDG4. They also perform better on SDG8, SDG10, and SDG16.
These differences in scores lead to differences in the relative performances (ranks) of countries on each SDG. Figure S1 (Supplementary Materials), reinforces the findings presented above by focusing on relative SDG rankings in both reports. For our comparison, we consider rank differences greater than four as denoting a significant difference in results.
Focusing on countries’ ranks instead of scores, EU countries perform similarly in both the OECD and SDSN reports on SDG1, SDG6, SDG11, and SDG15 (medium performance), as well as on SDG2 and SDG5 (poor performance). By contrast, EU countries obtain a better performance in the OECD report than in the SDSN report on SDG7, SDG9, SDG12, SDG13, SDG14, and SDG17. EU countries perform worse in the OECD report than in the SDSN report on SDG3, SDG4, SDG8, and SDG16.
In addition to the graphical representation of the differences in findings presented above, the narrative sections of both reports also reflect these differences. The OECD mentions in their 2019 SDG report that “OECD countries are, on average, closest to achieving goals on Energy, Cities, and Climate (goals 7, 11, and 13) and goals relating to Planet (Water, 6; Sustainable Production, 12; Climate, 13; Oceans, 14; and Biodiversity, 15).” By contrast, the SDSN concludes that these are among the goals where the EU as a whole and the individual EU member states face the greatest challenges (especially SDGs 12, 13, and 15).

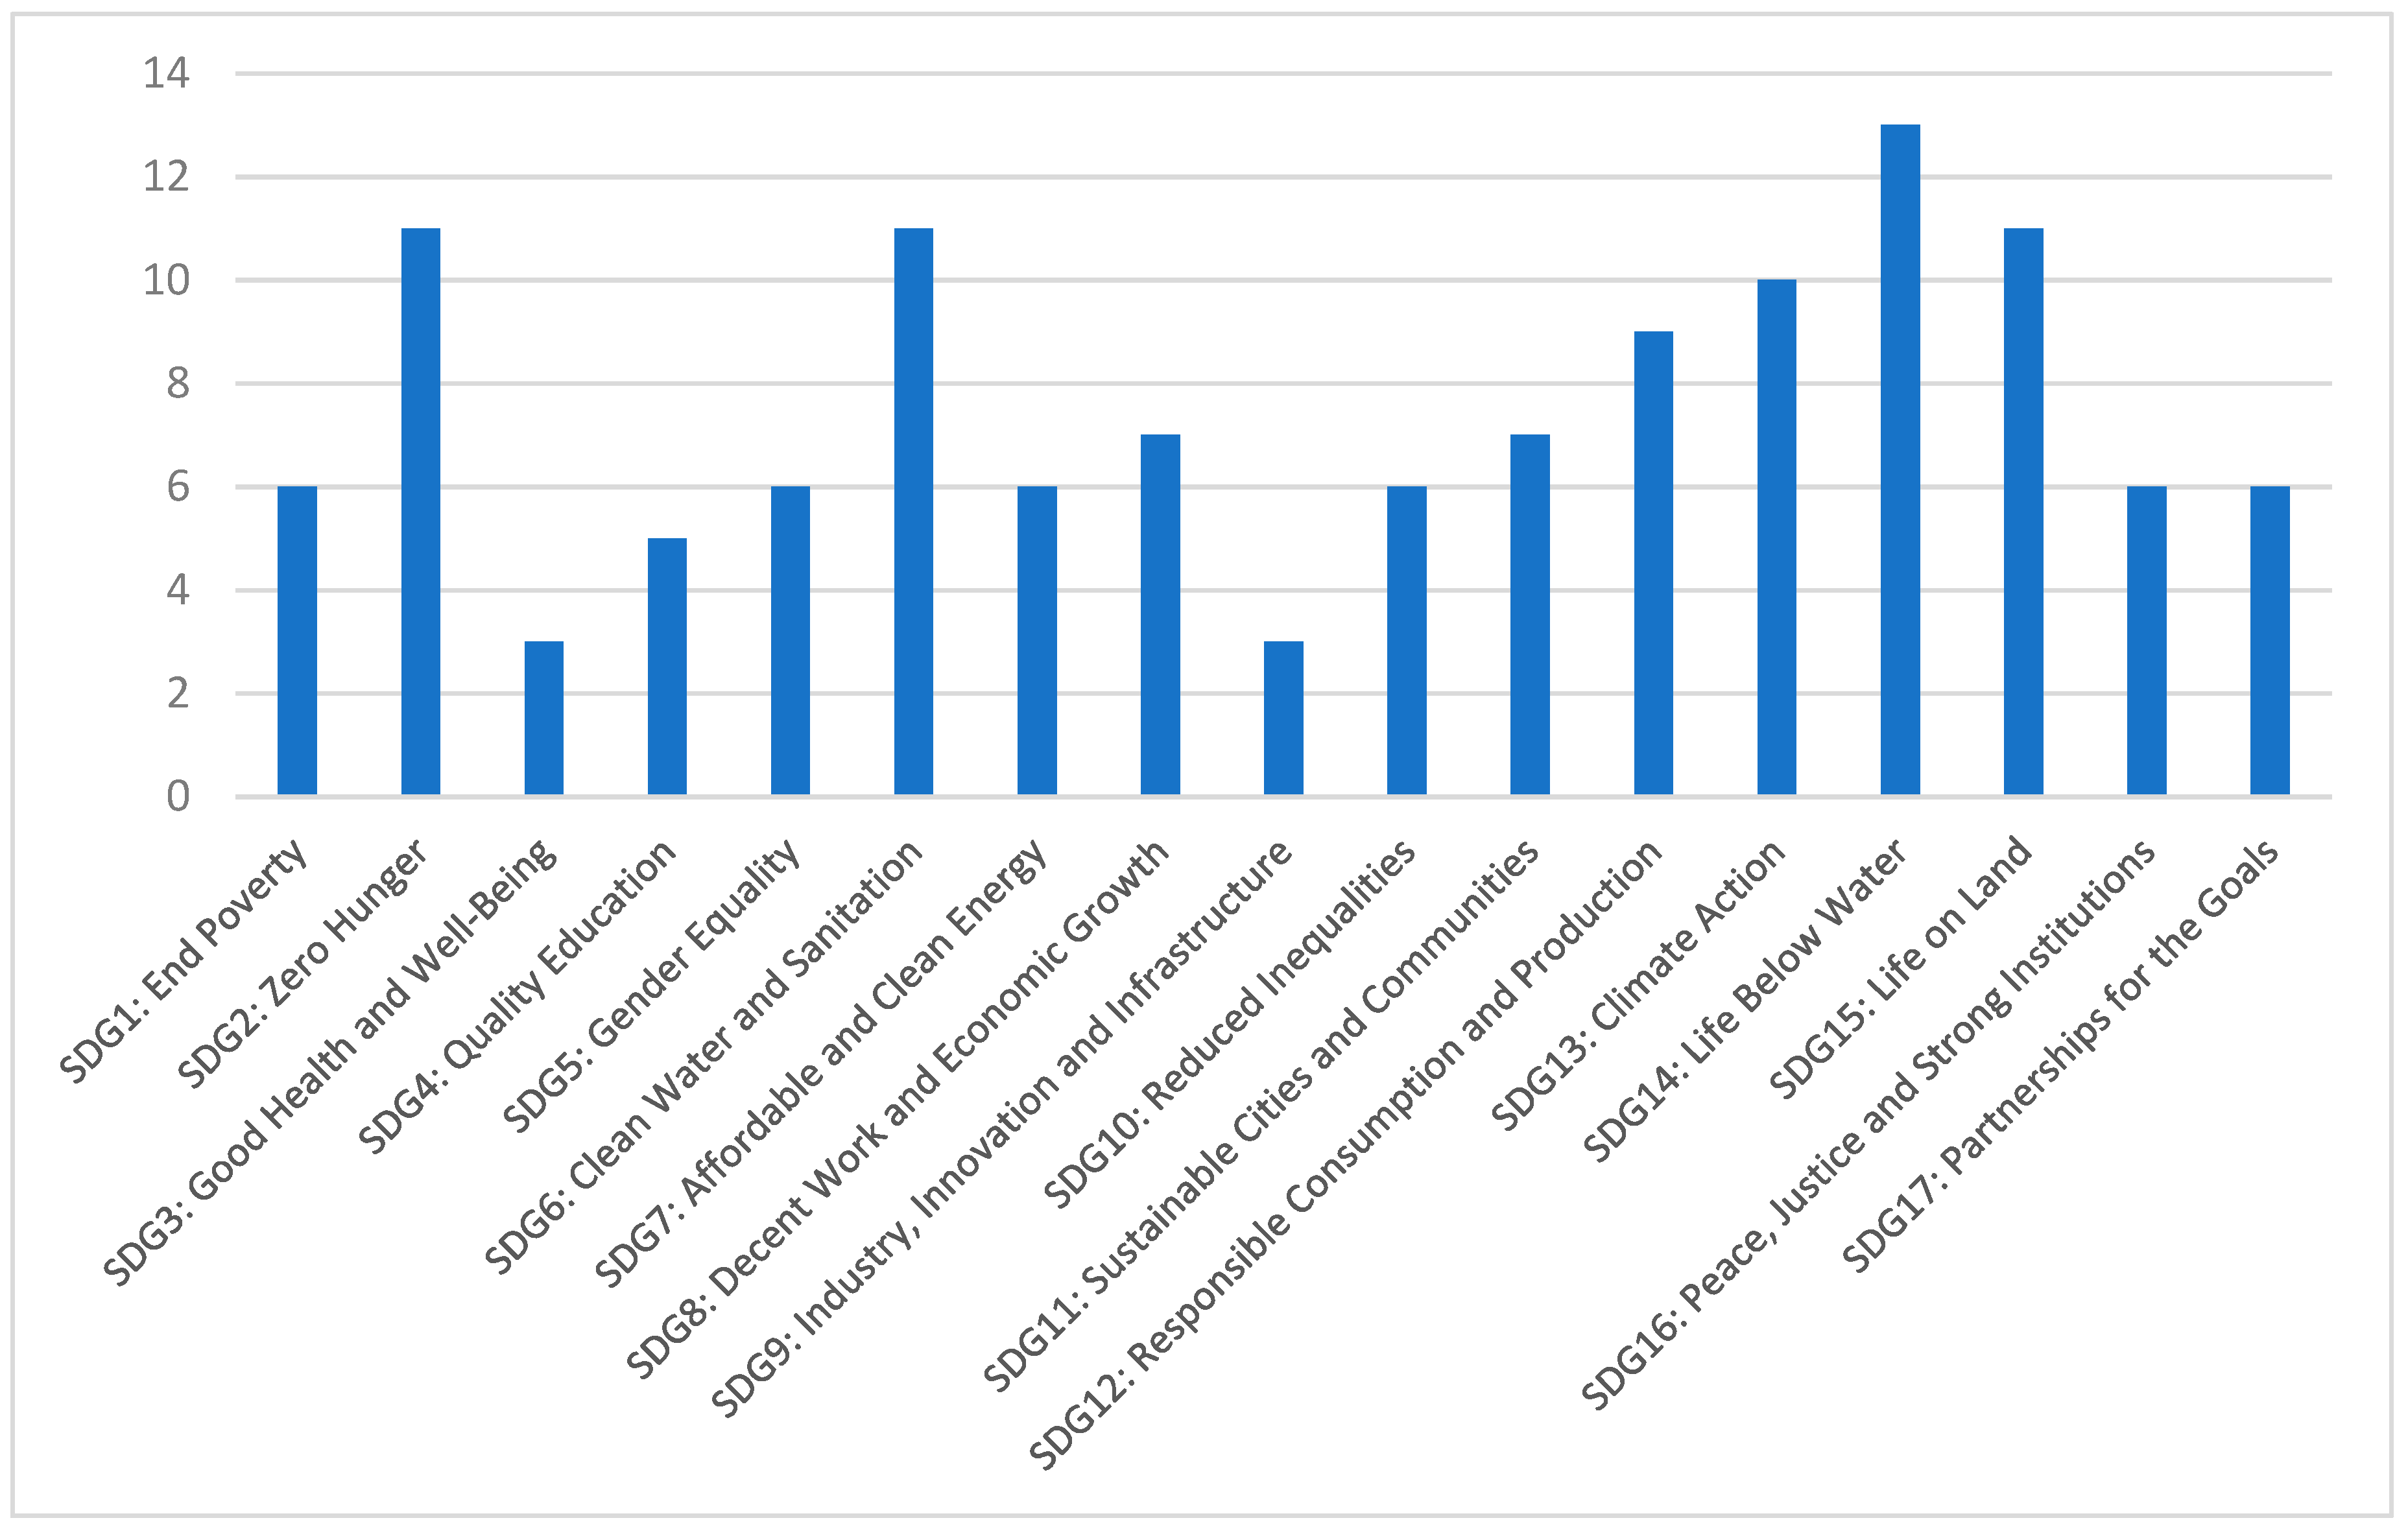
4.3. The Influence of Methodology Versus Indicator Selection in Baseline Assessments

We find that the results of the SDSN and the OECD do not become more comparable after controlling for differences in methodologies under scenarios 1 and 2. The goals that correlated well between the SDSN and OECD reports before doing any adjustments also correlate well under adjustment scenarios 1 and 2. Table S1 (Supplementary Material) presents correlation coefficients between the SDSN’s goal scores and those of the three other reports under various adjustment scenarios. Goals that did not correlate well, mainly environmental and biodiversity goals, continue to correlate poorly among each other in adjustment scenarios 1 and 2.
When applying the SDSN methodology, the results obtained by the SDSN, Eurostat, and ASviS reports generally tend to be more consistent with each other than with the OECD results. Table 4; Table 5 present overall score and rank correlation coefficients between all four reports in scenario 2.
These results are explained by the choice of indicators and data sources. The SDSN, Eurostat, and ASviS rely extensively on data collected and compiled by the European Commission services (Eurostat, Joint Research Center, European Environmental Agency, etc.). In contrast, the OECD uses more OECD data and other data sources. The Eurostat and ASviS reports obtain the highest scores and rank correlations because ASviS considers a subset of the SDG indicators selected by Eurostat.
Performances on SDGs 3–5, 9, and 10 are highly correlated across all four reports because similar indicators are used. Typically, these goals cover a more homogeneous set of policy issues. We computed the median rank difference between the maximum rank and the minimum rank obtained for each goal and each country across the four indicator sets under adjustment scenario 2 (Figure 2). Overall, countries’ ranks on SDG3 and SDG9 are very consistent. These are the goals where inter-item correlations across indicators tend to be highest. In other words, their measurement is homogeneous across indicators. As a result, the choice of indicators for these goals has a smaller impact on overall results compared with other goals that cover more heterogeneous issues.
Some goals are more heterogeneous and, therefore, are much more sensitive to the selection of indicators. Overall, the median rank difference is highest for biodiversity and other environmental goals (SDG6, SDG12–15) as well as for SDG2. Researchers have demonstrated the high heterogeneity of biodiversity and other environmental goals (especially SDG7, SDG13, and SDG15) [63]. Earlier analyses conducted by the SDSN using its global dataset and based on Principal Component Analysis (PCA) also demonstrated high heterogeneity for SDG2, which captures three distinct components: undernourishment, malnourishment, and sustainable agriculture [64]. Assessments of SDG progress in the EU only (SDSN, Eurostat, and ASviS) do not cover undernourishment and food insecurity, whereas the OECD covers these aspects under SDG2. The SDSN, the OECD, and Eurostat track obesity rates, whereas ASviS focuses on agricultural efficiency (income per annual work unit), research and development, and sustainability (e.g., area under organic farming). These differences in indicator coverage under SDG2 have a significant impact on countries’ scores and rankings.
We also find that the sensitivity of the results to the indicator selection is more important for certain EU countries. After calculating goal scores under scenario 2 for all four reports, we generate countries’ ranks on all seventeen goals across all four reports. We then calculate the difference between the maximum rank and the minimum rank obtained for each country and for each goal. We then compute the median rank difference across the seventeen goals to obtain this overview. We use the median instead of the mean in order to reduce the influence of strong outliers. Rank differences for all goals are available in the Supplementary Material.
Overall, we find that countries’ ranks across the seventeen SDGs and the four reports under scenario 2 are more consistent for Austria, Spain, Sweden, and the United Kingdom (Figure 3). In turn, the sensitivity to the indicator selection is more pronounced for Greece, Ireland, and Portugal. For Greece, this is explained by a much better ranking on SDG7 in the OECD report compared to the SDSN, Eurostat, and ASviS reports. Greece ranks better in the SDSN report on SDG17 compared with the OECD, Eurostat, and ASviS reports mainly due to the inclusion of financial spillover effects (tax havens, profit shifting, financial secrecy) in the SDSN report, where Greece performs better than many EU countries, including Ireland, Luxembourg, the Netherlands, and the United Kingdom.
Table S2 (Supplementary Material) presents the difference between the maximum and minimum rankings obtained for each goal and every country after controlling for methodologies in all four reports.

4.4. The Impact of the Inclusion of Transboundary Impact Measures in Explaining Differences in Baseline Assessments for Environmental and Biodiversity Goals

The removal of spillover indicators from the SDSN assessment helps narrow the differences between results in the SDSN and the OECD baseline assessments for SDG12, SDG13, and SDG17. It also brings the results closer to Eurostat’s and ASviS’s illustrative goal scores. This is highlighted by the increased correlation coefficient in Table S1 (Supplementary Material) between scenarios 2 and 3 for these three goals in all three reports. One indicator was removed under SDG6 (imported groundwater depletion), one under SDG8 (fatal work-related accidents embodied in imports (per 100,000 population), two under SDG12 (imported SO2 emissions and imported reactive nitrogen), two under SDG13 (imported CO2 emissions and contribution to the international 100bn USD commitment on climate related expending), one under SDG15 (imported biodiversity threats) one under SDG16 (exports of major conventional weapons) and two under SDG17 (shifted profits and corporate tax haven score).
However, even after controlling for methodologies and after removing spillover indicators, the results for SDG14 and SDG15 remain very different between SDSN reports and the three other reports. Under the most adjusted scenario, the results for SDG14 in the SDSN report correlated negatively with the OECD results, and exhibit moderate correlations with the Eurostat and ASviS reports. There are no differences between scenarios 2 and 3 because no spillover measures are included under SDG14. Under scenario 2, SDG14 is the best-performing goal for 23 EU member countries according to the OECD analysis, whereas it is ranked 11th in the SDSN assessment. Scores on a 0–100 scale are very different between the SDSN (63.3%) and OECD (86.2%). Under scenario 2, two indicators out of three were removed from the OECD indicator list: the aggregated indicator for policies and practices against Illegal, unreported and unregulated(IUU) fishing and budgetary transfers to individual fishers. Only protected areas as a share of the Exclusive Economic Zone (EEZ) were retained. The inclusion in the SDSN’s indicator list of two indicators that come from non-official statistics on unsustainable fisheries (fish stocks overexploited or collapsed and trawling) explain, to a large extent, the discrepancy in results for SDG14 compared with the other reports.
SDG 15 is an interesting case. The original average scores obtained between the SDSN and OECD reports are quite comparable, yet the performances obtained by individual countries are not at all similar between the two reports. This explains the poor correlation between scores for this goal between the SDSN and OECD reports (0.07 in the best scenario). In the SDSN report, Estonia, Latvia, and Lithuania rank highest for SDG15, and Germany performs rather poorly. In the OECD report, however, Latvia and Lithuania are two worst performers on SDG15, and Germany tops the ranking. This is explained, to a large extent, by the inclusion of a transboundary impact measure (imported biodiversity threats) in the SDSN report to capture impacts generated by the EU and EU member states on biodiversity threats in other countries through trade and consumption. It is further explained by the inclusion in the SDSN report of metrics on pollution in rivers and groundwater, whereas the OECD report gives greater weight to forests and protected areas. The various adjustments we make to the calculation of SDG15 do not increase correlation across results in the reports. The difference with the Eurostat and ASviS assessments is explained primarily by the use of global indicators of biodiversity loss and protected areas in the SDSN report (Red List Index, Protected Key Biodiversity Areas), whereas Eurostat and ASviS make more extensive use of EU-specific frameworks (e.g., surface of terrestrial sites designated under Natura 2000).

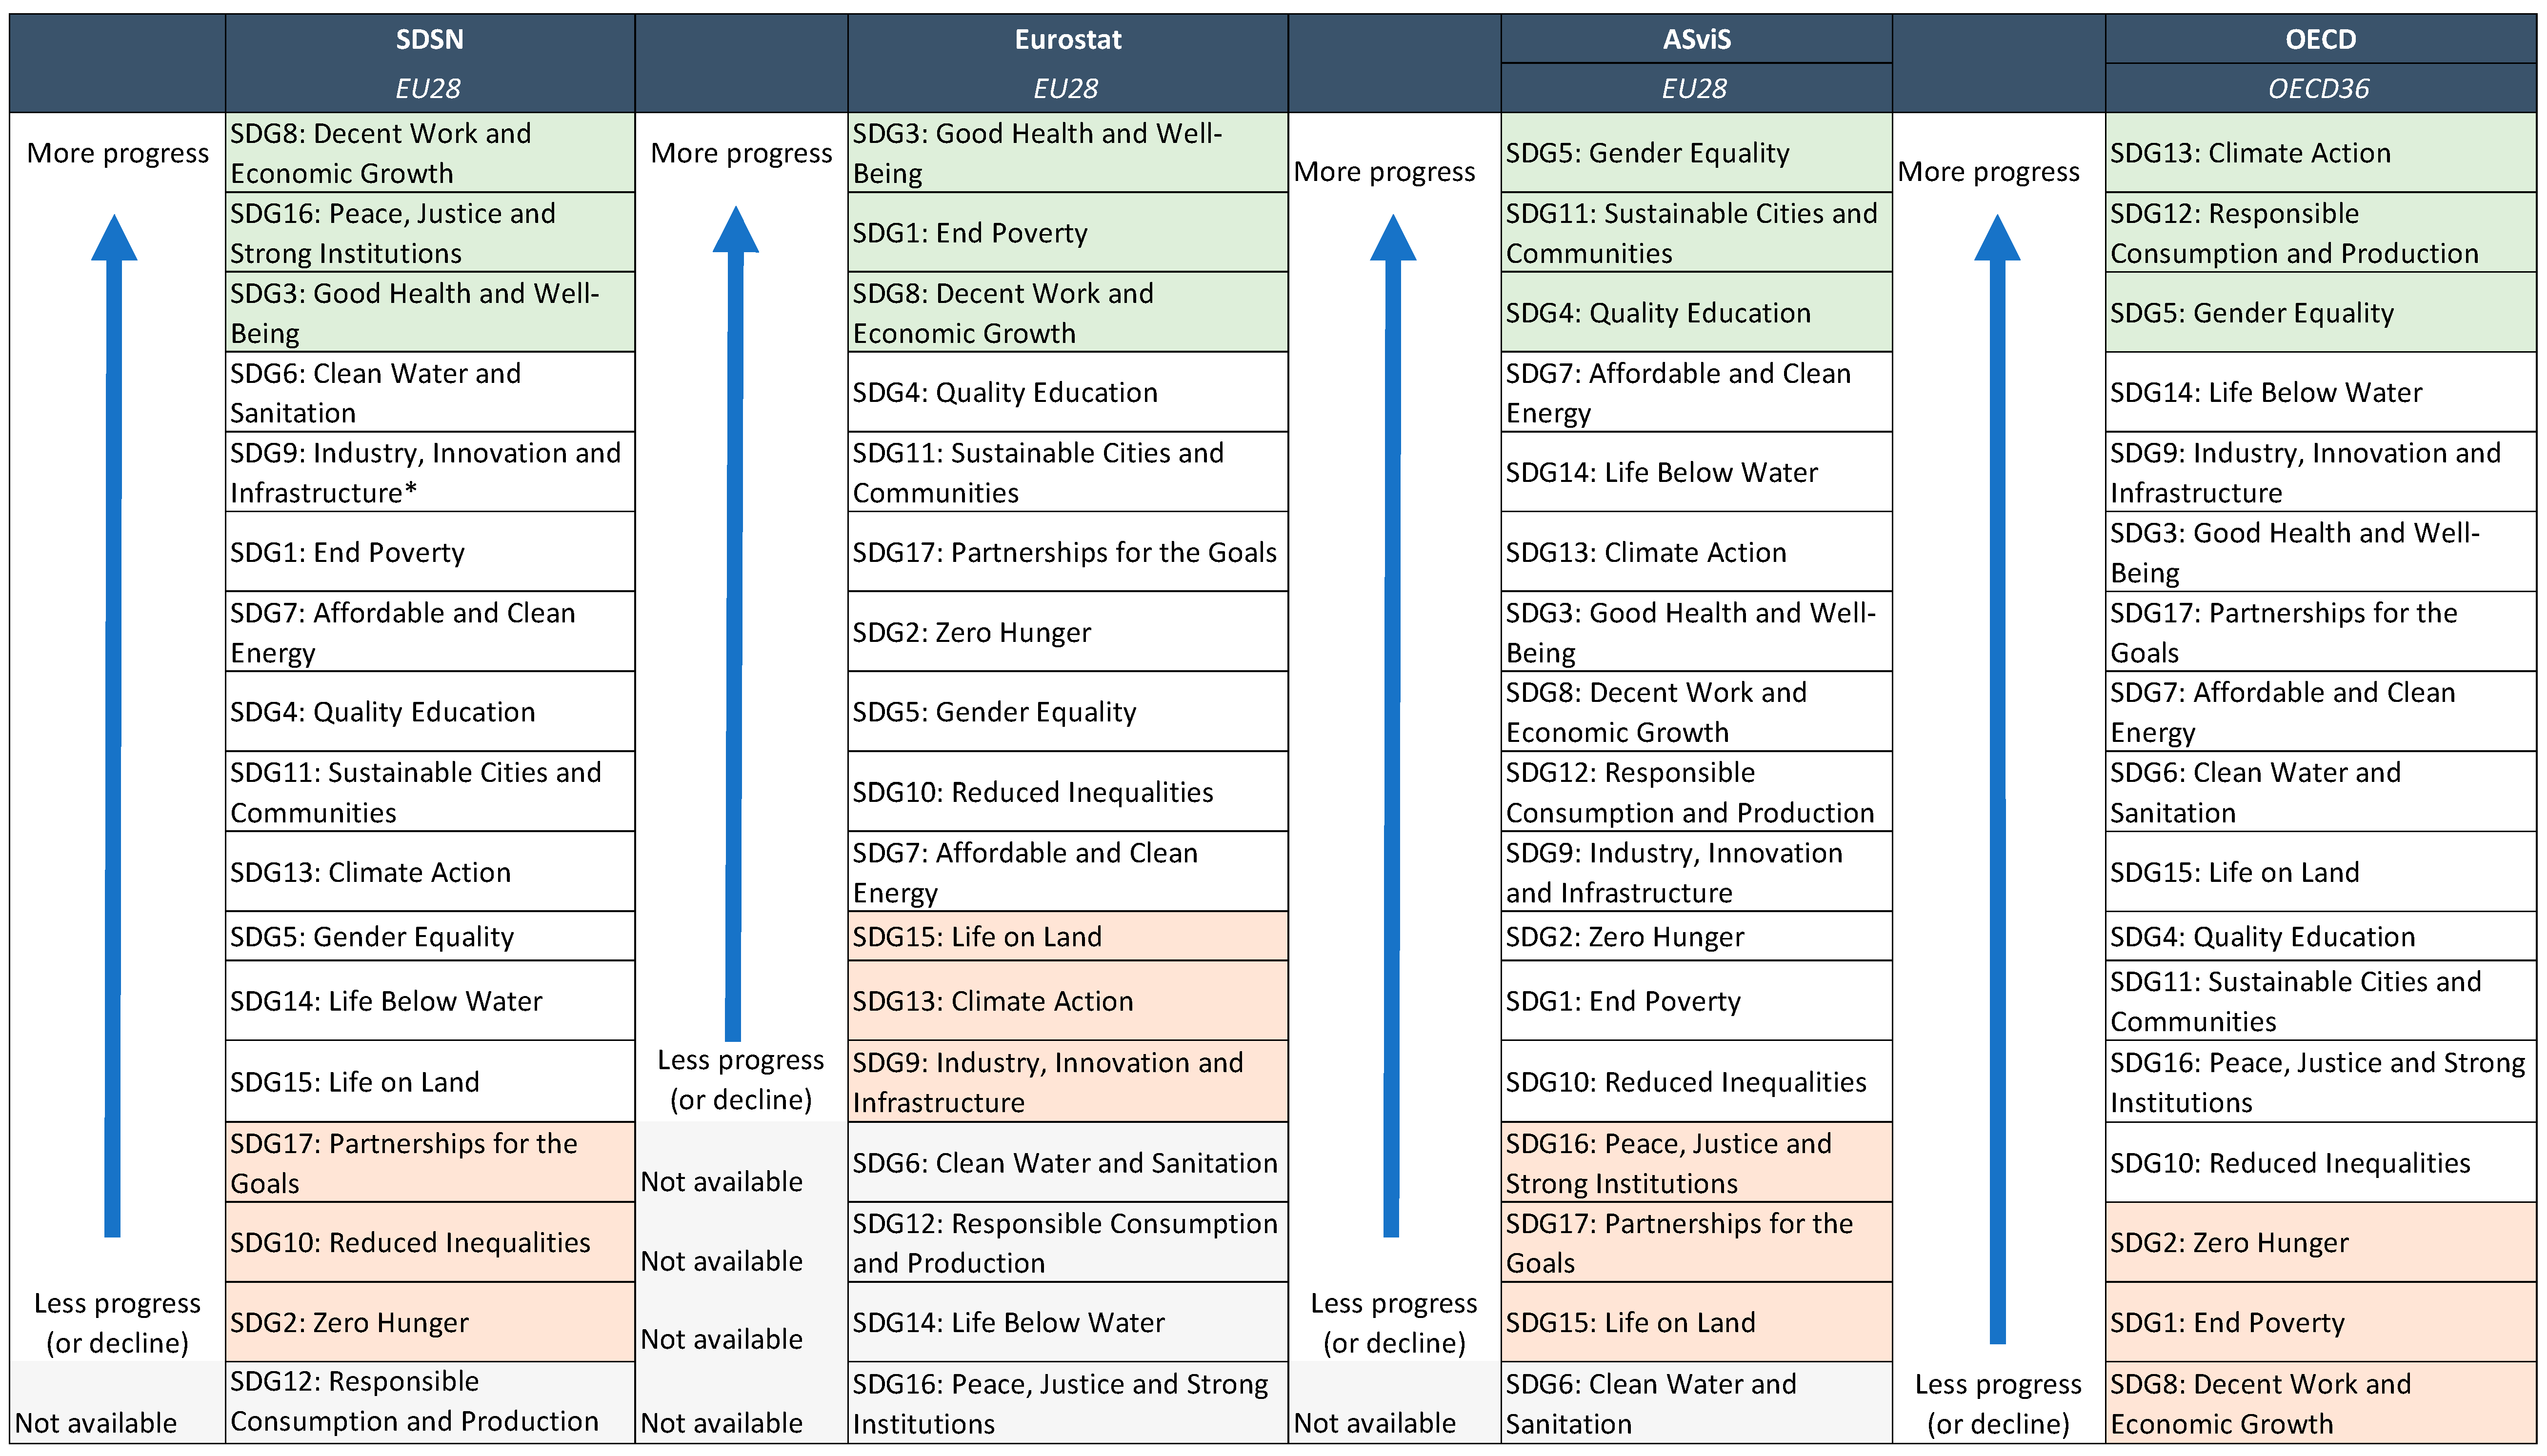
4.5. Interpreting Countries’ Trajectories

All four reports find that historic rates of progress in EU countries are insufficient to achieve some SDGs. The trajectory for SDG15 is rather poor on all three reports. Figure 4 shows how each organization evaluates progress on each of the seventeen goals. For each report, goals are presented in descending order, i.e., from high progress to low or negative progress. The adjusted SDSN results cover the 28 EU member states (EU28), including the UK. The SDSN report does not compute trends for SDG12. The Eurostat report does not report summary trends for SDG6, SDG12, SDG14, and SDG16. The ASviS report does not present trends for SDG6.
There are important differences between the findings presented by the SDSN on the EU SDG trajectories compared with the other three reports. For example, according to the SDSN and Eurostat, progress towards SDG13 is slow or insufficient, while the OECD estimates that the largest number of countries are moving towards SDG13. SDG13 is also included among the rapidly progressing goals in ASviS. SDG8 is the goal that sees the fastest pace of progress in the SDSN report, whereas the majority of countries are moving away from the target according to the OECD report. SDG8 is among the three goals where progress is fastest according to Eurostat, and it is in the middle of the range in the ASviS report. The SDSN concludes that the EU is moving in the wrong direction on SDG2, primarily due to trends in obesity rate and unsustainable diets and agriculture. The OECD findings are similar. By contrast, Eurostat and ASviS conclude that the EU is making some progress on SDG2. Both the SDSN and Eurostat report positive trends for SDG1, whereas progress is flat according to ASviS and negative in the OECD report. It is not possible to make comparisons for SDGs 6, 12, 14, and 16 due to missing data for one or several of the reports.
The findings in the previous sub-sections related to indicator selection also help explain differences in assessments of countries’ trajectories. For instance, on SDG2, the SDSN’s use of the non-official measure of energy intensity of diets (Human Trophic Level) explains the relatively poor results, as 27 out of 28 EU member states have flat or negative progress towards the SDG on this indicator.
However, there is another key methodological aspect that explains differences in the assessment of trajectories across the four reports: the inclusion or not of pre-defined targets to assess progress over time. Conceptually, methodologies to track countries’ trajectories towards the SDGs can be grouped into two categories: (i) those that aim to assess whether countries are on track or off track to achieve the goals (SDSN, and partly Eurostat), and (ii) those that aim to identify the SDGs on which countries are making the most progress (ASviS, Eurostat partly, and OECD).
Eurostat falls into both categories because it has a dual methodology for estimating trajectories. Where pre-defined EU targets could be identified (16 indicators), Eurostat calculates progress towards these goals. For the 83 indicators where no such targets have been politically agreed upon, Eurostat uses a default threshold (+/− 1% increase or decrease) to estimate whether the EU is making good or low progress towards the corresponding SDG.
The OECD, ASviS, and, to a large extent, Eurostat provide an indication of whether countries are moving in the right or wrong direction, but without an indication of whether the pace of progress will be enough to achieve a pre-defined target by 2030. The OECD defines targets to estimate baseline countries’ performance, but does not estimate whether the pace of progress is sufficient or insufficient to achieve the targets. As noted in the OECD report, “Progress towards the target says nothing about whether the pace recently achieved by a country would be sufficient to meet the target level by 2030.”
In contrast, the SDSN has developed a methodology to assess if countries are “on track” towards achieving the 2030 objectives [21,64]. This methodology is based on a linear extrapolation of past trend data (typically four years) into the future, all the way to 2030. This approach is quite similar to the Eurostat method for indicators that have pre-defined targets. If the extrapolated trendline exceeds the pace of progress required to achieve the target value by 2030, an upward green arrow is assigned to denote “on-track” performance. If countries have maintained performance over the pre-defined threshold, they also obtain an upward green arrow. The other intermediate arrows are assigned depending on whether the extrapolated growth rate is equivalent to 50% of the needed growth rate (moderate upward arrow) or lower than 50% (flat arrow). A downward red arrow is obtained when progress is negative, i.e., the country moves away from the goal.
The choice of method for the estimation of trajectories has major implications for the findings and their policy interpretations. Figure 5 provides a graphical representation of the difference in policy interpretations in the SDSN and ASviS reports for SDG14 and SDG16. Both reports underline progress made by the EU on SDG14 since 2010 and very little progress (SDSN) or slight decline (ASviS) on SDG16. This is also broadly consistent with the OECD’s findings where, on average, 19.5 countries are moving towards the target on SDG14 and zero countries are moving away from the target, while on SDG16, 3.75 countries are moving towards the target and four are moving away.
However, the three reports interpret these results very differently. The SDSN approach suggests that, despite progress on SDG14, the pace of progress is vastly insufficient to achieve the target of SDG14 by 2030. For the EU as a whole, this corresponds to a yellow arrow (moderate progress) for SDG14. Despite its slower progress on SDG16, the EU obtains a green arrow overall, since it is much closer to achieving these goals, so a smaller rate of progress is sufficient. In other words, slower progress on a well-performing goal (SDG16) can achieve a better assessment than faster progress towards a goal, where the achievement gap is greater. When combining the SDSN’s baseline dashboards results and dynamic dashboards results (the EU is red on SDG14), one concludes that further reforms and actions are needed to achieve SDG14 by 2030. The ASviS’s trend lines do not suggest the same conclusion, since they show that progress towards SDG14 is among the fastest across the SDGs.
Similar findings apply to differences in treating SDG13. ASviS presents rapid progress (+4% since 2010) on SDG13. The OECD considers that all OECD countries are moving in the right direction on SDG13. However, the SDSN finds that when extrapolating the annual rate of progress over the past few years to 2030, progress towards the climate goal is too slow.
There are other reasons that explain differences in the assessments of SDG trajectories across the reports. While scores are calculated using the latest year available, comparisons over time require the selection of a base year. This base year varies across reports and considerably affects the results. The SDSN typically uses 2015 as a base year (the year when the SDGs were adopted) and computes trends through to 2018 or later (when data are available). When no data are available for 2018 or thereafter, the trend assessment is based on the last four years available (e.g., 2014–2017, 2013–2016, etc.). In this way, each indicator is assessed over a four-year period. The OECD uses a longer time span, typically covering 2005 to 2017. Eurostat uses a dual approach and presents assessments over the long term (2003 to 2018) and short term (2013 to 2018). The overview results presented in the opening sections of the Eurostat report focus on the short-term trend. Finally, ASviS curves typically cover trends from 2010 through to 2017.
The selection of the base year can considerably affect the summary assessment of progress. The Eurostat report, which includes both long-term and short-term assessments, provides a few good examples. On average, the share of “People at risk of poverty or social exclusion” (notably included under SDG1) in the EU moves away from the EU target over the period from 2003 to 2018, but progresses towards the EU target between 2013 and 2018. In total, depending on whether the long-term or short-term trend is retained, the arrow direction shifts (from progress to movement away, or vice versa) for 12 indicators (12%) included in the Eurostat report, including key indicators covered by all three other reports, such as people killed in road accidents or official development assistance (ODA), for instance.
The use of “arrows” or “clusters” makes the results easily communicable to policymakers, but has the disadvantage of being significantly affected by the baseline year. Trajectories may also not reflect a sudden positive or negative trend towards the end of the period. The ASviS approach has the advantage of covering all years but may require more imputations for missing country data over the years. Presenting results in terms of curves and annual data points can better reflect the impact of sudden shocks (such as Covid-19) over one or two years.

5. Discussion

By design, the SDGs and the 2030 Agenda leave room for interpretation on how they should be monitored [12]. In the context of the member states of the EU and other countries, this requires addressing three issues. First, countries need to identify indicators for which data are available. This is not the case for many official SDG indicators recommended by the UN Statistics Division, so countries will need to go beyond this list. Second, while some quantitative targets are clearly defined, for many goals and targets, they are missing, so countries need to specify quantitative thresholds for SDG achievement. Third, countries need to decide how to aggregate distance-to-target assessments across several indicators for each SDG and then across the SDGs.
The SDSN, OECD, Eurostat, and ASviS reports on SDG progress in the EU represent some of the most ambitious efforts to operationalize SDG monitoring at the country level. However, they generate different results that, in some cases, directly contradict one another.
In this first, systematic comparison of SDG monitoring frameworks for EU countries, we identify three principal drivers of the differences across these reports. First, only some reports include quantitative thresholds for SDG achievements to measure distance to targets. The OECD and SDSN reports provide “static” distance-to-target assessment. Both organizations use a similar decision tree for developing the distance-to-target assessments. Only the SDSN proposes a methodology for a “dynamic” assessment to answer the question: “Are the EU and EU member states on track to achieve the SDGs?” Reports by the OECD, Eurostat, and ASviS indicate progress over time, but they do not estimate whether the pace of progress is sufficient to reach the SDGs by 2030.
Without a distance-to-target assessment, such time trends are difficult to interpret and can lead to misleading messages. For example, a country might make faster progress on one goal as compared to another, but if the gap to the former is larger, then the country may not be on track to achieve the first goals, but could be on track to achieve the second. It is therefore critical that both “static” and “dynamic” SDG tracking include assessments of distance to target.
A second major driver of changes across the three reports is the inclusion of measures for transboundary impacts or spillovers. The SDGs broadly recognize the importance of international spillover effects with SDG12 on Responsible Consumption and Production, requiring developed countries to take the lead in tackling this issue [65]. Some countries have started to integrate spillovers into SDG implementation, such as Sweden’s Generational Goal, which aims to “hand over to the next generation a society in which the major environmental problems in Sweden have been solved, without increasing environmental and health problems outside Sweden’s borders” [66]. The German Sustainability Strategy defines SDG implementation by referring to actions taken “in, by, and with Germany” [67], in recognition of external impacts of its national activities and decision-making. Strengthening the measurement of the EU’s international spillover effects was one of the recommendations submitted to the EU leadership as part of the Beyond Growth Conference in October, 2019 [68].
Out of the four monitoring tools considered, the SDSN report includes measures for international SDG spillovers to a greater extent. Our analysis in this paper shows that this explains much of the difference in results between the SDSN and OECD reports, particularly relating to SDGs 12, 13, and 17. Indicators for spillovers include imported CO2 emissions, imported SO2 emissions, and imported fatal accidents at work, but also measures related to financial transparency, tax havens, and profit shifting under SDG17. Most of such measures come from outside official statistical systems. Consumption-based measures, using Multi-Regional-Input–Output (MRIO) tables and international trade statistics, attribute part of the responsibility for negative environmental and social impacts to importing countries [69,70,71,72]. They are a relatively new and rapidly evolving field of work, so estimates may only be available for some spillovers and years. The SDSN is working with researchers to strengthen the data availability of measures for spillovers over time.
The third driver of differences across the reports comes from the use of additional indicators from official and unofficial sources to bridge gaps in the official SDG indicator framework and data availability. In the SDSN report, about two-thirds of SDG indicators come from official sources (mainly from services of the European Commission including Eurostat, the European Environmental Agency, and the Joint Research Centre), and the remaining one-third comes from non-official sources, such as research institutions and non-governmental organizations (NGOs). In comparison, the OECD, Eurostat, and ASviS reports rely almost entirely on official statistics. The OECD report limits itself almost entirely to the official SDG indicators recommended by the UN Statistics Division, while Eurostat fills indicator gaps with its own official data. ASviS uses a subset of the Eurostat indicators.
The need for unofficial indicators is particularly pronounced for the spillovers discussed above and for environmental measures. The main official indicators for SDGs 14 and 15 measure protected areas, and are vastly insufficient for tracking loss of biodiversity and other environmental damage. There is growing evidence that unsustainable fisheries are taking place inside protected areas [73,74]. The use of alternative non-official data sources to track “fish stocks overexploited or collapsed” and “trawling fisheries” explain the important discrepancy between the SDSN’s and OECD’s baseline assessments on SDG14.
It is likely that the mandates and status of each organization play a role in the approach retained to monitor the SDGs. The mandate of the SDSN is to mobilize research and science for the SDGs. The SDSN has more flexibility than other organizations to propose quantitative thresholds for SDG achievement and distance-to-target assessments. It can also leverage non-traditional data from research and science to inform its SDG Index and Dashboards. By contrast, government-led organizations, like the OECD and Eurostat, may need to stick more closely to the official SDG indicators and rely more extensively on official statistics. Eurostat and international organizations do not have the mandate to set “targets” for EU member states when these have not been adopted by EU policymakers. The European Commission’s Decision (2012/504/EU) on Eurostat stipulates: “Setting policy objectives and determining the information required to achieve these objectives is a matter for policymakers.” In its report, Eurostat probably went as far as possible in contextualizing the SDG monitoring framework for the EU, for instance, by including greenhouse gas (GHG) emissions under SDG13 (originally not an official SDG indicator) and non-official statistics (such as the Corruption Perception Index from Transparency International).

6. Conclusions and Outlook

The SDGs and the 2030 Agenda are the outcome of a complex negotiation process across UN member states. They map out the right objectives for the world and every country, but they do not provide a “ready-made” monitoring and accountability framework adapted to all countries and contexts. In particular, the official SDG indicators have conceptual and data gaps that must be closed at national levels.
It is, therefore, not surprising that different organizations came up with different assessments of the EU’s distance to and progress towards the SDGs. The fact that four reports track SDG performance in the EU and its member states reflects the intense efforts made by the data and statistics community to use the SDGs as a guiding framework to track policies and strengthen data availability and quality. All four organizations underline the need for better data to increase the accuracy of their respective assessments of the EU and the SDGs. In fact the first chart included in the OECD report is not about country results but instead about data gaps for each goals.
Overall, this paper identifies three major reasons that explain discrepancies in the results presented between the SDSN report and the OECD, Eurostat, and ASviS SDG reports: first, the use of pre-defined targets to assess countries’ distance to targets and progress towards targets; second, the consideration of indicators for international spillovers; and third, the use of non-official statistics to bridge data gaps, especially under SDG14, SDG15, and SDG17, to track biodiversity threats and financial transparency.
Based on the results of this study, we consider that three elements are crucial for actionable and robust monitoring of the SDGs at the country level. First, the official list of SDG indicators needs to be complemented by unofficial indicators. The Agenda 2030 states that SDG Targets and Indicators need to be complemented and adapted for reporting at the local, country, and regional levels. The official SDG indicators on climate and biodiversity often have limited country coverage and fail to capture the most relevant outcome metrics, including greenhouse gas emissions, because these are covered as part of other conventions or treaties, like the Paris Climate Agreement. Second, absolute performance standards and thresholds should be defined to evaluate progress on SDG indicators. This is the only way to evaluate whether countries are implementing transformative actions and to make a normative judgement of the pace of progress. Finally, a focus on outcomes is necessary. Although binary measures (0–1) of policy means (adoption of a policy, strategy, convention, etc.) are part of the official list of SDG indicators, these should be excluded from outcome-based assessments, as they tend to considerably distort results.
As with any composite measure, the standardization, normalization, and aggregation methods can affect the results. Transparency and sensitivity tests increase the ability of users to understand the impact of various methodological choices.
The research method presented in this paper focuses on controlling for methodologies by applying one methodology (SDSN’s) to the three other indicator sets. Future research could aim at controlling for the indicator selection by applying each four methods to an identical set of indicators and comparing and contrasting results. This may provide further insights on how to interpret results.
None of the four approaches provide a single “correct” answer to whether countries are on track to achieve the SDGs, but instead reflect certain methodological choices. The authors of the SDSN report recognize the limitations of a simple “across the board” approach based on linear extrapolation of annual growth rates to 2030 for determining whether countries are on track to achieve the SDGs. The other assessments do not answer the question: “Are countries on track or not on track to achieve the SDGs?” The OECD mentions that the trend assessment provided in the report is “a first step towards a more extensive analysis that would allow target-by-target projections of the future trajectories for each country.” All four methods adopt a “rear-view mirror” approach to tracking SDG trajectories based on past trends in outcome data.
Limitations in current assessments of trajectories based on historic outcome data should push the community to establish more “Policy Trackers” for a large range of policy issues. These can provide more granular and timely assessments of whether countries have put in place the right policy environment for achieving transformative goals. Such “forward-looking” approaches focus on assessing policies, investments, and regulations. They can complement outcome-based assessments like those provided by the SDSN, the OECD, Eurostat, and ASviS.
The Climate Action Tracker (CAT) has done ground-breaking work in assessing the presence and adequacy of national greenhouse-gas-emission reduction targets with the Paris Agreement, inventorying national policy instruments (policies, regulation, budgets, and so on) for energy decarbonization, and determining their adequacy for meeting national targets [75]. In this way, the CAT has increased our collective understanding of whether countries are on track to achieve SDG13 (Climate Action) and the commitments in the Paris Agreement. The SDSN is launching the Food, Environment, Land, and Development (FELD) Action Tracker to complement the CAT. Another example comes from the Walk Free Foundation, which has developed a global method to track commitment to achieving SDG8.7 on child labor and modern slavery.
We believe “Policy Trackers” are needed for all SDGs as complements to the outcome-focused assessments analyzed in this paper. Policy Trackers can improve our understanding of whether countries are on track towards implementing the key transformations [76] that are necessary to achieve the SDGs.

Supplementary Materials

The following are available online at https://www.mdpi.com/2071-1050/12/18/7675/s1.

Author Contributions

Conceptualization, G.L., G.S.-T. and G.F.; Data curation, G.L. and G.F.; Formal analysis, G.L., G.F. and G.S.-T.; Investigation, G.L.; Methodology, G.L. and G.F.; Supervision, G.L.; Validation, G.S.-T. and C.K.; Visualization, G.L.; Writing–original draft, G.L.; Writing–review & editing, G.L., G.S.-T., G.F. and C.K. All authors have read and agreed to the published version of the manuscript.

Funding

This research received no external funding.

Acknowledgments

The empirical findings discussed in the paper are the results of the 2019 Europe Sustainable Development Report prepared by the Sustainable Development Solutions Network and the Institute for European Environmental Policy. The original SDG Index methodology was developed by Kroll (2015) [77] and Sachs et al. (2016) [18]. We thank Adolfo Morrone and Federico Olivieri from ASviS and Michal Shinwell and Guillaume Cohen from the OECD for their valuable comments on an early draft.

Conflicts of Interest

The authors declare no conflict of interest.

References

  1. Stiglitz, J.; Sen, A.; Fitoussi, J.P. Report by the Commission on the Measurement of Economic Performance and Social Progress; 2009; Available online: www.stiglitz-sen-fitoussi.fr (accessed on 15 July 2020).
  2. Brundtland, G. Report of the World Commission on Environment and Development: Our Common Future; 1987; Available online: https://sustainabledevelopment.un.org/content/documents/5987our-common-future.pdf (accessed on 15 September 2020).
  3. Sachs, J.D. The Age of Sustainable Development; Columbia University Press: New York, NY, USA, 2015. [Google Scholar]
  4. European Commission. A Global Partnership for Poverty Eradication and Sustainable Development after 2015; 2015; Available online: https://ec.europa.eu/commission/presscorner/detail/en/MEMO_15_4143 (accessed on 15 September 2020).
  5. von der Leyen, U. A Union That Strives for More. My Agenda for Europe; 2019; Available online: https://ec.europa.eu/commission/sites/beta-political/files/political-guidelines-next-commission_en.pdf (accessed on 15 September 2020).
  6. Council of the EU. Supporting the Sustainable Development Goals across the World: Council Adopts Conclusions. 2019. Available online: https://www.consilium.europa.eu/en/press/press-releases/2019/07/08/supporting-the-sustainable-development-goals-across-the-world-council-adopts-conclusions/ (accessed on 15 September 2020).
  7. European Commission. Communication COM/2019/640: The European Green Deal. 2019. Available online: https://ec.europa.eu/info/sites/info/files/european-green-deal-communication_en.pdf (accessed on 15 September 2020).
  8. European Commission. Just Transition Mechanism. 2020. Available online: https://ec.europa.eu/commission/presscorner/detail/en/ip_20_930 (accessed on 15 September 2020).
  9. European Commission. Remarks by Commissioner Gentiloni on EU Progress towards the Sustainable Development Goals. 2020. Available online: https://ec.europa.eu/commission/presscorner/detail/en/speech_20_1141 (accessed on 15 September 2020).
  10. Schmidt-Traub, G.; Kroll, C.; Teksoz, K.; Durand-Delacre, D.; Sachs, J.D. National baselines for the Sustainable Development Goals assessed in the SDG Index and Dashboards. Nature Geosci. 2017, 10, 547–555. [Google Scholar] [CrossRef]
  11. Inter-agency and Expert Group on SDG Indicators. Global Indicator Framework for the Sustainable Development Goals and Targets of the 2030 Agenda for Sustainable Development. 2020. Available online: https://unstats.un.org/sdgs/indicators/indicators-list/ (accessed on 15 September 2020).
  12. United Nations. Transforming Our World: The 2030 Agenda for Sustainable Development; 2015; Available online: https://sustainabledevelopment.un.org/post2015/transformingourworld (accessed on 15 July 2020).
  13. ECOSOC. Voluntary National Reviews Database. 2020. Available online: https://sustainabledevelopment.un.org/vnrs/ (accessed on 15 September 2020).
  14. Simon, B.; Meyer, W.; D’Errico, S.; Schwandt, T.; Lucks, D.; Zhaoying, C.; El-Saddik, K.; Schneider, E.; Taube, L.; Anderson, S.; et al. Evaluation: A Missed Opportunity in the SDGs’ First Set of Voluntary National Reviews. 2017. Available online: https://www.jstor.org/stable/resrep17984 (accessed on 15 July 2020).
  15. Risse, N. Main Messages from 35 VNR Countries Outline SDG Actions and Plans|News|SDG Knowledge Hub|IISD. In IISD’s SDG Knowledge; 2018; Available online: https://sdg.iisd.org:443/news/main-messages-from-35-vnr-countries-outline-sdg-actions-and-plans/ (accessed on 15 July 2020).
  16. Niklasson, L. Improving the Sustainable Development Goals: Strategies and the Governance Challenge; Routledge: London, UK, 2019. [Google Scholar]
  17. UNDESA. Sustainable Development Goals Progress Chart 2019. 2019. Available online: https://unstats.un.org/sdgs/report/2019/progress-chart.pdf (accessed on 15 September 2020).
  18. Sachs, J.; Schmidt-Traub, G.; Kroll, C.; Durand-Delacre, D.; Teksoz, K. SDG Index and Dashboards—Global Report; Bertelsmann Stiftung and Sustainable Development Solutions Network (SDSN): New York, NY, USA, 2016. [Google Scholar]
  19. Sachs, J.D.; Schmidt-Traub, G.; Kroll, C.; Durand-Delacre, D.; Teksoz, K. SDG Index and Dashboards Report 2017. Global Responsibilities—International Spillovers in Achieving the Goals; 2017; Available online: http://sdgindex.org/ (accessed on 15 July 2020).
  20. Sachs, J.D.; Schmidt-Traub, G.; Kroll, C.; Lafortune, G.; Fuller, G. SDG Index and Dashboards Report 2018. Global Responsibilities. Implementing the Goals; 2018; Available online: http://sdgindex.org/ (accessed on 15 July 2020).
  21. Sachs, J.D.; Schmidt-Traub, G.; Kroll, C.; Lafortune, G.; Fuller, G. Sustainable Development Report 2019. Transformations to Achieve the Sustainable Development Goals; 2019; Available online: http://sdgindex.org/ (accessed on 15 July 2020).
  22. OECD. Measuring Distance to the SDGs Targets: A Pilot Assessment of Where OECD Countries Stand; 2016; Available online: http://www.oecd.org/std/measuring-distance-to-the-sdgs-targets.htm (accessed on 15 July 2020).
  23. OECD. Measuring Distance to the SDG Targets: An Assessment of Where OECD Countries Stand; 2017; Available online: http://www.oecd.org/std/OECD-Measuring-Distance-to-SDG-Targets.pdf (accessed on 15 July 2020).
  24. OECD. Measuring Distance to the SDG Targets 2019: An Assessment of Where OECD Countries Stand; 2019; Available online: https://www.oecd.org/sdd/measuring-distance-to-the-sdg-targets-2019-a8caf3fa-en.htm (accessed on 15 July 2020).
  25. Eurostat. Sustainable Development in the European Union—Monitoring Report on Progress towards the SDGs in an EU Context; 2017; Available online: https://ec.europa.eu/eurostat/web/products-statistical-books/-/KS-04-17-780 (accessed on 15 July 2020).
  26. Eurostat. Sustainable Development in the European Union: Monitoring Report on Progress Towards the SDGs in An EU Context (2018 Edition); 2018; Available online: https://ec.europa.eu/eurostat/documents/3217494/9237449/KS-01-18-656-EN-N.pdf/2b2a096b-3bd6-4939-8ef3-11cfc14b9329 (accessed on 15 July 2020).
  27. Eurostat. Sustainable Development in the European Union: Monitoring Report on Progress Towards the SDGs in An EU Context (2019 Edition); 2019; Available online: https://ec.europa.eu/eurostat/web/products-statistical-books/-/KS-02-19-165 (accessed on 20 July 2020).
  28. ASviS. The European Union and the Sustainable Development Goals. 2020. Available online: https://asvis.it/public/asvis2/files/Pubblicazioni/Compositi_Europei_ENG_HR.pdf (accessed on 16 August 2020).
  29. SDSN & IEEP. 2019 Europe Sustainable Development Report; 2019; Available online: https://www.sdgindex.org/reports/2019-europe-sustainable-development-report/ (accessed on 20 July 2020).
  30. Costanza, R.; Daly, L.; Fioramonti, L.; Giovannini, E.; Kubiszewski, I.; Mortensen, L.F.; Pickett, K.E.; Ragnarsdottir, K.V.; De Vogli, R.; Wilkinson, R. Modelling and measuring sustainable wellbeing in connection with the UN Sustainable Development Goals. Ecol. Econ. 2016, 130, 350–355. [Google Scholar] [CrossRef]
  31. Davis, A.; Matthews, Z.; Szabo, S.; Fogstad, H. Measuring the SDGs: A two-track solution. Lancet 2015, 386, 221–222. [Google Scholar] [CrossRef]
  32. UNECE; OECD; Eurostat. Measuring sustainable development: Report of the Joint UNECE/OECD/Eurostat Working Group on Statistics for Sustainable Development. 2008. Available online: https://www.unece.org/stats/groups/wgssd.tor.html (accessed on 15 July 2020).
  33. Holden, E.; Linnerud, K.; Banister, D. Sustainable development: Our Common Future revisited. Glob. Environ. Chang. 2014, 26, 130–139. [Google Scholar] [CrossRef] [Green Version]
  34. UNECE. Conference of European Statisticians Recommendations on Measuring Sustainable Development. 2014. Available online: https://www.unece.org/fileadmin/DAM/stats/publications/2013/CES_SD_web.pdf (accessed on 15 August 2020).
  35. McArthur, J.W.; Rasmussen, K. Change of pace: Accelerations and advances during the Millennium Development Goal era. World Dev. 2018, 105, 132–143. [Google Scholar] [CrossRef]
  36. Indicateurs Pour le Suivi National des Objectifs de Développement Durable|Insee. Available online: https://www.insee.fr/fr/statistiques/2654964 (accessed on 20 July 2020).
  37. German Indicators for the Sustainable Development Goals. Available online: https://sustainabledevelopment-germany.github.io/en/guidance/ (accessed on 20 July 2020).
  38. Lafortune, G.; Zoeteman, K.; Mulder, R.; Dagevos, J.; Schmidt-Traub, G. SDG Index and Dashboards Report for European Cities; 2019; Available online: https://www.sdgindex.org/reports/sdg-index-and-dashboards-report-for-european-cities/ (accessed on 12 July 2020).
  39. OECD. A Territorial Approach to the Sustainable Development Goals: Synthesis Report; 2020; Available online: https://www.oecd.org/cfe/a-territorial-approach-to-the-sustainable-development-goals-e86fa715-en.htm (accessed on 12 August 2020).
  40. WBCSD. SDG Sector Roadmaps: How to Leverage the Power of Sectoral Collaboration to Maximize Business Impact on the Sustainable Development Goals. 2018. Available online: https://www.wbcsd.org/Programs/People/Sustainable-Development-Goals/SDG-Sector-Roadmaps/Resources/SDG-Sector-Roadmaps (accessed on 12 July 2020).
  41. WBA. Climate and Energy Benchmark: Measuring the World’s 25 Most Influential Auto Manufacturers. 2019. Available online: https://www.worldbenchmarkingalliance.org/measuring-the-worlds-25-most-influential-auto-manufacturers/ (accessed on 12 August 2020).
  42. Gold Standard. Guidance for the Identification of Impacts and Indicators for Activity Level SDG Impact Reporting. 2019. Available online: https://irp-cdn.multiscreensite.com/6f2c9f57/files/uploaded/2019_sdg_tool_guidance_briefing.pdf (accessed on 18 July 2020).
  43. Sachs, J.D.; Schmidt-Traub, G.; Kroll, C.; Lafortune, G.; Fuller, G.; Woelm, F. Sustainable Development Report 2020. The Sustainable Development Goals and Covid-19; 2020; Available online: http://sdgindex.org/ (accessed on 12 August 2020).
  44. IAEG-SDGs. Report of the Inter-Agency and Expert Group on Sustainable Development Goal Indicators; 2016; Available online: https://unstats.un.org/unsd/statcom/47th-session/documents/2016-2-IAEG-SDGs-Rev1-E.pdf (accessed on 15 July 2020).
  45. IAEG-SDGs. Report of the Inter-Agency and Expert Group on Sustainable Development Goal Indicators; 2020; Available online: https://unstats.un.org/unsd/statcom/51st-session/documents/2020-2-SDG-IAEG-E.pdf (accessed on 15 July 2020).
  46. IAEG-SDGs. Tier Classification for Global SDG Indicators as of 17 July 2020; 2020; Available online: https://unstats.un.org/sdgs/files/Tier%20Classification%20of%20SDG%20Indicators_17%20July%202020_web.v2.pdf (accessed on 20 July 2020).
  47. SDSN. Indicators and a Monitoring Framework for Sustainable Development Goals: Launching a Data Revolution for the SDGs; 2015; Available online: http://unsdsn.org/resources/publications/indicators/ (accessed on 18 August 2020).
  48. United Nations. Informal Note for Statistical Commission Agenda Item 3 (a) Data in Support of the Post 2015 Development Agenda (i) Broader Measures of Progress. 2015. Available online: https://undocs.org/E/CN.3/2015/2 (accessed on 15 September 2020).
  49. Diaz-Sarachaga, J.M.; Jato-Espino, D.; Castro-Fresno, D. Is the Sustainable Development Goals (SDG) index an adequate framework to measure the progress of the 2030 Agenda? Sustain. Dev. 2018, 26, 663–671. [Google Scholar] [CrossRef]
  50. Zeng, Y.; Maxwell, S.; Runting, R.K.; Venter, O.; Watson, J.E.M.; Carrasco, L.R. Environmental destruction not avoided with the Sustainable Development Goals. Nat. Sustain. 2020. [Google Scholar] [CrossRef]
  51. Lafortune, G.; Schmidt-Traub, G. Exposing EU Policy Gaps to Address the Sustainable Development Goals; 2019; Available online: https://www.eesc.europa.eu/en/our-work/publications-other-work/publications/exposing-eu-policy-gaps-address-sustainable-development-goals-study (accessed on 15 August 2020).
  52. OECD & JRC. Handbook on Constructing Composite Indicators: Methodology and User Guide; OECD, Joint Research Centre: Paris, France, 2008. [Google Scholar]
  53. European Union. Treaty of Lisbon: Amending the Treaty on European Union and the Treaty Establishing the European Community. 2007. Available online: https://eur-lex.europa.eu/legal-content/EN/TXT/?uri=CELEX%3A12007L%2FTXT (accessed on 12 August 2020).
  54. Copernicus. How does Copernicus Support the UN Sustainable Development Goals? 2018. Available online: https://www.copernicus.eu/en/news/news/how-does-copernicus-support-un-sustainable-development-goals (accessed on 12 September 2020).
  55. European Commission. Reflection Paper: Towards a sustainable Europe by 2030. 2019. Available online: https://ec.europa.eu/commission/sites/beta-political/files/rp_sustainable_europe_30-01_en_web.pdf (accessed on 12 August 2020).
  56. SDG Watch Europe. Not Fit for Purpose: SDG Monitoring Report Fails to Illustrate How Far the EU is from a Sustainable Future. 2017. Available online: https://www.sdgwatcheurope.org/not-fit-for-purpose-sdg-monitoring-report-fails-to-illustrate-how-far-the-eu-is-from-a-sustainable-future/ (accessed on 12 July 2020).
  57. SDG Watch Europe. 2019 Europe Sustainable Development Report—SDG Watch Europe; 2019; Available online: https://www.sdgwatcheurope.org/2019-europe-sustainable-development-report/ (accessed on 15 July 2020).
  58. SDG Watch Europe. Who is Paying the Bill; 2019; Available online: https://www.sdgwatcheurope.org/who-is-paying-the-bill/ (accessed on 12 July 2020).
  59. Hickel, J. The sustainable development index: Measuring the ecological efficiency of human development in the anthropocene. Ecol. Econ. 2020, 167, 106331. [Google Scholar] [CrossRef]
  60. Miola, A.; Schiltz, F. Measuring sustainable development goals performance: How to monitor policy action in the 2030 Agenda implementation? Ecol. Econ. 2019, 164, 106373. [Google Scholar] [CrossRef] [PubMed]
  61. IPCC. Land is a Critical Resource, IPCC Report Says. Available online: https://www.ipcc.ch/2019/08/08/land-is-a-critical-resource_srccl/ (accessed on 15 July 2020).
  62. IPBES. Summary for Policymakers of the Global Assessment Report on Biodiversity and Ecosystem Services of the Intergovernmental Science-Policy Platform on Biodiversity and Ecosystem Services. 2019. Available online: https://ipbes.net/global-assessment (accessed on 12 August 2020).
  63. Cling, J.-P.; Eghbal-Teherani, S.; Orzoni, M.; Plateau, C. The Difference between EU Countries for Sustainable Development Indicators: It is (Mainly) the Economy! 2019. Available online: https://econpapers.repec.org/paper/nsedoctra/g2019-06.htm (accessed on 12 August 2020).
  64. Lafortune, G.; Fuller, G.; Moreno, J.; Schmidt-Traub, G.; Kroll, C. SDG Index and Dashboards. Detailed Methodological Paper; 2018; Available online: http://sdgindex.org/assets/files/2018/Methodological%20Paper_v1_gst_jmm_Aug2018_FINAL.pdf (accessed on 10 August 2020).
  65. Schmidt-Traub, G.; Hoff, H.; Bernlöhr, M. International Spillovers and the Sustainable Development Goals (SDGs): Measuring How a Country’s Progress towards the SDGs is Affected by Actions in other Countries; 2019; Available online: https://irp-cdn.multiscreensite.com/be6d1d56/files/uploaded/SDSN-Policy-Brief_International-spillovers-and-the-SDGs.pdf (accessed on 12 July 2020).
  66. Weitz, N.; Carlsen, H.; Nilsson, M.; Skanberg, K. Towards systemic and contextual priority setting for implementing the 2030 Agenda. Sustain. Sci. 2018, 13, 531–548. [Google Scholar] [CrossRef] [PubMed] [Green Version]
  67. Bundesregierung. Deutsche Nachhaltigkeitsstrategie. Aktualisierung 2018. 2018. Available online: https://www.bundesregierung.de/resource/blob/975292/1559082/a9795692a667605f652981aa9b6cab51/deutsche-nachhaltigkeitsstrategie-aktualisierung-2018-download-bpa-data.pdf (accessed on 12 August 2020).
  68. FINGO. Policy Recommendations for the EU: Wellbeing and Sustainability at the Centre of Policy and Decision-Making. 2019. Available online: https://www.fingo.fi/sites/default/tiedostot/beyond-growth-recommendations_0.pdf (accessed on 12 July 2020).
  69. Lenzen, M.; Moran, D.; Kanemoto, K.; Foran, B.; Lobefaro, L.; Geschke, A. International trade drives biodiversity threats in developing nations. Nature 2012, 486, 109–112. [Google Scholar] [CrossRef] [PubMed]
  70. Lenzen, M.; Moran, D.; Kanemoto, K.; Geschke, A. Building Eora: A global multi-region input—Output database at high country and sector resolution. Econ. Syst. Res. 2013, 25, 20–49. [Google Scholar] [CrossRef]
  71. Gómez-Paredes, J.; Malik, A. Tracking the Sustainable Development Goals with Input-Output Analysis: A Commentary and Example. 2018. Available online: https://www.iioa.org/conferences/26th/papers/files/3409_Gmez-ParedesandMalik(2018)TrackingtheSustainableDevelopmentGoalswithInput-OutputAnalysis.pdf (accessed on 15 August 2020).
  72. Malik, A.; McBain, D.; Wiedmann, T.O.; Lenzen, M.; Murray, J. Advancements in Input-Output Models and Indicators for Consumption-Based Accounting. J. Ind. Ecol. 2019, 23, 300–312. [Google Scholar] [CrossRef]
  73. Agardy, T.; di Sciara, G.N.; Christie, P. Mind the gap: Addressing the shortcomings of marine protected areas through large scale marine spatial planning. Mar. Policy 2011, 35, 226–232. [Google Scholar] [CrossRef]
  74. Kearney, R.; Buxton, C.D.; Farebrother, G. Australia’s no-take marine protected areas: Appropriate conservation or inappropriate management of fishing? Mar. Policy 2012, 36, 1064–1071. [Google Scholar] [CrossRef]
  75. Climate Action Tracker. Some Progress since Paris, but not Enough, as Governments Amble towards 3 °C of Warming. 2018. Available online: https://climateanalytics.org/publications/2018/some-progress-since-paris-but-not-enough-as-governments-amble-towards-3c-of-warming/ (accessed on 12 July 2020).
  76. Sachs, J.D.; Schmidt-Traub, G.; Mazzucato, M.; Messner, D.; Nakicenovic, N.; Rockström, J. Six Transformations to achieve the Sustainable Development Goals. Nat. Sustain. 2019, 2, 805–814. [Google Scholar] [CrossRef]
  77. Kroll, C. Sustainable Development Goals: Are the Rich Countries Ready? 2015; Available online: https://www.bertelsmann-stiftung.de/en/publications/publication/did/sustainable-development-goals-are-the-rich-countries-ready/ (accessed on 15 August 2020).
Figure 1. Average goal scores obtained in the SDSN and Organization for Economic Cooperation and Development (OECD) reports for 23 EU member states. Note: OECD scores have been rescaled from 0–100; they were originally from 0–3. Source: authors.
Sustainability 12 07675 g001
Figure 2. Sensitivity of the results across SDGs after controlling for methodologies: median of rank difference across the seventeen SDGs (under adjustment scenario 2). Source: authors.
Sustainability 12 07675 g002
Figure 3. Sensitivity of the results across countries after controlling for methodologies: median of rank differences across the seventeen SDGs (under adjustment scenario 2). Source: authors.
Sustainability 12 07675 g003
Figure 4. Differences in assessments of countries’ trajectories on the SDGs. Note: * In the SDSN’s methodology, the green arrow means on track, but also maintaining performance above the SDG achievement. On SDG9, the EU is considered, on average, to be above SDG performance, despite the low convergence and performance in some EU member states. Source: authors.
Sustainability 12 07675 g004
Figure 5. Comparison of trends obtained for SDG14 and SDG16 between a methodology that sets pre-defined targets (SDSN) and a methodology with no-predefined targets (ASviS) for the 28 EU member states (EU28), 2010–2017. Source: authors. (a) Interpretation: Some progress on SDG14, but too slow to achieve 2030 target. Very little progress on SDG16, but very close to the SDG target. (b) Interpretation: Very rapid progress on SDG14. Slight decline on SDG16 since 2010.
Sustainability 12 07675 g005
Table 1. Characteristics of four Sustainable Development Goal (SDG) reports for the EU.
OrganizationReport TitleLatest EditionNumber of IndicatorsNumber of EU Countries CoveredIncludes Baseline Assessment (“Static”)Includes Assessment of Countries’ Trajectories (“Dynamic”)
SDSNEurope Sustainable Development Report201911328YesYes
OECDMeasuring Distance to SDG Targets201913223YesYes
EurostatMonitoring report on progress towards the SDGs in an EU context201999 *28NoYes
AsvisMeasuring the situation of the European Union with regard to the SDGs20207728NoYes
Note: * Single-use indicators. Source: authors.
Table 2. Main characteristics of countries’ trajectories in the four SDG reports.
OrganizationPre-Defined Targets to Achieve by 2030Years CoveredEU AggregateN° of Trend CategoriesTrend Categories
SDSNYes2015 to 2018 *EU275On track or maintaining SDG achievementModerately improvingStagnating DecreasingData unavailable
OECDYes2005 to 2017None. Covers 23 EU member states.3Progress towards SDG targetMovement away from SDG targetNo identified trend or not enough data
Eurostat Partly2003 to 2018 (long term) and 2013 to 2018 (short term) **EU285Significant progress towards SD objectives ****Moderate progress towards SD objectivesModerate movement away from SD objectivesSignificant movement away from SD objectivesCalculation of trend not possible (for example, time series too short)
ASviSNo2010 to 2017EU28 ***Not applicableContinuous trend 2010 to 2017
Note: * Or past four years when not possible (e.g., 2014 to 2017; 2013 to 2016). ** Or 2002 to 2017 and 2012 to 2017 when not possible. *** Using the azziotta–Pareto index method to deal with substitutability/compensation. **** Or, when possible, “[…] progress towards EU target.” Source: authors.
Table 3. Summary of scenario adjustments.
Scenario 1:
Basic Adjustment
Scenario 2:
Moderate Adjustment
Scenario 3:
High Adjustment
-
Pre-defined target
-
Remove outliers (2.5th percentile)
-
Normalization (0–100)
-
Aggregation,
-
Removed data not possible to compile at country level
-
Scenario 1 +
-
Change relevant units to “per capita” (when relevant)
-
Remove binary indicators (OECD)
-
Assign multipurpose indicators only to one goal (Eurostat)
-
Remove indicators with no clear normative directions
-
Scenario 1+2+
-
Remove indicators of transboundary impacts (spillovers) from the SDSN
Source: authors.
Table 4. Rank correlation for the 17 SDGs for 23 EU member countries after controlling for methodologies (under adjustment scenario 2).
SDSNOECDEurostatASviS
SDSN1.00
OECD0.071.00
Eurostat0.660.181.00
ASviS0.720.170.911.00
Source: authors.
Table 5. Score correlation for the 17 SDGs for 23 EU member countries after controlling for methodologies (under adjustment scenario 2).
SDSNOECDEurostatASviS
SDSN1.00
OECD0.061.00
Eurostat0.600.391.00
ASviS0.670.290.951.00
Note: Excluding SDG6, where no indicators are identified by Alleanza Italiana per lo Sviluppo Sostenibile (ASviS). Source: authors.

