Case Report

Temporal Variability of Tropospheric Ozone Pollution in the Agricultural Region of Central-Eastern Poland

1
Department of Ecology, Climatology and Air Protection, Faculty of Environmental Engineering and Land Surveying, University of Agriculture in Kraków, Al. Mickiewicza 24/28, 30-059 Kraków, Poland
2
Department of Agriculture, Pope John Paul II State School of Higher Education, ul. Sidorska 95/97, 21-500 Biała Podlaska, Poland
*
Author to whom correspondence should be addressed.
Sustainability 2020, 12(18), 7633; https://doi.org/10.3390/su12187633
Submission received: 22 July 2020 / Revised: 29 August 2020 / Accepted: 9 September 2020 / Published: 17 September 2020
(This article belongs to the Section Hazards and Sustainability)

Abstract

:
The aim of the study was to assess the temporal variability of tropospheric ozone pollution. The research was carried out for the agricultural region of central-eastern Poland, an area covering the Lublin Voivodeship. One-hour averages of automatic measurements of tropospheric ozone concentration in 2015–2017 were used for the study. The data were obtained from three measuring stations belonging to the Chief Inspectorate of Environmental Protection in Poland. The stations were located as part of the Air Quality Monitoring System in rural communes in the north-western, central and southern parts of the Lublin Voivodeship. Statistical analysis of the data showed that the tropospheric ozone concentrations were significantly dependent on weather conditions during the years of the study. At each monitoring station, the one-hour average O3 concentrations showed a clear structure over the course of the day: they were higher in the late morning and early afternoon than in the early morning and at night. The highest O3 concentrations were observed at the Florianka measurement station, located in Roztocze National Park. This area had high forest cover and was located at the highest elevation above sea level of the three measuring stations. In the light of climate change and increasing O3 concentrations, further scientific research on atmospheric air pollution is crucial, especially in agricultural areas associated with food production.

1. Introduction

Atmospheric air pollution is a serious problem and a challenge for modern civilization. It is one of the most serious threats to our planet and the life and health of its inhabitants. It has global and temporal dimensions; on a spatial scale, it affects all regions of the globe, and on a temporal scale it can show both short-term and long-term variability [1,2,3]. The results of scientific studies confirm that both short and long-term exposure to air pollution adversely affects human health and quality of life and can lead to premature deaths [4,5,6,7].
According to the Organization for Economic Co-operation and Development (OECD), air pollution, and in particular, increased greenhouse gas emissions, may lead to an air temperature rise of up to 2.4 °C by 2050, which in turn will increase extreme weather phenomena around the world, such as heatwaves, droughts, and floods. This will have adverse consequences not only for agricultural crops in various parts of the world, but also for entire ecosystems and the biodiversity of the planet [8].
One of the most dangerous atmospheric air pollutants is tropospheric ozone (trioxygen; O3). In contrast to stratospheric ozone, which protects life on Earth from harmful UVB radiation, tropospheric (ground-level) ozone in elevated concentrations is harmful to all living organisms, threatening the planet’s biodiversity [2,9,10,11]. It is also a greenhouse gas and a component of photochemical smog [12].
It should be emphasized that in the last century, the O3 concentration has more than doubled, and by 2050 it is expected to increase by another 20% [13].
Tropospheric ozone is a secondary pollutant (it is not emitted to the atmosphere) formed as a result of chemical transformations of primary pollutants, known as ozone precursors. These are mainly nitrogen oxides (NOx), carbon monoxide (CO), methane (CH4), and volatile organic compounds (VOCs). High solar radiation intensity and air temperatures above 28 °C are conducive to these processes. Higher tropospheric ozone concentrations are recorded during the spring and summer [14,15].
Volatile organic compounds (VOCs) are not only by-products formed in numerous industrial processes or petrol combustion, but also hydrocarbons of natural origin, called biogenic hydrocarbons, which are emitted to the environment mainly by broad-leaved trees (e.g., isoprene). In the European Union, the annual contribution of biogenic emissions to the increase in the content of nitrogen oxides and hydrocarbons (ozone precursors) in the atmosphere is estimated at 7% (NOx) and 20% (VOCs) [16,17,18,19]. According to Geng et al. [18], Arneth et al. [20], and Yokouchi et al. [21], climate change, including global warming, can increase isoprene emissions to the atmosphere.
Forecasts of an increase in tropospheric ozone concentrations are also closely linked to the increase in the global population. In 2050, the human population will reach 9.2 billion, resulting in increased emissions of anthropogenic pollutants which are ozone precursors [22].
Tropospheric ozone poses a serious threat to the production of plant biomass. The phytotoxic effect of tropospheric ozone on plant growth and development, including biomass accumulation, is emphasized by Mills et al. [9], Musselman et al. [23], Woo and Hinckley [24], and Wittig et al. [25]. This suggests that it may be a serious threat to global food security [26,27].
Tropospheric ozone has been shown to adversely affect plant growth and development in part by interfering with photosynthesis and accelerating leaf ageing [28]. According to Mills et al. [9], elevated tropospheric ozone concentrations may not only affect the course of biochemical processes in plants, but also alter the composition and functioning of soil microbial communities, as well as processes occurring in soils and their chemical properties.
Global crop yield losses due to elevated tropospheric ozone concentrations are estimated at about 16%. They are highest for soybean (Glycine max L)—up to 16%, wheat (Triticum aestivum L.)—up to 12%, rice (Oryza sativa L.)—up to 4%, and maize (Zea mays L.)—up to 5% [29].
Many companies, such as Monsanto and Syngenta, are currently conducting research to increase plant resistance to environmental stress factors. Advances in plant breeding and biotechnology to improve resistance to stress factors, including tropospheric ozone pollution, will be of great importance. It will also be crucial to introduce plant varieties that tolerate elevated O3 concentrations [27,30].
Atmospheric air pollution is an extremely important issue on a global, regional and local scale. According to studies by Paoletti et al. [31], in the period 1990–2010, an upward trend in O3 levels in urbanized areas and the neighboring rural areas of North America and the European Union were observed. There is currently no scientific research (or only fragmentary research) on atmospheric contamination with tropospheric ozone in agricultural areas of central-eastern Poland.
Therefore, the aim of this study was to assess the temporal variability of tropospheric ozone pollution in the agricultural landscape represented by the region of central-eastern Poland.

2. Materials and Methods

2.1. Study Area

The research was carried out for the agricultural region of central-eastern Poland, an area covering the Lublin Voivodeship. This is one of the most important agricultural regions in Poland. The Lublin Voivodeship borders on the River Vistula to the west, on the River Narew to the north, and on the River Bug to the east. The study area is located mainly in the Lublin-Lviv Uplands. The north-eastern part of this area is Polesie, and the north-western part belongs to the Central Polish Lowlands (Figure 1). The soils are sod-podzolic, brown, charnozem, rendzina, mud and marsh soils [32]. Over 23% of the area of the voivodeship is covered by forest (45% broadleaf and 55% coniferous) [33]. It should be emphasized that the Lublin Voivodeship is one of the least industrialized regions in Poland.
Average one-hour values of automatic measurements of tropospheric ozone concentrations were obtained from three measuring stations belonging to the Chief Inspectorate of Environmental Protection in Poland, operating as part of the Air Quality Monitoring System: the Jarczew station, located in the northwest of the Lublin Voivodeship (φ = 51°48′52′′N, λ = 21°58′21′′E, H = 177 m a. s. l.), the Wilczopole station, located in the centre (φ = 51°09′39′′N, λ = 22°35′49′′E, H = 202 m a. s. l.), and the Florianka station, located in the southern part of the Voivodeship in Roztocze National Park (φ = 50°33′07′′N, λ = 22°58′58′′E, H = 270 m a. s. l.) (Figure 1). The measuring stations were situated in agricultural areas, with the largest city in the region, Lublin, located 90 km from Jarczew, 15 km from Wilczopole, and 95 km from Florianka.

2.2. Climate Conditions in the Study Area

Climatic conditions in the study area reflect the solar and circulation conditions in central-eastern Poland and the physiography of the region. The western part of the Lublin Voivodeship is the warmest, with an average annual temperature of 8.3–8.5 °C. The corresponding temperature is 7.7–7.8 °C in the east and lowest in the southeast (with diverse landforms and the highest elevation above sea level—over 270 m a. s. l.), with an average annual air temperature of 7.4 °C [34,35,36].
Atmospheric precipitation in the study area is characterized by large spatial and temporal variation—while the average annual rainfall in most of the Lublin Voivodeship is about 550 mm, it is higher in the south (i.e., the northern part of Roztocze Lubelskie, at the highest altitude), ranging from 600 to 700 mm [36].

2.3. Meteorological Background of the Study Period

Temperature and precipitation conditions were varied (2015–2017) (Table 1). In the spring of each year, the air temperature was higher than the long-term average, and the spring of 2016 was warmest compared to the other years of the study, with an average air temperature of 9.2 °C (classified as very warm).
During the summer months (June–August), average atmospheric air temperatures were also above the long-term average. The summer of 2015 was extremely warm and extremely dry (Table 1).
Meteorological autumn (September–November) in 2015 and 2017 was also classified as extremely warm, with average air temperatures of 9.0 °C and 9.1 °C, respectively. In the autumn of each year of the study, the precipitation totals were also higher than the long-term average.
Temperature conditions during the winter months (December–February) were also varied. They were classified as anomalously warm in 2015/2016, very warm in 2014/2015, and normal for the season in 2016/2017. The winter of 2017 was the wettest, with a precipitation total of 100–120 mm (Table 1).
During the spring and summer, the meteorological conditions in the study area in south-eastern Poland were most often shaped by air masses associated with anticyclonic (high-pressure) circulation, while air masses associated with cyclonic (low-pressure) conditions were predominant in the autumn and winter [37].
The frequency of atmospheric circulation types over the study area in 1981–2010 (the climate normal) and during the study period of 2015–2017 are presented in Table 2. The calendar developed by Bartoszek [52] was used to identify atmospheric circulation types.

2.4. Measurement Methods and Statistical Analysis

Measurement data on concentrations of tropospheric ozone obtained from the Chief Inspectorate of Environmental Protection in Poland were used in the study. Ozone concentrations were measured in accordance with standard PN-EN 14625:2013-02 (Ambient air—Standard method for the measurement of the concentration of ozone by ultraviolet photometry) [54] using Thermo Scientific Model 49i photometric analysers operating in the ultraviolet range (Thermo Fisher Scientific), with a measurement range of 0–0.05–200 ppm, precision 1.0 ppb, detection threshold 0.50 ppb, and airflow up to 3 dm3·min−1.
In accordance with Directive 2008/50/EC of the European Parliament and of the Council of 21 May 2008 on ambient air quality and cleaner air for Europe and the guidelines of the World Health Organization (WHO), statistical analysis of the data was based on one-hour average O3 concentrations within 24 h [1,55]. As an indicator of plant protection, the AOT40 parameter was calculated according to the guidelines given in Directive 2008/50/EC [55].
Variability in tropospheric ozone concentrations during the study period was analysed in meteorological seasons: spring (March–May), summer (June–August), autumn (September–November) and winter (December–February).
One-hour average ozone (O3) concentrations were used to calculate basic statistics: the average values and the coefficient of variation of tropospheric ozone concentrations in meteorological seasons These values were calculated for each of the measuring stations. To determine whether there were statistically significant differences in O3 concentrations between seasons, the Kruskal-Wallis median test was performed using non-parametric ANOVA.
In the next stage of the research, to identify the most frequent levels of atmospheric ozone concentrations, the frequency of ozone (O3) concentrations in each season was calculated according to the statistical criterion of 12 separated class intervals within the following limits: 0–10, 11–20, 21–30, 31–40, 41–50, 51–60, 61–70, 71–80, 81–90, 91–100, 101–110 and >111 μg·m−3. This criterion is used to facilitate the interpretation of a large quantity of numerical data [56].
Then the weekly dynamics of ozone concentrations in each season and on each day of the week were determined. Medians and extreme values of concentrations were calculated and presented in box and whisker plots. The whiskers in the top and bottom of the figures correspond to the highest and lowest ozone (O3) concentrations recorded at the measuring stations. The bottom of the box indicates the concentration recorded at a frequency of 25% (first quartile), while the top of the box corresponds to the concentrations that occurred at a frequency of 75% (third quartile). The line inside the box represents the median (second quartile), i.e., the median ozone concentration on each day of the week. Based on one-hour average O3 concentrations, changes in ozone concentrations over 24 h were analysed in each season of the year during the study period.
The dependence of tropospheric ozone concentrations on atmospheric circulation was presented based on the example of summer when the highest O3 concentrations were recorded. The frequency of a given circulation-type was associated with O3 concentrations.
The statistical calculations and graphic representations were made using Excel (MS Office 2016) and Statistica 13.6 (StatSoft Polska Sp. z o.o., Krakow, Poland, 2020).

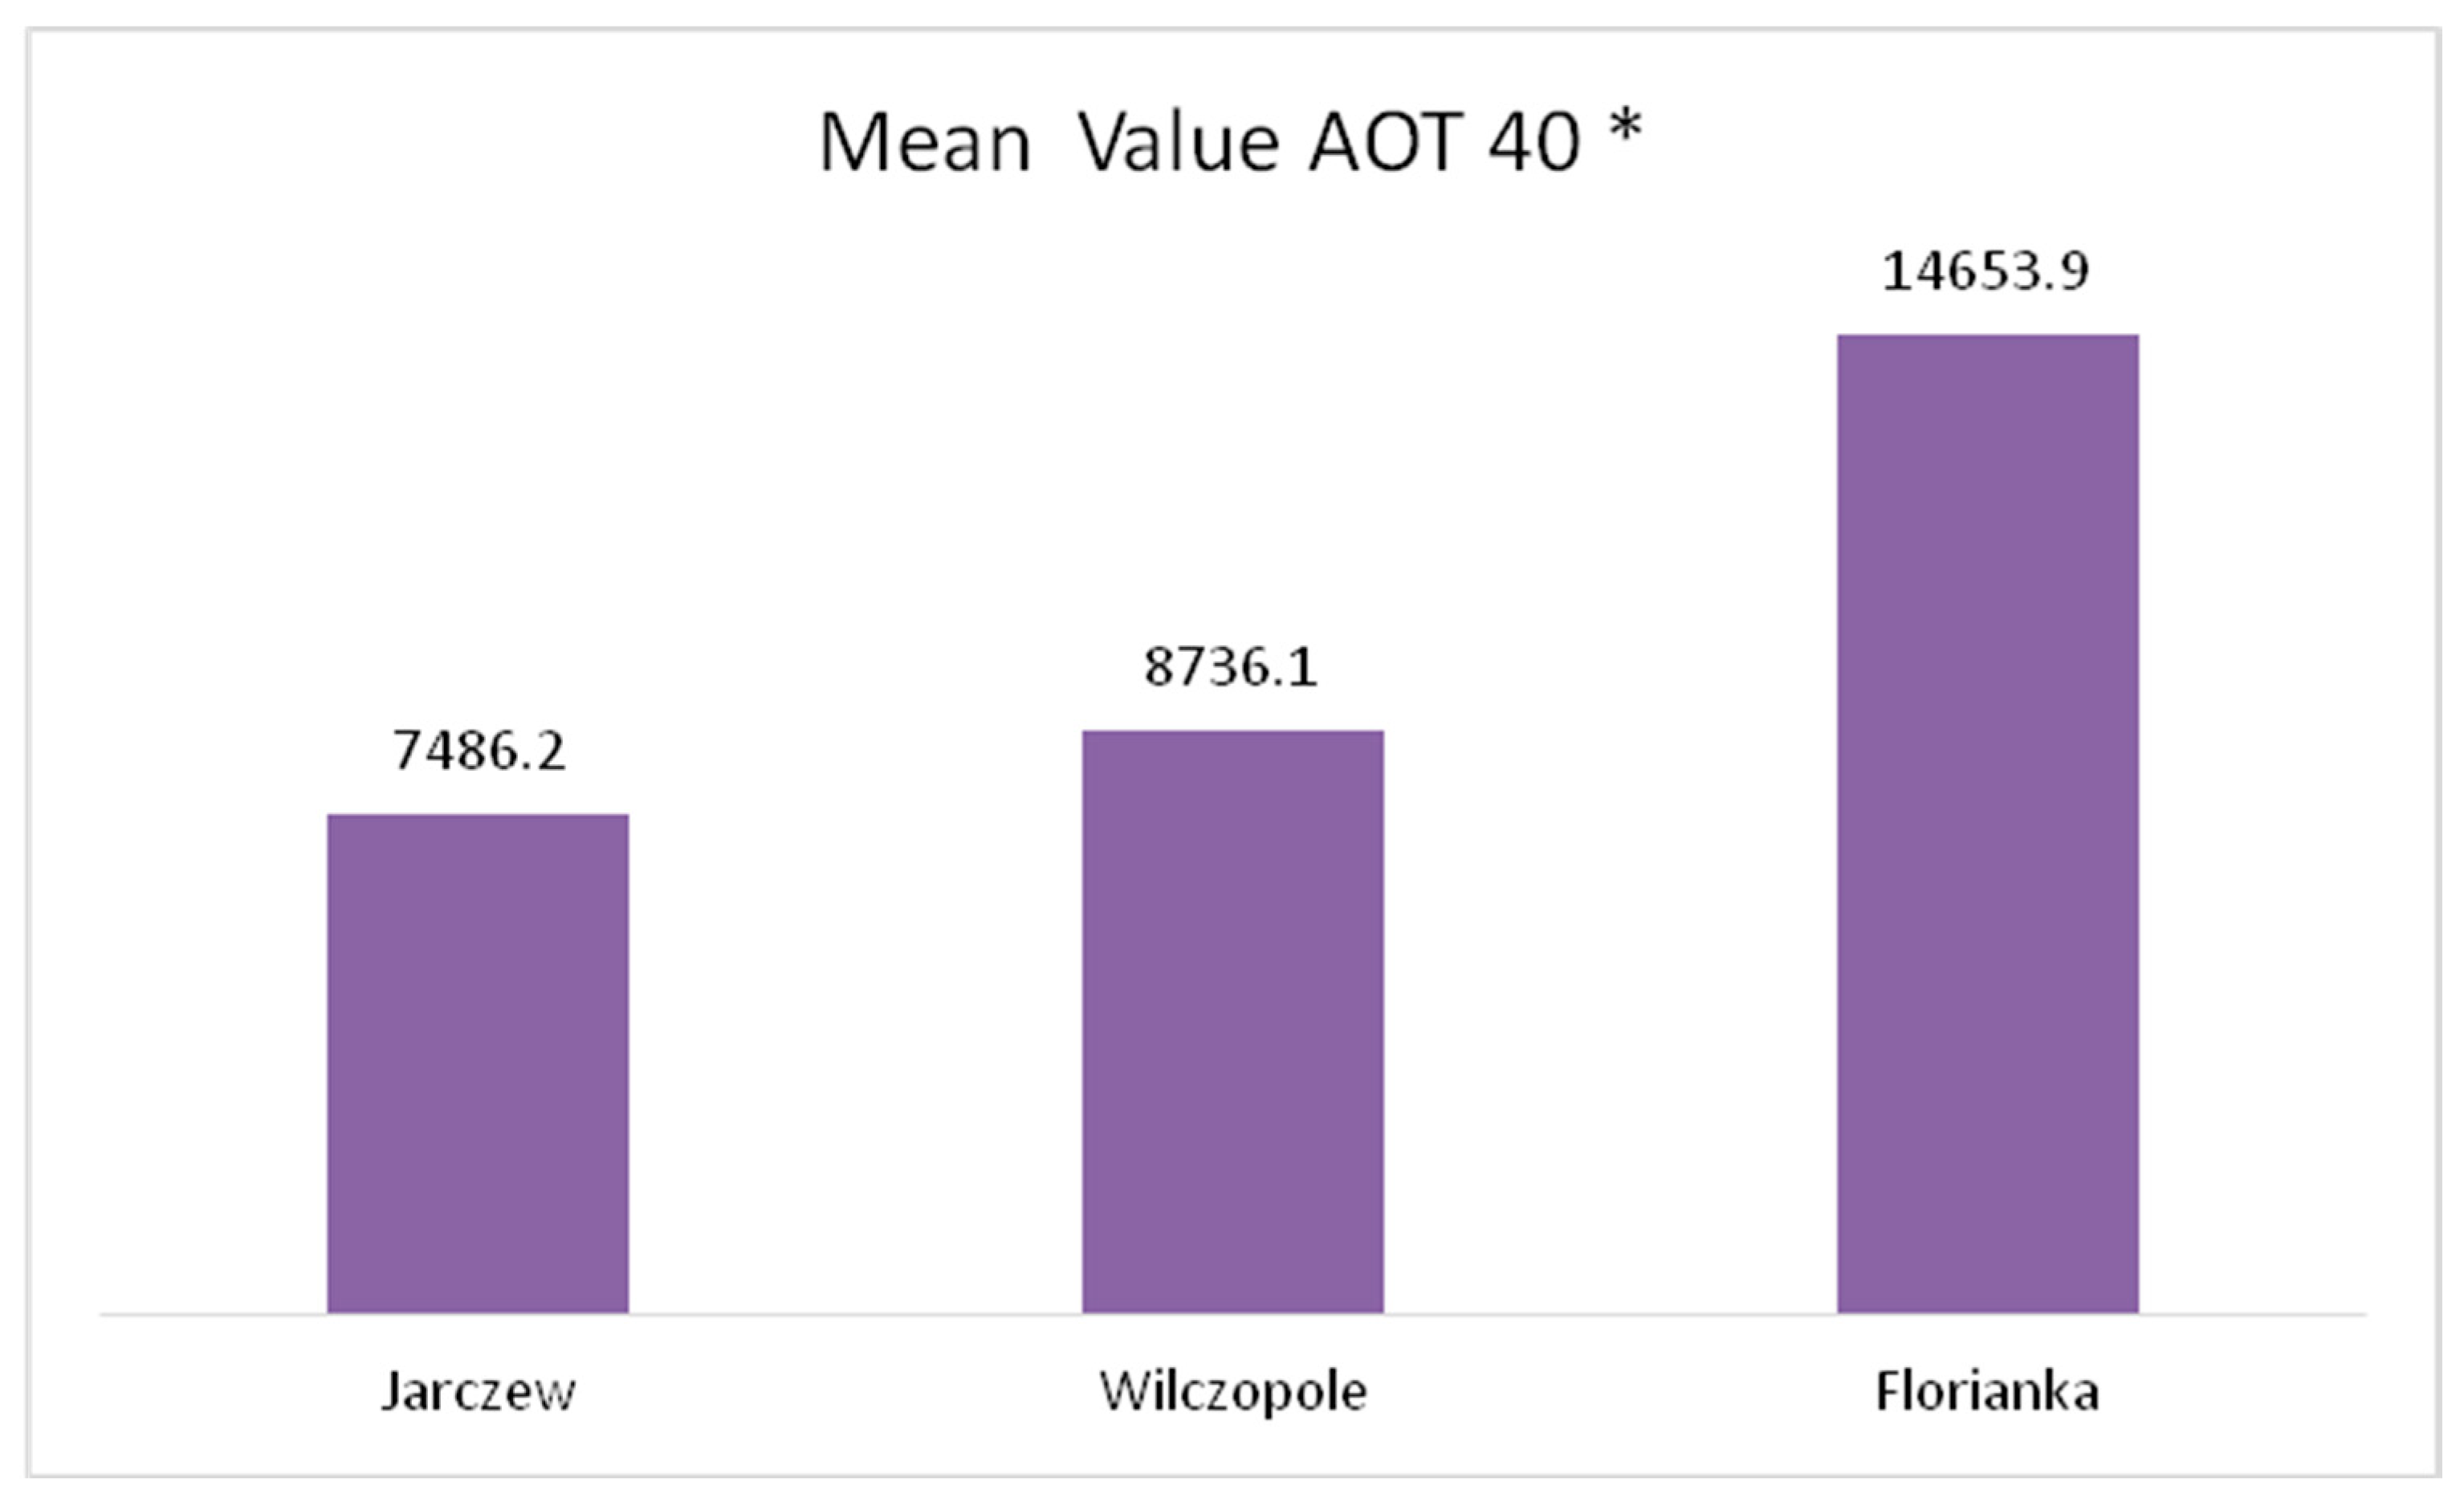
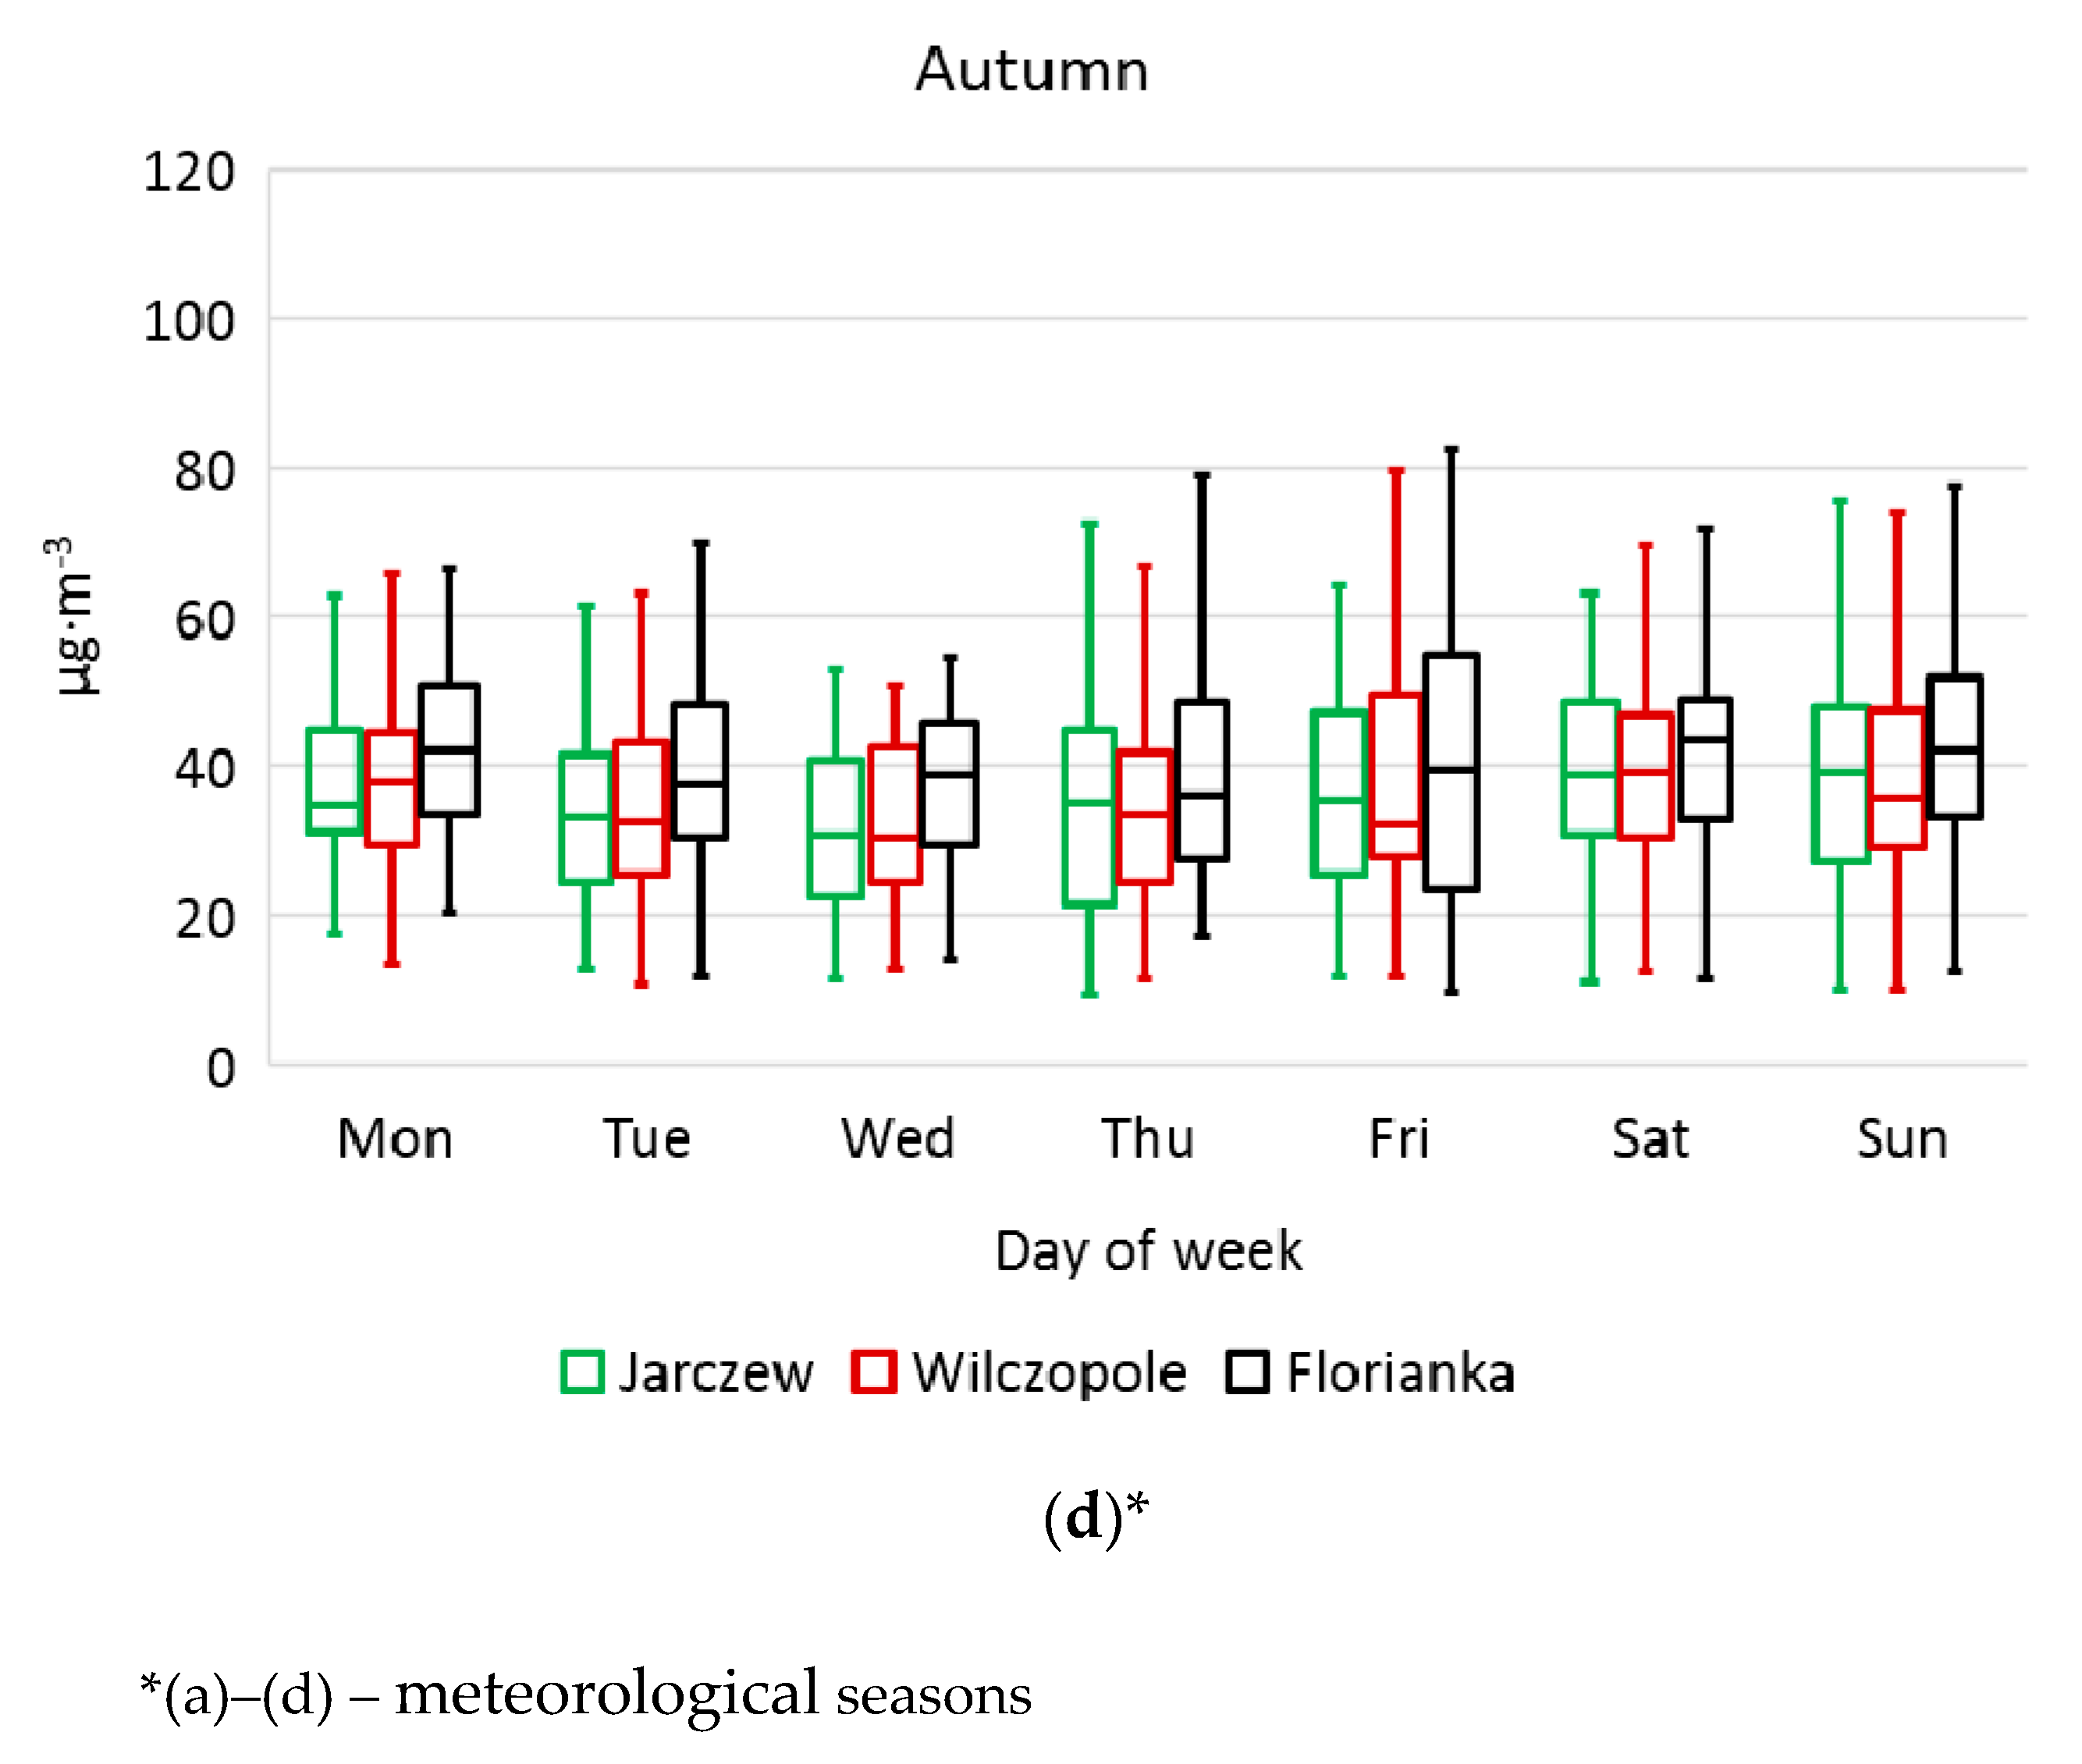
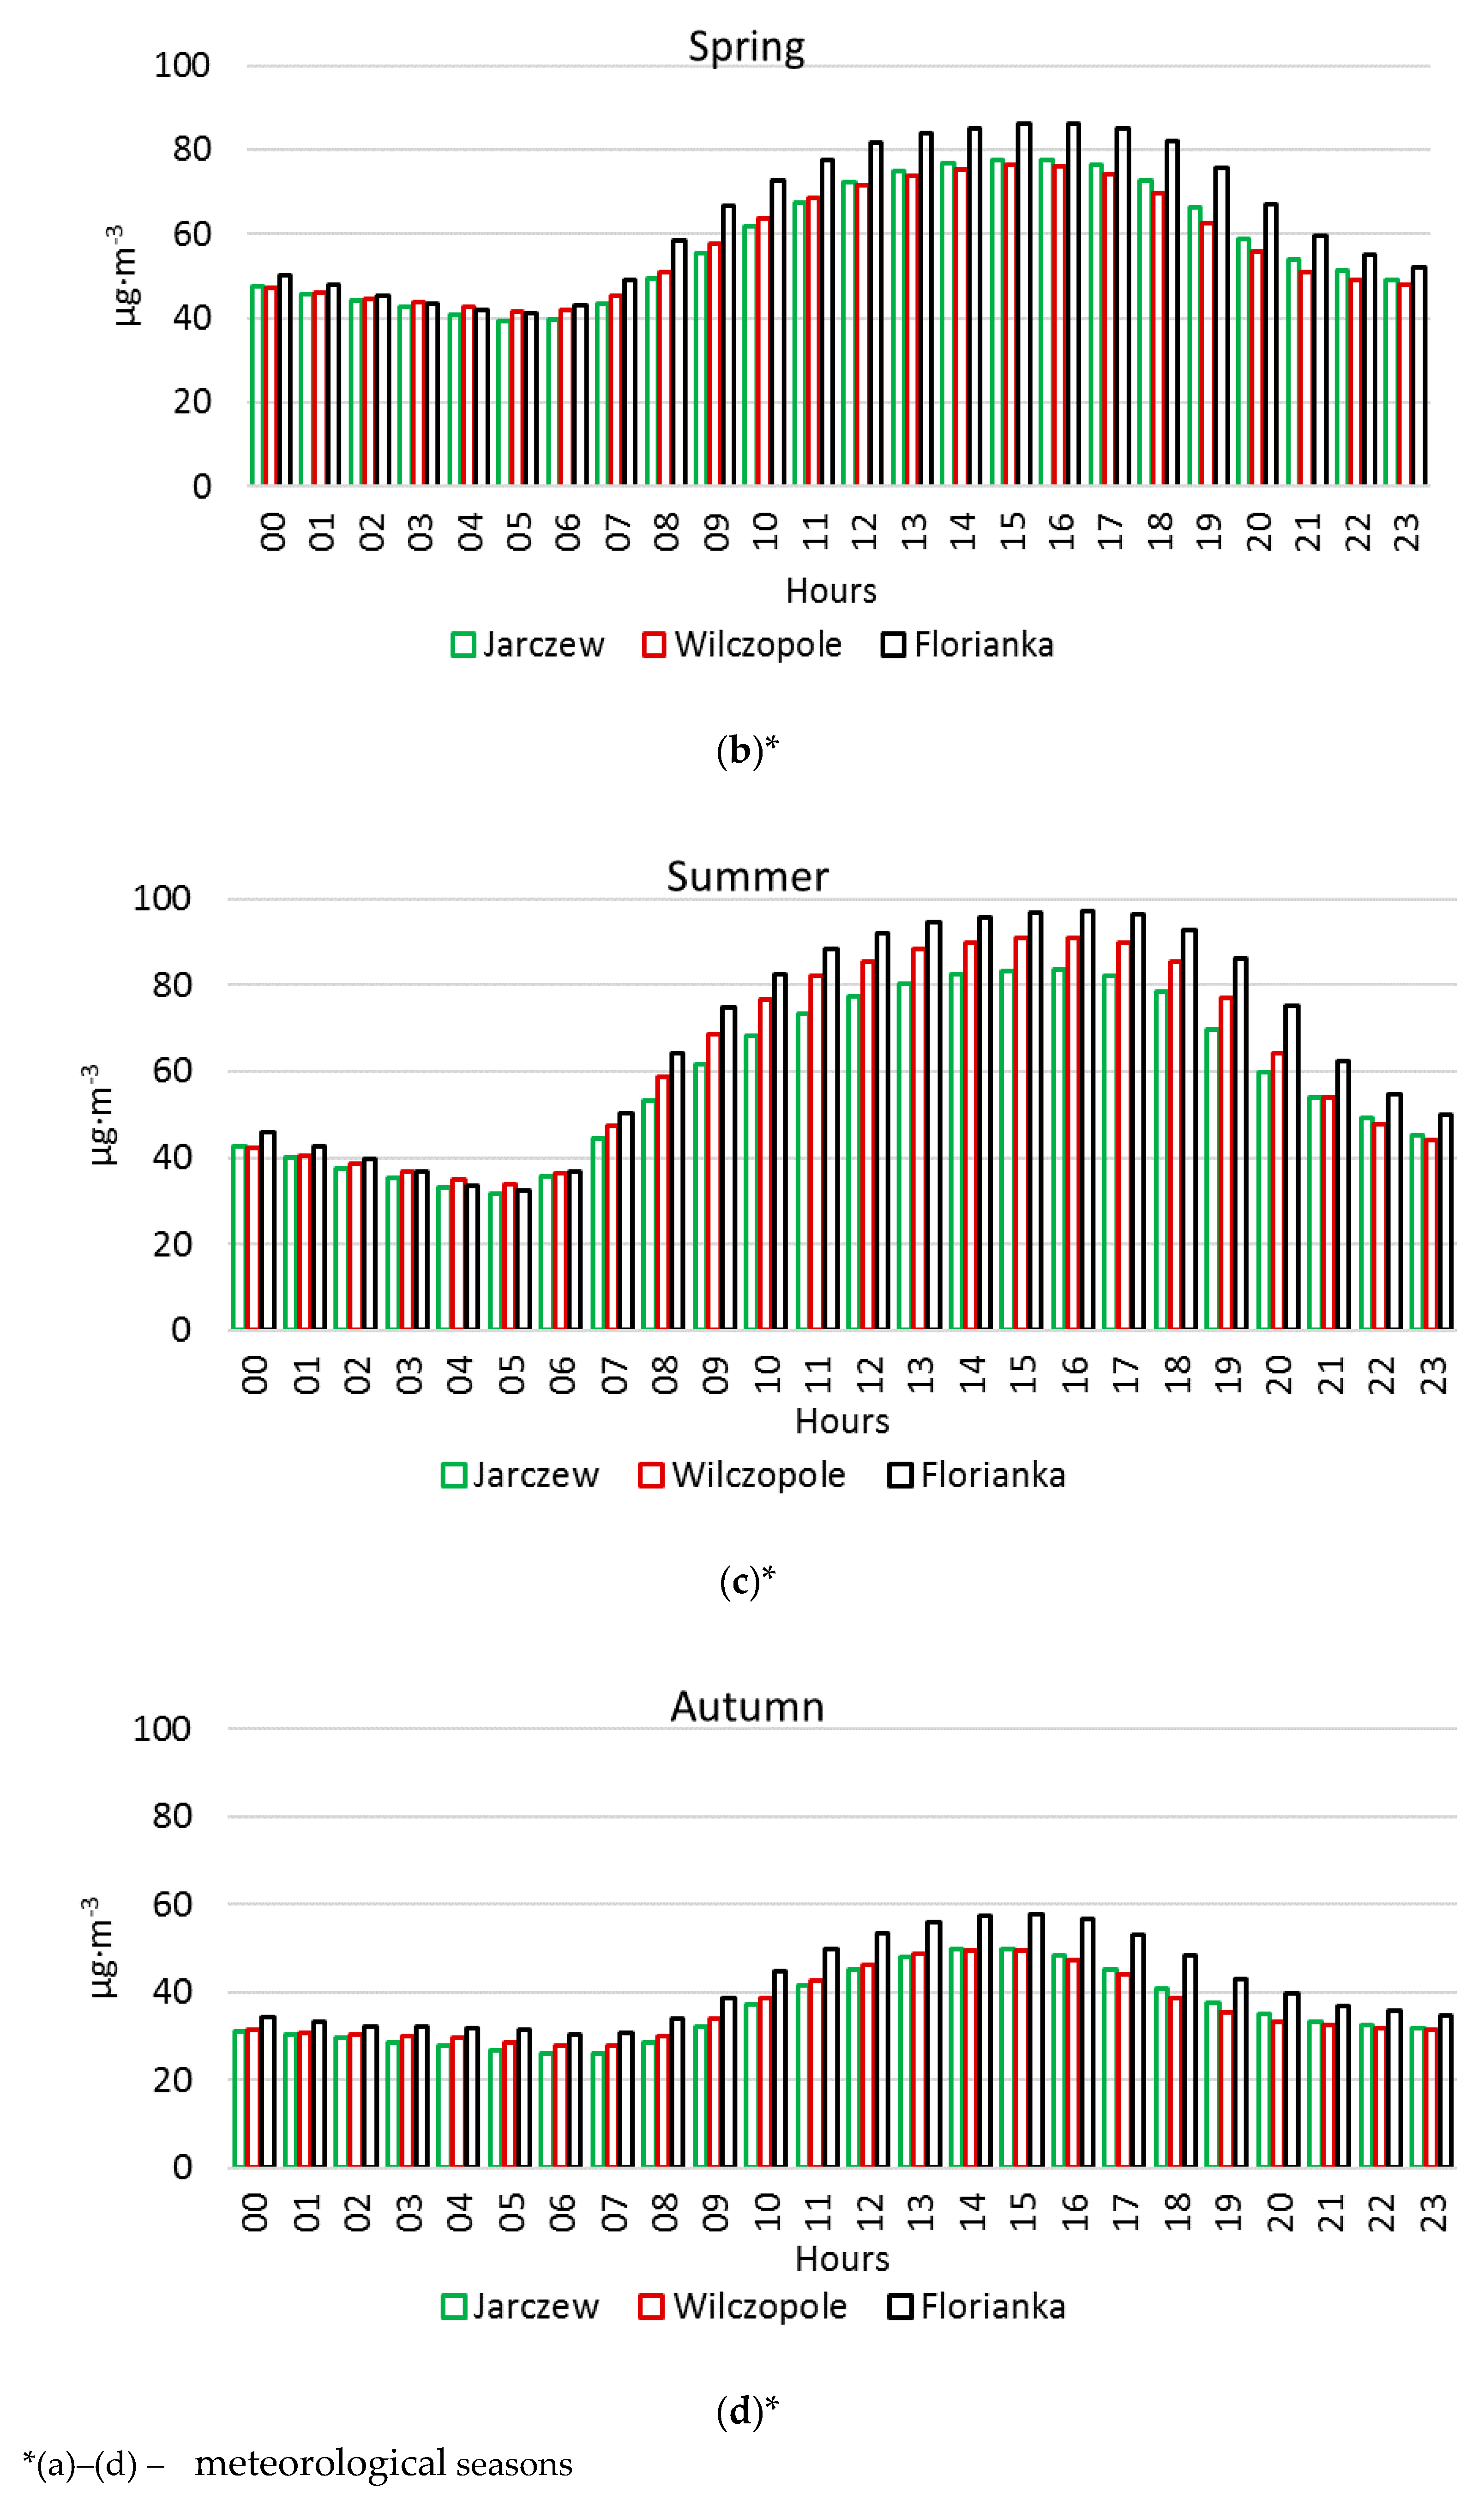
3. Results and Discussion

The assessment of population exposure to tropospheric ozone pollution is a difficult and complex task, as it shows considerable spatiotemporal variability and has a global scope. Both short- and long-term exposure to tropospheric ozone has a negative impact on the health of people, animals, plants, and entire ecosystems. According to the latest research by Williams et al. (2019), tropospheric ozone concentrations are currently increasing in most countries of the world, particularly in the Northern Hemisphere [57].
Due to the high temporal and spatial variability of tropospheric ozone concentrations, it is difficult to accurately and conclusively determine the extent to which long-term and short-term exposure to tropospheric ozone can affect plants, particularly crop plants, especially since different species of plants show different ranges of sensitivity to tropospheric ozone pollution [58].
In the present study, carried out in agricultural areas, the tropospheric ozone concentration in the context of crop protection, expressed by the AOT40 parameter, did not exceed the target level of 18,000 μg·m−3·h at any of the measurement stations. The highest mean AOT40 value in 2015–2017 was recorded at the Florianka monitoring station (14,653.9 μg·m−3·h) (Figure 2).
According to Fowler et al. [60] and Mills and Harmens [61], even short-term exposure to elevated tropospheric ozone concentrations can be dangerous for crops, especially for sensitive species such as common wheat (Triticum aestivum L.) and legumes (mainly string beans), as well as moderately sensitive species, such as maize (Zea mays L.), potato (Solanum tuberosum L.), and rice (Oryza sativa L.).
Borowiak et al. [62] showed that the Bel W3 variety of tobacco (Nicotiana L.) is very sensitive to the presence of ozone in the atmospheric air; it is a bio-indicator of tropospheric ozone. In the presence of ozone (O3), small spots or necrotic flecks indicating damage appear on the upper side of the tobacco leaves.
In light of climate change and the projected increase in O3, concentrations, it will be crucial for plant production to conduct further breeding work and to introduce biotechnological advances in order to improve the response of crop plants to the above-mentioned stress factors [30]. In our research, temporal variation in tropospheric ozone pollution was observed. In the period 2015–2017, the highest average one-hour tropospheric ozone concentrations were recorded during the meteorological summer (67.5 µg·m−3) and spring (64.1 µg·m−3) at the Florianka measuring station, which was at the highest elevation of all the measuring stations (270 m a.s.l.; Figure 1, Table 3). The highest O3 concentrations at the measuring stations were observed in the warmest summer, in 2015, which according to the temperature classification was extremely warm (Table 1).
The air temperature in the seasons analysed significantly exceeded the average temperature from 1961–2000 (Table 1). The temperature conditions during the years of the research were consistent with regional and global warming trends in Poland described by Węgrzyn et al. [34] and Skowera et al. [63].
The lowest average ozone concentration (36.0 µg·m−3) was observed in autumn at the Jarczew measuring station (177 m a.s.l.) and in winter (36.4 µg·m−3) at the Wilczopole station (202 m a.s.l.). The widest range of maximum O3 concentrations was observed at the Wilczopole station, with the highest values (178.4 µg·m−3) noted during the summer and the lowest (96 µg·m−3) in winter (Table 3). No O3 concentrations were recorded that would require public notification of the risk of an alert level (180 µg·m−3 one-hour average) or the risk of exceedance of the alert level (240 µg·m−3 one-hour average) at any of the locations in 2015–2017 [64].
The results of the study are consistent with the research of Roemer et al. [65], who reported variation in tropospheric ozone concentrations depending on the geographical location of the measuring station. According to Collins et al. [66], the concentration of tropospheric ozone in middle latitudes is largely influenced by stratospheric ozone, which is transported from the upper layers of the stratosphere to the lower layers of the troposphere by the Brewer–Dobson circulation.
For the analysis of tropospheric ozone concentrations in each season, the values were grouped according to the statistical criterion of 12 class intervals [56]. Ozone pollution at each of the measuring stations was found to be higher during meteorological spring and summer than during winter and autumn (Figure 3).
In spring, the most frequent concentrations at the Jarczew and Wilczopole measuring stations were in the range of 41–70 µg·m−3 (over 50%), while concentrations of 51–80 µg·m−3 were most frequent at the Florianka station (over 40%), with maximum concentrations of 61–80 µg·m−3. Concentrations above 111 µg·m−3 were also recorded at all stations in spring. They were noted most often at the Florianka station, located at the highest altitude, with a frequency of nearly 4% (Figure 3).
The distribution of concentration frequencies among classes was most even in the summer. Nevertheless, concentrations in higher class intervals from 91 to over 111 µg·m−3 were more frequent in the summer than in other seasons.
The frequency distribution of concentration classes of O3 was the most diverse in winter, compared to the other seasons. The highest ozone concentrations were recorded at the Florianka station—31–60 µg·m−3, followed by Jarczew—31–50 µg·m−3 and Wilczopole—21–40 µg·m−3. None of the measuring stations recorded ozone concentrations in the highest class (12), i.e., above 111 µg·m−3, and concentrations above 80 µg·m−3 were relatively rare—below 5% (Figure 3).
In autumn, about 65% of all results in Jarczew and Wilczopole and 53% in Florianka were ozone concentrations up to 40 µg·m−3, with a predominance of concentrations in the range of 31–40 µg·m−3. Concentrations in class 12, i.e., above 111 µg·m−3, were recorded sporadically.
The results of the study are in agreement with those reported by Parrish et al. [67], who found higher levels of tropospheric ozone in spring and summer than in autumn and winter. The effect of climatic conditions on O3 concentrations is widely discussed in the literature [67,68,69,70]. According to De Nevers [71], Paudsainee et al. [72], Khoder [73], and Langner et al. [74], the intensive solar radiation, high temperature, and high relative humidity in summer contribute to high O3 concentrations. Cooper et al. [75] also draw attention to the emission of ozone precursors of anthropogenic and natural origin.
The effect of varied meteorological conditions during the seasons of the year and years of the study (2015–2017) on the concentration of tropospheric ozone is confirmed by the results of the Kruskal–Wallis test (Table 4). In the warmest year (2015), statistically significant differences in ozone concentrations were found between seasons: for spring vs. summer, autumn and winter, and for summer vs. autumn and winter. In 2016 and 2017, when temperatures were somewhat lower and rainfall was higher, statistically significant differences were noted for spring vs. autumn and winter, and for summer vs. autumn and winter (Table 4).
The annual change in O3 concentrations in any spatial dimension depends on the transport and exchange of air masses that are constantly moving, and local precursor sources can have a decisive effect on the specific nature of O3 spatial distribution [68,75,76].
Comparison of the frequency of atmospheric circulation types in 2015–2017 with the climate normal (1980–2010) showed that the weather conditions in the study area were most often shaped by directional (a) and non-directional (A) anticyclonic types (Table 2 and Table 5).
To determine the effect of the atmospheric circulation-type on the O3 concentration, 24-h average ozone concentrations were calculated for each circulation type. In the summer, the anticyclonic (high-pressure) type was found to be the most common –45.3% of days, while the cyclonic (low-pressure) type was the least common −18.5% (Table 5). In the summer of 2015–2017, anticyclonic directional (from E, SE, S, SW and W) and non-directional conditions characterized 33.3% of days, cyclonic directional conditions 10.9%, and conditions without the clear involvement of an anticyclone 17.4% (Table 2). The highest 24-h average O3 concentrations were noted when there was an inflow of air masses from the south and of non-directional air masses. During cyclonic conditions, the highest O3 concentration was noted when there was an inflow of air masses from the southwest (SWc), and in anticyclonic conditions, air masses from the south (S, SWa and SEa) and non-directional air masses (A). In these circulation types, the highest O3 concentrations were observed during the extremely warm year of 2015 compared to the other years of the study (Table 1, Table 2 and Table 5).
It should be emphasized, however, that the measuring stations included in the study are located in agricultural areas and are not adjacent to industrialized areas. In addition, the air masses flowing into this area from the western and eastern sectors have already been transformed and carry a reduced pollution load (Table 2).
The analysis of average tropospheric ozone concentrations on each day of the week in each season of the year (Figure 4) did not reveal higher O3 concentrations on non-working days (the weekend). On each day of the week, the highest values were recorded at the Florianka station, but no “weekend effect”, which is widely described in the literature, was observed. This effect is mainly observed in cities, while our research was conducted in agricultural areas [77,78,79,80,81]. According to Padusainee et al. [72], the mechanisms of the influence of the weekend on tropospheric ozone formation are still not fully understood and may have multiple causes.
During the study period (2015–2017), the ozone concentration had a clear daily structure (Figure 5). At each station, O3 concentrations were higher in the late morning and early afternoon than in the early morning, evening and night (Figure 5).
These results are consistent with the research of Gorai et al. [69], who found that temporal changes in tropospheric ozone concentrations clearly indicate a general 24-h cycle, with the maximum concentration noted from late morning to mid-afternoon and the minimum during the night and in the early morning. This corresponds to the daily course of air temperature.
Analysis of the course of O3 concentrations during a 24-h period showed that the highest concentrations were recorded at the Florianka measuring station, which is located in Roztocze National Park, at the highest elevation above sea level of the three measuring points. The southern part of the Lublin Voivodeship has greater forest cover than the rest of the region (>25%). The increased tropospheric ozone concentrations at this station may have been linked to emissions of hydrocarbons of natural origin, known as biogenic hydrocarbons, which are involved in the formation of tropospheric ozone. They are emitted to the environment mainly by broad-leaved trees (e.g., isoprene C5H8) [16,18]. Isoprene emissions vary over the course of the day—the level is zero at night and highest in daylight hours (depending on the intensity of solar radiation, temperature and leaf surface area) [82]. In our study, this may have contributed to the occurrence of the highest tropospheric ozone concentrations in areas with high forest cover during the meteorological summer.

4. Conclusions

It can be concluded from this study that the typical agricultural region of central-eastern Poland is much less exposed to tropospheric ozone (O3) pollution than more industrialized parts of the country. Ozone concentrations that would require public notification of the risk of an alert level (180 µg·m−3, one-hour average) were not recorded at any of the monitoring stations. Moreover, the analysis of O3 concentrations in the context of plant protection, expressed by the AOT40 parameter, revealed no exceedances of the target value (18,000 μg·m−3·h).
However, progressive global warming and the circulation determinants in this region, i.e., the predominance of high-pressure conditions with the inflow of warm air masses, manifested by an increase in the frequency of days with extremely high air temperatures, may in the future contribute to higher tropospheric ozone concentrations in this region as well.
Significant differences were shown in the tropospheric ozone concentrations in different seasons of the year and in different years of the study. The highest average tropospheric ozone concentrations were found to occur during the meteorological summer and spring at the Florianka measuring station, which was located at the highest elevation above sea level of the three stations included in the study. This station is located in the area with the highest forest cover, which may have contributed to increased production of biogenic isoprene, an ozone precursor.
The highest O3 concentrations at the locations studied were found in the extremely warm summer of 2015.
The ozone concentrations at each of the measuring stations were found to have a clear structure over the course of the day. Ozone concentrations were higher in the late morning and early afternoon than in the early morning and at night.

Author Contributions

Conceptualization, Z.Z. and A.B.; methodology, B.S.; validation, Z.Z., and B.S.; formal analysis, A.B., B.S. and Z.Z. writing—original draft preparation, A.B., B.S. and Z.Z.; writing—review and editing, A.B. and B.S.; visualization, Z.Z.; supervision, B.S. All authors have read and agreed to the published version of the manuscript.

Funding

Funded with a subsidy of the Ministry of Science and Higher Education for the University of Agriculture in Kraków for 2020.

Acknowledgments

The authors would like to thank Jakub Wojkowski for drawing Figure 1.

Conflicts of Interest

The authors declare no conflict of interest.

References

  1. World Health Organization (WHO). Ambient Air Pollution: A Global Assessment of Exposure and Burden of Disease; WHO: Geneva, Switzerland, 2016; Available online: https://apps.who.int/iris/handle/10665/250141 (accessed on 2 May 2019).
  2. European Environment Agency (EEA). Air Quality in EUROPE—2019 Report; EEA: Publications Office of the European Union: Luxemburg, 2019; Available online: https://www.developmentaid.org/api/frontend/cms/uploadedImages/2019/10/Air-quality-in-europe_2019-final.pdf (accessed on 6 February 2020). [CrossRef]
  3. Juda-Rezler, K. The Impact of Air Pollution on the Environment; Oficyna Wydawnicza Politechniki Warszawskiej: Warszawa, Poland, 2000. (In Polish) [Google Scholar]
  4. Jansen, K.; Larson, T.; Koenig, J.; Mar, T.; Fields, C.; Stewart, J.; Lippmann, M. Associations between health effects and particulate matter and black carbon in subjects with respiratory disease. Environ. Health Perspect. 2005, 113, 1741–1746. [Google Scholar] [CrossRef] [PubMed]
  5. Atkinson, R.; Carey, I.; Kent, A.; Staa, T.; Anderson, H.; Cook, D. Long-term exposure to outdoor air pollution and incidence of cardiovascular diseases. Epidemiology 2013, 24, 44–53. [Google Scholar] [CrossRef] [PubMed] [Green Version]
  6. Clifford, A.; Lang, L.; Chen, R.; Anstey, K.; Seaton, A. Exposure to air pollution and cognitive functioning across the life course—A systematic literature review. Environ. Res. 2016, 147, 383–398. [Google Scholar] [CrossRef]
  7. Badyda, A.; Grellier, J.; Dąbrowicki, P. Rating load selected diseases of the respiratory and cardiovascular system because of air pollution in 11 Polish cities. Lek. Wojsk. 2016, 1, 32–38. (In Polish) [Google Scholar]
  8. Organisation for Economic Co-operation and Development (OECD). Eenvironmental Outlook to 2030; OECD: Paris, France, 2008; Available online: http://www.oecd.org/env/indicators-modelling-outlooks/40204795.pdf (accessed on 6 February 2020).
  9. Mills, G.; Wagg, S.; Harmens, H. Ozone Pollution: Impacts on Ecosystem Services and Biodiversity; ICP Vegetation Programme Coordination Centre, Centre for Ecology and Hydrology: Bangor, UK, 2013; Available online: https://icpvegetation.ceh.ac.uk/sites/default/files/Ozone%20pollution%20-%20Impacts%20on%20ecosystem%20services%20and%20biodiversity.pdf (accessed on 6 February 2020).
  10. Alonso, R.; Elvira, S.; González-Fernández, I.; Calvete, H.; García-Gómez, H.; Bermejo, V. Drought stress does not protect Quercus ilex L. from ozone effects: Results from a comparative study of two subspecies differing in ozone sensitivity. Plant Biol. 2014, 16, 375–384. [Google Scholar] [CrossRef] [PubMed]
  11. Shindell, D.; Kuylenstierna, J.C.I.; Vignati, E.; Van Dingenen, R.; Amann, M.; Klimont, Z.; Anenberg, S.C.; Muller, N.; Janssens-Maenhout, G.; Raes, F.; et al. Simultaneously Mitigating Near—Term Climate Change and Improving Human Health and Food Security. Science 2012, 335, 183–189. [Google Scholar] [CrossRef] [Green Version]
  12. Reid, N.; Yap, D.; Bloxam, R. The potential role of background ozone on current and emerging air issues: An overview. Air Qual. Atmos. Health 2008, 1, 19–29. [Google Scholar] [CrossRef] [Green Version]
  13. Meehl, G.A.; Stocker, T.F.; Collins, W.D.; Friedlingstein, P.; Gaye, A.T.; Gregory, J.M.; Kitoh, A.; Knutti, R.; Murphy, J.M.; Noda, A.; et al. Global climate projections. In Climate Change 2007: The Physical Basis Contribution of Working Group I to Fourth Assessment Report of IPCC on Climate Change; Solomon, S., Qin, D., Manning, M., Chen, Z., Marquis, M., Averyt, K.B., Miller, H.L., Tignor, M., Eds.; Cambridge University Press: Cambridge, UK, 2007. [Google Scholar]
  14. Avnery, S.; Mauzerall, D.; Liu, J.; Horwitz, L. Global crop yield reductions due to surface ozone exposure: 1. Year 2000 crop production losses and economic damage. Atmos. Environ. 2011, 45, 2284–2296. [Google Scholar] [CrossRef]
  15. Skotak, K. Ozone concentration attributable premature death in Poland. Med. Środowiskowa Environ. Med. 2010, 13, 30–40. [Google Scholar]
  16. Beck, J.P.; Krzyzanowski, M.; Koffi, B.; Hjellbrekke, A.G.; Hootsen, H.; Millán, M.; Tombrou, M.; Simpson, D.; Tropospheric Ozone in the European Union. The Consolidated Report, Topic Report. 1998. Available online: https://www.eea.europa.eu/publications/TOP08-98/page001.html (accessed on 6 February 2020).
  17. Chameides, W.L.; Lindsay, R.W.; Richardson, J.; Kiang, C.S. The role of biogenic hydrocarbons in urban photochemical smog: Atlanta—A case study. Science 1988, 241, 1473–1474. [Google Scholar] [CrossRef]
  18. Geng, F.; Tie, X.; Guenther, A.; Li, G.; Cao, J.; Harley, P. Effect of isoprene emissions from major forests on ozone formation in the city of Shanghai, China. Atmos. Chem. Phys. 2011, 11, 10449–10459. [Google Scholar] [CrossRef] [Green Version]
  19. Calfapietra, C.; Fares, S.; Lofeto, F. Volatile organic compounds from Italian vegetation and their interaction with ozone. Environ. Pollut. 2009, 157, 1478–1486. [Google Scholar] [CrossRef] [PubMed]
  20. Arneth, A.; Schurgers, G.; Hickler, T.; Miller, P.A. Effects of species composition, land surface cover, CO2 concentration and climate on isoprene emissions from European Forests. Plant Biol. 2008, 10, 150–162. [Google Scholar] [CrossRef]
  21. Yokouchi, Y.; Ambe, Y. Aerosols formed from the chemical reaction of monoterpenes and ozone. Atmos. Environ. 2007, 41, 192–197. [Google Scholar] [CrossRef]
  22. Oltmans, S.J.; Lefohn, A.S.; Harris, J.M.; Galbally, I.; Scheel, H.E.; Bodeker, G.; Brunke, E.; Claude, H.; Tarasick, D.; Johnson, B.J.; et al. Long—Term changes in tropospheric ozone. Atmos. Environ. 2006, 40, 3156–3173. [Google Scholar] [CrossRef]
  23. Musselman, R.; Lefohn, A.; Massman, W.; Heath, R. A critical review and analysis of the use of exposure- and flux- based ozone indices for predicting vegetation effects. Atmos. Environ. 2006, 40, 1869–1888. [Google Scholar] [CrossRef]
  24. Woo, S.; Hinckley, T. The effects of ozone on growth and stomatal response in the F2 generation of hybrid poplar (Populus trichocarpa × Populus deltoides). Biol. Plant. 2005, 49, 395–404. [Google Scholar] [CrossRef]
  25. Wittig, V.E.; Ainsworth, E.A.; Long, S.P. To what extent do current and projected increases in surface ozone affect photosynthesis and stomatal conductance of trees? A meta—Analytic review of the last 3 decades of experiments. Plant. Cell Environ. 2007, 30, 1150–1162. [Google Scholar] [CrossRef]
  26. Emberson, L.D.; Buker, P.; Ashmore, M.R.; Mills, G.; Jackson, L.S.; Agrawal, M.; Atikuzzaman, M.D.; Cinderby, S.; Engardt, M.; Jamir, C.; et al. A comparison of North-America and Asian exposure response data for ozone effects on crop yields. Atmos. Environ. 2009, 43, 1945–1953. [Google Scholar] [CrossRef]
  27. Rai, R.; Agrawal, M. Impact of Tropospheric Ozone on Crop Plants. Proc. Natl. Acad. Sci. India Sect. B Biol. Sci. 2012, 82, 241–257. [Google Scholar] [CrossRef]
  28. Ashmore, M.R. Assessing the future global impacts of ozone on vegetation. Plant Cell Environ. 2005, 28, 949–964. [Google Scholar] [CrossRef]
  29. Van Dingenen, R.; Dentener, F.; Raes, F.; Krol, M.; Emberson, L.; Cofala, J. The global impact of ozone on agricultural crop yields under current and future air quality legislation. Atmos. Environ. 2009, 43, 604–618. [Google Scholar] [CrossRef]
  30. Ainsworth, E.A.; Rogers, A.; Leaky, A.D.B. Targets for crop biotechnology in a future high—CO2 and high—O3 world. Plant. Physiol. 2008, 147, 13–19. [Google Scholar] [CrossRef] [PubMed] [Green Version]
  31. Paoletti, E.; De Marco, A.; Beddows, D.C.S.; Harrison, R.M.; Manning, W.J. Ozone levels in European and USA cities are increasing more than at rural sites, while peak values are decreasing. Environ. Pollut. 2014. [Google Scholar] [CrossRef] [PubMed]
  32. Kondracki, J. Geografia Regionalna Polski (Regional Geography of Poland); Polskie Wydawnictwo Naukowe: Warszawa, Poland, 2000; Available online: https://www.academia.edu/35109465/Kondracki_J._-_Geografia_regionalna_Polski (accessed on 6 March 2020). (In Polish)
  33. Główny Urząd Statystyczny (GUS). Rocznik Statystyczny Województw—Polska 2019.(Statistical Yearbook of the Regions—Poland 2019); Główny Urząd Statystyczny: Warszawa, Poland, 2019; Available online: File:///C:/Users/admin/Downloads/rocznik_statystyczny_wojewodztw_2019.pdf (accessed on 6 February 2020). (In Polish)
  34. Węgrzyn, A.; Wojkowski, J.; Skowera, B. Rolnicze okresy termiczne na Lubelszczyźnie w latach 1981–2010 (Agricultural thermal seasons in the Lublin region in the period 1981–2010). Acta Agroph. 2017, 24, 535–551. (In Polish) [Google Scholar]
  35. Kaszewski, B. Warunki klimatyczne Lubelszczyzny (Climatic Conditions of the Lublin Region); UMCS: Lublin, Poland, 2008; p. 60. (In Polish) [Google Scholar]
  36. Kaszewski, B.M.; Mrugała, S.; Warakomski, W. Klimat: Temperatura Powietrza i Opady Atmosferyczne Lubelszczyzny (1951–1990). (Climate: Air temperature and Atmospheric Precipitation in the Lublin Region (1951–1990)), T.1. ed.; Seria: Środowisko przyrodnicze Lubelszczyzny; Lubelskie Towarzystwo Naukowe: Lublin, Poland, 1995; p. 69. (In Polish) [Google Scholar]
  37. Kaszewski, B.M.; Bartoszek, K.; Gluza, A. Synoptic conditions of advection of arctic and tropical air masses over the Lublin region. Ann. UMCS Sec. B 2017, 7–26. [Google Scholar] [CrossRef]
  38. Miętus, M.; Owczarek, M.; Filipiak, J. Thermal conditions on the Polish Coast and the Pomerania Region in view of selected classifications. Mater. Badaw. IMGW Ser. Meteorol. 2002, 36, 56. [Google Scholar]
  39. Institute of Meteorology and Water Management National Research Institute. Climate Monitoring Bulletin, Spring 2015. 2015 ed. Available online: http://klimat.pogodynka.pl/pl/biuletyn-monitoring/#2015/wiosna (accessed on 30 March 2020).
  40. Institute of Meteorology and Water Management National Research Institute. Climate Monitoring Bulletin, Spring 2016. 2016 ed. Available online: http://klimat.pogodynka.pl/pl/biuletyn-monitoring/#2016/wiosna (accessed on 30 March 2020).
  41. Institute of Meteorology and Water Management National Research Institute. Climate Monitoring Bulletin, Spring 2017. 2017 ed. Available online: http://klimat.pogodynka.pl/pl/biuletyn-monitoring/#2017/wiosna (accessed on 30 March 2020).
  42. Institute of Meteorology and Water Management National Research Institute. Climate Monitoring Bulletin, Summer 2015. 2015 ed. Available online: http://klimat.pogodynka.pl/pl/biuletyn-monitoring/#2015/lato (accessed on 30 March 2020).
  43. Institute of Meteorology and Water Management National Research Institute. Climate Monitoring Bulletin, Summer 2016. 2016 ed. Available online: http://klimat.pogodynka.pl/pl/biuletyn-monitoring/#2016/lato (accessed on 30 March 2020).
  44. Institute of Meteorology and Water Management National Research Institute. Climate Monitoring Bulletin, Summer 2017. 2017 ed. Available online: http://klimat.pogodynka.pl/pl/biuletyn-monitoring/#2017/lato (accessed on 30 March 2020).
  45. Institute of Meteorology and Water Management National Research Institute. Climate Monitoring Bulletin, Autumn 2015. 2015 ed. Available online: http://klimat.pogodynka.pl/pl/biuletyn-monitoring/#2015/jesien (accessed on 30 March 2020).
  46. Institute of Meteorology and Water Management National Research Institute. Climate Monitoring Bulletin, Autumn 2016. 2016 ed. Available online: http://klimat.pogodynka.pl/pl/biuletyn-monitoring/#2016/jesien (accessed on 30 March 2020).
  47. Institute of Meteorology and Water Management National Research Institute. Climate Monitoring Bulletin, Autumn 2017. 2017 ed. Available online: http://klimat.pogodynka.pl/pl/biuletyn-monitoring/#2017/jesien (accessed on 30 March 2020).
  48. Institute of Meteorology and Water Management National Research Institute. Climate Monitoring Bulletin, Winter 2014–2015 (December 2014–February 2015). 2015 ed. Available online: http://klimat.pogodynka.pl/pl/biuletyn-monitoring/#2015/zima (accessed on 30 March 2020).
  49. Institute of Meteorology and Water Management National Research Institute. Climate Monitoring Bulletin, Winter 2015–2016 (December 2015–February 2016). 2016 ed. Available online: http://klimat.pogodynka.pl/pl/biuletyn-monitoring/#2016/zima (accessed on 30 March 2020).
  50. Institute of Meteorology and Water Management National Research Institute. Climate Monitoring Bulletin, Winter 2016–2017 (December 2016–February 2017). 2017 ed. Available online: http://klimat.pogodynka.pl/pl/biuletyn-monitoring/#2017/zima (accessed on 30 March 2020).
  51. Kaczorowska, Z. Opady w Polsce w Przekroju Wieloletnim. (Rainfall in Poland over a Long-Term Cross-Section). Przegląd Geogr. IG PAN 1962, 33, 112. (In Polish) [Google Scholar]
  52. Bartoszek, K. Calendar of Circulation Types over the Lublin Region. Computer File; Maria Curie-Sklodowska University in Lublin, Department of Hydrology and Climatology: Lublin, Poland, 2019. [Google Scholar]
  53. Bartoszek, K. The main characteristics of atmospheric circulation over East-Central Europe from 1871 to 2010. Meteorol. Atmos. Phys. 2017, 129, 113–129. [Google Scholar] [CrossRef] [Green Version]
  54. PN-EN 14625:2013-02. Ambient Air—Standard Method for the Measurement of the Concentration of Ozone by Ultraviolet Photometry; Polish Committee for Standardization: Warsaw, Poland, 2013. [Google Scholar]
  55. Directive 2008/50/EC of the European Parliament and of the Council of 21 May 2008 on Ambient Air Quality and Cleaner Air for Europe. Available online: http://eur-lex.europa.eu/legal-content/en/ALL/?uri=CELEX:32008L0050 (accessed on 17 August 2020).
  56. Łomnicki, A. Wprowadzenie do Statystyki dla Przyrodników; Introduction to Statistics for Naturalists; Wydawnictwo Naukowe PWN: Warszawa, Poland, 2003; p. 260. (In Polish) [Google Scholar]
  57. Williams, R.S.; Hegglin, M.I.; Kerridge, B.J.; Jöckel, P.; Latter, B.G.; Plummer, D.A. Characterising the seasonal and geographical variability in tropospheric ozone, stratospheric influence and recent changes. Atmos. Chem. Phys. 2019, 19, 3589–3620. [Google Scholar] [CrossRef] [Green Version]
  58. Ficus, E.; Booker, E.; Burkey, K. Crop responses to ozone: Uptake, modes of action, carbon assimilation and partitioning. Plant. Cell Environ. 2005, 28, 997–1011. [Google Scholar] [CrossRef]
  59. Inspekcja Ochrony Środowiska. Bank Danych Pomiarowych. Available online: http://powietrze.gios.gov.pl/pjp/current/station_details/archive/74 (accessed on 4 November 2019).
  60. Fowler, D.; Pilegaard, K.; Sutton, M.A.; Ambus, P.; Raivonen, M.; Duyzer, J.; Simpson, D.; Fagerli, H.; Fuzzi, S.; Schjoerring, J.K.; et al. Atmospheric composition change: Ecosystems—Atmosphere interactions. Atmos. Environ. 2009, 43, 5193–5267. [Google Scholar] [CrossRef]
  61. Mills, G.; Harmens, H. Ozone pollution: A hidden threat to food security; ICP Vegetation Programme Coordination Centre. CEH: Bangor, UK, 2011; Available online: http://nora.nerc.ac.uk/id/eprint/15071/1/N015071CR.pdf (accessed on 6 February 2020).
  62. Borowiak, K.; Zbierska, J.; Ławniczak, A.E.; Tomaszewska, M. Charakterystyka reakcji tytoniu szlachetnego na ozon troposferyczny na terenie miasta Poznania i okolic. (Characteristics of the reaction of noble tobacco to tropospheric ozone in the city of Poznań and the surrounding area). Probl. Ekol. Kraj. 2008, 22, 115–126. (In Polish) [Google Scholar]
  63. Skowera, B.; Kopcińska, J.; Kopeć, B. Changes in thermal and precipitationconditions in Poland in 1971–2010. Ann. Wars. Univ. Life Sci. SGGW Land Reclam. 2014, 46, 153–162. [Google Scholar] [CrossRef]
  64. Regulation of the Minister of Environment of 24 August 2012 on the Levels of Certain Substances in the Air. In Journal of Laws; 18 September 2012; Item 1031. Available online: http://isap.sejm.gov.pl/isap.nsf/DocDetails.xsp?id=WDU20120001031 (accessed on 4 November 2019).
  65. Roemer, M.; Boersen, G.; Builtjes, P.; Esser, P. The budget of ozone and precursors over Europe calculated with the LOTOS model. In Trends of Tropospheric Ozone over Europe; Rijksuniversiteit Utrecht: Amsterdam, The Netherlands, 1996; pp. 93–116. [Google Scholar]
  66. Collins, W.J.; Derwent, R.G.; Garnier, B.; Johnson, C.E.; Sanderson, M.G.; Stevenson, D.S. Effect of stratosphere—Troposphere exchange on the future tropospheric ozone trend. J. Geophys. Res. 2003, 108, 8528. [Google Scholar] [CrossRef] [Green Version]
  67. Parrish, D.D.; Law, K.S.; Staehelin, J.; Derwent, R.; Cooper, O.R.; Tanimoto, H.; Volz-Thomas, A.; Gilge, S.; Scheel, H.E.; Steinbacher, M.; et al. Long–term changes in lower tropospheric baseline ozone concentrations at northern mid-latitudes. Atmos. Chem. Phys. 2012, 12, 11485–11504. [Google Scholar] [CrossRef] [Green Version]
  68. Ooka, R.; Khiemb, M.; Hayamic, H.; Hiroshi Yoshikado, H.; Huange, H.; Kawamotoa, Y. Influence of meteorological conditions on summer ozone levels in the central Kanto area of Japan. Procedia Environ. Sci. 2011, 4, 138–150. [Google Scholar] [CrossRef] [Green Version]
  69. Gorai, A.K.; Tchounwou, P.B.; Mitra, G. Spatial Variation of Ground Level Ozone Concentrations and its Health Impacts in an Urban Area in India. Aerosol Air Qual. Res. 2017, 17, 951–964. [Google Scholar] [CrossRef] [Green Version]
  70. Oyola, M.I.; Schneider, A.; Campbell, J.; Everette, J. Meteorological Influences on Tropospheric Ozone over Suburban Washington, DC. Aerosol Air Qual. Res. 2018, 18, 1168–1182. [Google Scholar] [CrossRef] [Green Version]
  71. De Nevers, N. Air Pollution Control Engineering, 2nd ed.; McGraw-Hill Science/Engineering/Math: New York, NY, USA, 1999; ISBN 13: 978-0070393677. [Google Scholar]
  72. Padusainee, D.; Sapkota, B.; Shrestha, L.M.; Kaga, A.; Kondo, A.; Inoue, Y. Ground level ozon concentrations and its associationwith NOx and meteorological parameters in Kathmandu valley, Nepal. Atmos. Environ. 2006, 40, 8081. [Google Scholar] [CrossRef]
  73. Khoder, M. Diurnal, seasonal and weekdays-weekends variations of ground level ozone concentrations in an urban area in greater Cairo. Environ. Monit. Assess. 2009, 149, 349–362. [Google Scholar] [CrossRef] [PubMed]
  74. Langner, J.; Engardt, M.; Baklanov, A.; Christensen, J.; Gauss, M.; Geels, C.; Hedegaard, G.; Nuterman, R.; Simpson, D.; Soares, J.; et al. A multi-model study of impacts of climate change on surface ozone in Europe. Atmos. Chem. Phys. 2012, 12, 10423–10440. [Google Scholar] [CrossRef] [Green Version]
  75. Cooper, O.R.; Parrish, D.D.; Ziemke, J.; Balashov, N.V.; Cupeiro, M.; Galbally, I.E.; Gilge, S.; Horowitz, L.; Jensen, N.R.; Lamarque, J.F.; et al. Global distribution and trends of tropospheric ozone: An observation-based review. Elem. Sci. Anth. 2014, 2, 000029. [Google Scholar] [CrossRef]
  76. Guerova, G.; Bey, I.; Attie, J.L.; Martin, R.V.; Cui, J.; Sprenger, M. Impact of transatlantic transport episodes on summertime ozone in Europe. Atmos. Chem. Phys. 2006, 6, 2057–2072. [Google Scholar] [CrossRef] [Green Version]
  77. Miles, G.M.; Siddans, R.; Kerridge, B.J.; Latter, B.G.; Richards, N.A.D. Tropospheric ozone and ozone profiles retrieved from GOME-2 and their validation. Atmos. Meas. Tech. 2015, 8, 385–398. [Google Scholar] [CrossRef] [Green Version]
  78. Atkinson-Palombo, C.M.; Miller, J.A.; Balling, R. Quantifying the ozone “weekend effect” at various locations in Phoenix, Arizona. Atmosph. Environ. 2006, 40, 7644–7658. [Google Scholar] [CrossRef]
  79. García-Reynoso, A.; Jazcilevich, A.; Ruiz-Suárez, L.G.; Torres-Jardón, R.; Suárez Lastra, M.; Reséndiz Juárez, N.A. Ozone weekend effect analysis in México City. Atmósfera 2009, 22, 281–297. [Google Scholar]
  80. Nidzgorska-Lencewicz, J. Time distribution of tropospheric ozone concentrations in Szczecin in the years 2005–2007. Acta Sci. Pol. Form. Circ. 2011, 10, 47–55. [Google Scholar]
  81. Szept, R.; Matyas, L.; Keresztes, R.; Ghimpus, M. Tropospheric Ozone Concentrations—Seasonal and Daily Analysis and its Association with NO and NO2 as a Function of NOx in Ciuc Depression—Romania. Rev. Chim. 2016, 67, 205–213. [Google Scholar]
  82. Xiaoshan, Z.; Yujing, M.; Wenzhi, S.; Yahui, Z. Seasonal variations of isoprene emissions from deciduous trees. Atmos. Environ. 2000, 34, 3027–3032. [Google Scholar] [CrossRef]
Figure 1. Location of the air monitoring station.
Sustainability 12 07633 g001
Figure 2. Mean values of tropospheric ozone concentrations in the context of plant protection, expressed as AOT40*, at selected monitoring stations in the Lublin region (2015–2017). * AOT40 (accumulated ozone exposure over a threshold of 40 ppb (=80 μg·m−3). Source: [59].
Sustainability 12 07633 g002
Figure 3. Frequency distribution of one-hour average tropospheric ozone concentrations according to the adopted criterion of 12 class intervals (2015–2017).
Sustainability 12 07633 g003aSustainability 12 07633 g003b
Figure 4. Box plot of one-hour average tropospheric ozone concentrations grouped by day of the week and season (2015–2017).
Sustainability 12 07633 g004aSustainability 12 07633 g004b
Figure 5. Average daily course of one-hour average tropospheric ozone concentrations in each season (2015–2017).
Sustainability 12 07633 g005aSustainability 12 07633 g005b
Table 1. Meteorological conditions in the Lublin Voivodeship in 2015–2017.
ParameterSpringSummerAutumn*** Winter
2015* Temperature [°C]8.5very warm/warm 19.4extremely warm9.0extremely warm0.7very warm
** Precipitation
[mm]
160–200110–140%
wet/very wet
80–10030%
extremely dry
160–200120–140%
wet/very wet
80–120100–160%
normal/extremely wet
2016Temperature
[°C]
9.2very warm18.4anomalously warm8.3very warm1.3anomalously warm
Precipitation
[mm]
140–180100–130%
normal/wet
200–25090–100%
normal
180–200110–130%
wet
100–120110–120%
wet
2017Temperature
[°C]
8.9very warm18.5anomalously warm9.1extremely warm–1.9thermally normal
Precipitation
[mm]
120–140100–120%
normal/wet
150–20070–90%
very dry/dry
200–250140–180%
very wet/
extremely wet
90–10090–120%
normal/wet
* Temperature classification of seasons in separate regions according to Miętus et al. [38]. This classification is based on a series of empirical quantiles of average daily air temperature in a given season for the period of 1961–2000. The full range of variability of average air temperature in a given season in separate regions is divided into 11 quantile intervals as follows: >95% extremely warm (class 1), 90.01–95% anomalously warm (class 2), 80.01–90% very warm (class 3), 70.01–80% warm (class 4), 60.01–70% slightly warm (5 class) 40.1–60% normal (6 class). Higher temperature classes (7–11) did not occur during the research period. Climate Monitoring Bulletin ... [39,40,41,42,43,44,45,46,47,48,49,50]. ** Anomalous precipitation totals in the seasons 2015–2017 with respect to the 1971–2000 normal [40,41,42,43,44,45,46,47,48,49,50,51] and the classification by Kaczorowska [51]: <50% extremely dry, 50–74% very dry, 75–89% dry, 90–110% normal, 111–125% wet, 126–150% very wet, >150% extremely wet. Climate Monitoring Bulletin … [39,40,41,42,43,44,45,46,47,48,49,50]. *** Winter (December–February): 2014/2015, 2015/2016, 2016/2017. Spring (March–May), Summer (June–August) and Autumn September–November: 2015, 2016, 2017.
Table 2. Frequency (%) of circulation types over central-eastern Poland (a: 1981–2010; b: 2015–2017).
Circulation TypesWinterSpringSummerAutumnYear
ababababab
Directional cyclonic typesNc0.30.30.40.51.00.20.50.22.31.1
NEc0.20.00.40.40.50.00.40.11.50.5
Ec0.30.10.50.40.50.10.20.31.50.8
SEc0.40.30.90.60.60.40.50.22.51.5
Sc0.71.01.40.70.80.31.20.24.12.2
SWc1.71.01.21.60.90.61.60.75.43.9
Wc2.22.51.10.91.41.51.91.96.76.8
NWc0.91.20.91.41.31.10.91.34.04.9
Directional transitional typesN0.70.40.71.50.91.70.70.43.03.9
NE0.50.20.80.51.00.00.50.72.81.4
E0.50.50.90.60.90.60.60.82.92.6
SE0.70.51.30.20.50.50.90.63.31.9
S0.60.51.30.80.70.71.11.13.73.2
SW1.10.80.80.50.91.01.31.34.13.6
W2.22.50.91.81.21.51.72.16.07.8
NW1.31.50.81.71.51.91.21.34.86.4
Directional anticyclonic typesNa0.60.30.50.80.91.20.60.52.52.7
NEa0.40.51.11.61.21.10.50.53.23.6
Ea0.60.31.61.81.20.50.60.84.03.5
SEa0.91.11.50.50.70.41.11.84.13.8
Sa0.80.60.80.00.51.00.90.93.02.6
SWa0.60.50.30.40.30.30.70.42.01.6
Wa1.52.60.60.50.40.91.00.93.44.9
NWa1.41.60.41.20.80.70.80.63.44.1
Directional non-directional typesC1.30.61.71.41.00.51.22.15.24.7
A2.13.41.72.82.45.32.12.58.314.0
x0.20.10.50.21.01.10.40.82.22.2
Designations for circulation types: Nc, NEc, Ec, SEc, Sc, SWc, Wc, NWc—directional cyclonic types (distinct advection of air during cyclonic circulation); N₀, NE₀, E₀, SE₀, S₀, SW₀, W₀, NW₀—directional transitional types (distinct advection of air without visible participation of a cyclone or anticyclone); Na, NEa, Ea, SEa, Sa, SWa, Wa, NWa—directional anticyclonic types (distinct advection of air during anticyclonic circulation); C—cyclonic type (cyclone, low-pressure furrow or low-pressure trough in the Lublin region); A—anticyclonic type (anticyclone or a wedge or ridge of high pressure in the Lublin region); x—unclassified type (low total shear vorticity values and weak geostrophic wind velocity over the Lublin region). Source: own work based on Bartoszek [52,53].
Table 3. One-hour average tropospheric ozone concentrations in meteorological seasons (2015–2017).
StationSpringSummerAutumnWinter
JarczewAverage (µg·m−3)57.758.336.037.6
Max. (µg·m−3)126.0 (April)160.9 (August)162.8 (Sept.)103.7 (Feb.)
Min. (µg·m−3)0.0 (May)0.7 (July)0.0 (Sept., Oct.)0.0 (Jan.)
V * (%)39.348.256.347.8
WilczopoleAverage (µg·m−3)57.462.736.336,4
Max. (µg·m−3) 125.5 (May)178.4 (August)146.6 (Sept.)96.0 (Feb.)
Min. (µg·m−3) 2.7 (March)1.7 (August)1.5(Sept.)1.4 (Jan.)
V (%)37.646.153.946.6
FloriankaAverage (µg·m−3)64.167.541.545.1
Max. (µg·m−3) 137.4 (April)158.2 (August)152.6 (Sept.)127.2 (Feb.)
Min. (µg·m−3) 1.5 (April)0.9 (August)0.4 (Oct.)2.1 (Feb.)
V (%)42.848.657.345.1
V *—coefficient of variation (%), Source: [59].
Table 4. Kruskal–Wallis test results for multiple comparisons.
SeasonIndependent Variable (Grouping): Season, Kruskal–Wallis H test, p < 0.05
SpringSummerAutumn
2015
H (3.n = 1072) = 521.2
Summer3.22 *
Autumn14.88 *18.48 *
Winter13.32 *16.86 *1.53
2016
H (3. n = 1072) = 455.74
Summer1.29
Autumn14.52 *15.82 *
Winter14.32 *15.59 *0.14
2017
H (3. n = 1094) = 388.89
Summer0.43
Autumn13.98 *13.56 *
Winter12.36 *11.94 *1.57
Legend: H—#Kruskal–Wallis test statistic, p−least significance level; *statistically significant differences, p < 0.05.
Table 5. Frequency of atmospheric circulation types and the corresponding ranges of tropospheric ozone concentrations in the summer (June–August) of the years 2015–2017.
Circulation TypeFrequency of Circulation TypeJarczewWilczopoleFlorianka
%24 h average O3 concentration (min–max) [µg·m3]
Cyclonic18.558.7 (36.6–84.8)65.0 (40.6–87.2)73.2 (47.2–108.3)
Anticyclonic45.357.1 (27.8–104.5)60.8 (38.7–98.5)65.5 (35.8–114.2)
No visible effect of cyclone or anticyclone31.958.8 (36.6–104.1)62.5 (26.3–101.8)66.1 (18.7–107.2)
Own work based on the calendar of atmospheric circulation types for the Lublin region for the summer months of 2015–2017 [52].

