Abstract
Examining the influence of thermal conditions in the engine cylinder at the start of fuel injection on engine combustion characteristics is critically important. This may help to understand physical and chemical processes occurring in engine cycles and this is relevant to both fossil fuels and alternative fuels like biodiesels. In this study, six different biodiesel–diesel blends (B0, B10, B20, B40, B60 and B100 representing 0, 10, 20, 40, 60 and 100% by volume of biodiesel in the diesel–biodiesel mixtures, respectively) have been successfully tested in a cooperative fuel research (CFR) engine operating under a wide range of thermal conditions at the start of fuel injection. This is a standard cetane testing CFR-F5 engine, a special tool for fuel research. In this study, it was further retrofitted to investigate combustion characteristics along with standard cetane measurements for those biodiesel blends. The novel biodiesel has been produced from residues taken from a palm cooking oil manufacturing process. It is found that the cetane number of B100 is almost 30% higher than that of B0 and this could be attributed to the oxygen content in the biofuel. Under similar thermal conditions at the start of injection, it is observed that the influence of engine load on premixed combustion is minimal. This could be attributable to the well-controlled intake air temperature in this special engine and therefore the evaporation and mixing rate prior to the start of combustion is similar under different loading conditions. Owing to higher cetane number (CN), B100 is more reactive and auto-ignites up to 3 degrees of crank angle (DCA) earlier compared to B0. It is generally observed in this study that B10 shows a higher maximum value of in-cylinder pressure compared to that of B0 and B20. This could be evidence for lubricant enhancement when operating the engine with low-blending ratio mixtures like B10 in this case.
1. Introduction
Biodiesels are environmentally friendly alternative fuels and have important properties close to that of fossil diesel. Biodiesels are manufactured from different feedstock including vegetable oils, animal fats and algae [1]. The transesterification reaction between triglycerides available in the feedstock and methanol is the standard method to produce biodiesels (a mixture of different fatty acid methyl esters—FAMEs) and glycerols [1,2]. A number of studies on utilizations of biodiesels and their blends in compression ignition engines can be found in current literature [2,3,4,5,6,7,8]. Excellent reviews on the topic (both fundamental studies and biodiesels’ utilizations) are provided in [9,10,11,12]. Key findings are: (i) Biodiesels have lower calorific values compared to fossil counterparts and this leads to a penalty in fuel economy when operating engines with biodiesels and their blends. The increase in fuel consumption when using biodiesels is approximately proportional to the loss in their calorific value [1,13,14]; (ii) compared to diesel, blends of biodiesel–diesel normally show shorter ignition delay times and a reduced heat release rate (HRR) as well as a slightly higher efficiency [10]. The shorter ignition delay times are due to the higher cetane number (CN) of biodiesels; (iii) significant reductions in soot emission compositions in the engine exhaust, while there are contradictory statements regarding particle size distributions and NOx emissions [9]. It is suggested by Damanik et al. in [11] that the trends in engine performance and emission levels when operating with biodiesel blends should be interpreted with caution as generalization of the trends is not possible using the results currently available in the literature [11]. Apart from controversies in some of the reported results as mentioned above, there are few key issues with respect to existing research on biodiesels: (i) the fuels are generally selected at random depending on their availability and without any reference to chemical and physical property variations amongst biodiesels derived from different feedstock; (ii) very few studies report on the basic auto-ignitability of biodiesels, a feature that may well be important considering how the influence of different thermal conditions in the cylinder at the start of injection (SOI) on the in-cylinder pressure development, heat release rate and ignition delay provides a better understanding of biodiesel auto-ignitability; and (iii) the definition of engine load condition is not consistent amongst the literature, a number of authors used similar fuel volume flow rates (mL/min) while some others used a similar amount of input energy (MJ/min) when testing auto-ignition engines with biodiesel blends and diesel. Those confusions may make the comparison of engine performance when operating with diesel and biodiesel blends irrelevant.
The engine cycle is very complex as it includes a number of physical processes (e.g., atomization, evaporation and mixing) as well as chemical processes (e.g., auto-ignition and combustion). Therefore, studies on these processes are normally conducted in many different laboratory tools such as open burners [15,16], shock tubes [17], single cylinder engines [18,19,20,21,22] and multi-cylinder engines [14,23]. Fundamental tools like pilot and co-flow burners [24,25] can be used to deeply investigate an isolated process like primary atomization [25,26], secondary atomization [27] or auto-ignition [28]. Single-cylinder engines add more complex processes to that occurring in fundamental tools (e.g., laboratory burners, shock tubes and rapid compression machine), and single engines like the CFR engine used in this work have been shown as a useful equipment to closely describe the engine cycle. Single-cylinder engines normally have a capability of varying compression ratio (CR) that is impossible in practical multi-cylinder engines [20,29]. In an engine cycle, investigating thermal conditions at SOI is critically important as the conditions strongly affect the ignition delay, fuel–air premixed fraction, in-cylinder pressure development and, as such, engine power and efficiency. Studies conducted in burners, shock tubes, single-cylinder engines and multi-cylinder engines need to address this.
Cooperative fuel research (CFR) engines have been developed for fuel testing. The special tools are single-cylinder and variable CR engines. The engines were initially used for examining fuels but are now used worldwide for exploring the combustion characteristics of research fuels under one of the five methods: the motor, research, aviation, supercharge and cetane methods [30]. Model F-1/F-2 Combination CFR engine is used to determine the fuel octane number of gasoline-like fuels. This testing method is conducted under ASTM D2699 and D2700 standards. Model CFR F-5 engine (the one used in this study) is a complete system for measuring the CN of diesel-like fuels, conforming to the ASTM D613 standard. This method is accepted worldwide as the standard for determining the auto-ignition quality of diesel fuels. Further details of the CFR engine used in this study will be shown later in Section 2.1. Using these special engines to investigate combustion characteristics of biodiesel and its blends is relevant. The capability of varying the compression ratio makes them special for fuel testing.
Using a variable CR single-cylinder engine, blends of castor oil-based biodiesel and fossil diesel (B0, B10, B20, B30, B40, B50 and B100) have been tested in [31] to investigate the influence of CR and blending ratio on mean gas temperature, cylinder pressure variation, net heat release and mass fraction burned. The authors have observed that an increase in CR leads to an increase in mean gas temperature and a decrease in net heat release rate. Another study done by Dash et al. [32] in a variable CR single-cylinder engine operating with different Nahar biodiesel blends (B0, B5, B10, B20, B30, B40 and B50) showed that combustion duration reduces when increasing the blending ratio up to B40, then slightly increases for B50 and significantly for B100. It was also observed that the blending ratio has significant effects on the maximum rate of pressure rise (MRPR), heat release rate and ignition delay. The influence of thermal conditions at SOI is not addressed in these studies [31,32].
The performance of a four-cylinder engine operating with waste oil, rapeseed oil and corn oil biodiesels and diesel has been investigated by Tesfa et al. [33] and showed that the influence of fuel types on heat release rate and specific fuel consumption is not significant. Pham et al. have tested a number of biodiesels having different physic-chemical profiles in a single-cylinder engine [7,21], a multiple-cylinder engine [5,34] and burners [24,25], and the authors claimed that the molecular profiles of biodiesels, determined by their feedstock, have a significant impact on atomization and combustion characteristics.
Although a number of modern techniques including laser diagnosis can be utilized to study engine combustion as noted briefly above, in-cylinder pressure transducers have been shown as one of the most convenient and efficient tools to investigate the engine cycle including combustion characteristics. Certainly, lasers are a very powerful technique that can be used to deeply diagnose the physical chemical processes such as quantifying auto-ignition zone [35], measuring combustion radicals (OH-, and formaldehyde), flame structure and emission. The measurements are impossible using pressure transducers. Pressure transducers, however, are much cheaper and much easier to setup and operate. Pressure signals have been used to investigate net heat release, thermal efficiency, air mass and fuel flow rates, in-cylinder trapped mass, exhaust gas recirculation, emission and noise control [36,37,38,39,40].
It was reported earlier by Vargas et al. [9] that the number of studies on biodiesels have been increased rapidly in the last decade. Extensive investigations of in-cylinder pressure development under a wide range of cylinder thermal conditions at SOI, according to the authors’ knowledge, are scarce in the literature.
In this study, a CFR F5 engine, a standardized machine known as a cetane testing engine, was firstly employed with ASTM-D613 [41] to measure CN for different biodiesel–diesel blends (B0, B10, B20, B40, B60 and B100). The biodiesel used here is produced from the residue of a cooking oil manufacturing process (not used cooking oil). Then, the system was further equipped with a fast-response in-cylinder pressure transducer and an encoder to measure the in-cylinder pressure of the engine. This extension aims to provide an extensive examination of the in-cylinder pressure development under a wide range of thermal conditions in the cylinder at the timing of fuel injection. The injection timing and CR are varied in this study so that the thermal conditions at SOI are varied in a wide range.
2. Experiment Setup and Testing Conditions
2.1. Experiment Description
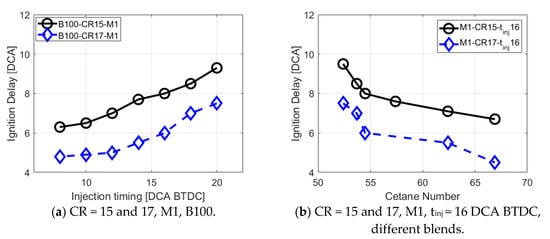
The experiment system used in this study is schematically described in Figure 1a (for the cooperative fuel research—CFR engine test bed) and Figure 1b (for the enlarged combustion chamber of the CFR engine). This is a CFR-F5 engine designed for cetane testing. As mentioned earlier, CFR engines are capable of varying CR and this makes them special, especially for testing combustion characteristics under different thermal conditions like the one conducted in this study. Under the standardized operating condition of the engine to measure liquid fuel CN [41], the CFR engine is operated with a speed of 900 rpm, a CR of 13 and a well-controlled air intake temperature of 65 °C for all testing conditions. This temperature is quite high compared to that in conventional engines. The fuel is supplied into the cylinder through an injector (#8) under an injection timing of 13 degrees of crank angle (DCA). Ignition delay, used for computing CN, is measured using a combustion pickup sensor (#7) along with a delay sensor (#9).
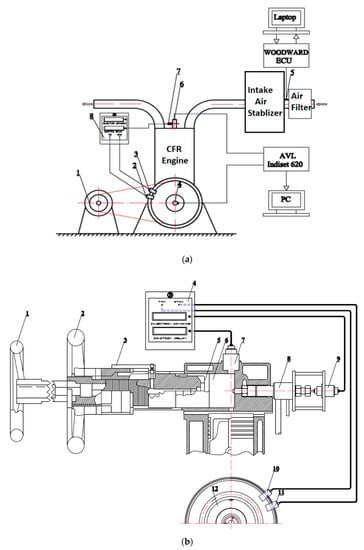
Figure 1.
Experiment setup. (a) Cooperative fuel research (CFR) engine test-bed: 1. electric dyno; 2. top dead center (TDC) pickup sensor; 3. 13 degrees of crank angle (DCA) pickup sensor; 4. encoder; 5. air flow sensor; 6.pressure sensor; 7. combustion pickup sensor; (b) the CFR engine’s combustion chamber: 1. locking wheel; 2. handwheel; 3. micrometer; 4. ignition delay meter; 5. piston; 6. combustion chamber; 7. combustion pickup sensor; 8. injector; 9. injector needle lift sensor; 10. TDC pickup sensor; 11. 13 DCA pickup sensor; 12. flywheel.
Different from conventional engines, at a specific CR, the combustion chamber of the CFR engine shown in Figure 1 is a constant volume chamber (#6 shown in Figure 1b) located above the piston and separately from the chamber formed by the cylinder, piston and cylinder head (chamber 2). The CR varies by changing the volume of the chamber and this is done by rotating the handwheel (#2 shown in Figure 1b). The position of the piston is determined using the micrometer (#3 shown in Figure 1b). The fuel injection timing is exactly measured using an injector needle lift sensor (#9 shown in Figure 1b). The start of combustion timing is measured using a combustion pickup sensor (#7 shown in Figure 1b). The combustion chamber is connected to chamber 2 by a small hole located in the piston’s centerline as shown in Figure 1a. Due to these special characteristics, combustion in this engine mainly occurs in the constant volume chamber, chamber 2 just works like a pumping system to create high-pressure conditions for the combustion chamber. This special equipment is good for studies on combustion characteristics like in-cylinder pressure development, heat release rate and auto-ignitability. As the combustion chamber of the CFR engine is a constant volume chamber and has a high air intake temperature as mentioned, this tool may not be suitable for studies related to whole engine cycles in which emission concentrations, engine power, fuel economy and other engine performance characteristics are examined.
In this study, the engine is further extended to include a fast-response in-cylinder pressure transducer (#6, AVL QC33C), an encoder (#4) and a data acquisition and control system (AVL Indiset 620). The extension also includes a gas flow sensor to measure the amount of intake air and an equivalent air–fuel (or lambda) sensor equipped with a control unit, ECM-0565-128-0702-C manufactured by WOODWARD as shown schematically in Figure 1. CFR engine specifications are presented in Table 1.

Table 1.
CFR-F5 engine operating conditions under cetane testing modes [7].
2.2. Fuels Tested
The biodiesel tested here is produced from the residue of a palm cooking oil production process and this was reported in our previous study [42]. It was found that the residue left from the cooking oil production process (not used cooking oil) is still rich in fatty acid esters. Then, biodiesel used in this work was successfully derived from the special feedstock using triple cycles of heterogeneous catalyzed transesterification [7]. Fuel blends used here include B0 (pure diesel), B10, B20, B40, B60 and B100 (pure biodiesel) corresponding to 0, 10, 20, 40, 60 and 100 vol% of biodiesel in the biodiesel–diesel blends, respectively. Important properties of diesel and biodiesel fuels are summarized in Table 2. It is noted here that important properties of these blends have been carefully measured and reported elsewhere in our previous study [42]. Important physicochemical properties of all blends tested here have been carefully measured using relevant testing methods, as shown in Table 2.
Table 2.
Important properties of fuels tested [7].
It is noted that the molecular structure of one biodiesel solely depends on its mother feedstock. Empirical correlations are developed to correlate these relevant properties to the fuel structure using parameters such as iodine values (IV) and saponification number (SN). The IV is the number of grams of iodine consumed per 100 g of fatty acid. It is being used as a measure of unsaturation levels in fatty acid (a higher IV indicates a higher degree of unsaturation). The SN is the mass of potassium hydroxide (KOH) required to saponify 1 g of FAME; therefore, SN reflects the carbon chain length (a higher SN implies a shorter carbon chain length). IV and SN of the palm oil-based biodiesel were carefully measured using standards EN 14,111 and ASTM D664-04, respectively. As shown in Table 2, the biodiesel (B100) tested in this study has a medium IV (IV = 48) and a high saponification number (SN = 148) and this means that the fuel has a long carbon chain length and high unsaturation degree. The C/H/O values reported in Table 2 for the pure biodiesel (B100) and pure diesel (B0) are carefully measured using high-performance liquid chromatography (HPLC). C/H/O values of blends are calculated using the blending ratio and C/H/O values of B100 and B0.
One biodiesel may have constituents with 8 to 25 carbon numbers and up to 5 or even more numbers of double bonds [5] but the molecule always has two oxygen atoms, and this key feature makes the fuels different from the fossil diesel counterpart. The fuel oxygen content (FOC) in biodiesels may enhance the fuel reactivity [43]. This is critically important because of the local rich fuel–air mixture (lack of oxygen) in the auto-ignition zone [35,43] of compression ignition engines. The cetane number of the fuels shown in Table 2 is tested using the CFR engine operating with the standardized approach [41]. It is clearly shown from Table 2 that CN increases from B0 to B100 and this may be attributed to the oxygen content in the blends [43]. The cetane number of pure biodiesel is almost 30% higher than that of fossil diesel. Oxygen content in biodiesel blends may make the fuel–air mixture leaner in the auto-ignition zone and this in turn enhances the fuel reactivity.
2.3. Testing Points
The original facilities in conjunction with the additional items described above (Section 2.1 and Section 2.2) extend the capability of the test bed to measure in-cylinder pressure signals under a wide range of air–fuel equivalent ratios (λ), compression ratios and injection timings. In a nutshell, tests conducted in this study include (i) standard CN tests for all biodiesel blends (B0, B10, B20, B40, B40 and B100) and (ii) tests of those blends under different thermal conditions in the cylinder at SOI. Under these injection timing conditions, the injection temperature, Ti, varies between 775 and 865 K under CR = 15. Under CR = 17, Ti ranges from 790 to 890 K. These values of Ti are calculated using in-cylinder pressure at SOI, pi, which is the output from the in-cylinder pressure signals experimentally measured. The temperature conditions cover a wide range of thermal conditions at SOI in CI engines.
The CN tests are conducted (ASTM D613) under an engine speed of 900 rpm; an injection timing of 13 DCA before top dead center (BTDC); an amount of fuel injection of 13 ± 0.02 mL/min; and a well-controlled intake air temperature, Ti, of 65 °C. These conditions and others related to CN testing are reported in Table 1.
The engine conditions used for part (ii) mentioned above can be summarized here:
- (1)
- Engine speed: 900 rpm, similar to the standardized measurement for CN;
- (2)
- Intake air temperature: well controlled to remain constant at 65 °C, similar to the standardized measurement of CN;
- (3)
- Two compression ratios (CR): 15 and 17; different from the standardized measurement for CN;
- (4)
- Seven injection timings, tinj: 8, 10, 12, 14, 16, 18 and 20 DCA before TDC; different from the standardized measurement for CN;
- (5)
- Four fuel flow rates: 15.5, 13.0, 11.30 and 10.0 mL/min. These flow rate conditions are described in this work as M1, M2, M3 and M4, respectively. The M1 to M4 conditions are applied to all biodiesel blends. In other words, similar fuel flow rates are supplied to the engine when operating with those blends. These 4 fuel flow rate conditions (M1 to M4, respectively) were investigated with the aim to examine the influence of engine load on engine combustion characteristics. M1 is close to the full load condition while M2, M3 and M4 are close to three-quarters, half and a quarter load conditions, respectively. Mode M2 has a similar fuel flow rate to the CN testing mode;
- (6)
- Operations of the engine under a constant input energy amount (J/min) conditions are also conducted. When operating an engine with different fuels having different heating values, the engine loading conditions (e.g., engine torque) are different from one fuel to the other. When comparing engine performance under the same conditions of engine load and speed, a constant input energy approach should be adopted, and this is one part of this study. Here, the investigation under constant input energy conditions limits only to CR = 15. Under this mode, a constant input energy amount of 463.6 J/min is applied for all fuel blends tested. This amount is corresponding to the energy of B0 at mode M1 (15.5 mL/min). This testing mode will be denoted as Qconst in this study.
3. Results and Discussion
3.1. Influence of Fuel Flow Rate Conditions
As mentioned, four different fuel flow rates have been tested in this study. Modes M1, M2, M3 and M4 note for 15.5, 13.0, 11.30 and 10.0 mL/min of fuel flow rates, respectively. These conditions may be close to full, three-quarters, half and a quarter engine load conditions. In-cylinder pressure signals outputted in this study are averaged from 50 consecutive engine cycles. Then, those averaged signals are used to compute the heat release rate (HRR), maximum in-cylinder pressure (pmax), rate of in-cylinder pressure rise (RPR) and MRPR. In this section, the influence of fuel flow rates on in-cylinder pressure and HRR will be reported. Discussions related to pmax, RPR and MRPR will be shown later on in the following sections.
Figure 2 shows an example of the in-cylinder pressure and HRR of B100 under the case of Qconst and tinj = 16 DCA. Regarding the influence of fuel flow rates on in-cylinder pressure development and HRR, the trend in the in-cylinder pressure development and HRR is similar for all blends under a certain injection timing. Therefore, only an example of the in-cylinder pressure and HRR of B100 under tinj = 16 DCA is reported in Figure 2. The full database may be provided upon request. It is quite clear from this figure that the fuel flow rates mainly affect the second combustion period named diffusion combustion. The influence of fuel flow rate on the first period (characterized by SOC and premixed combustion fraction) is minimal. Details about premixed and diffusion combustion will be discussed in the following paragraphs.
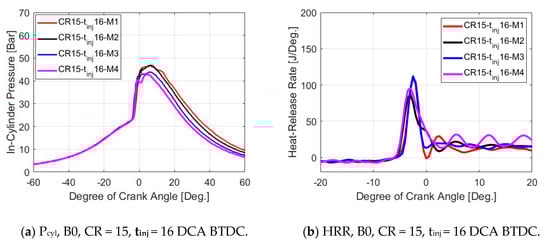
Figure 2.
Example of Pcyl (a) and heat release rate (HRR) (b) versus DCA (B0, at different modes M1 to M4, different fuel flow rates, tinj = 16, CR15).
As can be seen from Figure 2a, the in-cylinder pressure signals obtained when operating the engine under different fuel flow rates (M1 to M4) are almost identical in the initial duration (before TDC in these cases). Then, a higher fuel flow rate leads to a higher in-cylinder pressure developed. Further combustion characteristics are detailed in Figure 2b, where the HRRs obtained under these fuel loading conditions are shown. Combustion of a premixed mixture is much faster with respect to diffusion combustion [36]. The premixed and diffusion combustion fractions are distinguished quite clearly through the HRR signals shown in Figure 2b. During the premixed combustion period, the HRR first rapidly rises, gets to its peak and significantly decreases (before TDC as shown in Figure 2b). Then, diffusion combustion takes place where the HRR is quite low with respect to that during premixed combustion.
It is quite clear from Figure 2b that the premixed combustions are identical amongst the fuel flow rates tested here while a higher fuel flow rate leads to a higher HRR during diffusion combustion. Qualitatively, loading conditions do not influence the SOC (where the HRR signals suddenly rise and become positive as shown in this figure. Since the evaporation and pre-mixing conditions including thermal conditions and pressure in the period from SOI to SOC are similar for all loading modes M1 to M4, the amount of fuel and air that is pre-mixed could be the same. This may be attributable to the similarity in ignition delay times observed in Figure 2b for all modes.
As mentioned earlier that the trends in in-cylinder pressure development and HRR, especially during premixed combustion, are identical amongst the fuel flow rates tested here, only mode M1 (closing to full load conditions) will be further investigated in the following sections. However, the full database may be made available upon request.
3.2. Influence of Thermal Conditions at SOI
Figure 3 shows the in-cylinder pressure signals for B0 and B100 under the injection mode M1 (15.5 mL/min used for all fuels), but under different injection timings (tinj from 8 to 20 DCA BTDC). Figure 3a,b are for B0 at CR = 15 and B0 at CR = 17, respectively. Similarly, Figure 3c,d are for B100. Thermal conditions here mean the temperature and pressure at SOI depend on tinj in the compression stroke. These figures shown here are examples to evaluate the influence of thermal conditions at SOI on in-cylinder pressure signals. In-cylinder pressure signals for other blends are not shown here as they show identical trends to these figures. It is simply noted that the in-cylinder pressure at CR = 15 (left figures, Figure 3a,c) is lower than that at CR = 17 (right figures, Figure 3b,d). Certainly, under higher CR, the engine creates higher in-cylinder temperature and pressure and this enhances the fuel evaporation, mixing and combustion. Engines with higher CR, therefore, normally show their higher thermal efficiency.
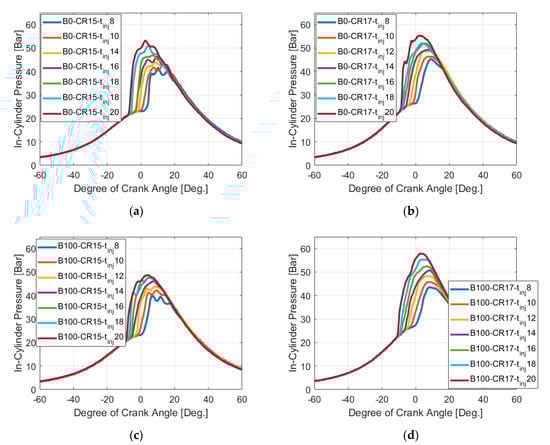
Figure 3.
Influence of in-cylinder thermal conditions at SOI on the development of in-cylinder pressure. (a) B0, M1, compression ratio (CR) = 15; (b) B0, M1, CR = 17; (c) B100, M1, CR = 15; (d) B100, M1, CR = 17.
It is noted that the difference between pcylmax shown in Figure 3a (B0 under CR = 15) and Figure 3b (B0 under CR = 17) is not that significant compared to the one observed in Figure 3c (B100 under CR = 15) and Figure 3d (B100 under CR = 17). This may be due to the improvement in the atomization, evaporation and combustion of B100 under high CR and long injection advanced timing conditions. By carefully observing, when tinj increases over 14 DCA BTDC, pcylmax developed under CR = 17 starts to rise more significantly compared to that under CR = 15. It is well known that biodiesel atomizes and evaporates poorer than fossil diesel. High-temperature conditions created under a high CR and injecting far from TDC (e.g., tinj > 14 DCA in this case) could help biodiesel to enhance its atomization and evaporation significantly. The enhancement along with oxygen content in biodiesel may improve its combustion quality and this in turn causes the significant increase in pcylmax. This phenomenon may be explained by carefully observing the combustion duration, position of ignition, position of peak pressure and combustion phasing, however, combustion is a very complex phenomenon and this is a subject for future study.
Along with HHV, viscosity, surface tension and cetane number are important parameters (even more important than HHV) impacting the fuel combustion characteristics and therefore in-cylinder pressure development. It is observed in this study that under some testing conditions like at CR = 17 and high advanced injection timing, B100 produces a higher maximum in-cylinder pressure with respect to that of B0. This might be attributed to the improvement in the atomization quality of B100 under these conditions along with the oxygen content in the fuel but this needs further investigations. Compared to conventional diesel, biodiesel has higher viscosity and surface tension and therefore poorer atomization quality [44]. One of the key characteristics of biodiesels is that the fuels contain oxygen in their molecules and this feature makes them special compared to fossil diesel. In compression ignition engines, the fuel oxygen enhances the combustion quality in the fuel spray’s reaction zone, where the fuel–air mixture is rich (lack of oxygen) [35,43]. Under high advanced injection timings like tinj = 18 and 20 DCA BTDC, biodiesel has a longer time to atomize and this along with the higher oxygen content of the fuel might enhance its combustion quality. This could be the reason for the higher cylinder pressure obtained here. Anyway, combustion is very complex and, as such, further investigations are required.
One of the most important parameters characterizing combustion is ignition delay and, as such, examining the delay time is critically important in studies related to engines and fuels. Basically, ignition delay is the period between the start of injection and start of combustion (SOC). Recording the start of injection can be straight forward through the engine management system (e.g., through the injection control system). Determining SOC, however, is quite challenging. In the literature, SOC or auto-ignition location is commonly defined as when the HRR locally becomes zero and reverses direction, although the natural flame emission was identified earlier than the SOC [35]. SOC is very sensitive to fuel molecule size and structure [43]. The first stage of combustion is called premixed burn duration. This duration is quite short [45] and leads to a high rate of heat release. The heat release rate during this stage is strongly dependent on the amount of air–fuel premixed during the ignition delay period [46]. The main combustion stage, diffusion combustion, is associated with a lower rate of heat release.
To investigate the influence of injection timing on combustion characteristics, HRR signals of B100 under mode M1 and different tinj are shown in Figure 4. Qualitatively, ignition delay times could be identified in this figure where HRR locally becomes zero and reverses direction. One example of ignition delay time is indicated in Figure 4a for B100 under a condition of injection timing of 20 DCA. Quantitative information of ignition delay times will be shown later at the end of Section 3.3.
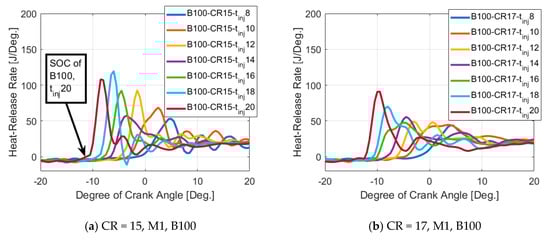
Figure 4.
HRR of B100, CR = 15 (a) CR = 17 (b) at mode M1, different injection timings.
3.3. Influence of Blending Ratio
Figure 5a–f show in-cylinder pressure signals for all biodiesel blends (B0, B10, B20, B40, B60 and B100) under the injection mode M1. The left column (Figure 5a,c,e) is shown for CR = 15, while the right column (Figure 5b,d,f) is for CR = 17. The top row (Figure 5a,b) is for tinj = 10 DCA BTDC, the middle row (Figure 5c,d) is for tinj = 16 DCA BTDC and the bottom row (Figure 5e,f) is for tinj = 20 DCA BTDC. Qualitatively, Figure 5 shows some differences in pmax developed by the engine when operating with those blends. Quantitative information about pmax developed by these biodiesel blends will be shown and discussed later in Section 3.6.
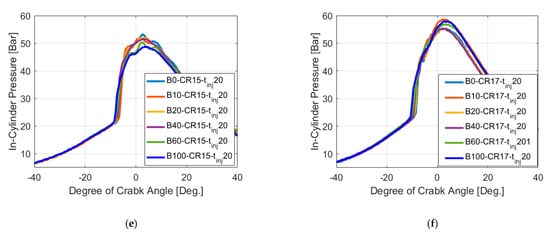
Figure 5.
Influence of blending ratio on the development of in-cylinder pressure under mode M1. (a) M1, tinj = 10, CR = 15; (b) M1, tinj = 10, CR = 17; (c) M1, tinj = 16, CR = 15; (d) M1, tinj = 16, CR = 17; (e) M1, tinj = 20, CR = 15; (f) M1, tinj = 20, CR = 17.
It is noted here that the influence of blending ratio on the in-cylinder pressure shown in Figure 5a–f is not quite significant. However, in general, an increase in the blending ratio of biodiesel shifts the start of the in-cylinder pressure rise from the compression trace to the left. This could be an evidence of auto-ignitability enhancement when increasing the blending ratio and will be investigated further through examining the HRR, shown later in Figure 6. It is shown in Figure 5 that the difference in in-cylinder pressure is quite small. The thermal conditions at SOI may be on the side of high-temperature combustion (HTC) regimes but this needs to be further investigated. Nevertheless, it is found by Westbrook et al. in an earlier study [47] that, under low-temperature combustion (LTC) regimes, the influence of hydrocarbon fuels and biodiesels is observable. Under HTC, however, the influence is not quite as significant.
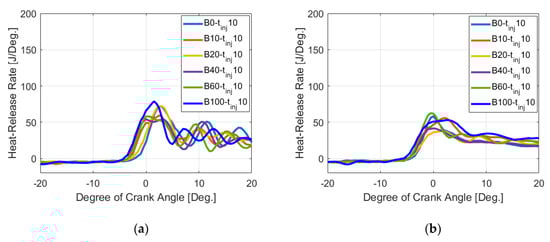
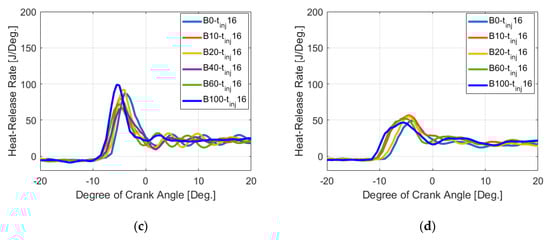
Figure 6.
Influence of blending ratio on HRR under different constant fuel flow rate compression ratios. (a) CR = 15, M1, tinj = 10 DCA BTDC; (b) CR = 17, M1, tinj = 10 DCA BTDC; (c) CR = 15, M1, tinj = 16 DCA BTDC; (d) CR17, M1, tinj = 16 DCA BTDC.
Figure 6 shows the HRR of those blends tested in this study under mode M1. The left column (Figure 6a,c) is shown for CR = 15, while the right column (Figure 6b,d) is for CR = 17. The top row (Figure 6a,b) is for tinj = 10 DCA BTDC and the bottom row (Figure 6c,d) is for tinj = 20 DCA BTDC. It is quite clear here that adding biodiesel into the diesel–biodiesel blends leads to shorter ignition delay times. B100, generally, shows the shortest ignition delay, while B0 shows the longest ignition delay time. Varying the blending ratio from B0 to B100 leads to a difference of approximately 3 DCA in the ignition delay. This is obviously attributed to the higher CN of the biodiesel as reported earlier in this work. It is also noted that the differences amongst the HRRs at the start of combustion (SOC) are quite similar under CR = 15 (Figure 6a,c) and tinj = 16 DCA BTDC, CR = 17 (Figure 6d).
Figure 6b shows the smallest gap amongst the HRRs at SOC compared to that shown in other figures here. Under the high CR and small tinj reported in Figure 6b (CR = 17, tinj = 10 DCA BTDC), the temperature at SOI is high and this is attributable to the small difference in HRR at the start of combustion observed in this case. Compared to the HRR obtained in Figure 6a,c for CR = 15, the HRR shown in Figure 6b,d for CR = 17 is lower. This is understandable as the higher in-cylinder temperature under higher CR causes a shorter ignition delay and smaller premixed combustion fraction.
Ignition delay times of B100 at mode M1 but different injection timings, corresponding to the HRR shown in Figure 4, are shown in Figure 7a. As can be seen from Figure 7a, the injection timings strongly affect the ignition delay, and this is due to the difference in the premixed combustion fraction observed earlier in Figure 4. In general, injecting fuel further from the top dead center (TDC) leads to a longer ignition delay and, as such, a higher premixed combustion fraction. Injecting the fuels close to (TDC), like the case of tinj = 8 DCA, leads to a high temperature at SOI, Ti, and, as such, the fuel–air mixture is easier to be auto-ignited. Higher Ti leads to a shorter ignition delay time and smaller fraction of premixed combustion. Under CR = 17, Ti is higher and HRR is lower compared to those under CR = 15 (see Figure 4), and this is attributable to the shorter ignition delay under the higher CR conditions shown in Figure 7a.
Ignition delay times of all blends under mode M1 and injection timing tinj = 16 DCA BTDC, corresponding to the HRR shown in Figure 6d,c for CR = 15 and CR = 17, respectively, are shown in Figure 7b. It is clear here that increasing the blending ratio from B0 to B100 leads to increasing the CN, and this is obviously attributed to decreasing the ignition delay times or improving the fuel blend reactivity. It is observed here again that the higher in-cylinder temperature under higher CR causes a shorter ignition delay and smaller premixed combustion fraction.
3.4. Development of In-Cylinder Pressure and HRR under Constant Input Energy Supplying Modes
In engine experiments, engines are controlled under two main conditions, namely engine speed and load. Speed here is the crankshaft rotations per minute (rpm), while engine load is determined through engine torque (N·m) or engine power (kW) [36]. To obtain similar engine torque, supplying constant input energy to the tested engine is normally adopted, regardless of the fuel used. This is to account for the difference in heating values amongst the fuels tested. It is noted here again that both methods of fuel supplied (equal volume flow rate [42,48] and equal input energy [21], respectively) are available in the literature and this sometime confuses the reader. On the one hand, the control system normally uses volume flow rate (through injection pressure and duration) to drive the injectors and, as such, the approach of using equal volume flow rate (L/min) supplied for the engine when testing different fuels is quite common in the literature. This is particularly true with engines equipped with mechanical injection systems such as the one used in [48] for controlling the mechanical system to supply constant input energy, which is quite challenging. On the other hand, with different heating value fuels like biodiesel blends tested in this study, they produce different engine torque or different engine loading conditions when supplying an equal volume flow rate for all fuels. Relative comparisons of the engine performance when operating with different fuels under different engine loads, as such, may not be meaningful [9].
Figure 8a,d show in-cylinder pressure signals for all biodiesel blends (B0, B10, B20, B40, B60 and B100) under the injection mode Qconst (constant input energy (J/min) supplied amongst the biodiesel blends). For all blends, an energy flow rate of 463.6 J/min is supplied to the engine under this mode. This amount corresponds to the fuel volume flow rate of B0 at mode M1 (15.5 mL/min). The fuel volume flow rates of other blends can be calculated by multiplying 463.6 J/min with the blends’ heating value provided in Table 2. This mode was conducted only for CR = 15 and Figure 8 shows the pressure signals developed under tinj = 10 (Figure 8a), tinj = 12 (Figure 8b), tinj = 16 (Figure 8c) and tinj = 20 (Figure 8d). It is clear that the influence of fuel properties can be ignored here.
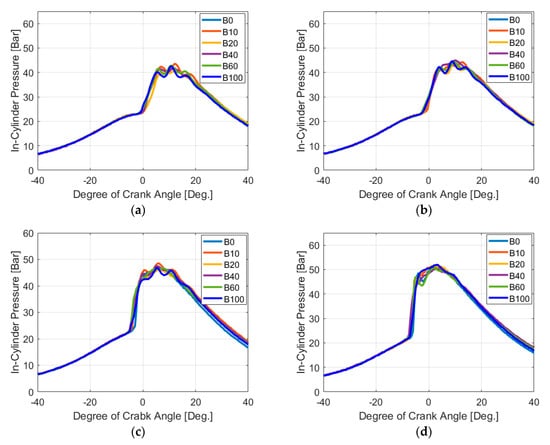
Figure 8.
Influence of blending ratio on in-cylinder pressure development when supplying constant input energy amounts (Qconst) to the cylinder. (a) Qconst, CR = 15, tinj = 10 DCA BTDC; (b) Qconst, CR = 15, tinj = 12 DCA BTDC; (c) Qconst, CR = 15, tinj = 16 DCA BTDC; (d) Qconst, CR = 15, tinj = 20 DCA BTDC.
Nevertheless, results observed in Figure 8a,d indicate that the influence of blending ratios on the SOC is quite similar to the results observed earlier in Figure 5 showing results under mode M1, with a constant fuel volume flow rate. Figure 8 shows that although using the equal input energy approach brings the engine loads close amongst the blends tested, in this special equipment (the CFR engine), the auto-ignitability is mainly driven by the chemical profile of the testing fuels rather than the engine loads, and this is in a good agreement with the discussion shown earlier in Section 3.1. Again, Section 3.1 reports that the influence of engine load on in-cylinder development around the SOC is minimal. This may be probably true only in the CFR engine, as in this tool, the intake air temperature is well controlled and kept constant at 65 °C for all testing conditions. Under a similar thermal condition at SOI, the fuel evaporation rate and pre-mixing during the ignition delay period could be similar under different engine loading conditions and, as such, the auto-ignitability mainly depends on the fuel reactivity.
Figure 9 shows the HRR of the biodiesel blends under constant input energy modes, at injection timings tinj = 10 DCA (Figure 9a) and tinj = 16 DCA (Figure 9b). The influence of blending ratio on the ignition delay and premixed combustion fraction is quite clear and this is also similar to what has been observed in Figure 6 for similar volume flow rate conditions. A higher biodiesel fraction in the blend leads to a shorter ignition delay and this is attributed to the higher CN of the biodiesel.
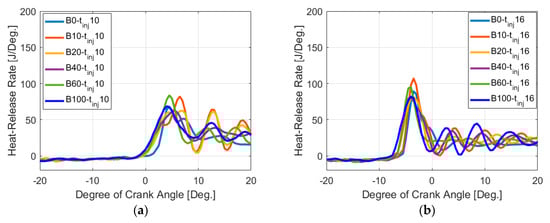
Figure 9.
HRR of biodiesel blends when supplying constant input energy amounts (Qconst) to the cylinder. (a) Qconst, CR = 15, tinj = 10 DCA BTDC; (b) Qconst, CR15, tinj = 16 DCA BTDC.
3.5. Rate of In-Cylinder Pressure Rise
Figure 10a,d show the RPR for all biodiesel blends (B0, B10, B20, B40, B60 and B100) under the injection mode M1. The left column (Figure 10a,c) is shown for CR = 15, while the right one (Figure 10b,d) is for CR = 17. The top row (Figure 10a,b) is for tinj = 8 DCA BTDC, while the bottom row (Figure 10c,d) is for tinj = 20 DCA BTDC.
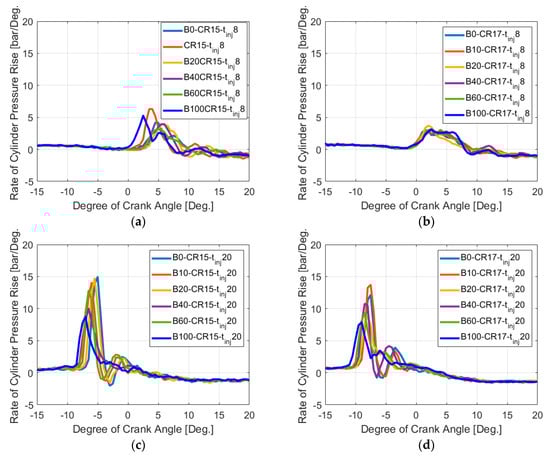
Figure 10.
Rate of in-cylinder pressure rise versus DCA under different operating conditions. (a) M1, tinj = 8 TDC BTDC, CR = 15; (b) M1, tinj = 8 DCA BTDC, CR = 17; (c) M1, tinj = 20 TDC BTDC, CR = 15; (d) M1, tinj = 20 TDC BTDC, CR = 17.
It is quite interesting from these figures that under high CR and/or short advanced injection timing conditions, like the cases shown in Figure 10a (tinj = 8 DCA BTDC, CR15) and Figure 10b (tinj = 8 DCA BTDC, CR17), the influence of fuel blending ratio on RPR is almost ignorable. Again, the combustion happening in these cases could fall into HTC regimes as mentioned earlier and, as such, the influence of fuel properties on ignition delay is minimal. It is also noted here that the HRR under CR = 17 is lower compared to that under CR = 15. Under higher CR conditions, the ignition delay time is shorter due to the higher in-cylinder temperature and pressure at the end of the compression stroke. The shorter ignition delay leads to a higher amount of air–fuel premixed.
Under low CR and/or long advanced injection timing conditions, like the cases shown in Figure 10c (tinj = 20 DCA BTDC, CR15) and Figure 10d (tinj = 20 DCA BTDC, CR17), however, the blending ratios significantly affect the RPR. A general trend observed in Figure 10c,d is that the fuels with lower CN will have higher RPR and this is due to their longer ignition delay and therefore high premixed combustion fraction as discussed briefly earlier in this study. For example, B100 (highest CN) shows the lowest RPR and this rapid rise in the RPR of B100 occurs earlier compared to other blends, as shown in Figure 10c,d.
3.6. Maximum In-Cylinder Pressure
Figure 11a,b show the maximum value of in-cylinder pressure, pcylmax, versus diesel–biodiesel blending ratio. Results shown in Figure 11a are for CR = 15 under the injection mode Qconst, while Figure 11b is for CR = 17 under the injection mode M1. As can be seen from Figure 11a,b, the influence of blending ratio on pcylmax is not significant except for the case of B10. A general trend observed for B10 in these figures is that when increasing the blending ratio from 0 to 10%, pcylmax generally increases. The higher pcylmax of B10 compared to B0 and B20 could be due to the lubricant enhancement when operating the engine with low blending ratios of biodiesel–diesel mixture. It has been claimed in [1,49] that adding a small amount of biodiesel into diesel fuel (e.g., 2–10 vol%) will help to improve the engine lubricant and therefore the thermal efficiency. The improvement of the lubricant is achieved due to the high viscosity of biodiesel compared to fossil diesel as can be seen in Table 2. When lubricant conditions are improved, the piston–cylinder thermal gap will be decreased as this may be attributed to the increase in the pcylmax observed for B10 in this case. When the blending ratio is high enough, like B20 in this study, the enhancement will not be achieved. Biodiesels are found to have higher lubricity with respect to fossil diesel [9,44]. However, biodiesels can contribute to the formation of deposits [9] and their higher viscosity and surface tension lead to their poorer atomization and vaporization [44]. The above-mentioned factors could be attributed to impairing the lubricant benefit when utilizing high-blending ratio diesel–biodiesel mixtures like B20 tested here.
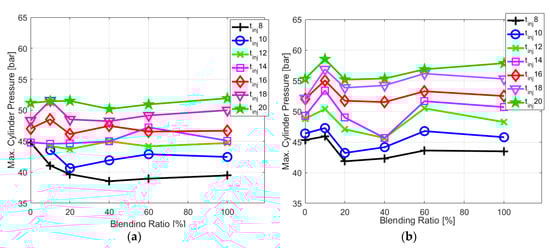
Figure 11.
Maximum of in-cylinder pressure versus cetane number (CN) (each curve shown here contains data of all biodiesel blends tested). (a) Qconst, CR = 15; (b) M1, CR = 17.
It is also clear from Figure 11 that injecting fuel closer to the TDC leads to a lower pcylmax. The temperature at SOI is higher when injecting fuel closer to the TDC and this will lead to a shorter ignition delay and smaller fraction of premixed combustion. The smaller premixed combustion fraction is the main reason resulting in the lower pcylmax. It is noted here that this trend was qualitatively observed earlier in Figure 3 and Figure 4 and the quantitative result is reported here.
3.7. Maximum Rate of In-Cylinder Pressure Rise
Figure 12a,b show the MRPR for all biodiesel blends (B0, B10, B20, B40, B60 and B100) versus the thermal condition at SOI, 1000/Ti. Figure 12a is shown for CR = 15, while Figure 12b is for CR = 17. It can be seen from these figures that the MRPR is significantly affected by the thermal condition at SOI, thus a lower injection temperature (towards to the right side of the 1000/Ti axis) leads to a higher MRPR. It was noted earlier that low temperature at SOI leads to a long ignition delay and high premixed combustion fraction, and this is attributed to the high MRPR. Furthermore, MRPR values of those biodiesel blends are quite diverse, except for CR = 17, and in the range of 1000/Ti smaller than 1.23 shown in Figure 12b. Although it is not quite consistent, increasing the blending ratio generally deceases the MRPR. Under CR = 17 and in the range of 1000/Ti smaller than 1.23 shown in Figure 12b, the diversion of the MRPR amongst the blends disappears. Under the high CR and higher injection temperature, the combustion here may fall right in the low temperature range of the HTC strategy. It was observed earlier [47] that combustion characteristics of biodiesels and diesel are identical under HTC conditions.
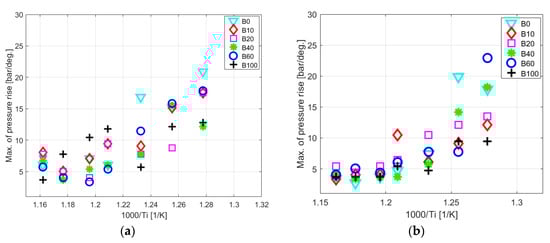
Figure 12.
Max rate of in-cylinder pressure rise versus 1/Ti. (a) M5, CR15; (b) M5, CR17.
4. Conclusions
An analysis of biodiesel blend combustion characteristics under a wide range of thermal conditions of a CFR engine has been extensively carried out in this study. It is observed that the oxygen content in biodiesel has significant effects on the fuel auto-ignitability. A higher blending ratio of a biodiesel–diesel mixture leads to its higher CN. The cetane number of pure biodiesel (B100) is almost 30% higher than that of fossil diesel (B0), and this could be due to the oxygen content in the biofuel. In this CFR-F5 engine, it is observed that varying the engine load has minimal effect on the premixed combustion. The HRR observed during the premixed combustion period is identical when testing the engine under different fuel flow rates. Higher fuel flow rates, however, lead to a higher HRR during diffusion combustion.
A higher temperature leads to a smaller premixed combustion fraction (due to a shorter ignition delay) and therefore a higher MRPR. At the same thermal conditions at SOI, when operating the engine under CR = 15 and 17, increasing the blending ratio generally has quite a small effect on in-cylinder pressure development, except for B10. The higher pcylmax of B10 observed here compared to that of B0 and B20 could be due to the lubricant enhancement when operating the engine with low blending ratios of biodiesel–diesel mixture. When using a low-blending ratio mixture like B10 in this case, the higher viscosity of the biodiesel may help to lower the thermal gap between the piston and the cylinder, and this may lead to an increase in in-cylinder pressure. Under high blending ratios, this benefit is not achieved.
Author Contributions
Conceptualization, methodology, validation, analysis, investigation, and resources: V.H.N., P.X.P., K.T.N., T.V.P. and M.Q.D.; Writing—original draft preparation: P.X.P.; writing—review and editing: P.X.P., V.H.N., M.Q.D., K.T.N. and T.V.P. Supervision: V.H.N., P.X.P. and K.T.N.; All authors have read and agreed to the published version of the manuscript.
Funding
This research received no external funding.
Conflicts of Interest
The authors declare no conflict of interest.
References
- Krahl, J.; Knothe, G.; Van Gerpen, J.H. Biodiesel Handbook; AOCS Press: Urbana, IL, USA, 2010. [Google Scholar]
- Kegl, B.; Kegl, M.; Pehan, S. Green diesel engines. In Biodiesel Usage in Diesel Engines; Springer: London, UK, 2013. [Google Scholar]
- Demirbas, A. Production of biodiesel from algae oils. Energy Sources Part A Recovery Util. Environ. Eff. 2008, 31, 163–168. [Google Scholar] [CrossRef]
- Rahman, M.; Pourkhesalian, A.; Jahirul, M.; Stevanovic, S.; Pham, P.; Wang, H.; Masri, A.; Brown, R.J.; Ristovski, Z. Particle emissions from biodiesels with different physical properties and chemical composition. Fuel 2014, 134, 201–208. [Google Scholar] [CrossRef]
- Pham, P.; Bodisco, T.A.; Stevanovic, S.; Rahman, M.; Wang, H.; Ristovski, Z.; Brown, R.; Masri, A. Engine performance characteristics for biodiesels of different degrees of saturation and carbon chain lengths. SAE Int. J. Fuels Lubr. 2013, 6, 188–198. [Google Scholar] [CrossRef]
- Pourkhesalian, A.; Stevanovic, S.; Salimi, F.; Rahman, M.; Wang, H.; Pham, P.; Bottle, S.; Masri, A.; Brown, R.; Ristovski, Z. Influence of fuel molecular structure on the volatility and oxidative potential of biodiesel particulate matter. Environ. Sci. Technol. 2014, 48, 12577–12585. [Google Scholar] [CrossRef]
- Nguyen, V.H.; Pham, P.X. Biodiesels: Oxidizing enhancers to improve CI engine performance and emission quality. Fuel 2015, 154, 293–300. [Google Scholar] [CrossRef]
- Vargas, A.P.F.; Delgado, R.; Hernández, E.; Suástegui, J.A. Performance Analysis of a Compression Ignition Engine Using Mixture Biodiesel Palm and Diesel. Sustainability 2019, 11, 4918. [Google Scholar] [CrossRef]
- Lapuerta, M.; Armas, O.; Rodriguez-Fernandez, J. Effect of biodiesel fuels on diesel engine emissions. Prog. Energy Combust. Sci. 2008, 34, 198–223. [Google Scholar] [CrossRef]
- Hasan, M.; Rahman, M. Performance and emission characteristics of biodiesel–diesel blend and environmental and economic impacts of biodiesel production: A review. Renew. Sustain. Energy Rev. 2017, 74, 938–948. [Google Scholar] [CrossRef]
- Damanik, N.; Ong, H.C.; Tong, C.W.; Mahlia, T.M.I.; Silitonga, A.S. A review on the engine performance and exhaust emission characteristics of diesel engines fueled with biodiesel blends. Environ. Sci. Pollut. Res. 2018, 25, 15307–15325. [Google Scholar] [CrossRef]
- Lai, J.Y.; Lin, K.C.; Violi, A. Biodiesel combustion: Advances in chemical kinetic modeling. Prog. Energy Combust. Sci. 2011, 37, 1–14. [Google Scholar] [CrossRef]
- Assanis, D.N.; Filipi, Z.S.; Fiveland, S.B.; Syrimis, M. A predictive ignition delay correlation under steady-state and transient operation of a direct injection diesel engine. J. Eng. Gas Turbines Power 2003, 125, 450–457. [Google Scholar] [CrossRef]
- Shahabuddin, M.; Liaquat, A.; Masjuki, H.; Kalam, M.; Mofijur, M. Ignition delay, combustion and emission characteristics of diesel engine fueled with biodiesel. Renew. Sustain. Energy Rev. 2013, 21, 623–632. [Google Scholar] [CrossRef]
- Singh, G.; Pham, P.; Kourmatzis, A.; Masri, A. Effect of electric charge and temperature on the near-field atomization of diesel and biodiesel. Fuel 2019, 241, 941–953. [Google Scholar] [CrossRef]
- Pham, P.; Kourmatzis, A.; Masri, A. Local characteristics of fragments in atomizing sprays. Exp. Therm. Fluid Sci. 2018, 95, 44–51. [Google Scholar] [CrossRef]
- Campbell, M.F.; Davidson, D.F.; Hanson, R.K.; Westbrook, C.K. Ignition delay times of methyl oleate and methyl linoleate behind reflected shock waves. Proc. Combust. Inst. 2013, 34, 419–425. [Google Scholar] [CrossRef]
- Jaichandar, S.; Kumar, P.S.; Annamalai, K. Combined effect of injection timing and combustion chamber geometry on the performance of a biodiesel fueled diesel engine. Energy 2012, 47, 388–394. [Google Scholar] [CrossRef]
- Dornelles, H.; Antolini, J.; Sari, R.; Nora, M.D.; Machado, P.R.; Martins, M. Analysis of engine performance and combustion characteristics of diesel and biodiesel blends in a compression ignition engine. SAE Tech. Pap. 2016. [Google Scholar] [CrossRef]
- Sayin, C.; Gumus, M.; Canakci, M. Effect of fuel injection pressure on the injection, combustion and performance characteristics of a DI diesel engine fueled with canola oil methyl esters-diesel fuel blends. Biomass Bioenergy 2012, 46, 435–446. [Google Scholar] [CrossRef]
- Zhang, R.; Pham, P.X.; Kook, S.; Masri, A.R. Influence of biodiesel carbon chain length on in-cylinder soot processes in a small bore optical diesel engine. Fuel 2019, 235, 1184–1194. [Google Scholar] [CrossRef]
- Duong, M.Q.; Nguyen, V.H.; Pham, P.X. Development of Empirical Correlations for Ignition Delay in a Single Cylinder Engine Fueled with Diesel/Biodiesel Blends. In Proceedings of the 2019 International Conference on System Science and Engineering (ICSSE), Dong Hoi, Vietnam, 20–21 July 2019; pp. 614–618. [Google Scholar]
- Rothamer, D.A.; Murphy, L. Systematic study of ignition delay for jet fuels and diesel fuel in a heavy-duty diesel engine. Proc. Combust. Inst. 2013, 34, 3021–3029. [Google Scholar] [CrossRef]
- Pham, P.X.; Kourmatzis, A.; Masri, A.R. Spray characterization of ethanol and saturated biodiesels of different carbon chain lengths. In Proceedings of the Australian Combustion Symposium, Perth, WA, Australia, 6–8 November 2013; pp. 392–395. [Google Scholar]
- Kourmatzis, A.; Pham, P.X.; Masri, A.R. Air assisted atomization and spray density characterization of ethanol and a range of biodiesels. Fuel 2013, 108, 758–770. [Google Scholar] [CrossRef]
- Wei, M.; Gao, Y.; Yan, F.; Chen, L.; Feng, L.; Li, G.; Zhang, C. Experimental study of cavitation formation and primary breakup for a biodiesel surrogate fuel (methyl butanoate) using transparent nozzle. Fuel 2017, 203, 690–699. [Google Scholar] [CrossRef]
- Pham, P.; Kourmatzis, A.; Masri, A. Secondary atomization characteristics of biofuels with different physical properties. In Proceedings of the 19th Australasian Fluid Mechanics Conference (AFMC), Melbourne, Australia, 8–11 December 2014; pp. 1–4. [Google Scholar]
- Kourmatzis, A.; Pham, P.X.; Masri, A.R. Characterization of atomization and combustion in moderately dense turbulent spray flames. Combust. Flame 2015, 162, 978–996. [Google Scholar] [CrossRef]
- Haik, Y.; Selim, M.Y.; Abdulrehman, T. Combustion of algae oil methyl ester in an indirect injection diesel engine. Energy 2011, 36, 1827–1835. [Google Scholar] [CrossRef]
- Le Breton, M.D. A Repeatability Test on the CFR Cetane Engine. SAE Tech. Pap. 1984. [Google Scholar] [CrossRef]
- Singh, B.; Shukla, S. Experimental analysis of combustion characteristics on a variable compression ratio engine fuelled with biodiesel (castor oil) and diesel blends. Biofuels 2016, 7, 471–477. [Google Scholar] [CrossRef]
- Dash, S.K.; Lingfa, P.; Chavan, S.B. Combustion analysis of a single cylinder variable compression ratio small size agricultural DI diesel engine run by Nahar biodiesel and its diesel blends. Energy Sources Part A Recovery Util. Environ. Eff. 2020, 42, 1681–1690. [Google Scholar] [CrossRef]
- Tesfa, B.; Mishra, R.; Zhang, C.; Gu, F.; Ball, A. Combustion and performance characteristics of CI (compression ignition) engine running with biodiesel. Energy 2013, 51, 101–115. [Google Scholar] [CrossRef]
- Pham, P.X.; Bodisco, T.A.; Ristovski, Z.D.; Brown, R.J.; Masri, A.R. The influence of fatty acid methyl ester profiles on inter-cycle variability in a heavy duty compression ignition engine. Fuel 2014, 116, 140–150. [Google Scholar] [CrossRef]
- Dec, J.E. A conceptual model of DL diesel combustion based on laser-sheet imaging. SAE Trans. 1997, 106, 1319–1348. [Google Scholar]
- Heywood, J. Internal Combustion Engine Fundamentals, 2nd ed.; McGraw-Hill Education: New York, NY, USA, 2018. [Google Scholar]
- Hasegawa, M.; Shimasaki, Y.; Yamaguchi, S.; Kobayashi, M.; Sakamoto, H.; Kitayama, N.; Kanda, T. Study on Ignition Timing Control for Diesel Engines Using In-Cylinder Pressure Sensor. SAE Tech. Pap. 2006. [Google Scholar] [CrossRef]
- Desantes, J.M.; Galindo, J.; Guardiola, C.; Dolz, V. Air mass flow estimation in turbocharged diesel engines from in-cylinder pressure measurement. Exp. Therm. Fluid Sci. 2010, 34, 37–47. [Google Scholar] [CrossRef]
- Lapuerta, M.; Armas, O.; Hernández, J. Diagnosis of DI Diesel combustion from in-cylinder pressure signal by estimation of mean thermodynamic properties of the gas. Appl. Therm. Eng. 1999, 19, 513–529. [Google Scholar] [CrossRef]
- Payri, F.; Broatch, A.; Tormos, B.; Marant, V. New methodology for in-cylinder pressure analysis in direct injection diesel engines—application to combustion noise. Meas. Sci. Technol. 2005, 16, 540. [Google Scholar] [CrossRef]
- ASTM. Standard Test Method for Cetane Number of Diesel Fuel Oil; ASTM International: West Conshohocken, PA, USA, 2010. [Google Scholar]
- Pham, P.X.; Nguyen, V.H. Residue-Based Biodiesel: Experimental Investigation into Engine Combustion and Emission Formation. J. Energy Eng. 2017, 143, 04017047. [Google Scholar] [CrossRef]
- Westbrook, C.K. Biofuels combustion. Annu. Rev. Phys. Chem. 2013, 64, 201–219. [Google Scholar] [CrossRef] [PubMed]
- Pandey, R.K.; Rehman, A.; Sarviya, R. Impact of alternative fuel properties on fuel spray behavior and atomization. Renew. Sustain. Energy Rev. 2012, 16, 1762–1778. [Google Scholar] [CrossRef]
- Heywood, J.B. Internal Combustion engine fundamentals, 1a Edição; McGraw-Hill Education: NewYork, NY, USA, 1988. [Google Scholar]
- Kamimoto, T.; Kobayashi, H. Combustion processes in diesel engines. Prog. Energy Combust. Sci. 1991, 17, 163–189. [Google Scholar] [CrossRef]
- Westbrook, C.K.; Naik, C.V.; Herbinet, O.; Pitz, W.J.; Mehl, M.; Sarathy, S.M.; Curran, H.J. Detailed chemical kinetic reaction mechanisms for soy and rapeseed biodiesel fuels. Combust. Flame 2011, 158, 742–755. [Google Scholar] [CrossRef]
- Manigandan, S.; Gunasekar, P.; Devipriya, J.; Nithya, S. Emission and injection characteristics of corn biodiesel blends in diesel engine. Fuel 2019, 235, 723–735. [Google Scholar] [CrossRef]
- Tomic, M.; Savin, L.; Micic, R.; Simikic, M.; Furman, T. Possibility of using biodiesel from sunflower oil as an additive for the improvement of lubrication properties of low-sulfur diesel fuel. Energy 2014, 65, 101–108. [Google Scholar] [CrossRef]
© 2020 by the authors. Licensee MDPI, Basel, Switzerland. This article is an open access article distributed under the terms and conditions of the Creative Commons Attribution (CC BY) license (http://creativecommons.org/licenses/by/4.0/).