Article

Impact of Climate Change in West Africa on Cereal Production Per Capita in 2050

1
UMR ABSYS, INRAE, CIRAD, Montpellier SupAgro, CHEAM-IAMM, UMR SYSTEM, 34060 Montpellier, France
2
UMR Eco&Sols, IRD, CIRAD, INRAE, Montpellier SupAgro, Université Montpellier, 34060 Montpellier, France
3
UMR ESPACE-DEV, Université Montpellier, IRD, Université Guyane, Université Réunion, Université Antilles, Université Avignon, 34090 Montpellier, France
4
UMR TETIS, CIRAD, INRAE, Maison de la Télédétection, 34090 Montpellier, France
5
LOCEAN, Sorbonne Universités UPMC-CNRS-IRD-MNHN, IPSL, 75006 Paris, France
6
LAPAMF-UFR SSMT, Université Félix Houphouët Boigny, Abidjan 22, 22BP582 Ivory Coast, France
*
Author to whom correspondence should be addressed.
Sustainability 2020, 12(18), 7585; https://doi.org/10.3390/su12187585
Submission received: 24 June 2020 / Revised: 2 September 2020 / Accepted: 7 September 2020 / Published: 14 September 2020
(This article belongs to the Special Issue Sustainable Applications in Agriculture)

Abstract

:
Food security is a crucial issue in the Sahel and could be endangered by climate change and demographic pressure during the 21st century. Higher temperatures and changes in rainfall induced by global warming are threatening rainfed agriculture in this region while the population is expected to increase approximately three-fold until 2050. Our study quantifies the impact of climate change on food security by combining climate modelling (16 models from CMIP5), crop yield (simulated by agronomic model, SARRA-O) and demographic evolution (provided by UN projection) under two future climatic scenarios. We simulate yield for the main crops in five countries in West Africa and estimate the population pressure on crop production to assess the number of available cereal production per capita. We found that, although uncertain, the African monsoon evolution leads to an increase of rainfall in Eastern Sahel and a decrease in Western Sahel under the RCP8.5 (Representative Concentration Pathway) scenario from IPCC, leading to the higher temperature increase by the end of the 21st century. With regard to the abundance of food for the inhabitants, all the scenarios in each country show that in 2050, local agricultural production will be below 50 kg per capita. This situation can have impact on crop import and regional migration.

1. Introduction

The Sudano-Sahelian zone is one of the most vulnerable regions in the world to climate hazards. It is characterized by a monsoon season stretching between May and September, which concentrates the majority of annual precipitation (between 200 and above 1200 mm per year). In this region, the rural population depends mainly on this rainfall season for subsistence rainfed farming and pastoralism [1]. The subsistence crops are mainly maize, pearl millet and sorghum. They play a very important role in West Africa and account for over 60% to 98% of total crop production for the period 2008–2017 for Burkina Faso, Mali, Niger, Nigeria and Senegal (FAOSTAT). Climate change and the impact on agriculture could lead to a weakening of crop yield and crop production with high uncertainty for the 21st century [2,3].
Following the IPCC AR5 report, climate change projections are uncertain and depend on the different General Circulation Models (GCMs) used in the Climate Model Intercomparison (CMIP5) [4] and on the different Representative Concentration Pathway (RCP) predicting global warming from +0.94 °C [0.49–1.65 °C, interval 5%–95%] (RCP2.6) to +1.7 °C [1.20–2.37 °C, interval 5%–95%] (RCP8.5) [2] in 2050 (in 30 years). In West Africa (WA), under RCP8.5, the wet-season precipitation changes, range from −20% to +40% with respect to the present day [5]. In addition to the climate model uncertainty, there is also the uncertainty of agronomic models, which leads to a high degree of uncertainty in impact studies on the projection of agronomic yields. For example, a meta-analysis of 52 studies for several crops showed that climate change might lead to yield losses in Africa of 5%, 10% and 15% of maize, pearl millet and sorghum respectively in 2050 [3]. Moreover, recent projects of an intercomparison of agronomic models as AgMip have shown convergence of yield reduction trends. However, some studies [6,7] showed that the increase of atmospheric CO2 concentration ([CO2]a) drives several changes: a very low direct fertilization effect, a reduction in transpiration implying a potential reduction in water stress. The combination of these potential effects leads to a smaller decrease of the in C4 crop yield in the areas where water stress is or would be strongly marked.
On the other hand, the possible decline in the productivity of the main staple food crops will be accompanied by a growing demographic pressure with the rapidly growing population [8]. In the different countries cited above, the population could increase in 2050 by a factor of 2.3 to 4.5 with a high scenario following the different countries; the highest value corresponds to Niger [9,10]. These studies showed that the population is one of the main drivers of increased food insecurity. However, to our knowledge, climate uncertainty is not assessed in these studies, nor is the impact of climate change assessed through agronomic models, except through often macroeconomic trends. This study, reported at the country level, combines the latest knowledge from social sciences, physical environmental sciences and biological and agronomic sciences. Variability and uncertainty are the keywords of this study in West Africa (WA): climatic, demographic, yields and production. The objective of this study is to describe and combine the trends and magnitude of key factors, identified in these different topics, in order to assess their impacts in a food security context. For the climatic input, several global climate models from CMIP5 (16 models) are used with two scenarios with the highest range of climate warming from the optimistic RCP2.6, already questioned, to the worst RCP8.5. To reduce the bias of CMIP5 models in West-Africa, we apply a bias correction of these models using current climatic data. The future crop yield is obtained by an agronomic model (SARRA-H&O) having been the subject of several publications in the field of climate change including the consideration of the CO2 effect [7,11,12,13]. Finally, the UN population projections are used to describe the effects of these different trends in terms of kilograms of cereals per capita for Nigeria, Niger, Senegal, Mali and Burkina Faso, where maize, pearl millet and sorghum production among all cereals account for 75%, 97%, 63%, 69% and 93% respectively. After the presentation of data and methodology with the presentation of RCP scenarios; in Section 3, we describe the results in terms of the evolution of seasonal climate, crop yield and country production by the inhabitant. Finally, we discuss our results, giving particular attention to the limitations of our methodology, and the importance of factoring demographics into future impact studies and the potential evolution of performance in relation to different adaptation methods.

2. Method and Data

2.1. Climate Projections in West Africa

Sub-Saharan West Africa experiences a strong gradient in annual rainfall with rainfall accumulations ranging from about 100 mm (northern fringe of the Sahelian zone) to more than 2500 mm (in the Guinean mountain ranges and Adamaoua). During the 1970s and 1980s, the area experienced a sharp decline in precipitation and West Africa is nowadays experiencing a rapid climate change, characterized by widespread warming, a recovery of the monsoonal precipitation, and an increase in the occurrence of climate extremes (Sultan and Gaetani 2016). Warmer and wetter conditions are simulated in future scenarios in the majority of climate models due to the direct radiative effect of the augmentation of greenhouse gas concentration even if countries in the Western part of the Sahel (Senegal, Gambia) may experience a decrease of rainfall [14].
In this study, we use daily climate projections from GCMs which have been previously bias-corrected [15]. The cumulative distribution function transfer (CDFt) method [16,17], using a univariate quantile–quantile method, reducing the bias in daily data. By computing various climatic indices such as seasonal rainfall, dry spells and onset of the rains, that is demonstrated that this technique strongly reduces the errors in the present-day simulations of the CMIP5 models compared to observed data [15](WFDEI, [18] over the 1979–2013 period), and reduces the spread between the models for the different RCPs. Climate model outputs have been bi-linearly interpolated onto a 0.5° linear grid before bias correction. This unbiased set of daily output (precipitation and temperature) from 16 CMIP5 Global Climate Models (GCM) (see Table S1 for the list in Supplementary Materials) is used under two RCPs (RCP2.6 and RCP8.5) over the period 2006–2100 with this resolution of 0.5° × 0.5° [15]. The scenario RCP2.6 corresponds to a CO2 atmospheric concentration of, already questioned, 442 ppm in 2050 stabilization and leads to an elevation of the global surface temperature of about 1.5 + 2 °C with respect to pre-industrial temperature. Conversely, the RCP8.5 is the high-emission scenario with a high greenhouse gas concentration increase of CO2 atmospheric concentration of 540 ppm in 2050 [19,20].

2.2. Population Data

We select five countries in West Africa, where maize, pearl millet and sorghum corresponds to nearly 70% to 98% of the total crop production (Table 1). Maize is mainly grown in the wetter environments: South of Burkina Faso and Nigeria where production accounts for 31% and 37% of total cereal production. Sorghum is grown more in North Burkina-Faso (39% of total production) and Niger (28% of total production). Finally, pearl millet is the most widely grown in semi-arid areas: Niger (69% of total production) and Senegal (39% of total production).
For the population projection, we use the UN population projection (Low and High scenario) until 2050 for the five countries (Table 2). For the Low scenario, an increase between 2.36 (Nigeria) and 3.84 (Niger) times the current population is expected and for the High scenario, an increase between 2.83 (Nigeria) to 4.51 (Niger).

2.3. Yield Simulation

2.3.1. SARRA-O Model

To estimate yield for maize, sorghum and pearl millet, we use the spatial version SARRA-O crop model that simulates the growth of a crop on an adaptive temporal and spatial scale of grid cells depending on the input data (here daily or ten-day data, with a spatial resolution of 0.5° × 0.5°) for sorghum, pearl millet and maize. SARRA-O is the spatialized version of SARRA-H crop model, that is a process-based-deterministic crop model to estimate the attainable yield under climate constraints by computing the soil water balance, evapotranspiration, phenology, assimilation, and biomass partitioning (see [21,22,23] for a detailed review of model concepts and site http://sarra-h.teledetection.fr/). SARRA-H was calibrated against local agronomic-trial data and on-farm surveys conducted in contrasting sites, in different countries, in terms of climate and agricultural practices mainly in West Africa [23,24]. The predictive capacity of the model was confronted with this diversity of yields measured in the field, in relation to average yields at the village and land upper scales. In order to capture this variability, the so-called “local” standard varieties were parameterized using these different sources of information. Similarly, monitoring in the field allowed us to verify sowing practices and levels of intensification. The model is able to simulate sowing dates (integrating failed sowings and re-sowings) according to the practices and the spatial and annual variability of the onset of the rainy season. Field trials were used to calibrate the model parameters such as phenological stages sums of temperature, photoperiod sensitivity coefficients, biomass partitioning coefficients and potential grain yields according to a set of widely-used farmers’ varieties. Details on the calibration can be found in Sultan et al. [25,26]. Among the different calibrated varieties, we selected 90-day varieties, which are short duration crops, insensitive to the photoperiod and selected to maximize the mean yield under optimal fertility conditions. This optimal scenario in a farming situation, associated to intermediate seeding practice (neither too early nor too late with respect to the rainy season) allows us to better capture the effects of climatic constraints although it tends to overestimate simulated yields under historical years in West Africa compared to FAO data [25,26]. Since accumulated growing degree days were used to estimate the duration of the different crop development stages in the SARRA-H model, the duration of the crop might vary with temperature changes. Indeed, Sultan et al. [25] found that a 4 °C warming would shorten the crop duration of such a 90-day cultivar by 11% in the crop model.
As for SARRA-H version, five meteorological inputs are needed with SARRA-O (maximum and minimum temperatures, downwelling shortwave radiation, precipitation, and potential evapotranspiration (Penman–Monteith) [27]. In this study, ET0 is computed by Hargreaves formula [28]. Moreover, for the crop yield simulated by SARRA-H, it was showed that Penman–Monteith and Hargreaves formula obtain closed values with the use of in situ weather data and that Hargreaves equation is robust when it is used in dry climate [28]. Soil depth and soil water holding capacity were defined based on the Harmonized World Soil Database (FAO/IIASA/ISRIC/ISSCAS/JRC, 2012). The first planting is usually carried out as soon as possible, just after the first heavy rains, from the northern part, where the situation is more humid, to the southern part the planting date can extend throughout more than one month. In the model, the sowing date is automatically simulated: when simulated, plant-soil water availability is greater than 10 mm at the end of the day, followed by a 20 day period during which crop establishment is monitored. The juvenile stage of the crop is considered failed, triggering automatic re-sowing, if the simulated daily total biomass decreases for 3 of the 20 days (cereal’s case).

2.3.2. The Concentration of CO2 and the Integration in SARRA-O

Temperature affects two processes of biomass development and growth. Cycle length is calculated as a function of degree–day whose temperature thresholds allowing their calculation are varietal specificities. The efficiency of converting light energy into biomass is also a function of temperature that interacts with maintenance respiration: increasing temperature increases maintenance respiration while reducing the conversion performance into new biomass.
The effect of the atmospheric concentration increases of CO2 ([CO2]a) is reflected by a better efficiency of transpiration. Concerning the impact of the evapotranspirative demand (ET0), if the ET0 calculation methods such as Penman–Monteith or Hargreaves make it possible to take into account the evolution of the trends simulated by the GCM models (i.e., T°, solar radiation), they do not take into account the important role of increasing [CO2]a on stomatal regulation processes [29]. This study, using the ISBA-A-gs model [30] and a large number of experimental results, made it possible to establish a linear relationship according to the [CO2]a (in ppm) impacting the ET0 of −8% for an increase of [CO2]a at 550 ppm and −20% for an increase of [CO2]a at 990 ppm, relative to the ambient ET0 with a [CO2]>]a of about 370 ppm [31].
This relationship has been adapted in the SARRA-H (and SARRA-O) crop model by defining species-dependent plant sensitivity. The transpiration demand of a plant is always defined from the ETo, but depending on species the impact on the stomatal regulation varies. This relationship was calibrated with the results (Braunschweig, Germany, 2007–2008) on maize and [CO2]a concentration experiments [32,33]. This study, which started under the AgMip project [7], showed the importance of the impact of [CO2]a on maize yield in case of non-satisfaction of the water needs of the plant. If for C4 plants (maize, pearl millet, sorghum) it is recognized that the fertilization effect of [CO2]a, out of water stress situation, is negligible on the yield, the maize-FACE experiment allowed to highlight an effect very important in case of high water stress by the indirect effect of reducing transpiration. The measurements showed a very high positive [CO2]a impact on yield under water deficit: 40% increased yield, from 7 Mg ha−1, with ambient [CO2]a, to 9.8 Mg ha−1, with 550 ppm [CO2]a, undergoing the same level of water stress [6,7]. As the impact of [CO2]a relates to an aspect of the stomatal regulation process, in the absence of similar types of measurements to our knowledge, we assume that this type of impact is of the same order of magnitude under different environmental constraints as well as for sorghum and pearl millets which are C4 plants.

2.3.3. Estimation of Crop Yields

To estimate the impact of the evolution of the crop yield on the population, we need to obtain the most accurate crop yields. To achieve this, SARRA-O simulated yields in optimum situations for the period 1986–2005 with all 16 GCMs on each pixel of 0.5° × 0.5° are averaged at the country level (each year) (Equation (1)). Yields are then averaged over the whole period (Equation (2)), pixels, where the yield is null for all years, are excluded from the averages. Therefore, we obtain an average yield per country and per crop. To avoid overestimation of yield due to the reference to an optimum in on-farm conditions, which is not representative of the high variability we may find in those countries (lack of inputs, seed quality, soil variability and fertility), as for bias corrections to weather data, we applied a correction to the yield estimation using FAO yield data: for the same period, we have the average yield per country and per crop provided by FAO. We divide the simulated yield by the FAO yield, which gives us an average correction factor per country and per crop (Equation (3)). Yield simulations from 2041 to 2060 for RCP2.6 and RCP8.5 are then corrected by the same correction factor for each cereal, GCM model and country (Equation (4)), assuming that the correction factor does not change in future climate scenarios.
Y ¯ c , y , k = i = 1 n Y i , y , c , k n
Y ¯ c , k = y = 1986 2005 Y ¯ c , y , k 20
C o r r c , k =   Y ¯ c , k / F A O ¯ c , k
Y ¯ c o r r c , y , k =   C o r r c , k   Y ¯ c , y , k
With:
Y i , y , k = crop yield (kg/ha) at i pixel from the country c (c= Nigeria, Niger, Senegal, Mali or Burkina-Faso), n is the number of pixels for c, k is the crop (maize, pearl millet or sorghum), and the year (y)
Y ¯ c , y , k = average of crop yield at the country level (c) for each crop (k)
Y ¯ c , k = Period average of crop yield between 1986 and 2005 at country level (c) for each crop (k)
C o r r c , k = Crop correction factor at country level (c) for each crop (k)
F A O ¯ c , k = average of observed yield, provided by FAO, for the period 1986-2005 at country level (k)
Y ¯ c o r r c , y , k = average of corrected yield at the country level (c) for each year (y) and each crop (k)

2.4. Estimation of Cereal Production per Capita

The last part of this study compares the evolution of agronomic production (yield multiplied by crop surfaces, provided by FAO stats on http://www.fao.org/faostat/) for maize, pearl millet and sorghum divided by the number of inhabitants in 2050 across West Africa. Our five countries are very contrasting in terms of climate and population evolution and maize, pearl millet and sorghum production among all cereals account for 75%, 98%, 64%, 69% and 93% respectively for Nigeria, Niger, Senegal, Mali and Burkina Faso.
We first estimate the crop production per country by multiplying the annual corrected yield (2041–2060) ( Y ¯ c o r r c , y , k ) by the average harvested area for the period 2008–2017 ( z   =   2008 z   =   2017 S c , k , z 10 ), provided by FAO for each crop (Equation (5)). The choice of this period is justified in order to obtain the cultivated areas corresponding to the current situation at the country level. Production by cereal is summed to obtain a number of kilograms of grain per year per country (Equation (6)).
With:
P ¯ c o r r c , y , k =   Y ¯ c o r r c , y , k   z = 2008 z = 2017 S c , k , z 10
P ¯ c o r r c , y =   k = m a i z e ,   m i l l e t ,   s o r g h u m P ¯ c o r r c , y , k
With:
P ¯ c o r r c , y , k = average of corrected Production at the country level (c) for each year (y) and each crop (k)
S c , k , z = average of the harvested surface at the country level (c) for each crop (k) for the period (z)
P ¯ c o r r c , y =   Total crops Production at the country level (c) for each year (y)
To obtain per capita production around 2050, the country′s total production ( P ¯ c o r r c , y ) is then divided by the country′s average population estimated over the period 2041–2060.

3. Results

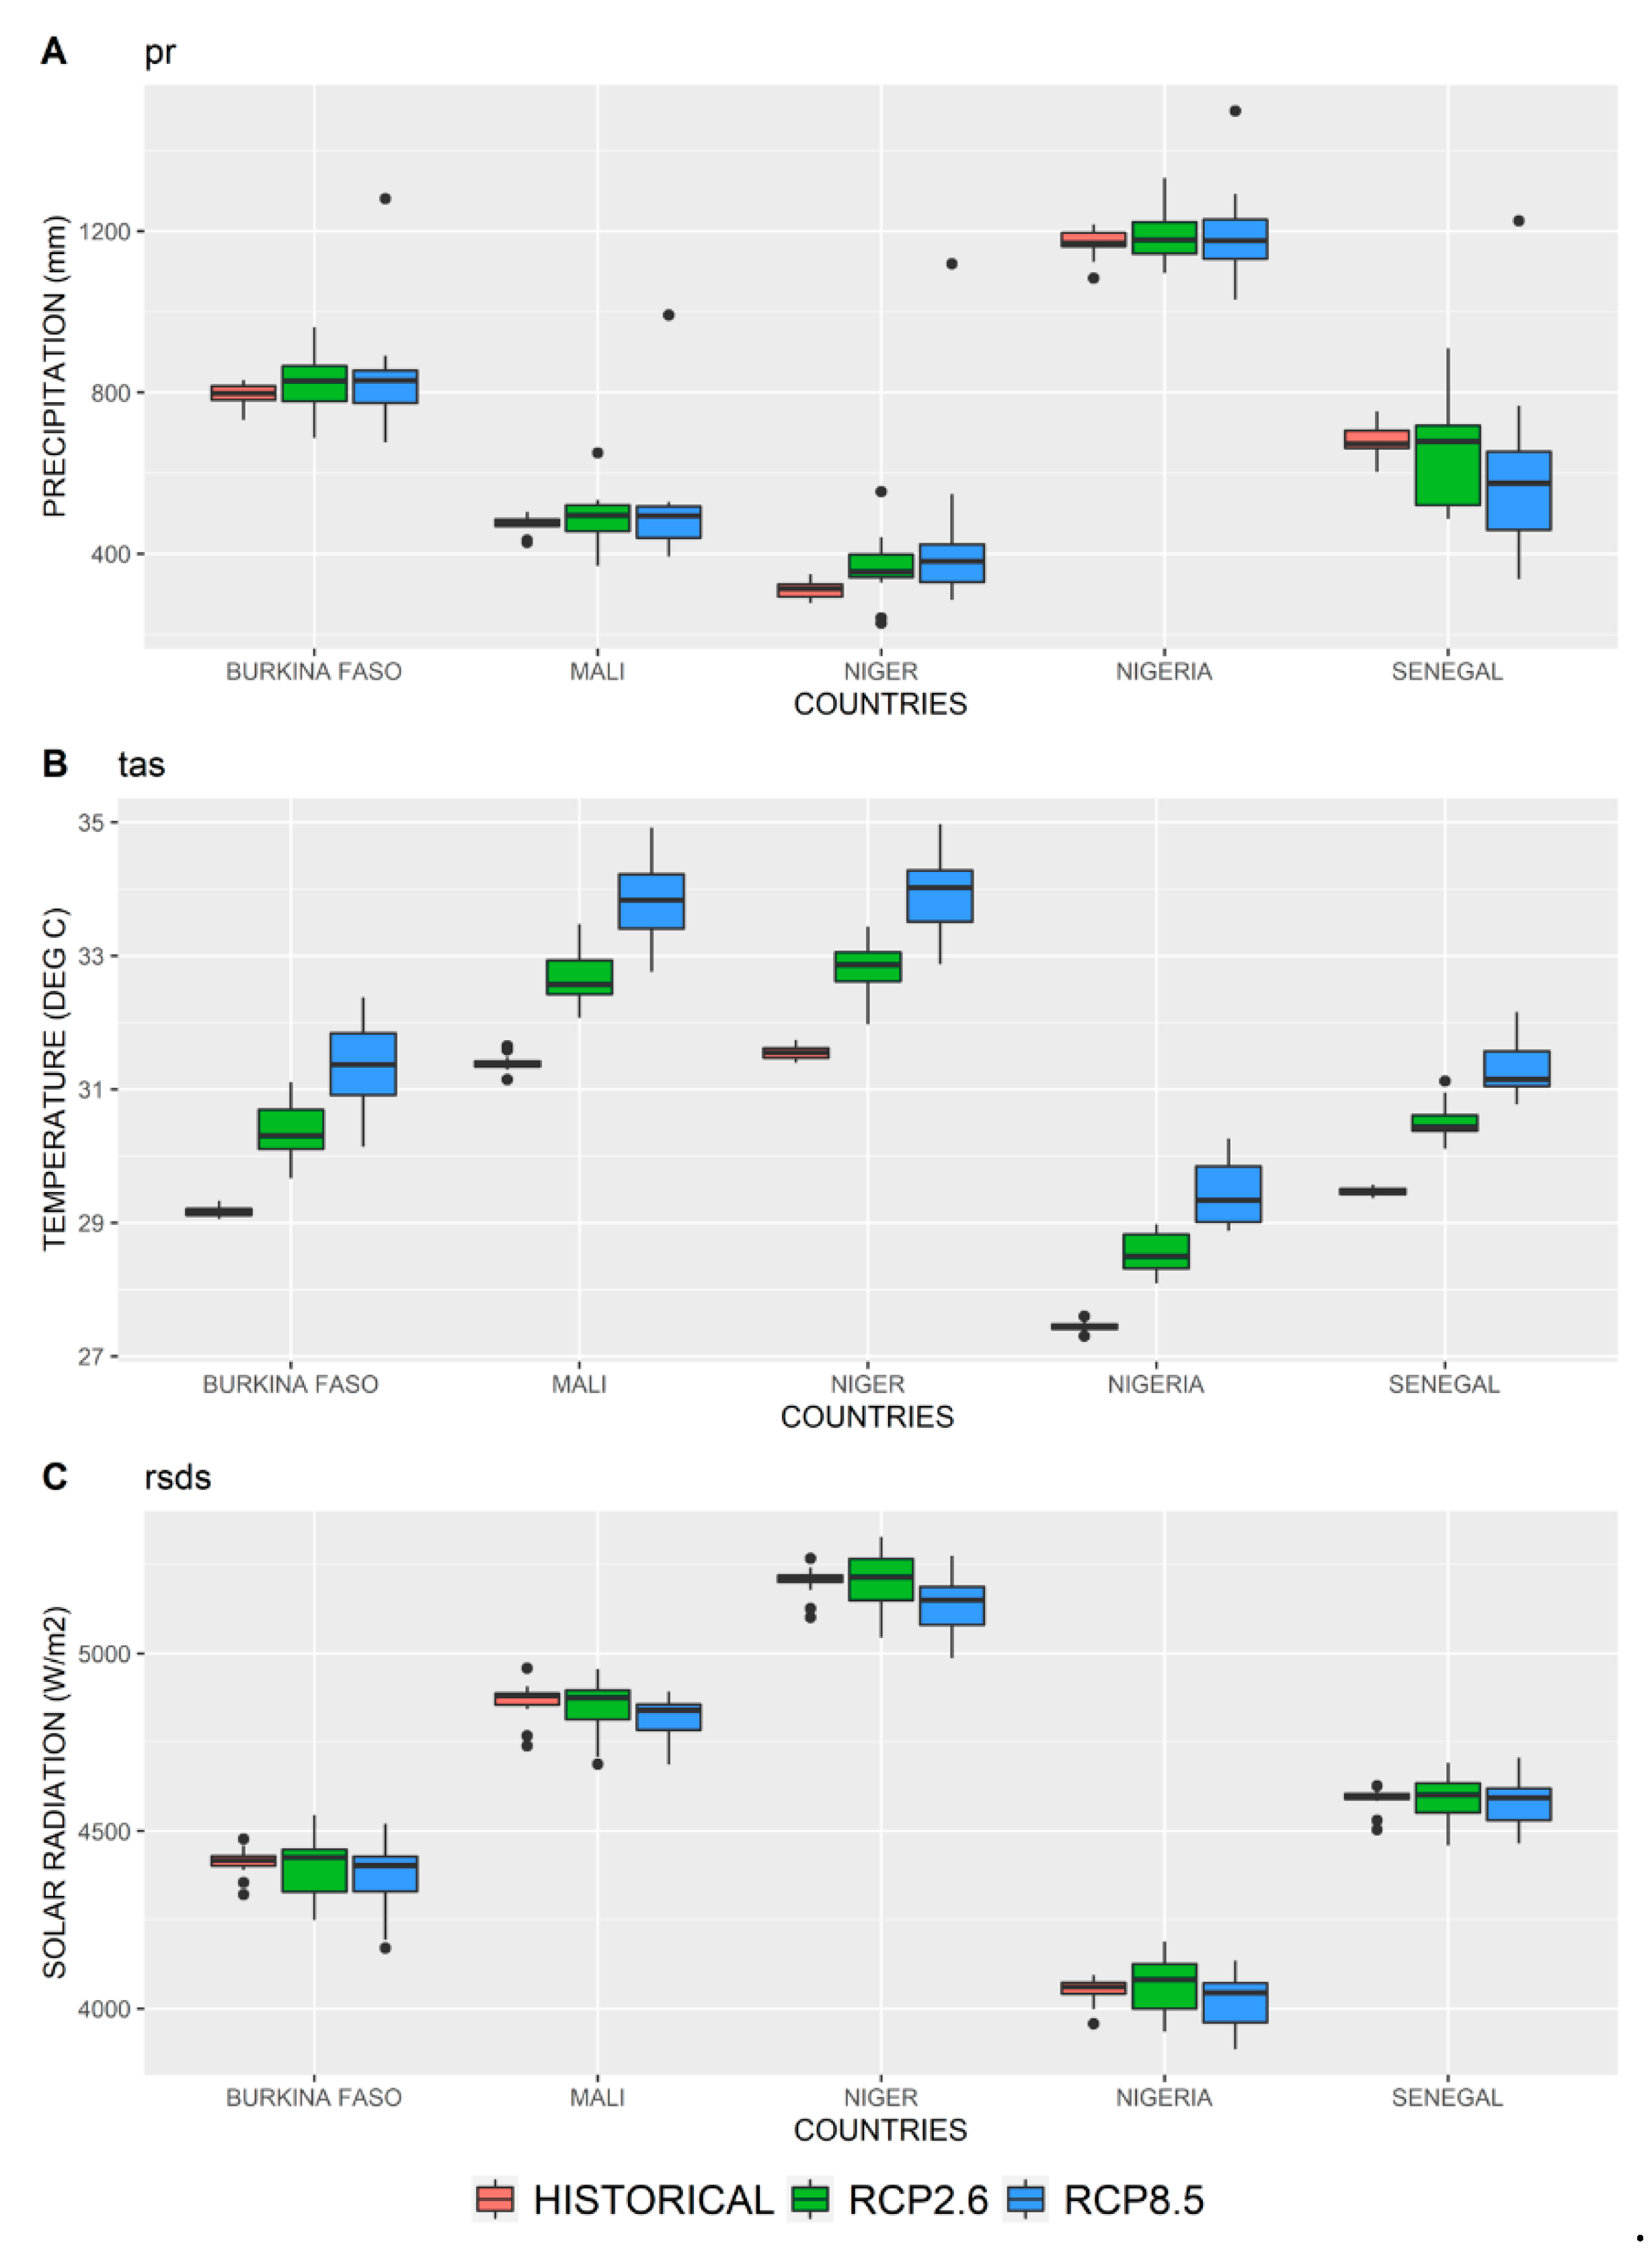
3.1. Climatic Evolution

As shown by [34], the monsoon rainfall is expected to follow different trends by the end of the 21st century in the Western Sahelian area and the Eastern Sahelian area. Taking into account such trends, we analyze all climatic and yield evolution at the country scale; we only retained pixels where at least one of the three cultures studied was present.
The climatic evolution is analyzed with three indicators: precipitation, temperature and solar radiation over April and October period to obtain a common period, where the different cereals are cultivated. The gridded input data, where we observe crop yield, that are simulated by SARRA-O in the historical period, are averaged at the country scale. The evolution of ET0 is not shown and similar to the temperature trend because is computed only with temperature variation (Hargreaves).
Figure 1 shows the distribution of climatic values obtained by the 16 GCMs averaged on the historical period (1986–2006) in red, on the period 2041–2060 for RCP2.6 in green and RCP8.5 in blue. First, due to bias corrections, for the historical period, the intermodel variability of climatic values is very limited for precipitation, temperature and solar radiation. For this historical period, the most contrasted climatic situation is observed for precipitation (Figure 1A and Table 3): maximum rainfall in Nigeria with 1200 mm and in contrast, nearly 300 mm for Niger. For the evolution of precipitation between the historical period, RCP2.6 and RCP8.5, there are little changes for Burkina Faso, Mali and Nigeria. For Niger, there is 21% more rainfall than the median, from 300 to 400 mm of threshold rainfall during the monsoon for RCP8.5. In contrast, rainfall fell sharply in Senegal for RCP8.5 with the median of models falling below 600 mm. The uncertainty, related to the different models, is similar between RCP2.6 and RCP8.5 of the order of + −50 mm around the median. The uncertainty is doubled for Senegal with + - 100 mm. Concerning the temperature (Figure 1B), the highest increase is observed for Burkina Faso, Mali and Niger with 1.5 °C for RCP2.6 and 2.5 °C for RCP8.5 in 2050. For Senegal, the proximity of the Ocean limits the temperature increase to 1 °C for RCP2.6 and 1.5 to 2 °C for RCP8.5. For RCP8.5, model uncertainty is + −0.5 °C. Finally for radiation, for the historical period, in links with the precipitation, the maximum is observed in the North where the precipitation is less important with about 6000 W/M2 for Niger and the minimum in the South with about 4000 W/M2 for Nigeria. In the 21st century, for scenario RCP8.5 and all countries, there is an increase in intermodal radiation variability and an overall decrease in radiation (median results).

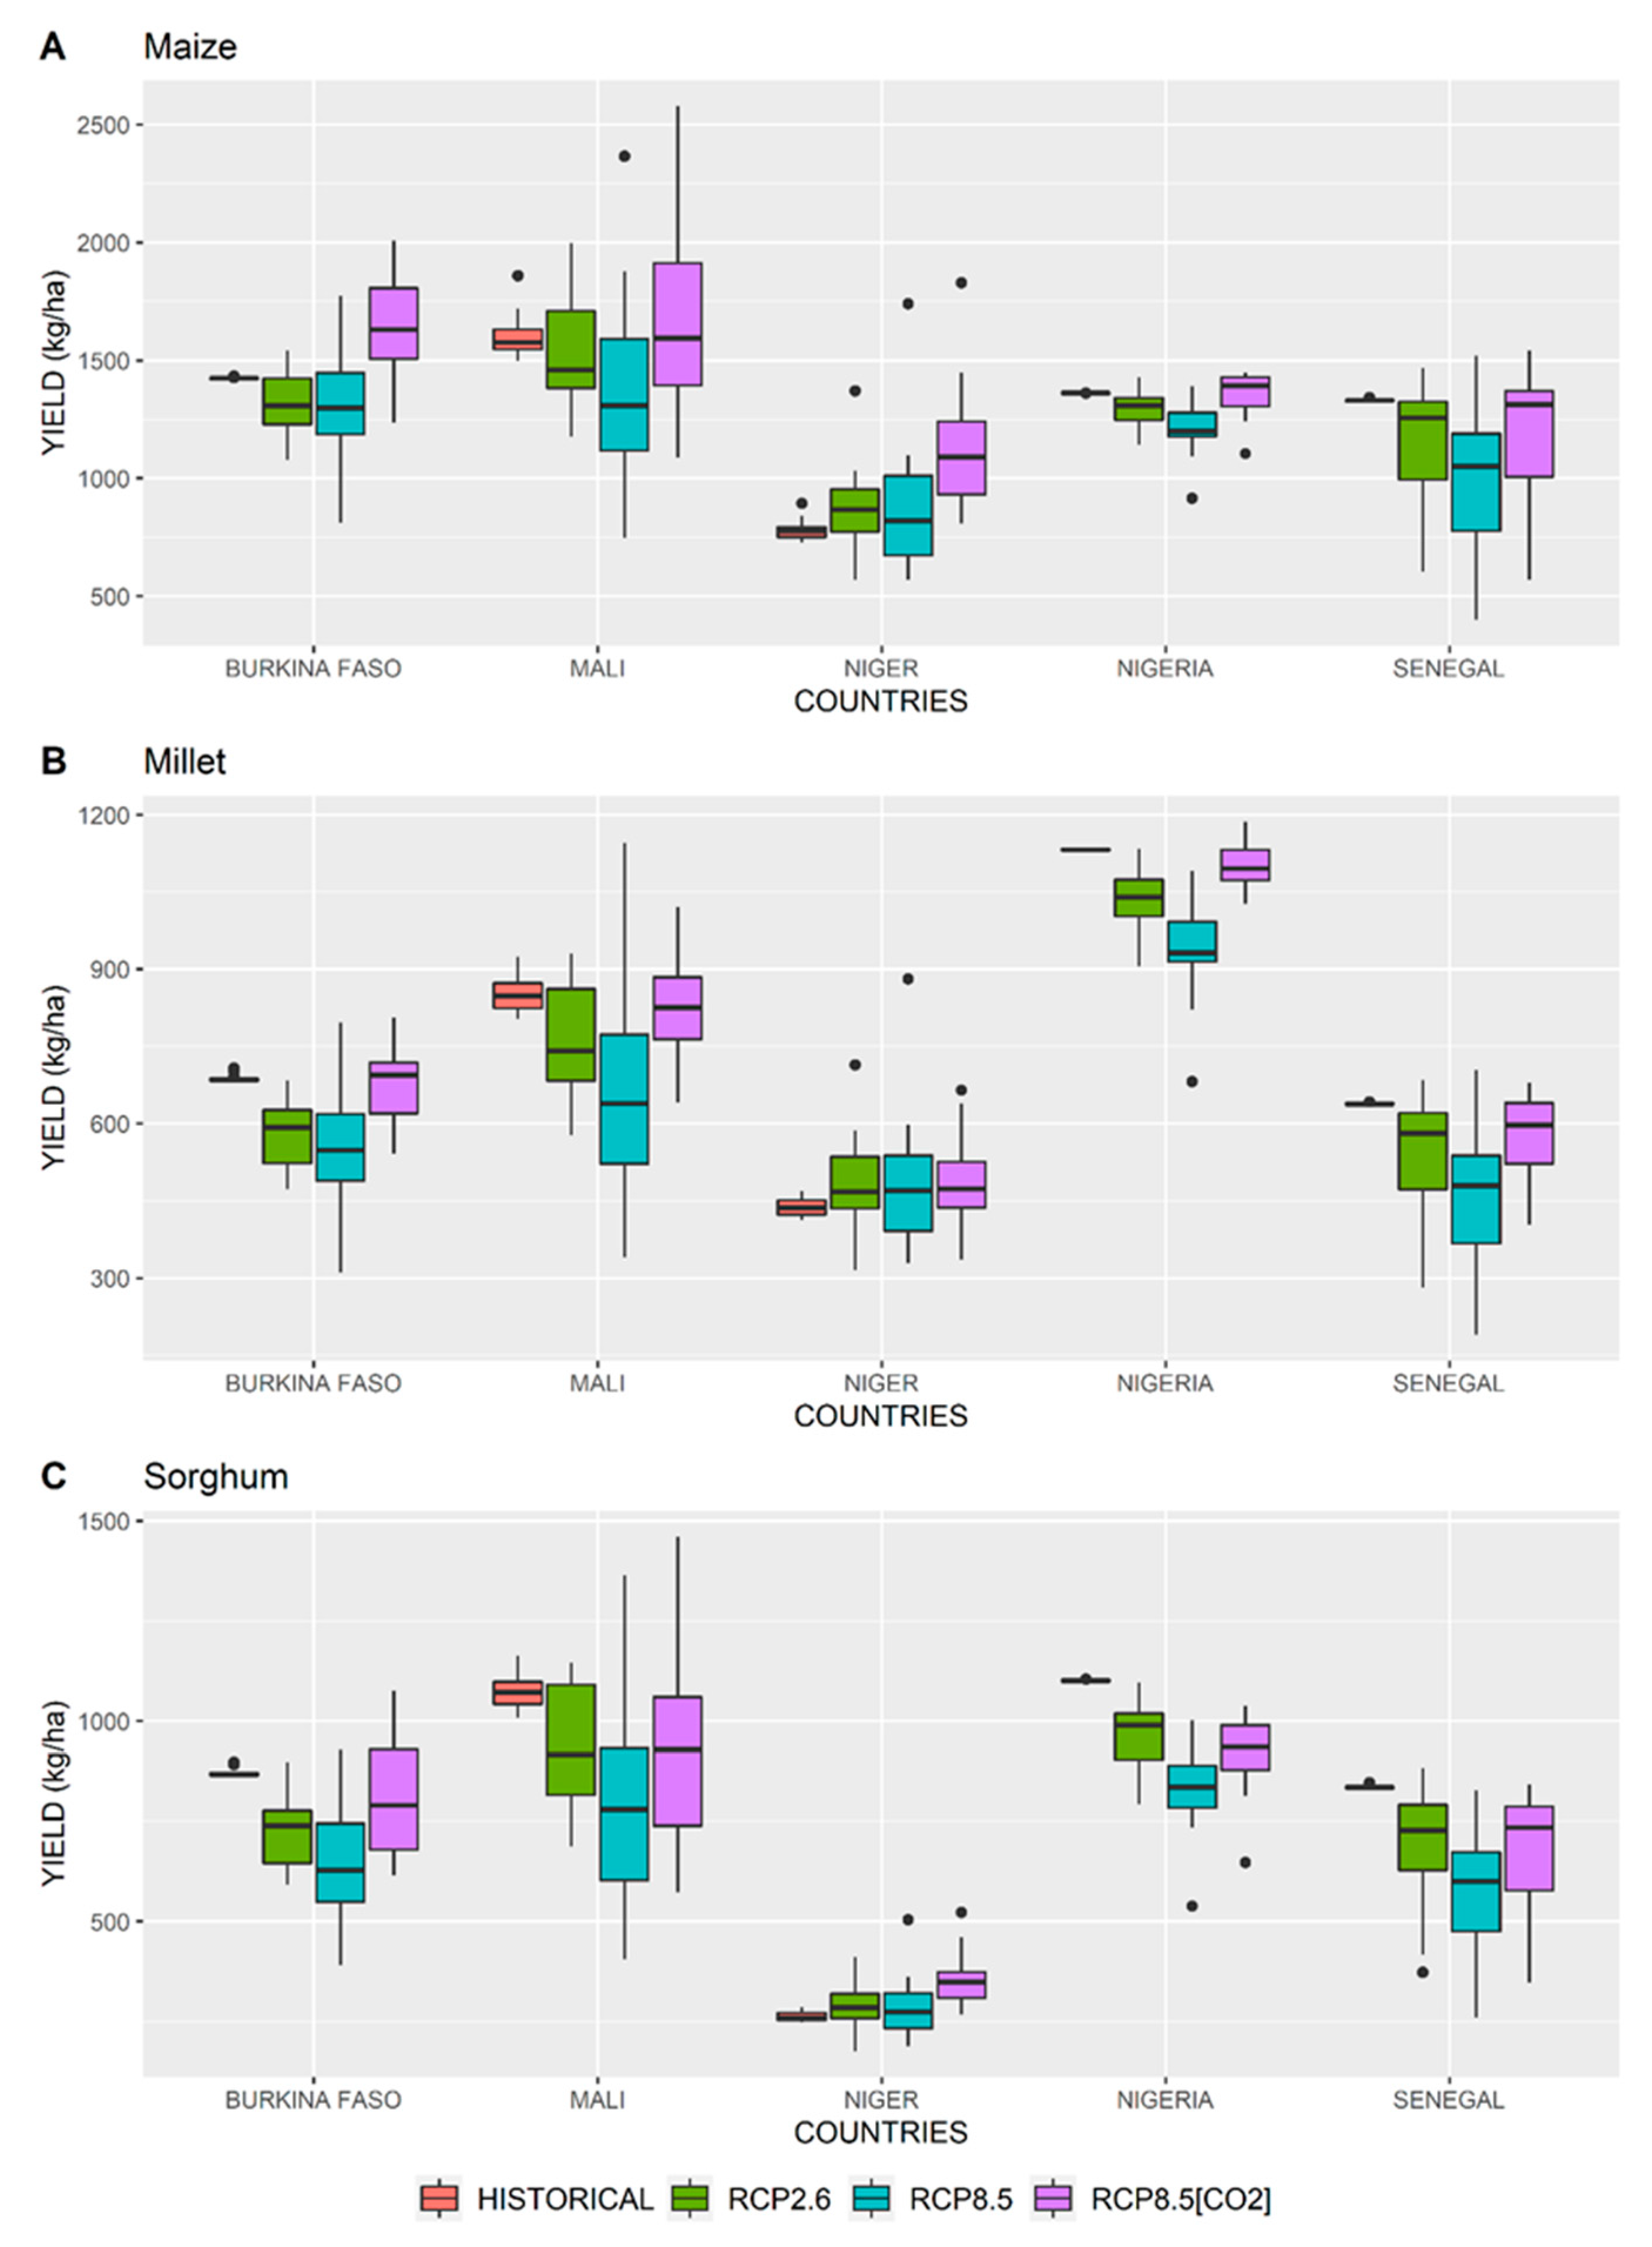
3.2. Evolution of Yields across Five Countries in West Africa

Analyzes were performed on the two scenarios: the most optimistic perspective, already questioned, RCP2.6 and the worst RCP8.5. In the case of RCP8.5, where the increase in [CO2]a is high, further analysis was carried out, taking into account the effects on plant transpiration (RCP8.5 [CO2]a). Results are not shown for the RCP2.6 scenario since this effect is marginal.
First of all, in Figure 2, the analysis of RCP2.6 scenario is carried out for the 5 countries with the evolution of the yield of maize (top), pearl millet (center) and sorghum (bottom) for the period of 2041 to 2060. For Burkina Faso, Mali and Nigeria, median crop yield are 10–15% lower than in the historical period. These performances are explained by the stable precipitation and the increase in temperature. This situation is mainly explained by the combination of three processes: increased potential evapotranspiration, crop maintenance respiration and a reduction of the crop-cycle length [25,35,36]. For Niger, where cultivation of maize is marginal (1%), an increase in crop yield, reaching +10% for maize, is observed. This sharp increase is the result of increased rainfall in dry environment, but must also be put into perspective, provided the low yields of maize, which is marginal, in Niger. For Senegal, the decrease in rainfall under scenario RCP2.6, combined with the effect of temperature, has the strongest impact on the yield of the three cereals, with a decrease of up to 20% compared to the historical period (for the first quantile).
For RCP8.5, the increase in [CO2]a is strong until 550 ppm in 2050, it will be 25% more than we are currently experiencing and the latest studies have shown a strong impact of [CO2]a on crops with these concentrations in drying conditions. The analysis will therefore be carried out in two parts to estimate the impact of the concentration of [CO2]a. In this scenario, as usual, climate change varies greatly between the different models, which leads to projections of very different yields depending on the region and the model. First, the SARRA-O model is used without taking into account the [CO2]a effect on crops (cyan in Figure 2) and then with the CO2 effect (violet in Figure 2).
In the first case, without the effect of [CO2]a, compared with RCP2.6, we have greater variability between models. For maize, pearl millet and sorghum, the trends are similar, with a weakening of crop yield for Mali, Nigeria and Senegal. For the latter country, Senegal, yields can fall by 50% for the three cereals for the most pessimistic climate models. For Burkina Faso, the change between the historical period and RCP2.6 and RCP8.5 are similar for maize and pearl millet. For sorghum, we observe a weakening of the crop yield from about 875 kg/ha in the historical period to 750 kg/ha for RCP2.6 and 600 kg/ha for RCP8.5. For Niger, the increase in rainfall seems to offset the effects of rising temperatures or even making the environment more conducive to growing crops with higher yields. Unlike other countries, the median yield does not change compared to RCP2.6 but the intermodel variability is greater with for example a yield between 600 (1st quartile) and 1000 (3rd quartile) kg/ha for the maize for the period 2041–2060 instead of 750 kg/ha for the historical period.
In the second case with the [CO2]a taking into account in the processes, the effect on yields has been highlighted by various studies [7,11,12,37] and here we study the effect in West Africa. In Figure 2, yields for the 2041–2060 period with the effects of [CO2]a are present (violet color). First of all, the differences with the [CO2]a -free RCP8.5 scenario are visible mainly for maize, which is most sensitive to water stress, and secondly for sorghum and pearl millet. We take into account that [CO2]a improved the efficiency of transpiration for biomass production. Thus, the negative impacts on yields are reduced and conversely the positive impacts, according to the used GCMs, are improved. This increase may be compared with the Face experimentation showing an increase of 40% of the yield with [CO2]a at 550 ppm [33]. On the other hand, for pearl millet and sorghum, the answer is more nuanced according to the countries but yields are comparable, or higher, to those of the historical period. The effects are even more pronounced for maize, more sensitive to water stress and countries bordering the desert (Sahel Belt) subject to more water stress and temperature effects. In fact, for Nigeria and Senegal, yield improvements make it possible to recover the yields obtained with RCP2.6. Conversely, for Burkina Faso, Mali and especially Niger, combined with the upper rainfall effect, there is a gain in yields compared to RCP2.6.
The greater the water stress, the greater the effect of reducing transpiration: these water stresses are important when close to the Sahel Belt (Niger, North: Mali, Senegal and Burkina) and are less important in more humid areas (Nigeria, South: Mali, Burkina and Senegal). For Senegal, there is a negative effect linked to the negative evolution of the rains and on the contrary, in Niger, we observe a strong positive evolution of the rains combined with the effect of less transpiration which improves the efficiency of the rains. This implies changes in yields that are no longer marked by the same general trend linked to the impacts of climate change as a function of spatial variability (latitudinal and longitudinal), particularly very marked for rainfall, of the key factors (climate, soil, plant) on yields:
-
a negative and relatively homogeneous effect of a strong temperature increase on the reduction of the cycle and the reduction of the biomass produced by an increase in maintenance respiration),
-
a predominantly negative effect and a fairly small decrease in solar radiation,
-
an effect that can be opposite and more or less strongly marked depending on the evolution, positive or negative, of precipitations according to the areas described above,
-
an effect of reducing the impact of water stress by reducing the transpiration demand of plants, less water consumption in the soil, this effect expressing itself all the more strongly as we are in areas where the lack of water is the most marked (Sahel Belt).
Due to this high variability of environmental constraints and evolutions perspectives, especially for rainfall, analyses and actions related to food security, adaptation and resilience to the impacts of climate change must be carried out by distinguishing homogeneous zones combining the evolution of key factors impacting yields and must then be adapted, if necessary, to administrative scales: spatialized crop models are particularly suitable in this context.

3.3. Evolution of Agronomic Yields Production per Capita

Figure 3 presents the results with the historical run (red), RCP2.6 (green) and the RCP8.5 [CO2]a. On the top, we use a population that is fixed at its 2010 rate, at the center of the low scenario of the UN and at the bottom of the high scenario of the UN.
With the historical period (red), values range from 80 kg/capita (Senegal) to over 400 kg/capita (Niger). Cereal self-sufficiency is only achieved by Burkina Faso, Mali and Niger which produce more than 250 kg/capita/year, a threshold set by the FAO and widely accepted [38]. Senegal and Nigeria, the richest of the five countries, have the lowest values below 100 kg/capita. If we analyze the importation of maize in using FAO Stat data (http://www.fao.org/faostat/), Senegal and Nigeria import many cereals compared to the other countries where the importation is very limited and the population consumes the national production.
The constant population scenario (Figure 3A) is only a projection reflecting trends in the impact of climate change on per capita production. Total production (maize, pearl millet and sorghum) is analyzed by multiplying the yield of each cereal by its cultivated area (countries average of the FAO stat over the period 2008 to 2017). We then obtain a weighted average (by country) of the evolution of yields. As the areas cultivated by species do not change, the trends observed in production are similar to those described for yields. Trends observed for the RCP2.6 (green) in comparison with the historical period show a stable median for Nigeria and Senegal, a decrease of 35 kg per capita for Burkina Faso and Mali and an increase by about 20 kg per capita for Niger. With the RCP8.5 (in blue), the median of the total production for Burkina Faso (−50 kg per capita), Mali (−60 kg per capita), Nigeria (−15 kg per capita) and Senegal (−15 kg per capita). Only Niger obtains a gain in median production with the RCP8.5 (+10 kg per capita). Finally, in Figure 3A, in violet, the evolution of RCP8.5 [CO2]a scenario is shown. For Mali, Nigeria and Senegal, the results are similar to the RCP2.6. For Burkina Faso, the median production is the same as the historical production at 225 kg per capita. For Niger, a light increase is obtained in comparison with the RCP2.6 and the RCP8.5 without [CO2]a effect.
In a second instance, we analyze the impacts of the population growth with a “low” scenario (Figure 3B) and a “high” scenario (Figure 3C). As a reminder, compared to the current population, an increase between 236% (Nigeria) and 384% (Niger) is projected for the lowest scenario and between 283% (Nigeria) and 451% (Niger) for the highest (Table 3). Compare to this evolutions, the evolution between the different climate scenarios on each country (RCP2.6, RCP8.5 and RCP8.5 [CO2]a) is then negligible on the number of kg per capita in 2050. The same trends between climate scenarios are observed for both population scenarios, with a larger decline of about 10% for the high population growth. With the exception of Mali (for the “low” demographic evolution), no country reaches 100 kg per capita. Mali obtains the best results with about 100 kg per capita for the “low” evolution and 75 kg per capita for the “high” evolution. For Burkina Faso, there are between 50 and 100 kg per capita. For Nigeria and Senegal, the number of kg per capita is divided by approximately 2, reaching 50 kg per capita for the first and 25 kg per capita for the second. Finally, Niger, given its demographic dynamics, suffers the most from the drop in kg of cereals per capita divided by 4.51 compared to the results with a constant population to reach around 60 kg per capita.
Taking into account demographic evolution, the losses of kg per capita is generalized for all climatic scenarios with the low and high population trend and show that for 2050, the problem is more related to the demographic evolution than to the evolution of agronomic yields.

4. Discussion

This study aims to assess the capacity of countries to feed their own population in the near future (in 30 years in 2050), on five contrasting countries in West Africa. This study analyzes and integrates the impacts of probable trends in the future in three main topics for nutrition satisfaction per capita: climate change, agronomy and crop yield simulation, population growth. The discussion addresses these three topics’ strengths as well as uncertainties or limits.

4.1. Uncertainty on the Crop Yield in View of Climate Constraint

To estimate the uncertainty on the climate change projection in West Africa, we use several CMIP5 models to obtain the dispersion of climatic responses due to global change. This dispersion provides a measure of the uncertainty even if it remains partial because there are processes that are poorly or not represented in the GCMs. Therefore, the uncertainty can be greater than the dispersion between models.
Across West Africa, several studies show that for the RCP8.5 scenario, the response of the models can vary from −20% to +40% of precipitation in 2050 [5,39,40]. However, these differences are accompanied by intra-regional variation. For example, [34] showed that, according to the CMIP5 models, there was generally an increase in precipitation in the Eastern Sahel and a decrease in the Western Sahel which was accompanied by less abundant precipitation at the beginning of the monsoon season and more abundant at the end of the season [41]. The application of these issues to the CMIP5 model set allowed us to group them into four groups [42]. Our results in 2050 reproduce these observations with, for example, a majority of the models (three out of four Monerie’s groups) which predict a sharp drop in precipitation in Senegal.

4.2. The CO2 Effects on the Crop Yield

The use of [CO2]a in simulations by the SARRA-O crop model results in a reduction of the negative effects of water stress on yields for C4 plants [6,7,11,33]. The most notable point is that this consideration in the RCP8.5 [CO2]a scenario significantly reduced the negative impact of other climate key factors to near negative impacts predicted by the RCP2.6 scenario.
Our results showed that the increase in [CO2]a, mainly in the arid zone, due to the impact of greater water stress, would compensate for the simulated yield decreases in the absence of accounting ([CO2]a effect in the processes). Among other things, [CO2]a will reduce plant transpiration, thus reducing the effects of water stress on crop yields as showed by FACE experience [33]. Our increase in crop yield is greater than the FACE experience that was performed in temperate and non-tropical or arid environments where there is a less combined impact of high temperature and water stress on the plant. The results of this study are consistent with other studies. Indeed, several studies, like [43], note a dependence of the environment on the [CO2]a effect. These authors also demonstrate that the [CO2]a effect will be more beneficial in areas with water deficits such as in the Sahel.
In the SARRA-O crop model processes, only the impact of [CO2]a on transpiration is taken into account for C4 plants, through the correction of the evapotranspirative demand ETo according to the [CO2]a level. This relationship was verified with experiments in controlled environments and field experiments with [CO2]a levels above 550 ppm, for higher levels the relationship is less stable and, above all, raises the question of the impact of excessively high temperature. Despite this simple approach, the results of SARRA-O are comparable with the other results in [7], with, in the meantime, an improvement in the predictive capacity of the model regarding this FACE experiment.
The processes involved in the [CO2]a effect is still a subject of study and the processes implemented can be strongly disturbed by the increase in temperature which is correlated with the increase of [CO2]a and therefore on the applied correlation within the SARRA-O model.

4.3. Impacts on Population and Adaptation

Our study shows that the very high demographic growth is the predominant factor in decreasing food availability per capita; more than the evolution of yields. If there is no change in the actual agronomic performance, for all climate scenarios and despite the increase in [CO2]a and some positive effects on yield in arid environments, it is currently not possible to absorb population growth by 2050. The ratio crop production/capita could provoke population displacement as historically during the 1970s in the Sahel where the consequences of the severe drought were mainly the migrations from the North to the South [44] and to the cities [45]. In the future, the kg per capita could be lower than our estimate because the number of people could be less important by decreasing birth rate or person migration [46].
In West Africa, there is a yield gap between current farm production and the potential yields that could be achieved. This would require removing technological barriers by transferring technology [47]. However, several studies, including trick, show that filling the yield gap would not be enough and that it would also be necessary to make crop expansions [48]. To study the link between current yields and the agronomic potential obtained using new technologies, the adaptation techniques to increase the crop yield and the expansion of the culture area could be a solution that could be roughly estimated by a simple approach. The baseline production provided by corrected results of SARRA-O in 2041–2060 is multiplied by a factor 1.2 (corresponds to an increasing of yield by 20%), 1.5 (increasing of yield by 50%), 1.44 (increasing of yield by 20% and cultivated area by 20%) or 1.8 (increasing of yield by 50% and cultivated area by 20%). The 20% increase of yield corresponds to the average gain obtained in a meta-analysis on the potential gains of adaptation in the 21st century [49]. For the 50% increase, [50] shows that this target is possible for maize. For [25], this is a potential increase for sorghum but should currently be limited to 30% [51]. The gain could then also occur through better fertilization [52] but would increase the climate risk on the culture [53]. The 50% gain is therefore a high limit that would be possible by combining several adaptation techniques including the management of soil moisture and irrigation [54].
For the expansion of agricultural land to increase production, a threshold of 20% maximum seems consistent with the observations of [48] which indicate that the margin of progression is low. The causes are diverse but we can quote—for West Africa—the competition with the urbanization [55], the conversion of forest into arable land and the cost [56]. Moreover, for some countries, the maximum capacity (Nigeria) of cropland is already almost reached [48]. For the low population scenario with the RCP8.5 [CO2]a, the best results are obtained by Mali with an increase of the kg per capita reach 175 kg per capita in the case of an increase in yields of 50% and an increase of 20%. Burkina Faso is second with a median of 160 kg per capita with the same adaptation. Nigeria and especially Senegal have the least progress due to the worst yield evolution with RCP8.5 [CO2]a. Finally, for Niger, the increase in agricultural production is very insufficient to counter the strong demographic evolution even in the low scenario. With the high population scenario, the number of kg per capita can reach a weakening of 30 kg per capita for Mali in comparison with the low scenario and a limited weakening for Nigeria and Senegal with 15 kg per capita. In all cases, there is no way to reach 250 kg per capita for all the countries, whether for a demographic change corresponding to the low or high scenario of the UN. With adaptation techniques, yield forecasts and areas usable for agriculture, there is currently no way to contain the gain of population.

5. Conclusions

This study, reported at the country level, combines the knowledge and trends of key factors from social sciences, physical environmental sciences and biological and agronomic sciences. Variability and uncertainty are the keywords of this study in WA: climatic, demographic, yields and production. Firstly, there is a very high spatial and temporal variability of environmental constraints, particularly climatic: monsoon phenomena, latitudinal and longitudinal variability, single to double rainy seasons, crops, stormy rains (i.e., the start of the monsoon can vary by more than two months in the same place from year to year). Thus, climate change forecasts also have a higher uncertainty, accentuated by a lower level of knowledge of the phenomena in relation to the available measurement networks. Finally, in this context of strong spatiotemporal climate variability, the spatial resolution (0.5 square degrees) used to compare the different GCM scenarios also impacts the quality of the forecasts. This issue also affects the results of yield simulations and scale transitions: from plot to territory and region. In WA, the overwhelming majority of agriculture is represented by small-scale family farming with a number of key specificities: a very low investment capacity and level of intensification, the predominant use of “local” varieties, sowing management practices adapted to the great variability of crop season onset, very high variability of yields within plots and villages. Finally, demographic monitoring and trends are often on rough scales and are also subject to significant uncertainty.
In order to best address these uncertainties, we took the option of using a set of scenarios to capture this uncertainty and estimate its magnitude. In the climatic context, we used 16 GCMs that were previously unbiased and two climatic scenarios: the most optimistic perspective, already questioned, RCP2.6 and the worst RCP8.5. In addition, with reference to the latest studies, this analysis integrates and compares the effects of considering the atmospheric CO2 concentration on C4 plants (maize, sorghum, pearl millet), which can strongly influence yields in water stress situations. To estimate yields and the specificities of small-scale family farming, the main farming strategies were simulated by: (i) a “local” variety for each species, (ii) a sowing management scenario adapted to the variability of the start of the cropping seasons and, finally, (iii) a farmer optimum yield more representative of the potential observed in these regions. As far as demography is concerned, we retained two trends selected by the FAO: the weakest and the strongest. Finally, with a view to adaptation capacities, scenarios of likely increase in yield and cultivated areas were once again selected.
The use of 16 global circulation models leads to different trends of rainfall under RCP2.6 scenario and mostly RCP8.5 scenario as [5,34] and which showed an increase of precipitation in the Eastern Sahel area and a more nuanced result in the Western Sahel area. Concerning the impacts on yields, with the RCP8.5, the evolutions are not so homogeneous, we observe some difference between maize on the one hand and the pearl millet and sorghum on the other hand due to the difference of the optimal temperature for the phenology development that is lower by two degrees for maize in comparison with pearl millet and sorghum and less sensitivity to water stress. The results are similar to the different studies presented in [3]. However, taking into account the effects of [CO2]a increases crop yield in all countries, especially under water stress as in Niger. The effect is most significant for maize, which increases of the median yield by about 30% in Burkina Faso and Niger, in Senegal and Nigeria, the increase is more moderate and the crop yield is comparable with RCP2.6 scenario. For pearl millet and sorghum, the same consequences are visible but less marked.
Despite these results, the total crop country production per capita decreases for the five countries (Burkina Faso, Nigeria, Niger, Senegal and Mali) in relation to the UN population scenarios. These values decrease from 60% to 80% with the highest population growth scenario under RCP8.5 [CO2]a. If the scenario of lowest population growth is considered, the decline is reduced by a few percent and therefore remains very important. Above all, it should be noted that this production is well below the minimum recommended threshold to meet the population′s energy needs.
We found that demographic trends play the largest role in the first half of the 21st century in the assessment of hotspots of climate change impacts in the region. Indeed, if projection trends for the five countries could experience a more favorable climate for agriculture, with more rainfall, the population is projected to increase more rapidly (as in Niger) and the number of people threatened by climate change will be greater in this region. To support the increase of the populations in West Africa, we discussed four hypotheses of adaptations: the increase of the yields fixed to 20% or 50% with or without an extension of the culture area by 20%. The gain of crop yield could be reached with different techniques of adaptations implying a strong evolution in development and investment capacities: access to seeds, inputs, market regulation, infrastructures. Despite the gains that we could achieve for yields, the demographic dynamics of the five countries studied are too strong, even for the Low scenario. Obviously, in the future, with current agricultural adaptation techniques, climatic change and particularly the population increase in West Africa will lead to strongest difficulty for food security and probably rise in local and international migrations [57,58]. However, to estimate the migration with the relation between the crop yield evolution and the demography is a challenging task and to our knowledge, very few studies exist, e.g., [59,60].
Many uncertainties or lack of knowledge are present in this study. Several possible avenues of study could reduce these uncertainties or improve our knowledge. One of the highest sources of uncertainty in estimating production is the estimation of cultivated land use and area. Ongoing studies based on both new earth observation satellites such as Sentinels and new methodologies for surveying cultivated areas offer a set of promising new perspectives in an environment where the size of cultivated plots is very small (a few ha). In addition, the very high spatial and temporal variability of the climate implies the adaptation of farmers′ practices and strategies. If, on the one hand, sowing strategies, as well as specificities of local varieties, are taken into account in crop growth simulation scenarios, the management of varietal choice according to annual variability in the length of the cropping season and farmers′ adaptation strategies can be considered and, above all, improved through the SARRA-O spatialized cropping model. Finally, with regard to the potential for resilience and adaptation to climate variability and change, addressed in this analysis from a simple perspective of probable prospects, simulations integrating water-saving techniques (impact of soil mulch cover) and varietal adaptation or varietal improvement techniques through the analysis of interest of the varietal traits in the environmental context would make it possible to credit these global prospects.

Supplementary Materials

The following are available online at https://www.mdpi.com/2071-1050/12/18/7585/s1, Figure S1: List of 16 available CMIP5 models used for historical and RCP simulations.

Author Contributions

Conceptualization D.D., C.B., and B.S.; methodology D.D., C.B., A.M.F. and B.S.; software, M.C.; formal analysis, D.D.; writing—original draft preparation, D.D.; writing—review and editing, D.D., C.B. and B.S.; All authors have read and agreed to the published version of the manuscript.

Funding

This research was funded by NERC/DFID, grant number NE/M020126/1 and the APC was funded by B.S.

Conflicts of Interest

The authors declare no conflict of interest.

References

  1. Ickowicz, A.; Ancey, V.; Corniaux, C.; Duteurtre, G.; Poccard-Chappuis, R.; Touré, I.; Vall, E.; Wane, A. Crop-livestock production systems in the Sahel—Increasing resilience for adaptation to climate change and preserving food security. In Proceedings of the Building Resilience for Adaptation to Climate Change in the Agriculture Sector, Rome, Italy, 23–24 April 2012; pp. 261–294. [Google Scholar]
  2. Taylor, K.E.; Stouffer, R.J.; Meehl, G.A. An overview of CMIP5 and the experiment design. Bull. Am. Meteorol. Soc. 2012, 93, 485–498. [Google Scholar] [CrossRef] [Green Version]
  3. Kirtman, B.; Power, S.B.; Adedoyin, J.A.; Boer, G.J.; Bojariu, R.; Camilloni, I.; Doblas-Reyes, F.J.; Fiore, A.M.; Kimoto, M.; Meehl, G.A.; et al. Near-term climate change: Projections and predictability. In Climate Change 2013: The Physical Science Basis. Contribution of Working Group I to the Fifth Assessment Report of the Intergovernmental Panel on Climate Change; Cambridge University Press: Cambridge, UK; New York, NY, USA, 2013. [Google Scholar]
  4. Christensen, J.H.; Krishna Kumar, K.; Aldrian, E.; An, S.-I.; Cavalcanti, I.F.A.; de Castro, M.; Dong, W.; Goswami, P.; Hall, A.; Kanyanga, J.K.; et al. Climate phenomena and their relevance for future regional climate change. In Climate Change 2013: The Physical Science Basis. Contribution of Working Group I to the Fifth Assessment Report of the Intergovernmental Panel on Climate Change; Stocker, T.F.D., Qin, G.-K., Plattner, M., Tignor, S.K., Allen, J., Boschung, A., Nauels, Y.X., Eds.; Cambridge University Press: Cambridge, UK; New York, NY, USA, 2013. [Google Scholar]
  5. Oettli, P.; Sultan, B.; Baron, C.; Vrac, M. Are regional climate models relevant for crop yield prediction in West Africa? Env. Res. Lett. 2011, 6, 14008. [Google Scholar] [CrossRef]
  6. Famien, A.M.; Janicot, S.; Ochou, A.D.; Vrac, M.; Defrance, D.; Sultan, B.; Noël, T. A bias-corrected CMIP5 dataset for Africa using the CDF-t method—A contribution to agricultural impact studies. Earth Syst. Dyn. 2018, 9, 313–338. [Google Scholar] [CrossRef] [Green Version]
  7. Knox, J.; Hess, T.; Daccache, A.; Wheeler, T. Climate change impacts on crop productivity in Africa and South Asia. Env. Res. Lett. 2012, 7, 34032. [Google Scholar] [CrossRef]
  8. Kellner, J.; Houska, T.; Manderscheid, R.; Weigel, H.; Breuer, L.; Kraft, P. Response of maize biomass and soil water fluxes on elevated CO2 and drought—From field experiments to process-based simulations. Glob. Chang. Biol. 2019, 25, 2947–2957. [Google Scholar] [CrossRef]
  9. Durand, J.L.; Delusca, K.; Boote, K.; Lizaso, J.; Manderscheid, R.; Weigel, H.J.; Ruane, A.C.; Rosenzweig, C.; Jones, J.; Ahuja, L.; et al. How accurately do maize crop models simulate the interactions of atmospheric CO2 concentration levels with limited water supply on water use and yield? Eur. J. Agron. 2018, 100, 67–75. [Google Scholar] [CrossRef]
  10. KC, S.; Lutz, W. The human core of the shared socioeconomic pathways: Population scenarios by age, sex and level of education for all countries to 2100. Glob. Environ. Chang. 2014, 42, 181–192. [Google Scholar] [CrossRef] [Green Version]
  11. United Nations—Department of Economic and Social Affairs. World Population Prospects: The 2017 Revision; United Nations: New York, NY, USA, 2017. [Google Scholar]
  12. United Nations—Department of Economic and Social Affairs. World Population Prospects Database. Available online: https://population.un.org/wpp/ (accessed on 22 February 2019).
  13. Sultan, B.; Parkes, B.; Gaetani, M. Direct and indirect effects of CO2 increase on crop yield in West Africa. Int. J. Clim. 2019, 39, 2400–2411. [Google Scholar] [CrossRef] [Green Version]
  14. Parkes, B.; Defrance, D.; Sultan, B.; Ciais, P.; Wang, X. Projected changes in crop yield mean and variability over West Africa in a world 1.5K warmer than the pre-industrial era. Earth Syst. Dyn. 2018, 9, 119–134. [Google Scholar] [CrossRef] [Green Version]
  15. Kogo, B.K.; Kumar, L.; Koech, R.; Langat, P. Modelling impacts of climate change on maize (Zea mays L.) Growth and productivity: A review of models, outputs and limitations. J. Geosci. Env. Prot. 2019, 7, 76–95. [Google Scholar]
  16. Michelangeli, P.; Vrac, M.; Loukos, H. Probabilistic downscaling approaches: Application to wind cumulative distribution functions. Geophys. Res. Lett. 2009, 36, 11. [Google Scholar] [CrossRef]
  17. Vrac, M.; Drobinski, P.; Merlo, A.; Herrmann, M.; Lavaysse, C.; Li, L.; Somot, S. Dynamical and statistical downscaling of the French Mediterranean climate: Uncertainty assessment. Nat. Hazards Earth Syst. Sci. 2012, 12, 2769–2784. [Google Scholar] [CrossRef] [Green Version]
  18. Weedon, G.P.; Balsamo, G.; Bellouin, N.; Gomes, S.; Best, M.J.; Viterbo, P. The WFDEI meteorological forcing data set: WATCH Forcing Data methodology applied to ERA-Interim reanalysis data. Water Resour. Res. 2014, 50, 7505–7514. [Google Scholar] [CrossRef] [Green Version]
  19. Moss, R.H.; Edmonds, J.A.; Hibbard, K.A.; Manning, M.R.; Rose, S.K.; van Vuuren, D.P.; Carter, T.R.; Emori, S.; Kainuma, M.; Kram, T.; et al. The next generation of scenarios for climate change research and assessment. Nature 2010, 463, 747–756. [Google Scholar] [CrossRef]
  20. Collins, M.; Knutti, R.; Arblaster, J.; Dufresne, J.-L.; Fichefet, T.; Friedlingstein, P.; Gao, X.; Gutowski, W.J.; Johns, T.; Krinner, G.; et al. Long-term climate change: Projections, commitments and irreversibility. In Climate Change 2013: The Physical Science Basis. Contribution of Working Group I to the Fifth Assessment Report of the Intergovernmental Panel on Climate Change; Stocker, T.F.D., Qin, G.-K., Plattner, M., Tignor, S.K., Allen, J., Boschung, A., Nauels, Y.X., Eds.; Cambridge University Press: Cambridge, UK; New York, NY, USA, 2013. [Google Scholar]
  21. Baron, C.; Sultan, B.; Balme, M.; Sarr, B.; Traore, S.; Lebel, T.; Janicot, S.; Dingkuhn, M. From GCM grid cell to agricultural plot: Scale issues affecting modelling of climate impact. Philos. Trans. R. Soc. B Biol. Sci. 2005, 360, 2095–2108. [Google Scholar] [CrossRef] [Green Version]
  22. Dingkuhn, M.; Baron, C.; Bonnal, V.; Maraux, F.; Sarr, B.; Sultan, B.; Forest, F. Decision support tools for rainfed crops in the Sahel at the plot and regional scales. In Decision Support Tools for Smallholder Agriculture in Sub-Saharan Africa—A Practical Guide’; IFDC: Muscle Shoals, AL, USA, 2003; pp. 127–139. [Google Scholar]
  23. Kouressy, M.; Dingkuhn, M.; Vaksmann, M.; Bryan, A. Adaptation to diverse semi-arid environments of sorghum genotypes having different plant type and sensitivity to photoperiod. Agr. For. Meteorol. 2008, 148, 357–371. [Google Scholar] [CrossRef]
  24. Traoré, S.B.; Alhassane, A.; Muller, B.; Kouressy, M.; Somé, L.; Sultan, B.; Oettli, P.; Siéné Laopé, A.C.; Sangaré, S.; Vaksmann, M. Characterizing and modeling the diversity of cropping situations under climatic constraints in West Africa. Atmos. Sci. Lett. 2011, 12, 89–95. [Google Scholar] [CrossRef]
  25. Sultan, B.; Roudier, P.; Quirion, P.; Alhassane, A.; Muller, B.; Dingkuhn, M.; Ciais, P.; Guimberteau, M.; Traore, S.; Baron, C. Assessing climate change impacts on sorghum and millet yields in the Sudanian and Sahelian savannas of West Africa. Environ. Res. Lett. 2013, 8, 014040. [Google Scholar] [CrossRef]
  26. Sultan, B.; Defrance, D.; Iizumi, T. Evidence of crop production losses in West Africa due to historical global warming in two crop models. Sci. Rep. 2019, 9, 12834. [Google Scholar] [CrossRef] [Green Version]
  27. Baron, C.; Bonnal, V.; Dingkuhn, M.; Maraux, F.; Sarr, M. SARRA-H: Système d’analyse regional des risques agroclimatiques-habille (System for regional analysis of agro-climatic risks). In Decision Support Tools for Smallholder Agriculture in Sub-saharan Africa: A Practical Guide; IFDC: Muscle Shoals, AL, USA, 2003; pp. 192–194. [Google Scholar]
  28. Ramarohetra, J.; Sultan, B. Impact of ET 0 method on the simulation of historical and future crop yields: A case study of millet growth in Senegal. Int. J. Climatol. 2017, 38, 2. [Google Scholar] [CrossRef]
  29. Bunce, J.A. Carbon dioxide effects on stomatal responses to the environment and water use by crops under field conditions. Oecologia 2004, 140, 1–10. [Google Scholar] [CrossRef]
  30. Olioso, A.; Huard, F.; Guilioni, L. Prise en compte des effets du CO2 sur le calcul de l’évapotranspiration de référence. In Proceedings of the Climator 2010, Versailles, France, 17–18 June 2010. [Google Scholar]
  31. Calvet, J.-C.; Noilhan, J.; Roujean, J.-L.; Bessemoulin, P.; Cabelguenne, M.; Olioso, A.; Wigneron, J.-P. An interactive vegetation SVAT model tested against data from six contrasting sites. Agric. Meteorol. 1998, 92, 73–95. [Google Scholar] [CrossRef]
  32. Erbs, M.; Manderscheid, R.; Luig, A.; Kage, H.; Weigel, H.-J. A field experiment to test interactive effects of elevated CO2 concentration (FACE) and elevated canopy temperature (FATE) on wheat. Procedia Env. Sci. 2015, 29, 60–61. [Google Scholar] [CrossRef] [Green Version]
  33. Manderscheid, R.; Erbs, M.; Weigel, H.-J. Interactive effects of free-air CO2 enrichment and drought stress on maize growth. Eur. J. Agron. 2014, 52, 11–21. [Google Scholar] [CrossRef]
  34. Biasutti, M. Forced Sahel rainfall trends in the CMIP5 archive. J. Geophys. Res. Atmos. 2013, 118, 1613–1623. [Google Scholar] [CrossRef] [Green Version]
  35. Challinor, A.J.; Parkes, B.; Ramirez-Villegas, J. Crop yield response to climate change varies with cropping intensity. Glob. Chang. Biol. 2015, 21, 1679–1688. [Google Scholar] [CrossRef] [Green Version]
  36. Ahmed, K.F.; Wang, G.; Yu, M.; Koo, J.; You, L. Potential impact of climate change on cereal crop yield in West Africa. Clim. Chang. 2015, 133, 321–334. [Google Scholar] [CrossRef]
  37. Faye, B.; Webber, H.; Naab, J.B.; MacCarthy, D.S.; Adam, M.; Ewert, F.; Lamers, J.P.A.; Schleussner, C.F.; Ruane, A.; Gessner, U.; et al. Impacts of 1.5 versus 2.0 °C on cereal yields in the West African Sudan Savanna. Environ. Res. Lett. 2018, 13, 034014. [Google Scholar] [CrossRef]
  38. Fusillier, J.-L. Bilan et perspectives de diffusion de la maïsiculture en zone de savane d’Afrique de l’Ouest. In Proceedings of the valorisation du maïs à l’échelon villageois en Afrique de l’Ouest: Actes du séminaire “Maîs prospère", Cotonou, Bénin, 25–28 January 1994. [Google Scholar]
  39. Rowell, D.P.; Senior, C.A.; Vellinga, M.; Graham, R.J. Can climate projection uncertainty be constrained over Africa using metrics of contemporary performance? Clim. Chang. 2016, 134, 621–633. [Google Scholar] [CrossRef] [Green Version]
  40. Adeniyi, M.O. The consequences of the IPCC AR5 RCPs 4.5 and 8.5 climate change scenarios on precipitation in West Africa. Clim. Chang. 2016, 139, 245–263. [Google Scholar] [CrossRef]
  41. Biasutti, M.; Sobel, A.H. Delayed Sahel rainfall and global seasonal cycle in a warmer climate. Geophys. Res. Lett. 2009, 36, 1–5. [Google Scholar] [CrossRef] [Green Version]
  42. Monerie, P.-A.; Sanchez-Gomez, E.; Boé, J. On the range of future Sahel precipitation projections and the selection of a sub-sample of CMIP5 models for impact studies. Clim. Dyn. 2016, 48, 2751–2770. [Google Scholar] [CrossRef]
  43. Deryng, D.; Elliott, J.; Folberth, C.; Müller, C.; Pugh, T.A.M.; Boote, K.J.; Conway, D.; Ruane, A.C.; Gerten, D.; Jones, J.W.; et al. Regional disparities in the beneficial effects of rising CO2 concentrations on crop water productivity. Nat. Clim. Chang. 2016, 6, 786–790. [Google Scholar] [CrossRef] [Green Version]
  44. Caldwell, J.C. The Sahelian Drought and Its Demographic Implications; University of Wisconsin Press: Madison, WI, USA, 1976. [Google Scholar]
  45. Afolayan, A.A.; Adelekan, I.O. The role of climatic variations on migration and human health in Africa. Environmentalist 1999, 18, 213–218. [Google Scholar] [CrossRef]
  46. Ezra, M. Demographic responses to environmental stress in the drought- and famine-prone areas of Northern Ethiopia. Int. J. Popul. Geogr. 2001, 7, 259–281. [Google Scholar] [CrossRef]
  47. Tian, X.; Yu, X. Crop yield gap and yield convergence in African countries. Food Secur. 2019, 11, 1305–1319. [Google Scholar] [CrossRef]
  48. van Ittersum, M.K.; van Bussel, L.G.J.; Wolf, J.; Grassini, P.; van Wart, J.; Guilpart, N. Can sub-Saharan Africa feed itself ? PNAS 2016, 113, 14964–14969. [Google Scholar] [CrossRef] [Green Version]
  49. Challinor, A.J.; Watson, J.; Lobell, D.B.; Howden, S.M.; Smith, D.R.; Chhetri, N. A meta-analysis of crop yield under climate change and adaptation. Nat. Clim. Chang. 2014, 4, 287–291. [Google Scholar] [CrossRef]
  50. Lebel, S.; Fleskens, L.; Forster, P.M. Evaluation of In situ rainwater harvesting as an adaptation strategy to climate change for maize production in Rainfed Africa. Water Resour. Manag. 2015, 4803–4816. [Google Scholar] [CrossRef]
  51. Sultan, B.; Guan, K.; Kouressy, M.; Biasutti, M.; Piani, C.; Hammer, G.L.; McLean, G.; Lobell, D.B. Robust features of future climate change impacts on sorghum yields in West Africa. Env. Res. Lett. 2014, 9, 104006. [Google Scholar] [CrossRef]
  52. Turner, N.C.; Rao, K.P.C. Simulation analysis of factors affecting sorghum yield at selected sites in eastern and southern Africa, with emphasis on increasing temperatures. Agric. Syst. 2013, 121, 53–62. [Google Scholar] [CrossRef] [Green Version]
  53. Guan, K.; Sultan, B.; Biasutti, M.; Baron, C.; Lobell, D.B. Agricultural and forest meteorology assessing climate adaptation options and uncertainties for cereal systems in West Africa. Agric. Meteorol. 2017, 232, 291–305. [Google Scholar] [CrossRef] [Green Version]
  54. Oweis, T.; Hachum, A. Optimizing supplemental irrigation: Tradeoffs between profitability and sustainability. Agric. Water Manag. 2009, 96, 511–516. [Google Scholar] [CrossRef]
  55. Bren, C.; Reitsma, F.; Baiocchi, G.; Barthel, S.; Güneralp, B.; Erb, K. Future urban land expansion and implications for global croplands. PNAS 2017, 114, 8939–8944. [Google Scholar] [CrossRef] [Green Version]
  56. Chamberlin, J.; Jayne, T.S.; Headey, D. Scarcity amidst abundance ? Reassessing the potential for cropland expansion in Africa. Food Policy 2015, 48, 51–65. [Google Scholar] [CrossRef] [Green Version]
  57. McLeman, R.A.; Hunter, L.M. Migration in the context of vulnerability and adaptation to climate change: Insights from analogues. Wiley Interdiscip. Rev. Clim. Chang. 2010, 1, 450–461. [Google Scholar] [CrossRef] [Green Version]
  58. Missirian, A.; Schlenker, W. Asylum applications respond to temperature fluctuations. Science 2017, 358, 1610–1614. [Google Scholar] [CrossRef] [Green Version]
  59. Feng, S.; Krueger, A.B.; Oppenheimer, M. Linkages among climate change, crop yields and Mexico–US cross-border migration. Proc. Natl. Acad. Sci. USA 2010, 107, 14257–14262. [Google Scholar] [CrossRef] [Green Version]
  60. Van der Geest, K. North-South migration in Ghana: What role for the environment? Int. Migr. 2011, 49, e69–e94. [Google Scholar] [CrossRef]
Figure 1. Change in terms of precipitations (A), temperature (B) and radiation (C) for the five countries. The boxplot represents the results from 16 models with the average historical run from 1986 to 2005 (red), rcp2.6 (green) and rcp8.5 (blue) run from 2041 to 2060. The black line on each boxplot represents the median and the black points the outliers.
Sustainability 12 07585 g001
Figure 2. Change in terms of maize yield (A), pearl millet yield (B) and sorghum yield (C) for the five countries. The boxplot represents the results from 16 models with the average of historical run from 1986 to 2005 (red), rcp2.6 (green), rcp8.5 without [CO2]a (cyan) and rcp8.5 with [CO2]a (violet) run from 2041 to 2060. The black line on each boxplot represents the median and the black points the outliers.
Sustainability 12 07585 g002
Figure 3. Change in terms of kg of cereals (sum of maize, pearl millet and sorghum) per capita with constant population scenario (A), low population scenario (B) and high population scenario (C) for the 5 countries. The boxplot represents the results from 16 models with the average of historical run from 1986 to 2005 (red and always historical population), rcp2.6 (green), rcp8.5 without [CO2]a (cyan) and rcp8.5 with [CO2]a (violet) run from 2041 to 2060. The black line on each boxplot represents the median; the black points the outliers and the grey/white line the threshold of 250 kg per capita.
Sustainability 12 07585 g003
Table 1. The distribution of crop production for the five countries studied for the period 2008–2017 from Food and Agriculture Organization of the United Nations Statistic (FAO stat).
CountrySorghumMilletMaizeTotal
Burkina Faso39%23%31%93%
Mali19%24%26%69%
Niger28%69%1%98%
Nigeria27%11%37%75%
Senegal9%39%16%64%
Table 2. Current and projection population provided by UN in millions of people and in parenthesis, the multiplicative factor compared to current population ([10]).
Country.Current Population (2010)Lower ProjectionHigher Projection
Burkina Faso15.6039.14 (2.51)47.44 (3.04)
Mali15.0739.99 (2.65)48.22 (3.20)
Niger16.4263.10 (3.84)74.00 (4.51)
Nigeria158.58374.16 (2.36)448.53 (2.83)
Senegal12.9230.83 (2.39)37.35 (2.89)
Western Africa 307.78735.78 (2.39)886.70 (2.88)
Table 3. Summary of the crop yield variations under the two scenarios with or without CO2. The first line for all countries represent the variations for the climatic variables (in % for precipitation -Pr- and solar radiation-SR- and in °C for T -temperature-).
Country and Cereals Historical Yields (kg/ha)% RCP2.6% RCP8.5% RCP8.5 [CO2]a
Burkina Faso (SB and Humid) Pr = 4%; SR = 0%; T = 1.1 °CPr = 4%; SR = 0%; T = 2.2 °CPr = 4%; SR = 0%; T = 2.2 °C
Maize1422−8%−9%15%
Millet684−14%−20%1%
Sorghum867−15%−28%−9%
Mali (SB and Humid) Pr = 4%; SR = 0%; T = 1.2 °CPr = 4%; SR = −1%; T = 2.5°CPr = 4%; SR = −1%; T = 2.5 °C
Maize1575−7%−17%1%
Millet848−13%−24%−3%
Sorghum1071−15%−27%−13%
Niger (SB and driest) Pr = 13%; SR = 0%; T = 1.3 °CPr = 22%; SR = −1%; T = 2.5 °CPr = 22%; SR = −1%; T = 2.5 °C
Maize77512%6%40%
Millet4357%8%9%
Sorghum25910%6%34%
Nigeria (most humid) Pr = 1%; SR = 1%; T = 1 °CPr = 0%; SR = 0%; T = 1.9 °CPr = 0%; SR = 0%; T = 1.9 °C
Maize1360−4%−11%2%
Millet1131−8%−18%−3%
Sorghum1100−10%−24%−15%
Senegal (SB and coastal) Pr = 1%; SR = 0%; T = 1 °CPr = -15%; SR = 0%; T = 1.7 °CPr = -15%; SR = 0%; T = 1.7 °C
Maize1328−6%−21%−1%
Millet638−9%−25%−6%
Sorghum834−13%−28%−12%

