Article

Assessment of the Combined Effect of Temperature and Salinity on the Outputs of Soil Dielectric Sensors in Coconut Fiber

by
Sebastián Bañón
1,*,
Jesús Ochoa
1,
Daniel Bañón
2,
María Fernanda Ortuño
2 and
María Jesús Sánchez-Blanco
2
1
Department of Agricultural Engineering, UPCT—Technical University of Cartagena, 30203 Cartagena, Spain
2
Department of Irrigation, CEBAS-CSIC—Center for Edaphology and Applied Biology of Segura, 30100 Murcia, Spain
*
Author to whom correspondence should be addressed.
Sustainability 2020, 12(16), 6577; https://doi.org/10.3390/su12166577
Submission received: 16 June 2020 / Revised: 9 August 2020 / Accepted: 10 August 2020 / Published: 14 August 2020
(This article belongs to the Special Issue Sustainable Applications in Agriculture)

Abstract

:
Dielectric sensors are useful instruments for measuring soil moisture and salinity. The soil moisture is determined by measuring the dielectric permittivity, while bulk electrical conductivity (EC) is measured directly. However, permittivity and bulk EC can be altered by many variables such as measurement frequency, soil texture, salinity, or temperature. Soil temperature variation is a crucial factor as there is much evidence showing that global warming is taking place. This work aims to assess how variations in the temperature and salinity of coconut fiber affect the output of EC5 (voltage) and GS3 (permittivity and bulk EC) Decagon sensors. The results showed that the effect of temperature and salinity on the output of the sensors can lead to substantial errors in moisture estimations. At low salinity values, permittivity readings decreased as temperature increased, while voltage readings were not affected, regardless of substrate moisture. The GS3 sensor underestimated the bulk EC when it is measured below 25 °C. The temperature dependence of the voltage of EC5 was not significant up to 10 dS m−1, and the permittivity of the GS3 was more affected by the interaction between temperature and salinity. The effect that salinity has on the permittivity of the GS3 sensor can be reduced if a permittivity–moisture calibration is performed with saline solutions, while the effect resulting from the interaction between temperature and salinity can be minimized using a regression model that considers such an interaction.

1. Introduction

Dielectric sensors, such as Decagon GS3 or EC5, are capable of estimating the soil volumetric water content (VWC) by measuring its dielectric permittivity [1], a property that has been used to set irrigation systems that address the actual water demand of plants [2]. However, the relationship between dielectric permittivity and VWC can be affected by several factors such as sensor measurement frequency [3,4], physical properties of the soil [5], salinity [6] or temperature [7], and, as a result, the VWC measurements may be erroneous.
Temperature may affect dielectric sensors by directly affecting sensor circuitry, by modifying the dielectric properties of the soil, or by modifying water–soil interactions [3,8]. Scoggins and van Irsel [9] studied the temperature sensitivity of several sensors in situ and found that the responses to temperature changes varied between sensors. Rosenbaum et al. [10] found that the 5 TE sensor might underestimate (5–25 °C) or overestimate (25–40 °C) soil permittivity depending on the range of temperature. Temperature dependence of permittivity is well established and results in an increase with temperature of about 2% per °C [11]. However, Campbell et al. [12] suggested that permittivity decreases with increasing temperature at about 0.5% per °C. Errors in permittivity lead to errors in estimated moisture content since it is calculated as a function of permittivity. An error of 8.5% in permittivity results in a 1% error in estimated water content at 20% VWC [12], but the magnitude of this error depends on the salinity and moisture content of the substrate. In this sense, the rate of increase in VWC estimated by GS3 sensor with increasing temperature was approximately 2% for a 10 °C change in the substrate temperature when the irrigation solution electrical conductivity (EC) was of 5 dS m−1, while no change was found with 1.5 dS m−1 [6]. When the irrigation water EC was increased from 0 to 3 dS m−1 the voltage of ECH2O-10 sensor increased by 9.1% and a further 2.4% increase in voltage was seen at an EC of 12 dS m−1 compared to that at 3 dS m−1 [13]. Several studies have suggested a linear decrease in the moisture content estimated by sensors with increasing substrate temperature when the VWC is above 30% and no change in measured VWC with increasing temperature when the VWC is below 30% [11]. Despite the various corrections that have been made to dielectric sensors regarding temperature [10], some researchers have observed that the temperature may still distort sensor measurements [14].
In today’s world climatic scenario, temperature variation is considered a major factor since it is leading to global warming. Unfortunately, the current predictions of climate change indicate that temperature will continue increasing, which will have important effects on biological processes over the next decades. Air temperature is increasing rapidly, while the changes in soil temperature are more persistent. In agricultural systems, temperature fluctuation has been shown to affect plant parameters such as plant growth [15], crop yield and quality, plant stress [16] or reproductive processes [17]. Plants grow and differentiate their organs in response to stressful environmental conditions [18]. However, electronic devices such as soil sensors have limited capacity to adapt to temperature variations, which highlights the importance of knowing how the measurement of soil moisture is affected by temperature.
It would not be possible to accurately estimate the VWC without the understanding of the effects of soil temperature on sensors, which is a central issue in order to avoid losing water resources that are subject to environmental regulations and economic limitations. Temperature variations are responsible for water waste as they disturb the estimation of soil VWC. These incorrect soil moisture estimations result in erroneous timings for triggering of irrigation events when automatic irrigation systems based on specific moisture thresholds are used, which leads to water waste. The effect of temperature on soil sensors acquires greater importance in plants grown in a soilless substrate because temperature changes in a container are more pronounced than in soil [19]. Such imbalance could even occur within the same day in areas where fluctuations in substrate temperature are greater, as is the case in autumn days in the Mediterranean areas [20].
Some sensors, such as the Decagon GS3, can also measure temperature and bulk EC. Bulk EC is the combined EC of soil particles, water, and air present in the soil matrix. Although bulk EC is strongly affected by salinity [21], it also depends on the soil water content and other factors [22]. The confounding effect of moisture makes interpretation of bulk EC values difficult. In contrast, pore water EC is better related to plant saline stress. Therefore, many applications of saline water in agriculture and urban gardening have been developed thanks to the possibility of monitoring pore water EC [23]. In recent years, several models have been developed to estimate pore water EC from bulk EC [24,25,26,27]. These models use the measurements of soil temperature, permittivity, and bulk EC obtained by sensors, and so any errors in these measurements are prejudicial to the estimation of pore water EC [6,8,28].
In a global context of water scarcity, the use of marginal water (saline water, wastewater, etc.) for irrigation is becoming increasingly common [29]. The high fertilizer concentrations used in intensive agriculture adds even more salts in the irrigation solution, which have been seen to influence sensor outputs by affecting the electromagnetic field generated by the sensors [30]. Indeed, the accuracy of the in situ measurements made by dielectric sensors in saline soils is generally considered problematic [31]. Moreover, Valdés et al. [6] indicated that salinity increased the dispersion of permittivity readings made with an HPII-Steven sensor.
Most sensor manufacturers offer standard calibration curves to relate the dielectric properties of soil to their VWC. However, the accuracy of VWC measurement can be improved by making specific calibrations for the soils where the sensors are going to be used. This type of calibration is of particular interest in substrates with a high water-holding capacity [28], such as the one used in our study. In this case, calibration consists of finding a significant relationship between the gravimetrically calculated VWC and the output of the sensor (permittivity or voltage). Considering that salinity affects the measurement of these outputs, calibration should be modified according to the substrate salinity.
The goals of this work were: (i) study how variations in substrate temperature and salinity affect measurements of voltage, permittivity and bulk EC of two Decagon’s soil sensors (EC5 and GS3); (ii) analyze the impact of calibration equations on the estimation of substrate moisture under saline conditions; and (iii) provide an equation to correct for the effects of temperature and salinity on permittivity.

2. Materials and Methods

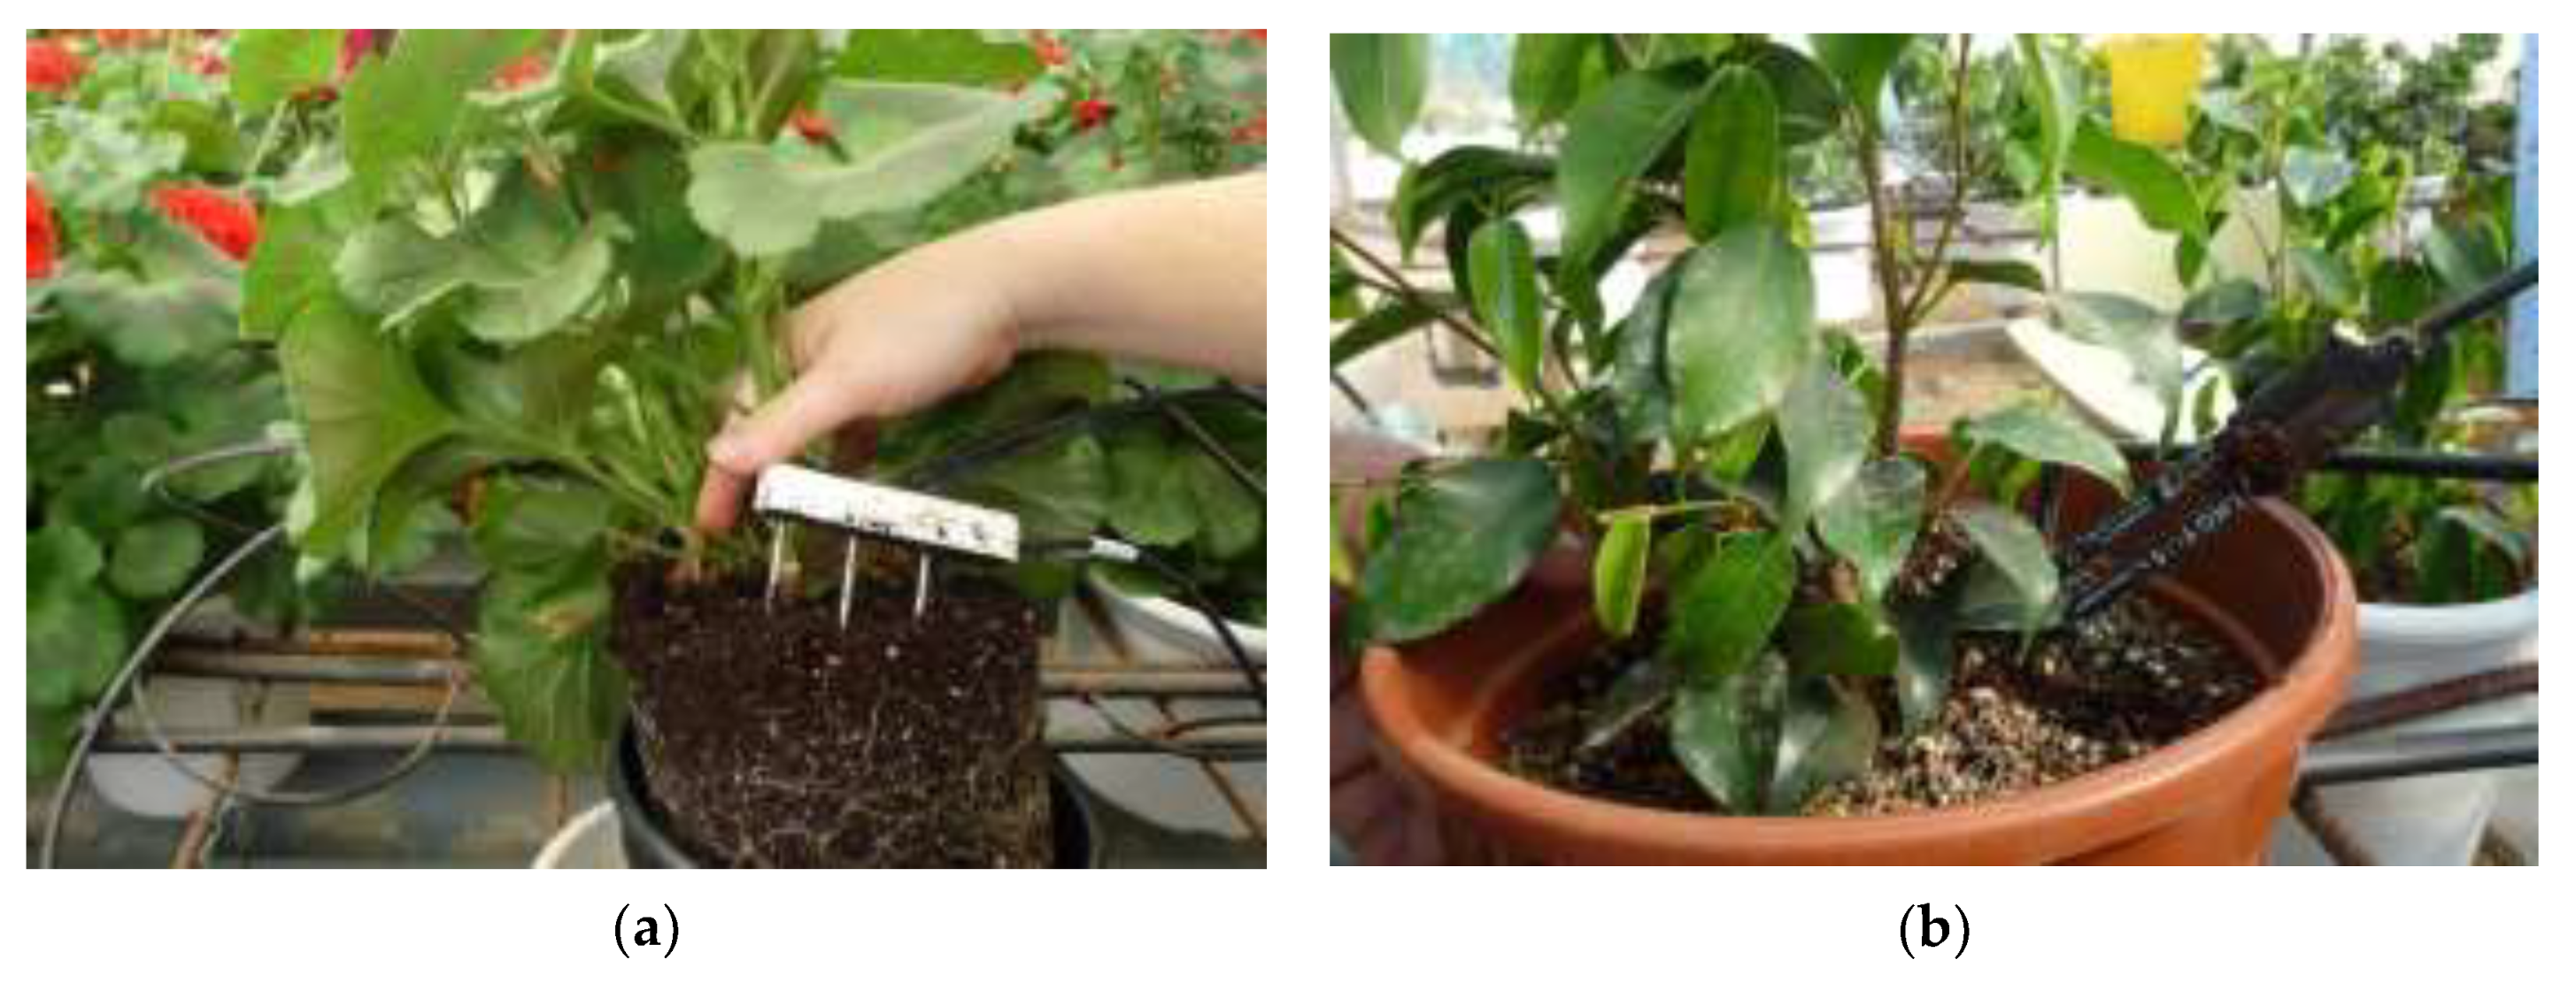
2.1. Soil Moisture Sensors

The sensors studied in this work were the EC5 and GS3 (Decagon Devices, Ltd., Pullman, WA), which are shown in Figure 1. The first sensor determines VWC by measuring the dielectric constant of the medium (voltage) using capacitance frequency domain technology [32], while the second one uses an electromagnetic field to measure the dielectric permittivity of the surrounding medium (permittivity). The permittivity or voltage of the sensors can be converted into VWC by a calibration equation specific to the medium. The GS3 sensor can also measure temperature and bulk EC. The standard factory-set calibration of the GS3 sensor for the bulk EC measurement is valid up 10 dS m−1 bulk EC. The same sensor uses a small thermistor to take temperature readings and measures the bulk EC by applying an alternating electrical current between two electrodes and measuring the resistance between them. For more information, see Decagon—METER Group’s GS3 manual.

2.2. Experimental Management and Design

PVC pots (1.3 L capacity, 14.5 cm upper internal diameter, and 12.5 cm high) were filled with 100% coconut fiber. Coconut fiber was chosen as the substrate for the experiment because of its low compaction when dry. Its maximum water holding capacity was 51% of substrate volumetric water content (VWC, v/v). GS3 and EC5 sensors were studied separately through two bifactorial experiments. In the first experiment, the effect of three levels of temperatures (10, 25, and 40 °C) on the bulk EC (GS3), permittivity (GS3), and voltage (EC5) was studied. Each of these temperatures was tested under 13, 27 y 51% of substrate VWC, with 1.6 dS m−1 of pore water EC in all treatments. In the second experiment, the effects of the same levels of temperature (10, 25, and 40 °C) were examined on bulk EC, permittivity, and voltage, but in this case each one of the temperatures was studied under four levels of salinity (1.6, 5, 10, and 20 dS m−1 of pore water EC) and 51% VWC.
In both experiments, a GS3 or EC5 sensor was placed vertically and fully inserted into the substrate with no plants. The substrate VWC was maintained constant during the whole experimental period. This was achieved by tightly placing a plastic film over each pot after inserting the sensors, thus preventing the loss of water through evaporation. Then, four pots per treatment were placed into a programmable temperature climate chamber (MLR-350; Sanyo Electric Co. Ltd., Osaka, Japan), and the sensors were connected to a CR1000 programmer datalogger (Campbell Scientific, Inc., Logan, UT, USA), which was programmed by Loggernet 3 (Campbell Scientific Inc., Logan, UT, USA) to collect sensor outputs every hour. When the temperature of the potting substrate inside the chamber had stabilized, the average output for the following 12 h was calculated.
The substrate water contents studied in the first experiment were calculated using fresh weight, dry weight, and substrate volume in the pot. To achieve the salinity levels of the second experiment, the pots were saturated several times with NaCl solutions of 1.6, 5, 10, and 20 dS m−1. The pour-through extraction method was used to verify pore water EC as suggested for small substrate volumes [33]. Thirty minutes after the last saturation, distilled water was poured evenly over the surface of each pot to obtain a leachate volume of 50 mL. The EC of the leachate was measured immediately after collection using a conductivity-meter (Dist® 6; Hanna Instruments S.L., Eibar, Spain).

2.3. Sensor Calibration

Substrate-specific calibrations were made for the GS3 and EC5 sensors to estimate the VWC of the substrate at 1.6, 5, 10, and 20 dS m−1 salinity levels. The calibration procedure was similar to that described by Nemali et al. [13]. Twenty-five liters of coconut fiber with a low moisture content were placed in a plastic tray, and 1.5-L plastic beakers were filled with this substrate, which was lightly compressed. A sensor was inserted, carefully maintaining close contact between the substrate and the sensor, and a CR1000 datalogger programmer was used to take readings. Three repetitions were made. The substrate was then weighed and placed in an oven at 60 °C until a constant weight was reached. VWC was determined as the difference between fresh and dry weight divided by the substrate volume. This process was repeated several times after adding increasing amounts of water to the tray. VWC values were related to voltage (EC5) or permittivity (GS3) to obtain linear calibration equations for the EC5, and quadratic equations for the GS3.

2.4. Statistical Analysis

The experiments assessed the main effect of each factor (temperature and VWC, or temperature and salinity) on the standard readings of the sensors, but also any interaction between them. To this end, a two-way analysis of variance (ANOVA) was performed separately for each experiment using Statgraphics Plus for Windows (Manugistics Inc., Rockville, MD, USA), where mean values were separated by the Least Significant Difference Test (p < 0.001). The regression equations were performed using SigmaPlot 12.5 software (Systat Software Inc., San Jose, CA, USA).

3. Results and Discussion

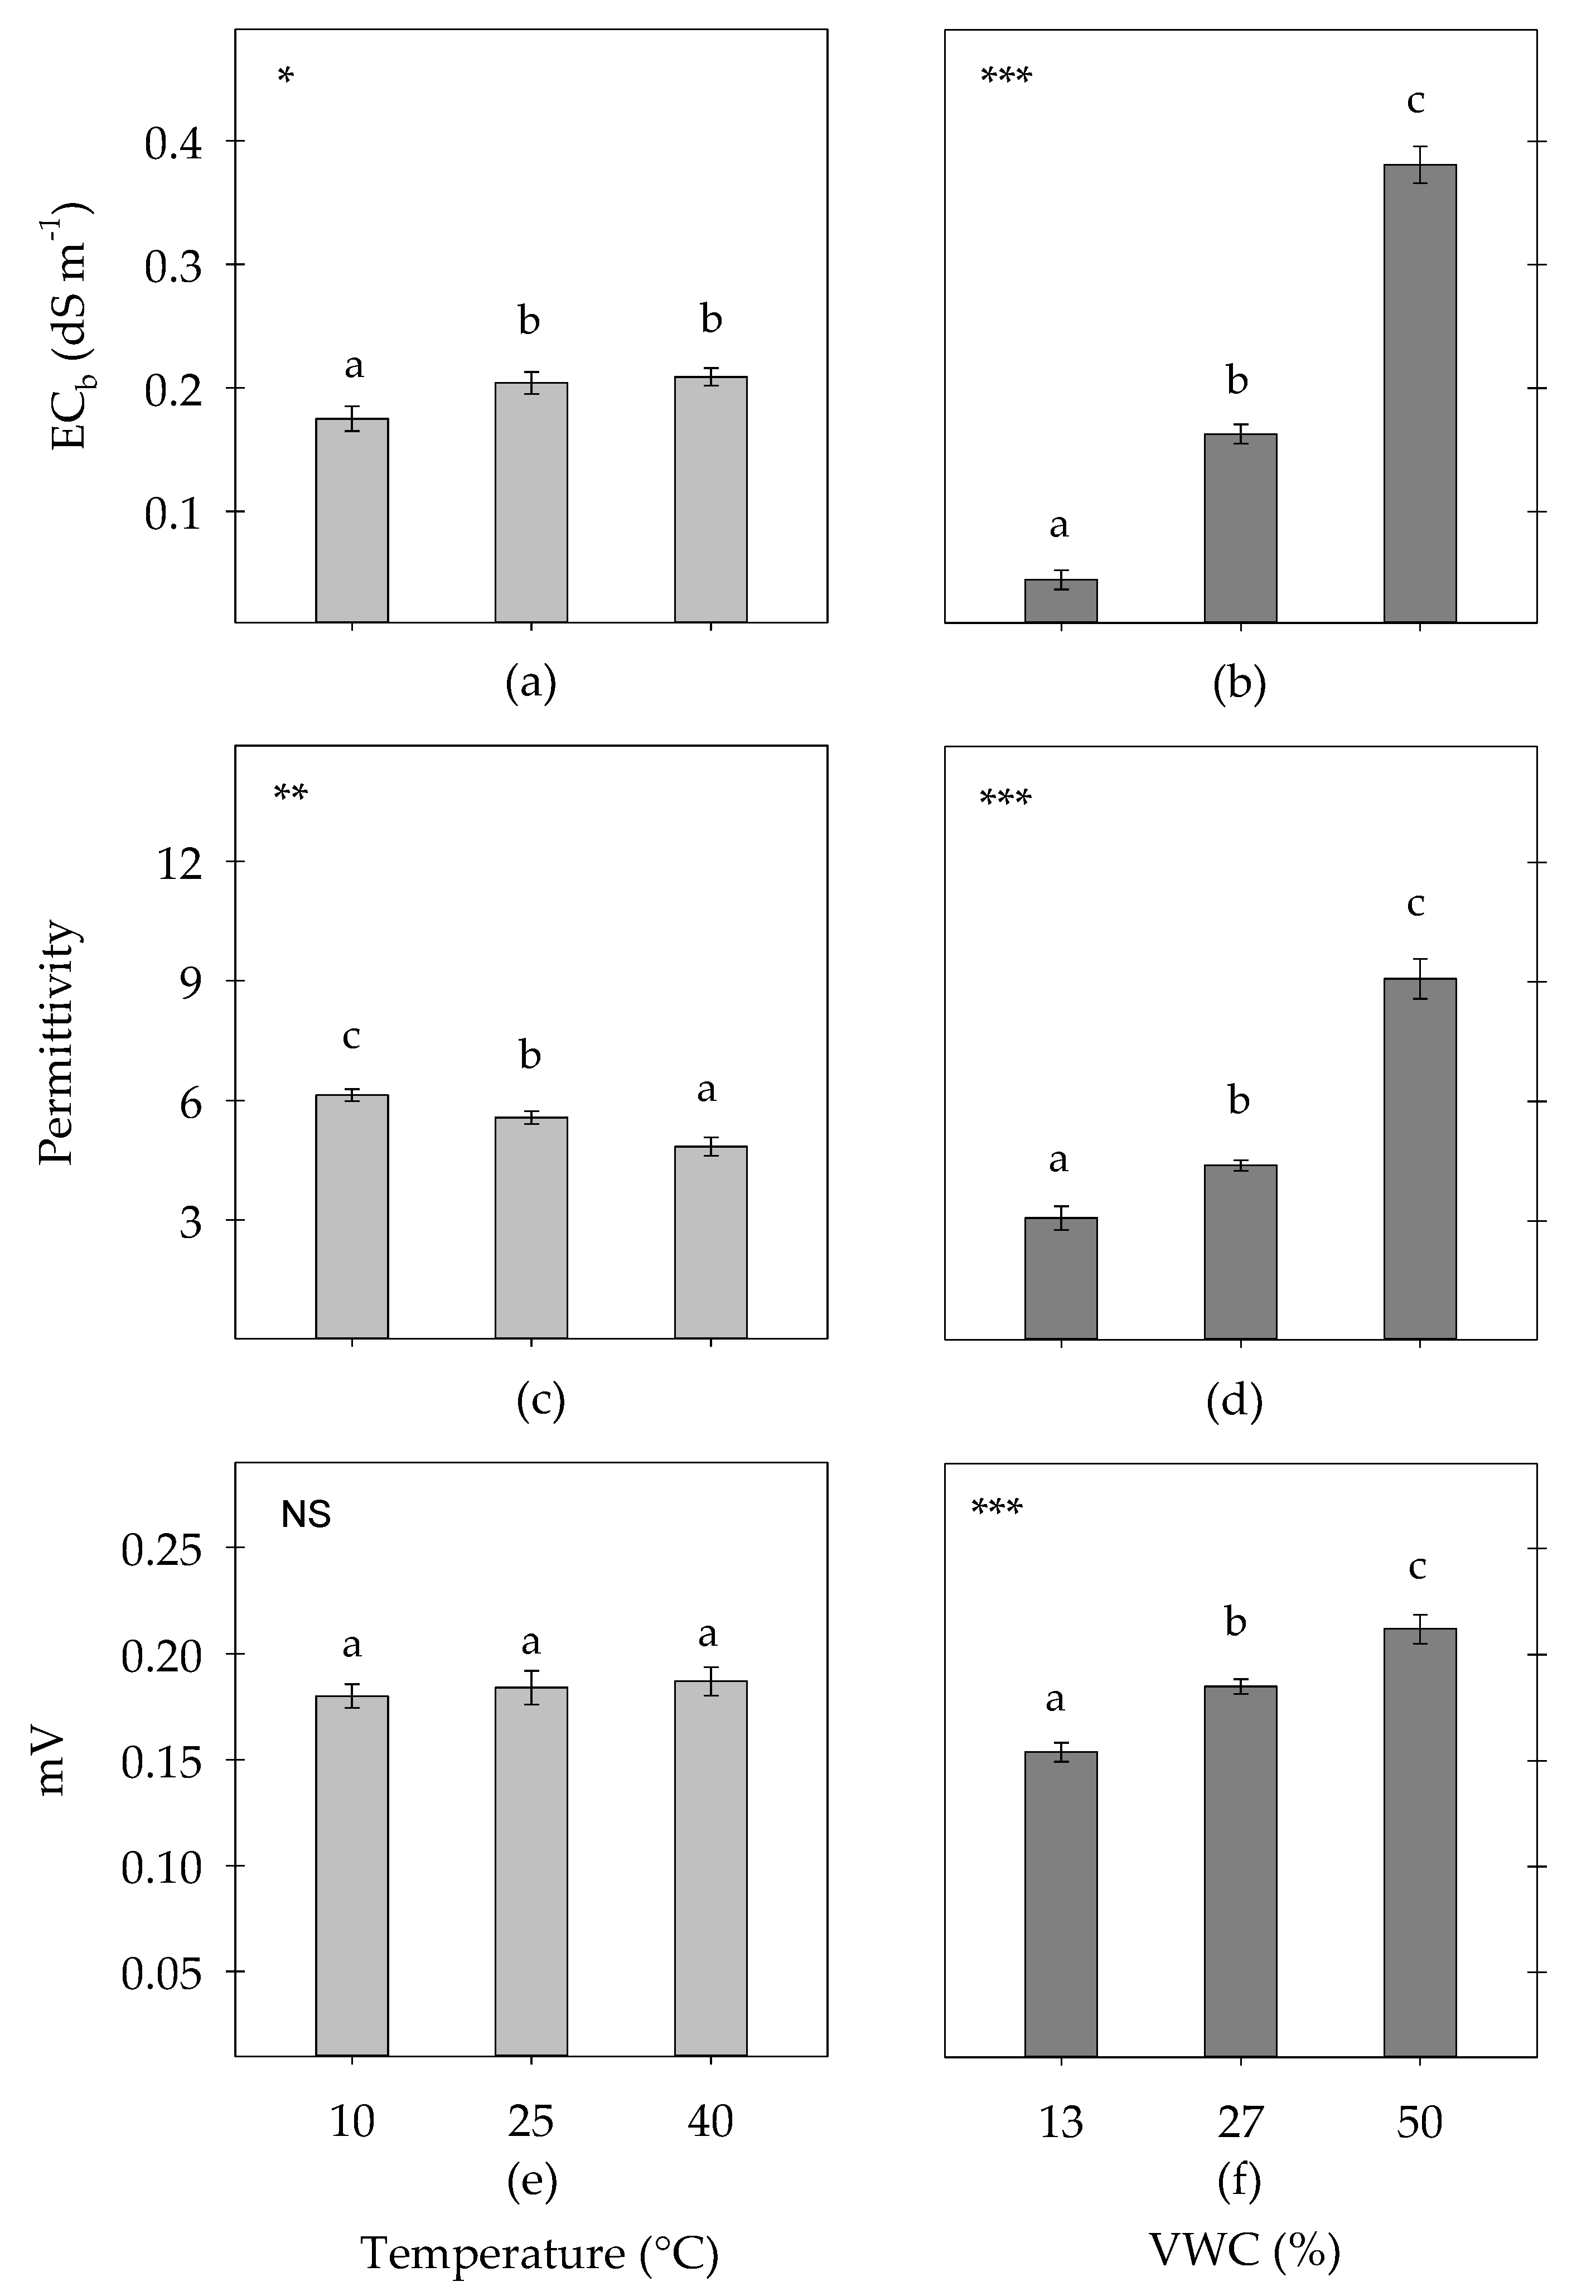
3.1. Effects of Substrate Temperature and VWC

3.1.1. Bulk EC

Bulk EC increased by 16% as the temperature rose from 10 to 25 °C, but there was no statistically significant increase between 25 and 40 °C (Figure 2a). Some authors have estimated that soil EC increases at an approximate rate of 1.9% per °C [34], although Topp et al. [35] found no significant temperature dependence of bulk EC in a clay loam soil with high moisture content. In our experiment, a 1% increase in bulk EC was recorded for every 1 °C from 10 to 25 °C. This suggests that the GS3 sensor standardizes its bulk EC measurements at 25 °C using an internal mathematical model [36], which is more effective above 25 °C than below. This temperature effect of bulk EC was observed for all three VWC levels studied since no interaction between substrate moisture and temperature was detected. Or and Wraith [11] found that bulk EC increases with temperature in loamy loam soil, regardless of soil moisture, as was found in this work. However, testing on other types of soil, the same authors found that bulk EC increased with temperature when humidity was low and decreased when high, which indicates that the characteristics of the soil strongly influence the humidity x temperature interaction.
Bulk EC increased to a statistically significant extent at the three levels of VWC tested (Figure 2b), an increase that was independent of the temperature (no interaction). The strong moisture dependence of bulk EC is well known and has been attributed to the fact that a decrease in soil moisture induces attraction between free ions and soil particles making the ions less mobile in the soil, and causing the conductivity readings to be lower [37,38]. Bulk EC measurements can be affected by several variables, including soil texture, temperature, soluble salts, and the water content [22,34]. Since variations of soil texture with time are fairly small and the influence of temperature can be minimized with the above mentioned mathematic models, moisture becomes the most influential variable for bulk EC [21]. Unfortunately, the influence of moisture masks the effect of dissolved salts on bulk EC, and bulk EC data can be misleading, since low values can either indicate low salinity or low moisture [39]. Therefore, to monitor the saline state of the soil using bulk EC, it will be necessary to correct the influence of humidity variations on the bulk EC [40]. For this reason, bulk EC is generally of little use in understanding the salinity trend of a soil despite it being the only EC that can be monitored in situ automatically. For this reason, bulk EC is usually converted to pore water EC using mathematical models such as those of Rhoades [38] or Hilhorst [25] because it more accurately represents the salinity of the solution to which the roots are exposed.

3.1.2. Permittivity and Voltage

Substrate moisture significantly affected GS3 permittivity and EC5 voltage measurements (Figure 2d,f). Moisture–permittivity dependence is useful because the dielectric constant of water is much higher than that of air and soil, so changes in moisture are mainly responsible for changes in the permittivity of the substrate. Therefore, dielectric sensors use calibration equations in which the substrate permittivity values are related to different levels of VWC.
Permittivity decreased with temperature (Figure 2c), while voltage output was not affected (Figure 2e), regardless of the substrate moisture (no interaction). In the Theta probe output, no change was observed with increasing temperature by Nemali et al. [13], while Campbell et al. [8] found negligible changes in VWC with changing temperature, as estimate by the EC5 [12,13]. In contrast to us, the last-mentioned authors observed that the temperature effect increased with increasing VWC. Or and Wraith [11] also indicated an interactive effect between the substrate temperature and moisture on the estimation of VWC when the TDR sensor was used. Rosenbaum et al. [10] found that temperature had a greater effect on the output of several sensors when they were inserted in liquid media of high permittivity compared with those inserted in media of lower permittivity.
The inverse relationship between temperature and the permittivity of water is well known and has been extensively studied in the literature. Campbell et al. [8] indicated that the permittivity of water decreases as temperature increases at a rate of 0.5% per °C [12]. Therefore, it would seem reasonable to assume that the dielectric constant of a wet substrate will behave in the same way as water. In our experiment, a decrease in permittivity was observed as the substrate temperature rose from 10 to 40 °C (Figure 2c), but it was independent of the VWC (no interaction). Other researchers found a linear relationship between temperature and permittivity, whose slope could be positive or negative depending on the type of soil [7]. For the case of the EC5, Cobos and Campbell [41] suggested that the sensor’s response to temperature can be both positive and negative depending on the electrical characteristics of the soil. Such behavior has been related to how a fraction of the water is held by the soil surface in the form of bound water, which is released as free water when the temperature is increased [8,11]. Therefore, the physical and chemical characteristics of the soil have a significant effect on the permittivity–temperature relationship.
Temperature-related deviations in the measurement of permittivity lead to the inaccurate estimation of VWC. In our experimental conditions, using coconut fiber under low salinity levels, permittivity showed a downward response to temperature. This underestimation of permittivity leads to the underestimation of VWC, but we found a permittivity reduction rate of 0.6% per °C from 10 to 40 °C (Figure 2c), which would give a maximum error of 4.4% in the estimation of VWC (0.15% per °C) when the calibration equation for 1.6 dS m−1 from Table 1 is used. This error in the GS3 does not seem important and can be considered small compared to other errors caused by incorrect sensor orientation and insertion, the variability of substrate moisture, etc. Nemali et al. [13] indicated an increase of 1.88 mV per °C for the ECH20 sensor, which led to a change in estimated VWC of 0.26% per °C [13]. These findings suggest that the GS3 sensor efficiently compensates the temperature dependence of permittivity with low salinity.

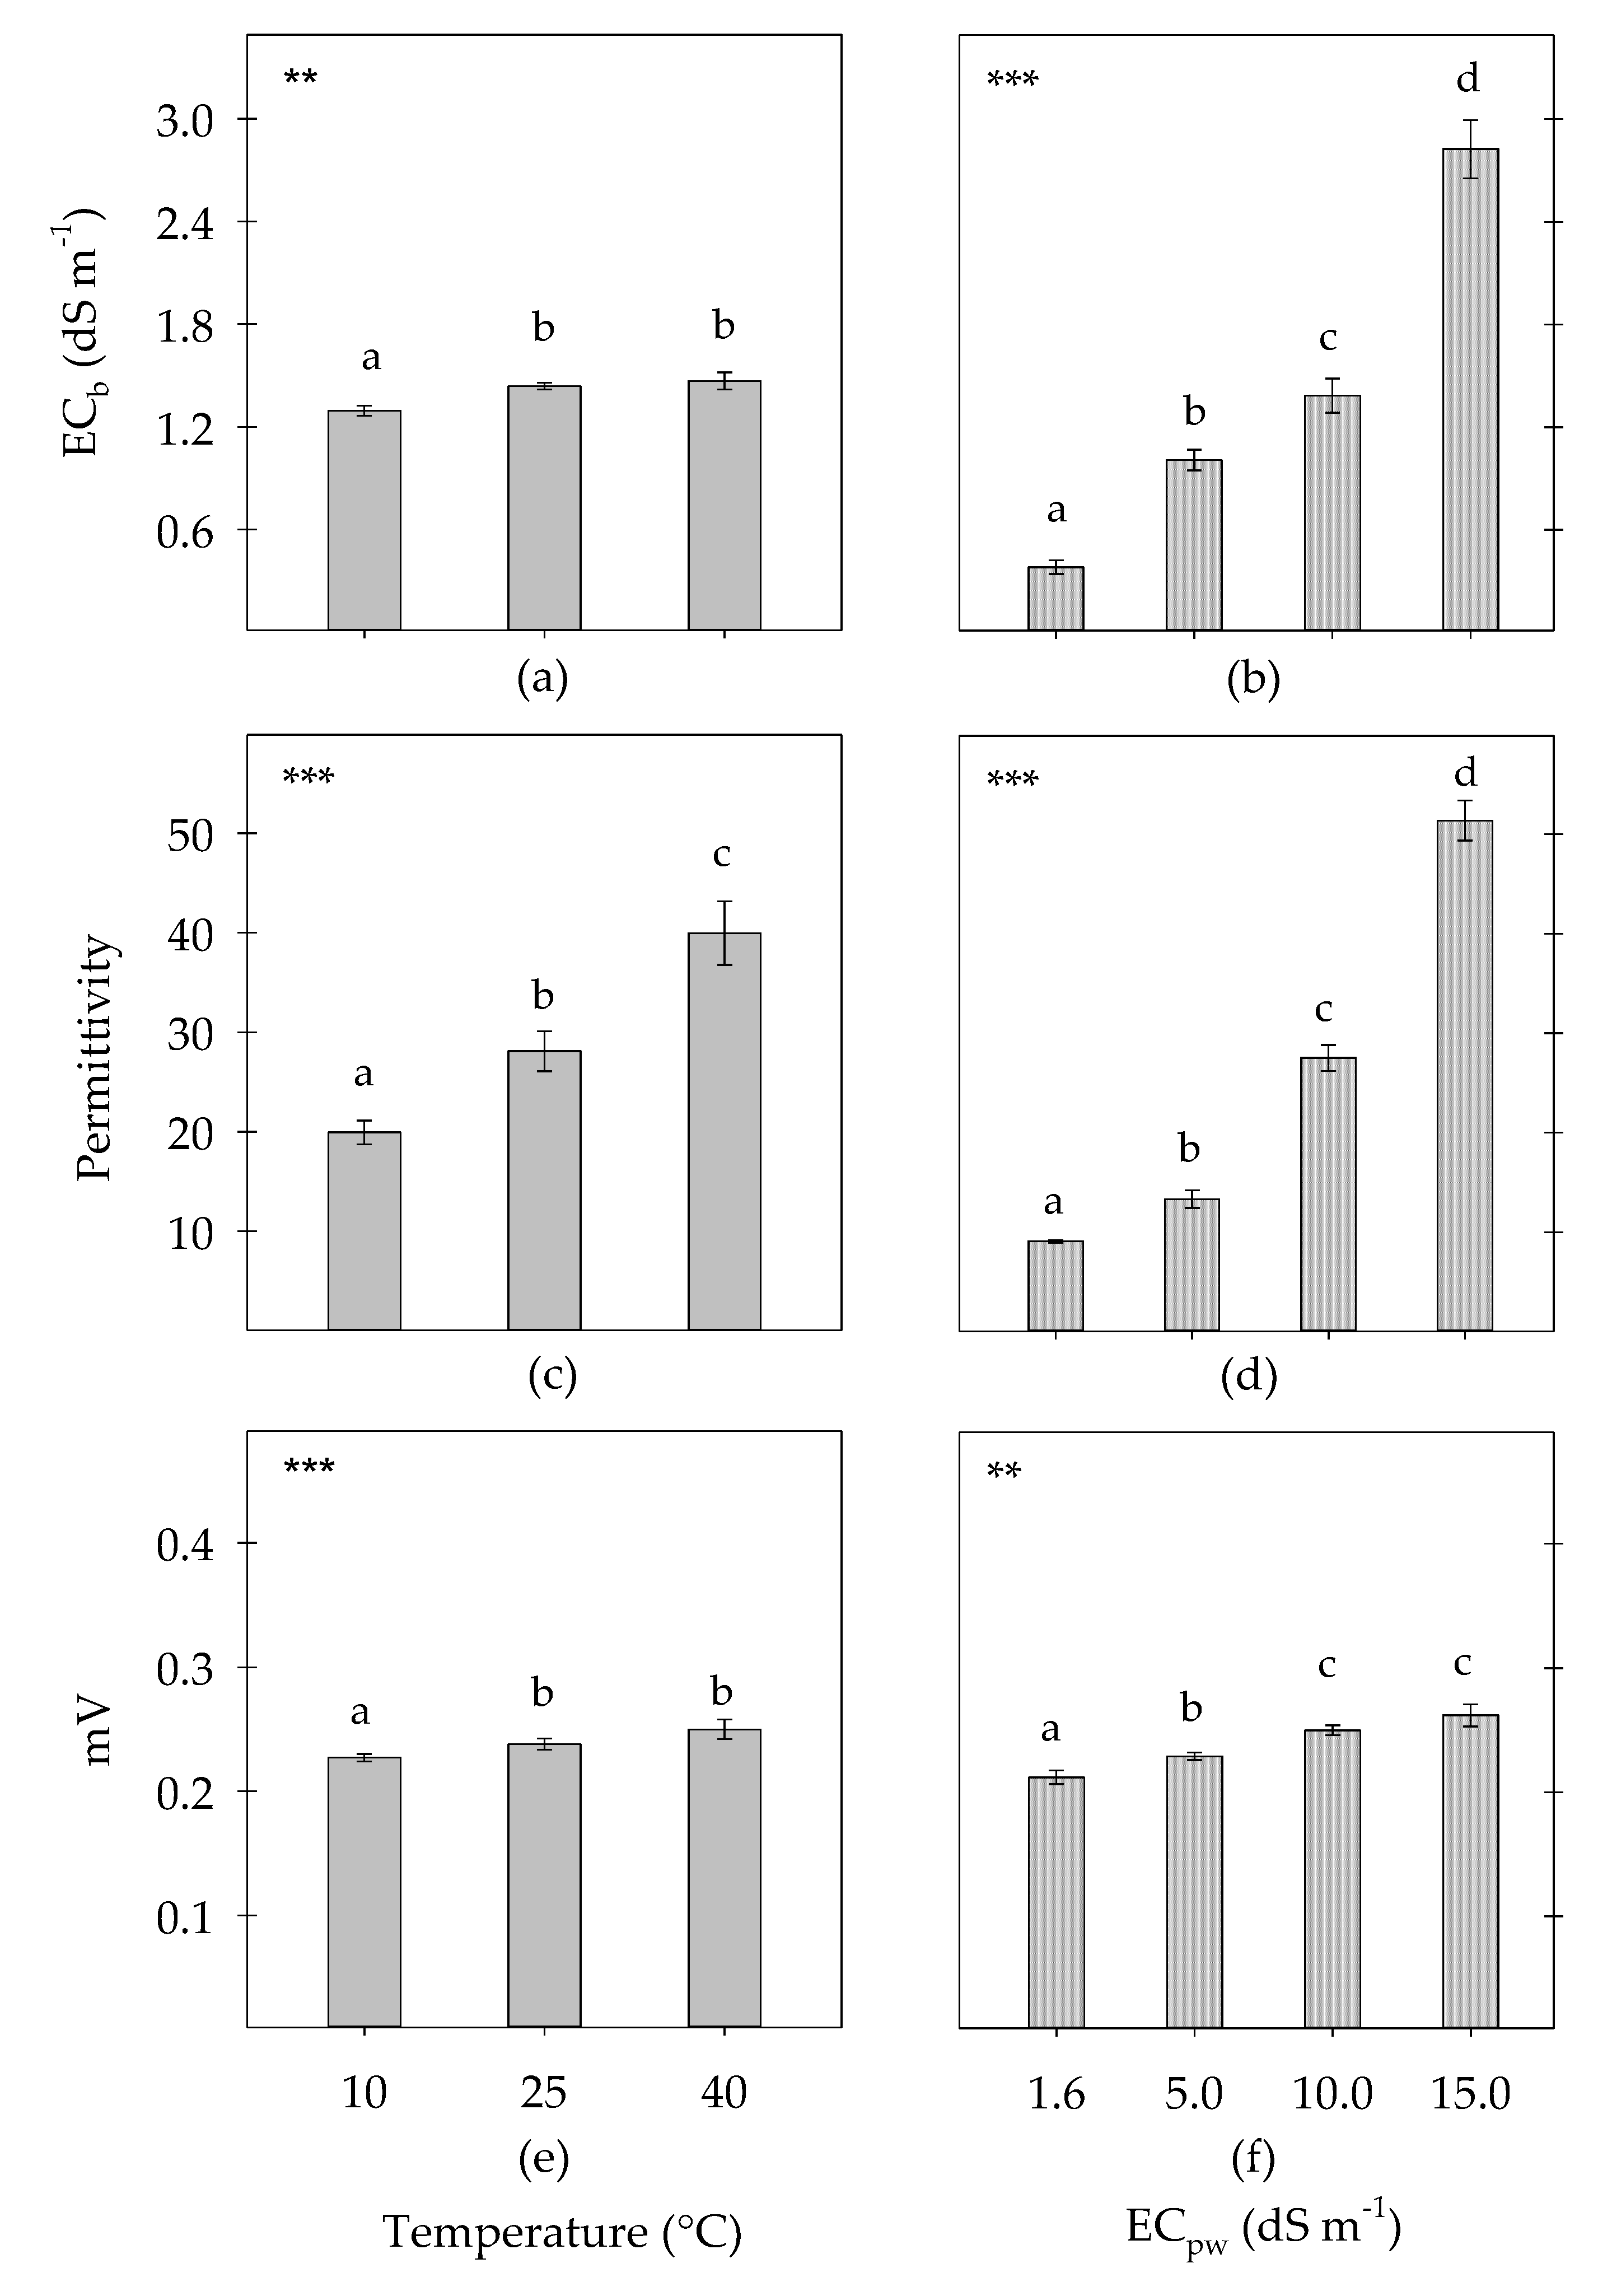
3.2. Effects of Substrate Temperature and Salinity

3.2.1. Bulk EC

The effect of temperature on bulk EC was similar to that of the first experiment (Figure 3a), which suggests an underestimation of EC as the temperature decreased from 25 to 10 °C. Since there was no interaction between temperature and salinity for bulk EC, these effects can be taken as similar for all the salinity levels studied. As above, an increase in bulk EC of about 1% per °C from 10 to 25 °C was obtained, but here the bulk EC values were higher.
Salinity increased bulk EC to a greater extent than temperature (Figure 3b), which emphasized the potential usefulness of such conductivity as salinity indicator and for estimating pore water EC using the abovementioned mathematical models. In this second experiment, the influence of moisture content on bulk EC was removed as it was conducted at a constant VWC of 51%. In this scenario, salinity becomes the most decisive factor in bulk EC and could be considered as an effective saline index for monitoring soil salinity. But for the results to be compared, it is important to always measure the bulk EC at a similar moisture level [9]. Valdés et al. [42] indicated that measuring bulk EC 30 min after an irrigation episode (on high and constant moisture conditions) mitigates negative effects on the production of potted Euphorbia pulcherrima.

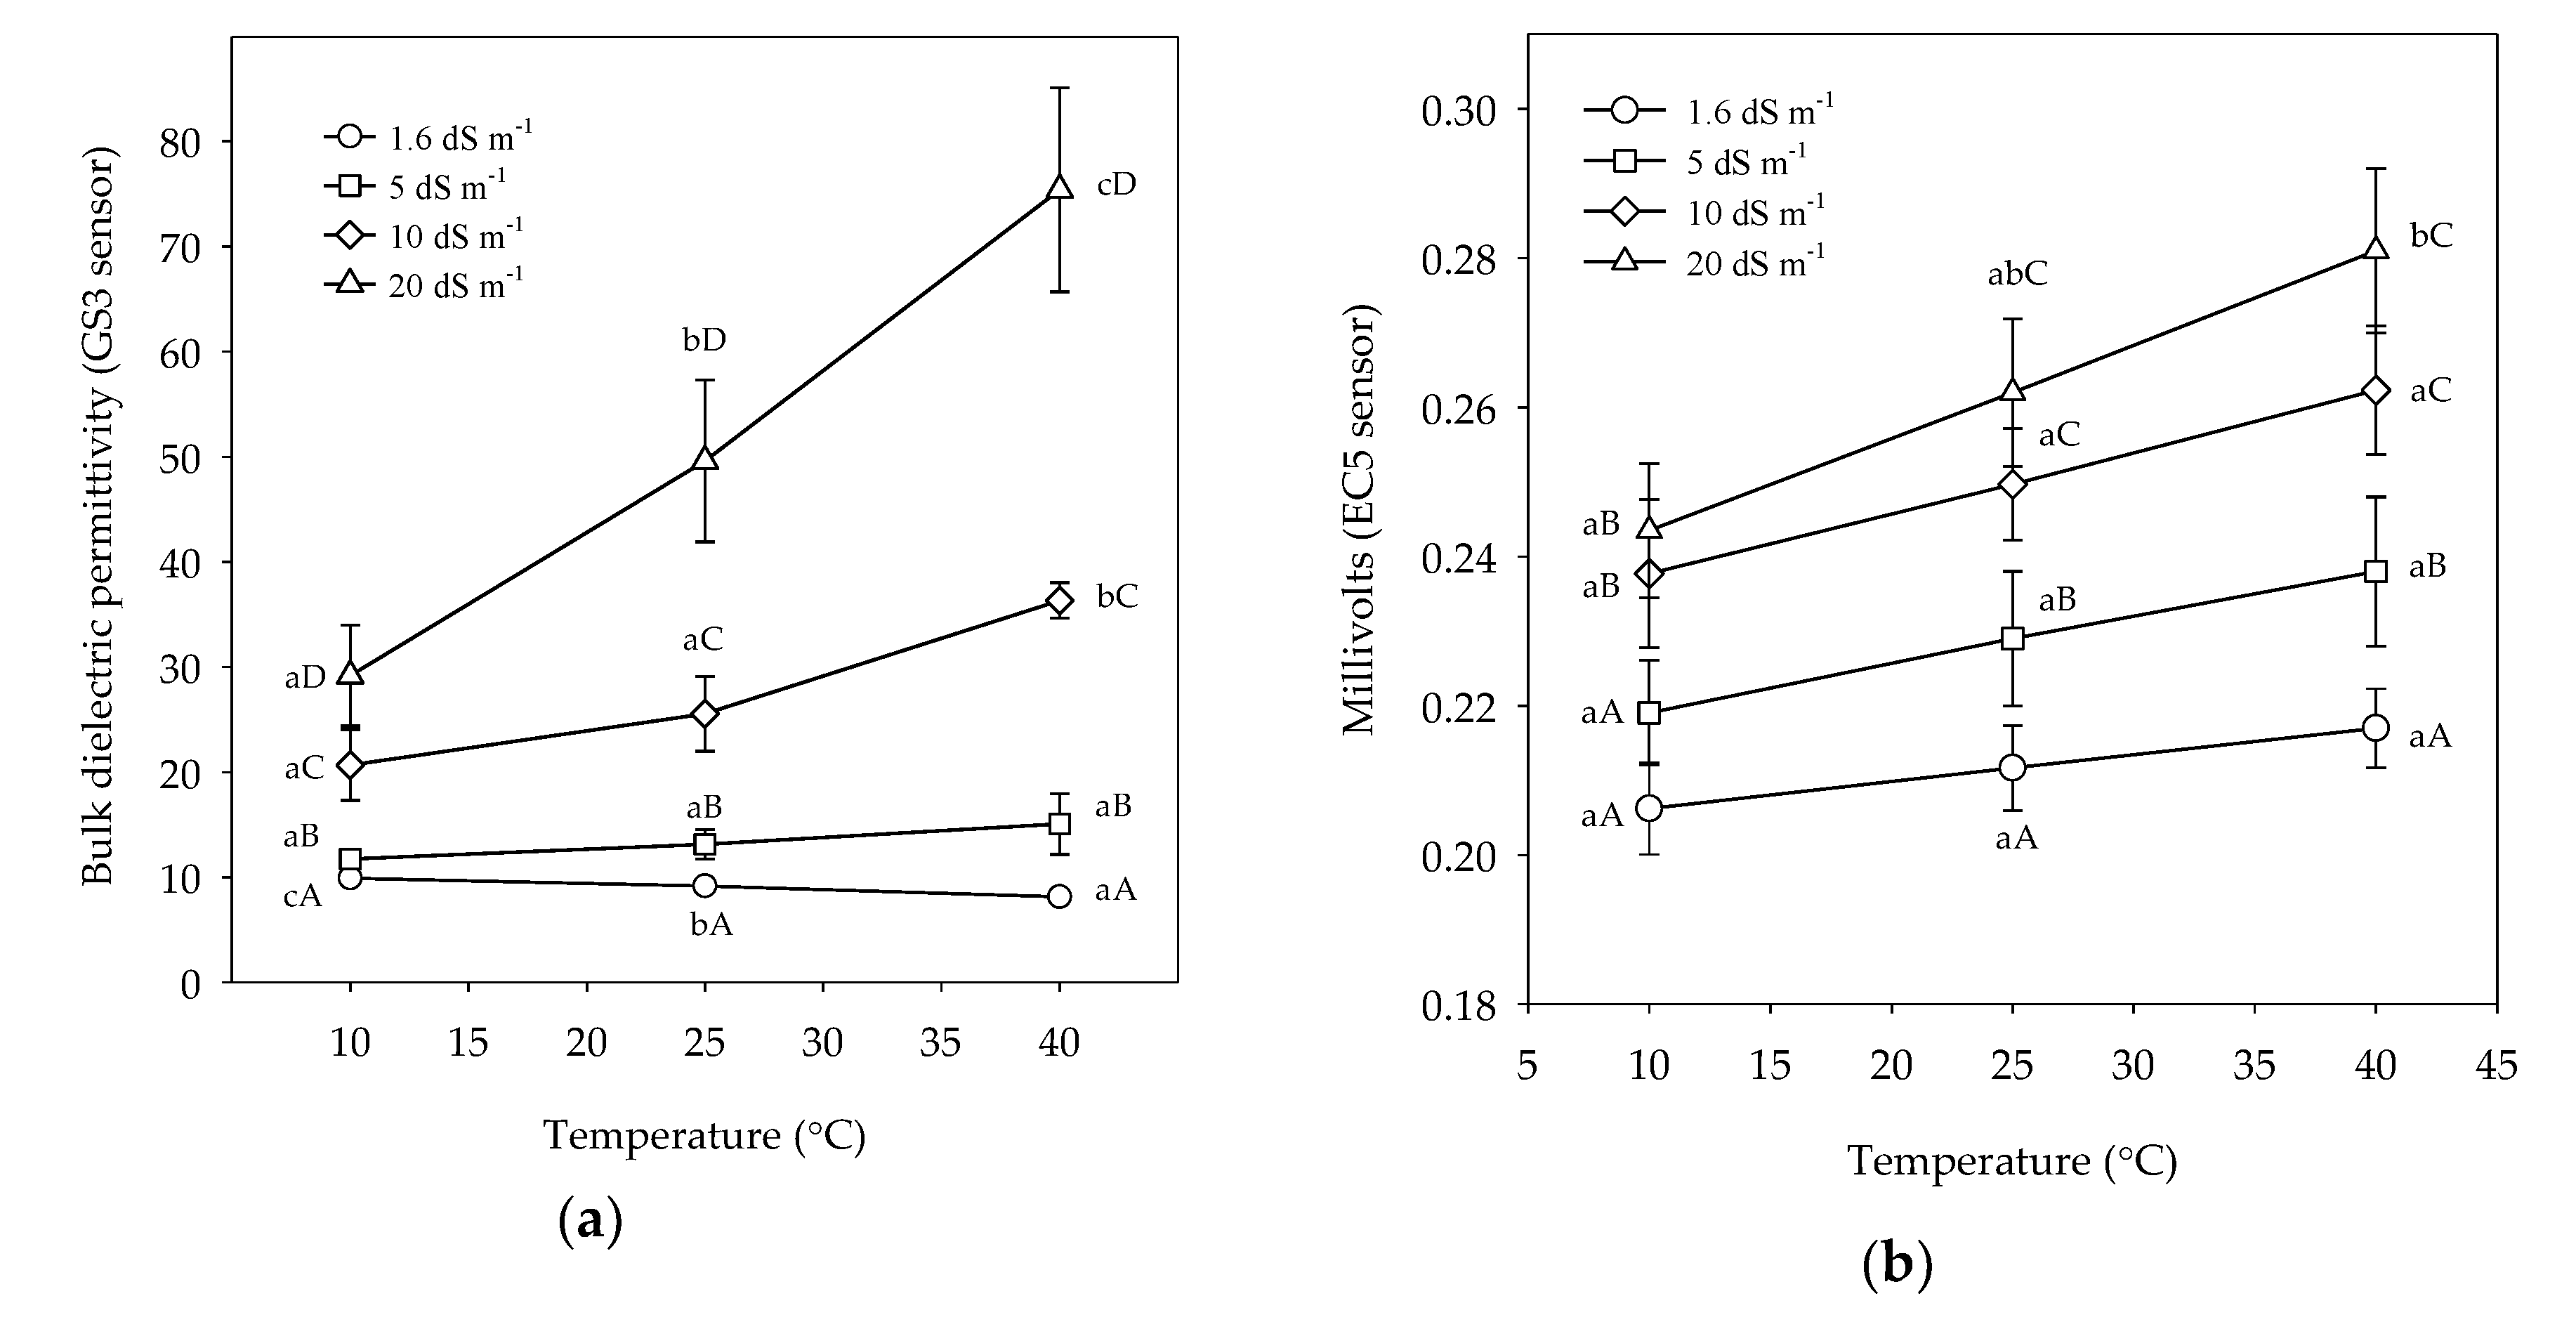
3.2.2. Permittivity and Voltage

Salinity and temperature significantly affected permittivity and voltage (Figure 3c–f). The presence of a significant salinity × temperature interaction indicates that the effect of temperature on permittivity and voltage depends on the level of salinity, and vice versa. To study the combined effects, the unifactorial statistical analyses for permittivity and voltage are presented in Figure 4.
The synergistic interaction of temperature and salinity has a clear effect on the permittivity measurements made by the GS3 (Figure 4a). The slope for 1.6 dS m−1 points to a slight fall in permittivity caused by the increase in temperature, as observed and discussed in the first experiment (Figure 2c). This effect leads to a minor error in the estimation of VWC but, since smaller thermal variations are more common in practice, this error would probably be sufficiently low to be ignored. Temperature does not produce significant effects on permittivity at a pore water EC of 5 dS m−1, so, if the error due to salinity is not considered, the estimation of the VWC by the GS3 would be quite accurate under this salinity (Figure 4a). At 10 dS m−1, there was a sharp increase in permittivity when 25 °C was exceeded, which led to significant differences between the measurements at 40°C and those made at 25 or 10 °C, although the differences were not significant between the measurements made at 10 and 25 °C. If the measurements at 25 °C are taken as a reference, the GS3 sensor would overestimate the VWC as temperatures increased. At the highest salinity level (20 dS m−1) there was a strong rise in permittivity from 10 to 40 °C, which might lead to substantial errors in the estimation of VWC. Fortunately, it is not usual for the substrate pore water EC to exceed 10 dS m−1 during the entire cultivation cycle in the commercial production of potted plants since higher salinity levels would injure most commercial crops. Cavins et al. [43] suggested that the pore water EC for potted salt-sensitive ornamental plants should not exceed the threshold value of 4.6 dS m−1. Sonnevelt et al. [44] found that the effect of pore water EC on plants depended on the species: while an EC of 4.2 dS m−1 in the root environment did not affect the production of Aster, but lowered the yield of species such as gerbera and rose. However, more salt-tolerant plants could cope with salinity levels higher than 10 dS m−1.
The voltage output of the EC5 probe tends to increase in a non-statistically significant manner with increasing temperature. This was true for 1.6, 5, and 10 dS m−1 (Figure 4b), which indicates that the temperature sensitivity of the EC5 output is quite constant if pore water EC is less than 10 dS m−1. However, the temperature-related voltage increased at the highest salinity value (Figure 4b), a change that acquired statistical significance when the value obtained at 10 °C was compared with that at 40 °C.
The outputs of both sensors increased with increasing salinity, although not proportionally for each given temperature, since a synergistic interactive effect was found between temperature and salinity (Figure 4). Figure 4a shows how strongly permittivity was affected by salinity at higher temperatures. As can be seen in Figure 4b, voltage output values increased significantly at each temperature as the salinity level rose from 1.6 to 10 dS m−1. However, there was no statistical difference between the voltage measurements at 10 and 20 dS m−1 (Figure 4b). This suggests that a pore water EC of 10 dS m−1 is the salinity threshold above which the gradual effect of salinity on voltage output is minimal.
Table 1 shows the permittivity–VWC calibration equations for the GS3 and EC5 sensors at the four salinity levels studied, all performed at 25 °C. If the calibration equation for 1.6 dS m−1 is used with a higher value of substrate salinity, the VWC would be overestimated. For instance, if a voltage value of 0.211 were obtained for a substrate with a pore water EC of 1.6 dS m−1 and then introduced in the calibration equations for 1.6, 5, 10 and 20 dS m−1 using the EC5 sensor (Table 1), VWC values of 50, 46, 40, 37%, respectively, would be obtained. This would represent overestimations of VWC of 4, 6, and 13% for salinities of 5, 10, and 20 dS m−1, respectively, suggesting that calibration equations should be modified according to the salinity [45].

3.3. Correction of the Effect of Temperature on Permittivity

Careful calibration of the sensors is vital to avoid errors in the estimation of VWC [46], and, in this respect, it has been suggested that such calibration errors may be greater than errors due to other factors such as temperature [47]. However, the effect of salinity can be minimized by creating a calibration curve with solutions of the same salinity as that of the growing medium, as discussed above. However, it is not so easy to correct the effect of temperature empirically. Temperature calibration curves are time consuming and involve the use of temperature-controlled equipment. Instead, it would be more convenient to apply a mathematical model to handle this kind of correction. The problem with this approach is that mathematical models depend on many variables such as type of sensor, plant container, type of soil, etc. [48], so an extensive database of values and equations for all types of soils and sensors would be needed.
In this section, an equation to minimize the effect of temperature on the measurement of permittivity under salinity is presented for a substrate consisting of 100% coconut fiber. Due to the synergistic effect of temperature and salinity on permittivity, the effect of temperature becomes more pronounced as salinity increases, so if the temperature effect were to be corrected mathematically, an equation would be needed for each salinity level. The resulting equations could be adapted to the existing salinity by modifying the parameters throughout the growing period, which would be very tedious in practice. Instead, the model proposed here considers the synergistic effect of temperature and salinity, so that it is not necessary to use more than one calibration equation in the cases where salinity levels change throughout the cultivation period.
Several models have previously been proposed to correct for the effect of temperature on permittivity [7,10,49,50]. For example, Chanzy et al. [44] proposed a linear regression based on the equation:
ε 25 ° C = ε T + m ( T 25 ) ,
where ε25°C is the permittivity (ε) at 25 °C, m is the slope of the line, ε is the permittivity at a given temperature, and T the temperature measured by the GS3 sensor. Table 2 displays the regression equations that linearly relate the permittivity values to the temperature at the four salinity levels studied in Figure 4a.
The values of the slopes of Table 2 (m) are quadratically related to ECpw according to the following equation (R2 = 0.99):
  m = 0.0019 E C p w 2 + 0.047   E C p w 0.1493 .
Since the slopes of the regression lines (m) depend on both soil type and salinity [48], Equation (2) would only be valid for a given soil type, 100% coconut fiber in this case. To increase the applicability of Equation (1), Equation (2) can be replaced by the value of the slope of Equation (1) so that the standardized permittivity at 25 °C is a function of temperature and salinity:
ε 25 ° C = ε T + 0.0019 E C p w 2 + 0.047 E C p w 0.1493 ( T 25 )
Table 3 shows the permittivity values estimated by Equation (3). The highest errors correspond to the data series for 10 dS m−1, probably because of the lower R2 of its regression equation. Therefore, to obtain a good estimation of permittivity using Equation (3), the linear regression on which it is based has to have a good fitting.

4. Conclusions

The effects of temperature on bulk EC can be positive (10–25 °C) or non-significant (25–40 °C), depending on the temperature range. Such effects are independent of substrate salinity and moisture. By maintaining substrate moisture high and constant, the bulk EC was seen to be very sensitive to substrate salinity, which suggests that bulk EC could be regarded as a good salinity index to program irrigation and flushing events. The sensitivity of permittivity to temperature was seen to be strongly substrate salinity dependent. At the lowest salinity (1.6 dS m−1), the GS3 sensor produced minor errors that underestimated the VWC as temperature increased. However, VWC estimated by this sensor was not affected by temperature at medium salinity levels (5 dS m−1). At higher salinity values, temperature produced errors of overestimation of the VWC, which further increased at 20 dS m−1 pore water EC. The estimation of VWC by the EC5 sensor was stable in the face of temperature changes up to 10 dS m−1, but at higher levels of salinity, it would be necessary to take into consideration the effects of temperature on the measurement of VWC. Salinity affected the outputs of both sensors to a greater extent than temperature, while high salinity in combination with high temperature led to worse estimations of VWC. Sensor calibration tended to overestimate VWC when the salinity during the process of calibration is lower than that of the substrate during the period of cultivation. If not accounted for, such salinity effects could introduce significant errors, therefore it is strongly recommended that calibration be modified accordingly. In the case of the GS3 sensor, a linear regression model that considered the synergistic interaction of salinity and temperature was able to minimize the effect of substrate temperature on permittivity measurements.

Author Contributions

Conceptualization, S.B.; methodology, S.B. and J.O.; software, S.B. and D.B.; validation, J.O., D.B. and M.J.S.-B.; formal analysis, S.B. and D.B.; investigation, S.B., J.O., and D.B.; resources, M.J.S.-B. and M.F.O.; writing—original draft preparation, S.B., J.O. and D.B.; writing—review and editing, S.B., D.B., J.O., M.J.S.-B. and M.F.O.; visualization, S.B. and D.B.; supervision, S.B.; project administration, M.J.S.-B. and M.F.O.; funding acquisition, M.S, M.F.O. All authors have read and agreed to the published version of the manuscript.

Funding

This research was funded by the Ministry of Science, Innovation, and Universities of Spain, and the European Regional Development Fund, grant number RTI2018-093997-B-I00, and by the Spanish AEI (grant number PCI 2019-103608) under the PRIMA programme in the frame of the PRECIMED project. PRIMA is an Art.185 initiative supported and co-funded under Horizon 2020, the European Union’s Programme for Research and Innovation.

Conflicts of Interest

The authors declare no conflict of interest.

References

  1. Eller, H.; Denoth, A. A capacitive soil moisture sensor. J. Hydrol. 1996, 185, 137–146. [Google Scholar] [CrossRef]
  2. Incrocci, L.; Marzialetti, P.; Incrocci, G.; Di Vita, A.; Balendonck, J.; Bibbiani, C.; Spagnol, S.; Pardossi, A. Sensor-based management of container nursery crops irrigated with fresh or saline water. Agric. Water Manag. 2019, 213, 49–61. [Google Scholar] [CrossRef]
  3. Blonquist, J.M.; Jones, S.B.; Robinson, D.A. Standardizing Characterization of Electromagnetic Water Content Sensors. Vadose Zone J. 2005, 4, 1059–1069. [Google Scholar] [CrossRef]
  4. Kizito, F.; Campbell, C.S.; Campbell, G.S.; Cobos, D.R.; Teare, B.L.; Carter, B.; Hopmans, J.W. Frequency, electrical conductivity and temperature analysis of a low-cost capacitance soil moisture sensor. J. Hydrol. 2008, 352, 367–378. [Google Scholar] [CrossRef]
  5. Jones, S.B.; Friedman, S.P. Particle shape effects on the effective permittivity of anisotropic or isotropic media consisting of aligned or randomly oriented ellipsoidal particles. Water Resour. Res. 2000, 36, 2821–2833. [Google Scholar] [CrossRef]
  6. Valdés, R.; Franco, J.A.; Sánchez-Blanco, M.J.; Bañón, S. Relationships among electrical conductivity measurements during saline irrigation of potted Osteospermum and their effects on plant growth. J. Hortic. Sci. Biotechnol. 2015, 90, 571–577. [Google Scholar] [CrossRef]
  7. Seyfried, M.; Grant, L. Temperature Effects on Soil Dielectric Properties Measured at 50 MHz. Vadose Zone J. 2007, 6, 759. [Google Scholar] [CrossRef] [Green Version]
  8. Campbell, C.S. Response of ECH2O Soil Moisture Sensor to Temperature Variation; Decagon Devices: Pullman, WA, USA, 2002; p. 5. [Google Scholar]
  9. Scoggins, H.L.; van Iersel, M.W. In Situ Probes for Measurement of Electrical Conductivity of Soilless Substrates: Effects of Temperature and Substrate Moisture Content. HortScience 2006, 41, 210–214. [Google Scholar] [CrossRef]
  10. Rosenbaum, U.; Huisman, J.A.; Vrba, J.; Vereecken, H.; Bogena, H.R. Correction of Temperature and Electrical Conductivity Effects on Dielectric Permittivity Measurements with ECH2O Sensors. Vadose Zone J. 2011, 10, 582–593. [Google Scholar] [CrossRef]
  11. Or, D.; Wraith, J.M. Temperature effects on soil bulk dielectric permittivity measured by time domain reflectometry: A physical model. Water Resour. Res. 1999, 35, 371–383. [Google Scholar] [CrossRef]
  12. Campbell, C.S.; Campbell, G.S.; Cobos, D.R.; Bissey, L.L. Calibration and Evaluation of an Improved Low-Cost Soil Moisture Sensor; Decagon Devices: Pullman, WA, USA, 2007. [Google Scholar]
  13. Nemali, K.S.; Montesano, F.; Dove, S.K.; van Iersel, M.W. Calibration and performance of moisture sensors in soilless substrates: ECH2O and Theta probes. Sci. Hortic. 2007, 112, 227–234. [Google Scholar] [CrossRef]
  14. Valdés, R.; Ochoa, J.; Franco, J.A.; Sánchez-Blanco, M.J.; Bañón, S. Saline irrigation scheduling for potted geranium based on soil electrical conductivity and moisture sensors. Agric. Water Manag. 2015, 149, 123–130. [Google Scholar] [CrossRef]
  15. Ashraf, A.M.; Rahman, A. Hormonal regulation of cold stress response. In Cold Tolerance in Plants: Physiological, Molecular and Genetic Perspectives; Springer: Berlin/Heidelberg, Germany, 2018. [Google Scholar]
  16. Ashraf, M.A.; Rahman, A. Cold stress response in Arabidopsis thaliana is mediated by GNOM ARF-GEF. Plant J. 2019, 97, 500–516. [Google Scholar] [CrossRef] [PubMed] [Green Version]
  17. Hedhly, A.; Hormaza, J.I.; Herrero, M. Global warming and sexual plant reproduction. Trends Plant Sci. 2009, 14, 30–36. [Google Scholar] [CrossRef] [PubMed]
  18. Yang, X.; Dong, G.; Palaniappan, K.; Mi, G.; Baskin, T.I. Temperature-compensated cell production rate and elongation zone length in the root of Arabidopsis thaliana. Plant Cell Environ. 2017, 40, 264–276. [Google Scholar] [CrossRef]
  19. Markham, J.W.; Bremer, D.J.; Boyer, C.R.; Schroeder, K.R. Effect of Container Color on Substrate Temperatures and Growth of Red Maple and Redbud. HortScience 2011, 46, 721–726. [Google Scholar] [CrossRef]
  20. Larcher, W. Temperature stress and survival ability of Mediterranean sclerophyllous plants. Plant Biosyst. 2000, 134, 279–295. [Google Scholar] [CrossRef]
  21. Rhoades, J.; Raats, P.A.C.; Prather, R. Effects of Liquid-phase Electrical Conductivity, Water Content, and Surface Conductivity on Bulk Soil Electrical Conductivity1. Soil Sci. Soc. Am. J. 1976, 40, 651–655. [Google Scholar] [CrossRef]
  22. Mualem, Y.; Friedman, S.P. Theoretical Prediction of Electrical Conductivity in Saturated and Unsaturated Soil. Water Resour. Res. 1991, 27, 2771–2777. [Google Scholar] [CrossRef]
  23. Bañón, S.; Ochoa, J.; Bañón, D.; Ortuño, M.F.; Sánchez-Blanco, M.J. Controlling salt flushing using a salinity index obtained by soil dielectric sensors improves the physiological status and quality of potted hydrangea plant. Sci. Hortic. 2019, 247, 335–343. [Google Scholar] [CrossRef]
  24. Rhoades, J.D.; Shouse, P.J.; Alves, W.J.; Manteghi, N.A.; Lesch, S.M. Determining Soil Salinity from Soil Electrical Conductivity using Different Models and Estimates. Soil Sci. Soc. Am. J. 1990, 54, 46–54. [Google Scholar] [CrossRef]
  25. Hilhorst, M.A. A Pore Water Conductivity Sensor. Soil Sci. Soc. Am. J. 2000, 64, 1922–1925. [Google Scholar] [CrossRef] [Green Version]
  26. Regalado, C.M.; Ritter, A.; Rodríguez-González, R.M. Performance of the Commercial WET Capacitance Sensor as Compared with Time Domain Reflectometry in Volcanic Soils. Vadose Zone J. 2007, 6, 244–254. [Google Scholar] [CrossRef]
  27. Muñoz-Carpena, R.; Regalado, C.M.; Ritter, A.; Alvarez-Benedí, J.; Socorro, A.R. TDR estimation of electrical conductivity and saline solute concentration in a volcanic soil. Geoderma 2005, 124, 399–413. [Google Scholar] [CrossRef]
  28. Seyfried, M.S.; Murdock, M.D. Measurement of Soil Water Content with a 50-MHz Soil Dielectric Sensor. Soil Sci. Soc. Am. J. 2004, 68, 394–403. [Google Scholar] [CrossRef]
  29. Zhang, Y.; Shen, Y. Wastewater irrigation: Past, present, and future. WIREs Water 2019, 6, e1234. [Google Scholar] [CrossRef]
  30. Hasen, R.C.; Christman, J.C.; Derksen, R.C. Statistical evaluation of instruments designed to measure volumetric water content of soilless container media. Appl. Eng. Agric. 2006, 22, 753–763. [Google Scholar] [CrossRef]
  31. Bittelli, M. Measuring Soil Water Content: A Review. HortTechnology 2011, 21, 293–300. [Google Scholar] [CrossRef]
  32. Gaskin, G.J.; Miller, J.D. Measurement of Soil Water Content Using a Simplified Impedance Measuring Technique. J. Agric. Eng. Res. 1996, 63, 153–159. [Google Scholar] [CrossRef]
  33. Cavins, T.J.; Whipker, B.E.; Fonteno, W.C. Pourthru: A method for monitoring nutrition in the greenhouse. Acta Hortic. 2008, 779, 289–298. [Google Scholar] [CrossRef]
  34. Corwin, D.L.; Lesch, S.M. Apparent soil electrical conductivity measurements in agriculture. Comput. Electron. Agric. 2005, 46, 11–43. [Google Scholar] [CrossRef]
  35. Topp, G.C.; Davis, J.L.; Annan, A.P. Electromagnetic determination of soil water content: Measurements in coaxial transmission lines. Water Resour. Res. 1980, 16, 574–582. [Google Scholar] [CrossRef] [Green Version]
  36. Ma, R.; McBratney, A.; Whelan, B.; Minasny, B.; Short, M. Comparing temperature correction models for soil electrical conductivity measurement. Precision Agric. 2011, 12, 55–66. [Google Scholar] [CrossRef]
  37. Amente, G.; Baker, J.M.; Reece, C.F. Estimation of Soil Solution Electrical Conductivity from Bulk Soil Electrical Conductivity in Sandy Soils. Soil Sci. Soc. Am. J. 2000, 64, 1931–1939. [Google Scholar] [CrossRef]
  38. Rhoades, J.D.; Manteghi, N.A.; Shouse, P.J.; Alves, W.J. Soil Electrical Conductivity and Soil Salinity: New Formulations and Calibrations. Soil Sci. Soc. Am. J. 1989, 53, 433–439. [Google Scholar] [CrossRef] [Green Version]
  39. Peter, A.; Ferrarezi, R.; Thomas, P.; Van Iersel, M. In situ measurements of the electrical conductivity (EC) of substrates: The relationship between bulk EC, pore water EC and substrate water content. HortScience 2011, 46, 198–199. [Google Scholar]
  40. Malicki, M.A.; Walczak, R.T. Evaluating soil salinity status from bulk electrical conductivity and permittivity: Evaluating soil salinity. Eur. J. Soil Sci. 1999, 50, 505–514. [Google Scholar] [CrossRef]
  41. Cobos, D.; Campbell, C. Correcting Temperature Sensitivity of ECH2O Soil Moisture Sensors; Decagon Devices: Pullman, WA, USA, 2007; p. 7. [Google Scholar]
  42. Valdés, R.; Miralles, J.; Franco, J.A.; Sánchez-Blanco, M.J.; Bañón, S. Using soil bulk electrical conductivity to manage saline irrigation in the production of potted poinsettia. Sci. Hortic. 2014, 170, 1–7. [Google Scholar] [CrossRef]
  43. Cavins, T.J.; Whipker, B.E.; Fonteno, W.C.; Harden, B.; McCall, I.; Gibson, J.L. Monitoring and Managing pH and EC Using the PourThru Extraction Method; NC State University: Raleigh, NC, USA, 2000; p. 17. [Google Scholar]
  44. Sonneveld, C.; Baas, R.; Nijssen, H.M.C.; de Hoog, J. Salt tolerance of flower crops grown in soilless culture. J. Plant Nutr. 1999, 22, 1033–1048. [Google Scholar] [CrossRef]
  45. Inoue, M.; Ould Ahmed, B.A.; Saito, T.; Irshad, M.; Uzoma, K.C. Comparison of three dielectric moisture sensors for measurement of water in saline sandy soil. Soil Use Manag. 2008, 24, 156–162. [Google Scholar] [CrossRef]
  46. Spelman, D.; Kinzli, K.-D.; Kunberger, T. Calibration of the 10HS Soil Moisture Sensor for Southwest Florida Agricultural Soils. J. Irrig. Drain Eng. 2013, 139, 965–971. [Google Scholar] [CrossRef]
  47. Roth, K.; Schulin, R.; Flühler, H.; Attinger, W. Calibration of time domain reflectometry for water content measurement using a composite dielectric approach. Water Resour. Res. 1990, 26, 2267–2273. [Google Scholar] [CrossRef]
  48. Chanzy, A.; Gaudu, J.-C.; Marloie, O. Correcting the Temperature Influence on Soil Capacitance Sensors Using Diurnal Temperature and Water Content Cycles. Sensors 2012, 12, 9773–9790. [Google Scholar] [CrossRef] [PubMed] [Green Version]
  49. Goodchild, M.S.; Kühn, K.D.; Nicholl, C.; Jenkins, M.D. Temperature correction of substrate moisture measurements made in coir in polytunnel-grown strawberries. Acta Hortic. 2018, 1197, 147–154. [Google Scholar] [CrossRef]
  50. Kargas, G.; Soulis, K.X. Performance evaluation of a recently developed soil water content, dielectric permittivity, and bulk electrical conductivity electromagnetic sensor. Agric. Water Manag. 2019, 213, 568–579. [Google Scholar] [CrossRef]
Figure 1. Usual setup of the GS3 soil moisture, temperature, and EC sensor (a) and the EC-5 soil moisture sensor (b) of Decagon Devices (METER Group, Inc. USA).
Sustainability 12 06577 g001
Figure 2. Statistical significance of the effects of the temperature (T), volumetric content of water (VWC), and its interaction on the bulk EC (ECb), dielectric permittivity (εb), and millivolts (mV). The EC of pore water was 1.6 dS m−1. T-ECb (a), VWC-ECb (b), T-εb (c), VWC-εb (d), T-mV (e), VWC-mV (f). Temperature x VWC interaction was not significant for the three outputs. Bars represent standard errors. For each panel, different letters indicate significant differences according to the LSD test at p ≤ 0.05 (*), p ≤ 0.01 (**) and p ≤ 0.001 (***). NS indicates no statistical significance.
Sustainability 12 06577 g002
Figure 3. Statistical significance of the effects of pore water EC (ECpw), temperature (T), and their interaction on the bulk EC (ECb) and dielectric permittivity (εb) at a constant substrate VWC of 51%. T-ECb (a), ECpw-ECb (b), T-εb (c), ECpwb (d), T-mV (e), ECpw-mV (f). Temperature x ECpw interaction was not significant for the ECb, but it was significant for the εb *** and mV **. Bars represent the standard errors. For each panel, different letters indicate significant differences according to the LSD test at p ≤ 0.05 (*), p ≤ 0.01 (**) and p ≤ 0.001 (***). NS indicates no statistical significance.
Sustainability 12 06577 g003
Figure 4. Interactive effects of temperature and salinity on the permittivity output of the GS3 sensor (a) and the voltage output of the EC5 sensor (b). Bars represent the standard error. Letters A, B, C indicate significant differences (p < 0.01) among salinity values for each tested temperature, and letters a, b, c indicate significant differences (p < 0.01) among temperature values for each tested salinity.
Sustainability 12 06577 g004
Table 1. Coconut fiber specific calibrations relating volumetric water content (VWC) and millivolts (mV) for the EC5, and with bulk dielectric permittivity (εb) for the GS3 probe, at different pore water EC values (ECpw).
ECpw
(dS m−1)
EquationsSignificanceR2
EC51.6VWC = −39.30 + 423 mV***0.97
5VWC = −36.45 + 393 mV***0.97
10VWC = −19.90 + 283 mV***0.97
20VWC = −14.38 + 245 mv***0.96
GS3 1.6VWC = 11.32 + 7.18εb − 0.32εb2***0.98
5VWC = 14.43 + 5.56εb − 0.21εb2***0.97
10VWC = 18.58 + 2.88εb − 0.06εb2***0.96
20VWC = 20.12 + 1.01εb − 0.008εb2***0.97
*** indicate significant at p < 0.001. Coefficient of determination, R2.
Table 2. Linear regression equations relating permittivity ( ε ) to temperature (T) and their determination coefficients (R2) at different pore water EC (ECpw) levels.
ECpw (dS m−1)Regression EquationR2
20 ε = 1.5397 T + 12.892 0.99
10 ε = 0.5213 T + 14.493 0.95
5 ε = 0.1112 T + 10.541 0.99
1.6 ε = 0.059 T + 10.548 0.99
Table 3. Results of temperature and salinity correction for Equation (3): temperature (T), pore water EC (ECpw), permittivity measured without correction (εT), permittivity estimated by Equation (3) (εe), and the difference between εe and permittivity measured at 25 °C (Δ).
T (°C)ECpw (dS m−1)εT (F/m)εe (F/m)Δ (%)
401.68.19.20
251.69.29.20
101.69.98.93
405.015.113.10
255.013.113.10
105.011.713.75
401036.328.712
251025.625.60
101020.728.411
402075.452.15
252049.649.60
102029.252.56

