1. Introduction
Small and medium-sized enterprises (SMEs) constitute the backbone of national economies in many countries. SMEs are the predominant types of businesses involved in Organization for Economic Cooperation and Development economics and typically account for two-thirds of all employment [
1]. They also make strong positive contributions to bank profitability [
2].
However, it is difficult for SMEs to raise funds from commercial banks despite various government efforts encouraging them to do so. There are four main factors that keep SMEs off banks’ lending lists are that SMEs often lack sufficient collateral; SMEs cannot provide reliable financial data; SMEs fail at higher rates than large corporations; and frameworks and systems for SME risk evaluation are outdated [
3,
4].
On one hand, SMEs contribute considerably to economic and bank profitability; on the other hand, lending to SMEs may come with greater risks than lending to large corporations. This dilemma has attracted considerable research interest among both academics and practitioners. Since the groundbreaking work of [
5], many default prediction models focusing on SMEs and utilizing various cooperate financial indicators have been proposed [
6,
7,
8,
9].
Due to the limited quality and credibility of SMEs’ financial reports, scholars have started to use internal non-financial data in default predictions. The study in [
10] introduced small business owners’ personal credit histories into a model. In [
11], the authors combined traditional credit factors such as debt-to-income ratios with business owners’ banking transactions. The result of [
8] built bankruptcy prediction model by adding the financial reports of companies related to board members and managers of the targeted SME.
Nevertheless, the utility of internal non-financial data still suffers from two issues: data availability and reliability. Such data are difficult to collect, and sample sizes are sometimes so limited that variance and bias levels can be significant. In addition to companies’ internal non-financial data, another form of data, external credit data, is also neglected; such data can be collected publicly, including basic corporate information, companies’ credit information from the government, and court verdicts. With the development of company credit systems, more government agencies are providing such information to the public. In China, almost all public credit information on companies is available on the website. However, to the best of our knowledge, no previous work has used external credit data to build default prediction models.
The availability and reliability of external credit data solve the data problem in default prediction models. The aim of the study, thereby, is to prove that use of only external public credit data without traditional financial ratios and internal non-financial data can have significant predictability of SME default. To prove the external credit data feasibility and applicability in the major mainstream models, we selected the three most popular models—logistic regression, CART, and LightGBM—to test the result. The collected data were then subjected to logistic regression, CART, and LightGBM model tests to demonstrate their reliability using various classification methods. In total, external data of 15,605 companies from 2017 to 2019 were selected as the research sample in this study. Among the methods tested, the LightGBM model exhibits the strongest prediction accuracy with an AUC value of 0.92 and an accuracy level of 0.87.
The study’s main contributions are as follows. First, this work extends the literature on SME default prediction models using external credit data. Second, this study explains the semantics of external credit data, why they are useful, and where to obtain them, at least within China. Third, this study compares and contrasts the prediction capacities of various types of external credit data.
The remainder of this paper is organized as follows.
Section 2 reviews the relevant literature on credit risk and default prediction.
Section 3 introduces the methodology used in this study, and
Section 4 describes the data and variables used.
Section 5 presents the experimental results. Finally, a conclusion summarizes the study’s contributions and limitations and identifies potential avenues for future research.
2. Literature Review
2.1. Default Prediction Methodologies
Most works published before the 1990s use discriminant analysis to model corporate bankruptcy predictions. Beaver published the seminal works conducted in this field, which provided an empirical verification of the usefulness of accounting data. Altman employed a multiple discriminant statistical methodology to investigate a bankruptcy prediction using a set of financial and economic ratios [
12,
13]. In [
14], the author was the first to use the conditional logit model to predict the default rate and found that logit and multiple discriminant analysis (MDA) differ in that the former does not impose the restrictive assumptions of MDA and better tolerates sample imbalances. The author in [
15] modeled default predictions using a multi-logit approach. This approach was concerned not only with predicting whether a company will fail, but with simultaneously predicting when it will fail.
With the development of machine learning technologies, more researchers have been using machine learning methods in default prediction research. In [
16], the author created a model based on the combination of two methods, discriminant analysis and logistic regression, and the overall prediction powers of the combined model are 90.6%, 93.8%, and 90.4%. In [
17], the author applied AdaBoosted naive Bayes scoring to the problem of diagnosing insurance claim fraud, which effectively combined the advantages of boosting and the explanatory power of the weight of evidence scoring framework. The study in [
18] proposed a novel approach for credit card fraud detection, which combines evidence from current as well as past behavior. The Dempster–Shafer theory was used to combine such evidence, and an initial belief was computed. Bayesian learning is used to determine whether a transaction is suspicious. In [
19], the author reported on the results of experiments designed to assess the effectiveness of an inductive algorithm in discovering predictive knowledge structures in financial data. The author in [
20] provided a novel predictor selection procedure based on the non-parametric classification and regression tree (CART) method and tested its performance within a standard logit model. This study succeeded in finding a novel approach to selection of bankruptcy predictors based on the CART method. The study in [
21,
22] proposed the SVM-based method for credit scoring and the identification of significant features.
Following the mid-1980s, neural networks became the dominant research methodology used and were increasingly applied to default predictions. Altman compared traditional linear discriminant analysis (LDA) with logit analysis using an artificial intelligence algorithm known as a neural network (NN). The results indicated a balanced degree of accuracy and other beneficial characteristics between LDA and NN. Altman also pointed out the problems of the ‘black-box’ NN systems [
23]. The study in [
24] compared models developed by using logistic regression, random forest and neural network. The results indicated that all models demonstrated high discrimination accuracy and similar performance; neural network models yielded better results measured by all performance characteristics. The author in [
25] conducted a comprehensive study comparing classifier ensembles based on bagging, boosting and different numbers of combined classifiers using a Taiwan bankruptcy dataset. The study result showed that DT ensembles composed of 80–100 classifiers using the boosting method perform best. The authors of [
26] proved that machine learning algorithms such as LightGBM are more suitable for bankruptcy prediction than statistical models and by combining feature’s importance, the results became interpretable.
As logistic regression is widely used in linear models, the CART method is frequently utilized for attribute selection, and LightGBM is one of the most popular tools for non-linear modeling. All the three methods were adopted in this study.
2.2. Literature Review of Variables Used in Default Prediction
Before the 1980s, most researchers mainly used financial ratios to build bankruptcy prediction models, and the study target was listed companies. In 1968, Altman examined 22 financial ratios and found that the following five exhibit the best prediction capacities: working capital/total assets, retained earnings/total assets, earnings before interest and tax (EBIT)/total assets, market value equity/book value (BV) of total debt, and sales/total assets. These ratios can be classified under the following five categories: liquidity, profitability, leverage, solvency, and activity ratios. These variables are used to compose the widely used Z-score [
13]. In 1977, Altman extended the above five ratios with the market value of equity to develop the “Zeta model.” [
27].
The study in [
28] added industry-relative financial ratios to improve the prediction of firms in financial distress. The industry-relative specification appeared to add incremental information not contained in the model based on the unadjusted financial ratios. The study in [
29] showed that for the Japanese market, three predictor variables—including retained earnings/total assets, total debt/total assets, and current liability/sales—were selected by the adaptive least absolute shrinkage and selection operator (LASSO) method. In [
30], the author used net working capital to total assets, retained earnings to total assets, earnings before interest and tax to total assets, and market value of equity to book value of debt to investigate financial distress.
Since the study in [
5] found that not all financial ratios offer the same SME prediction capacities, many scholars began to use non-financial indicators to predict SME bankruptcy. In [
31] the author analyzed credit file data from four major German banks and found evidence that the combined use of financial and non-financial factors leads to a more accurate prediction of future default events than the single use of each of these factors. The study in [
10] examined the economic effects of small business credit scoring (SBCS) and found that it was associated with expanded quantities, higher average prices, and greater risk levels for small business credits under
$100,000. In [
11], the authors combined customer transactions and credit bureau data for a sample of a major commercial bank’s customers. The study in [
32] discovered that the most important factor for small firms seems to be the surprisingly strong relationship between the company and its owner, which entails consequences in all areas of the company, especially in its early stages of development. The study in [
8] complemented traditional low-dimensional data, such as financial ratios, with high-dimensional data on the company’s directors and managers in the prediction models. The authors found that the relational model gave improved predictions over a simple financial model when detecting the riskiest firms. In [
33], the author predicted the credit risk of China’s SMEs for financial institutions (FIs) in supply chain financing (SCF) by using both financial and non-financial data. Altman used non-financial and “event” data to supplement accounting data, which is often incomplete and opaque for non-listed companies [
1]. The study in [
34,
35] argued that considering soft information (especially on management quality) can substantially improve the results of SMEs credit default predictions.
The findings explained above indicate that researchers highlight the benefits of using non-financial indicators such as business ages and types, industrial sectors, SME owners’ banking transactions, corporate governance and management quality, and the financial status of companies owned by board members and managers. However, for SMEs, both internal financial and non-financial data are difficult to collect, and when they are collected, the reliability of such data is questionable. Since the financial data can be collected from banks to which SMEs apply for loans, these data can only be accessed by banks. Non-financial data such as owners’ banking transactions are also only available to the account banks. Therefore, in this study, only publicly released external credit data were utilized.
3. Methodology
3.1. Variable Selection
As previous works have repeatedly shown, firm level financial data used for SME default prediction are difficult to collect at best and unreliable at worst. Therefore, this study used publicly available external credit data to train the proposed prediction model. The data used are published by the Chinese government and are available on the internet.
After reviewing several websites providing such information such as the China Credit, National Enterprise Credit Publicity System, China Judgments Online, and Fujian Local Judgments Online websites, the studied information was categorized into three types: basic information (BI), company credit information from the government (CIG), and court verdict information (CVI). Basic information on company age (Age), size, and industry sector has been proven relevant by [
31,
36]. The study in [
28] argued that adding registered industry (RI) specification can increase the model prediction accuracy. In this study, company sizes are represented by registered capital, as this figure is stable and publicly available, instead of using total assets or annual revenue, which are frequently used as the measurement unit of size by researchers. The reason for using registered capital (RC) mainly lies in the fact that most of the SMEs’ financial reports are unreliable and unstable.
While to the best of our knowledge no work has utilized credit information published by governments to predict SME bankruptcy, this information has vital implications. In study [
37], the author argued that firms with strong corporate governance benefit from higher credit ratings relative to firms with weaker governance, and the credit ratings prove to be a signal of corporate governance ability, which affects the sustainable development of SMEs. The study of [
38] also found corporate governance to be an important factor in the occurrence of bankruptcy. As a result, it can be inferred that credit information can shed light on corporate governance and that businesses with low credit may be more prone to defaulting than their high-credit counterparts. We thus propose to take external credit information into consideration as variables such as tax compliance classification (TCC), number and amount of government regulation infringements and etc., TCC reveals how companies comply with tax codes and is measured on five levels: A, B, C, D, and M. A class is awarded to businesses with the best compliance, while D is assigned to those with the lowest compliance, and M is reserved for newly established companies. Once a company fails by chance or intentionally to pay tax on time, the tax bureau will punish the companies according to the consequence it may produce. In this study, we call this variable number of tax regulation infringements (TTRI), we suppose the more times the companies infringe the tax law, the higher probability the company will default. In China, when an company violates the rule of government, such as pollute the environment, the government will fine the company consequently, so we added two variables, amount of fines paid to the government (AFPG) and number of government regulation infringements (TGRI), into the model. All these data can be collected publicly.
While previous studies seldom introduced court verdicts into default prediction models, the study in [
1] discovered that SMEs entangled in litigation are at a higher risk of defaulting than others. Therefore, we propose to consider number of lawsuits (TS) and number of times the company was listed in untrustworthy records (TLUR), as well as the number of lawsuits (TS) and amount being sued for (AS). Since loans from banks serve as a vital source of cash, the frequency of being legally charged by banks for deferring payment or defaulting loans is identified as an important indicator, so number of lawsuits resulting from private lending (TSPL) was also added into the model. In China, inter-person lending is common practice, since business owners sometimes cannot find enough support from banks. Thus, being sued by friends or relatives is also an important harbinger of defaulting. Correspondingly, the number of lawsuits resulting from bank lending (TSLB) was also been considered.
A company is regarded as having defaulted when it does not fulfill repayment obligations in time and stops its operations [
8]. The names and information for all variables considered in the model are given in
Table 1 along with the websites from which information was retrieved.
3.2. Modeling Methods
Considering the prediction accuracy, sparsity, and nonlinear characteristics of the selected variables, we use three modeling methods to build our model: logistic regression (LR), CART, and the ensemble method.
3.2.1. Logistic Regression
Logistic regression, also known as the logit model, is a widely used tool for default predictions. It estimates conditional default probability of firms based on external variables by using the non-linear maximum log-likelihood technique. The derived logit model is of the following form:
where
is the probability that firm
i will fail given a vector of attribute variables
for firm
, and
is the parameter to be estimated. Following the majority of the prior literature, we refer to the model as being constructed using a dummy variable
taking the value of 1 for failed and 0 for non-failed.
3.2.2. Classification and Regression Trees (CARTs)
Decision tree (DT) techniques generate a set of tree-based classification rules used to construct a classification tree. In general, DTs are binary trees, which consist of a root node, non-leaf nodes, and leaf nodes connected by branches, whereby each non-leaf node has two branches leading to two distinct nodes. When applied to classification problems, leaf nodes represent classification groups such as default or non-default, and the non-leaf nodes each contain a splitting rule. The tree is built from a recursive process of splitting the data when moving from a higher to a lower level of the tree. The important DT building algorithms are the recursive partitioning algorithm and entropy algorithms such as CARTs. In this study, the CART algorithm was used to classify default and non-default firms.
3.2.3. Ensemble
The ensemble method was adopted as the main prediction method for this study. Ensemble methods have generally been used as tools to improve the accuracy of learning algorithms by constructing and combining an ensemble of weak classifiers, each of which needs only to be moderately accurate on the training set. Two popular methods for creating accurate ensembles are bagging [
39] and boosting [
40].
Bagging is a bootstrap aggregation method that creates and combines multiple classifiers, each of which is trained on a bootstrap replicate of the original training set. The bootstrap data are created by resampling examples uniformly with replacements from the original training set. Boosting constructs a composite classifier by sequentially training classifiers while increasing weight on the misclassified observations through iterations. The observations that are incorrectly predicted by previous classifiers are chosen more often than examples that were correctly predicted. Boosting combines predictions of the ensemble of classifiers with weighted majority voting by giving more weight toward more accurate predictions. Among all boosting algorithms, AdaBoost proposed by [
40] is one of the most widely used boosting methods.
The gradient boosting decision tree (GBDT) is a widely used ensemble algorithm due to its efficiency, accuracy, and inter-predictability. The GBDT was first proposed by [
41] as an ensemble model of decision trees that are trained in sequence. The GBDT performs well in many machine learning tasks such as multi-class classification, click prediction, and rank learning [
42,
43]. LightGBM [
44] is a GBDT approach that has been adopted in many academic and industry projects [
45]. The parameters of the ensemble model used in this study are listed in
Table 2.
3.3. Feature Importance Calculation Method
While based on theoretical inferences or practical implications, the proposed variables’ impacts on default prediction may not be equivalent. We therefore examined their significance to the exogenous variable (i.e., default) using the relative importance method [
46]. This method estimates the sum of improvements made when applying the targeted variable to split various internal nodes of a decision tree. The improvement is measured as the difference between squared errors of merging the entire sub-tree into a terminal node and splitting a given node with the proposed variable.
Definition 1. Given a set of variables (features) whereis a decision tree andis an internal node,
denotes the improvement of split nodewith variable, the importance of variable, in treeis defined as is the relative feature importance of variable and in decision tree . The summation of the right side is determined over all internal nodes split by variable . is the squared error of maximal estimated improvement as a result of the split. Overall, the relative importance of is the summation of all such squared improvements over all internal nodes for which is chosen as the splitting variable.
After determining the relative importance of variable in a single tree, the overall degree of variable importance can be constructed. For a collection of decision trees, the feature importance of variable can be generalized by the average over each tree’s importance.
Definition 2. Given a set of decision trees,, the importance of variableamong the set of trees is can also be adapted to other ensemble models such as the XGboost and LightGBM models.
4. Data and Variables
4.1. Data Collection
The data used in this study were collected from one district in Fujian, China, which consists of the external data during 2017–2019 of all the companies that defaulted in 2019, ensuring an observation window of at least two years. Information on these companies was retrieved from the National Enterprise Credit Publicity System managed by the State Administration for Market Regulation.
As the data are seriously skewed toward non-defaulted companies, stratified sampling was applied to balance the skew. As a result, 15,605 companies were randomly selected, including 8183 defaulted companies. The dependent variable (DEF) of the defaulted companies was marked as DEF = 1, and the non-defaulted was marked as DEF = 0.
Most credit information drawn from government data were taken from the China Credit website, China’s official government website publishing all credit-related information on companies. Basic data were collected from the National Enterprise Credit Publicity System website, and lawsuit data were derived from China Judgments Online and Fujian Local Judgments Online.
4.2. Statistics for the Sampled Data
Regarding the types of sampled data considered, two of the 12 variables proposed are categorical, and 10 are continuous. Categorical variables include the tax compliance classification (TCC) and registered industry (RI).
Statistics for the continuous variables are listed in
Table 3, including means, minimum values, maximum values, standard deviations, and percentages of zero values. With the exception of basic information, the zero ratios of most external public credit variables are very high, since most companies are not involved in credit and legal issues.
5. Results and Discussion
5.1. Model Establishment
The hold out method was employed to verify the validity of the proposed model where 80% of the collected data were reserved for training while the remaining 20% were used for testing and logistic regression. The CART algorithm and LightGBM were used to build our default prediction model with the proposed 12 independent variables.
Table 4 shows the significance of each variable utilized for logistic regression. It reveals that RC, Age, TCC_B, TTC_D, TCC_M, TTRI, TRGI, and TS significantly influence the default variable. The R-squared value of the logistic regression stands at 0.357.
Figure 1, on the other hand, shows the decision constructed by the CART model, which uses the Gini impurity index to select variables for classifying data. The Gini impurity index is a measure of how often a randomly chosen element from the set would be incorrectly labeled if it was randomly labeled according to the distribution of labels in the subset. From the tree structure of the CART model, we can judge which combination of the variables can have the highest purity to classify the dependent variable. For example, for the node with a Gini index score of 0.184, the first factor examined concerns whether a company has been assigned a “B” TCC code. The entire decision covers four levels and can achieve an accuracy value of 0.86. Branch
via Age > 2.5
to
covers 4926 cases, among which 4422 defaulted. Another node has a Gini index score of 0.173, and branch TCC = B, via Age ≤ 7.5 TTRI = 0 TS = 0 covers 2297 cases, among which 219 defaulted; from this we can infer that a company without TTRI, TS, TCC = B and Age ≤ 7.5 may have a higher probability to be a non-default company, which is in accordance with the argument in the variable selection section.
5.2. Model Verification
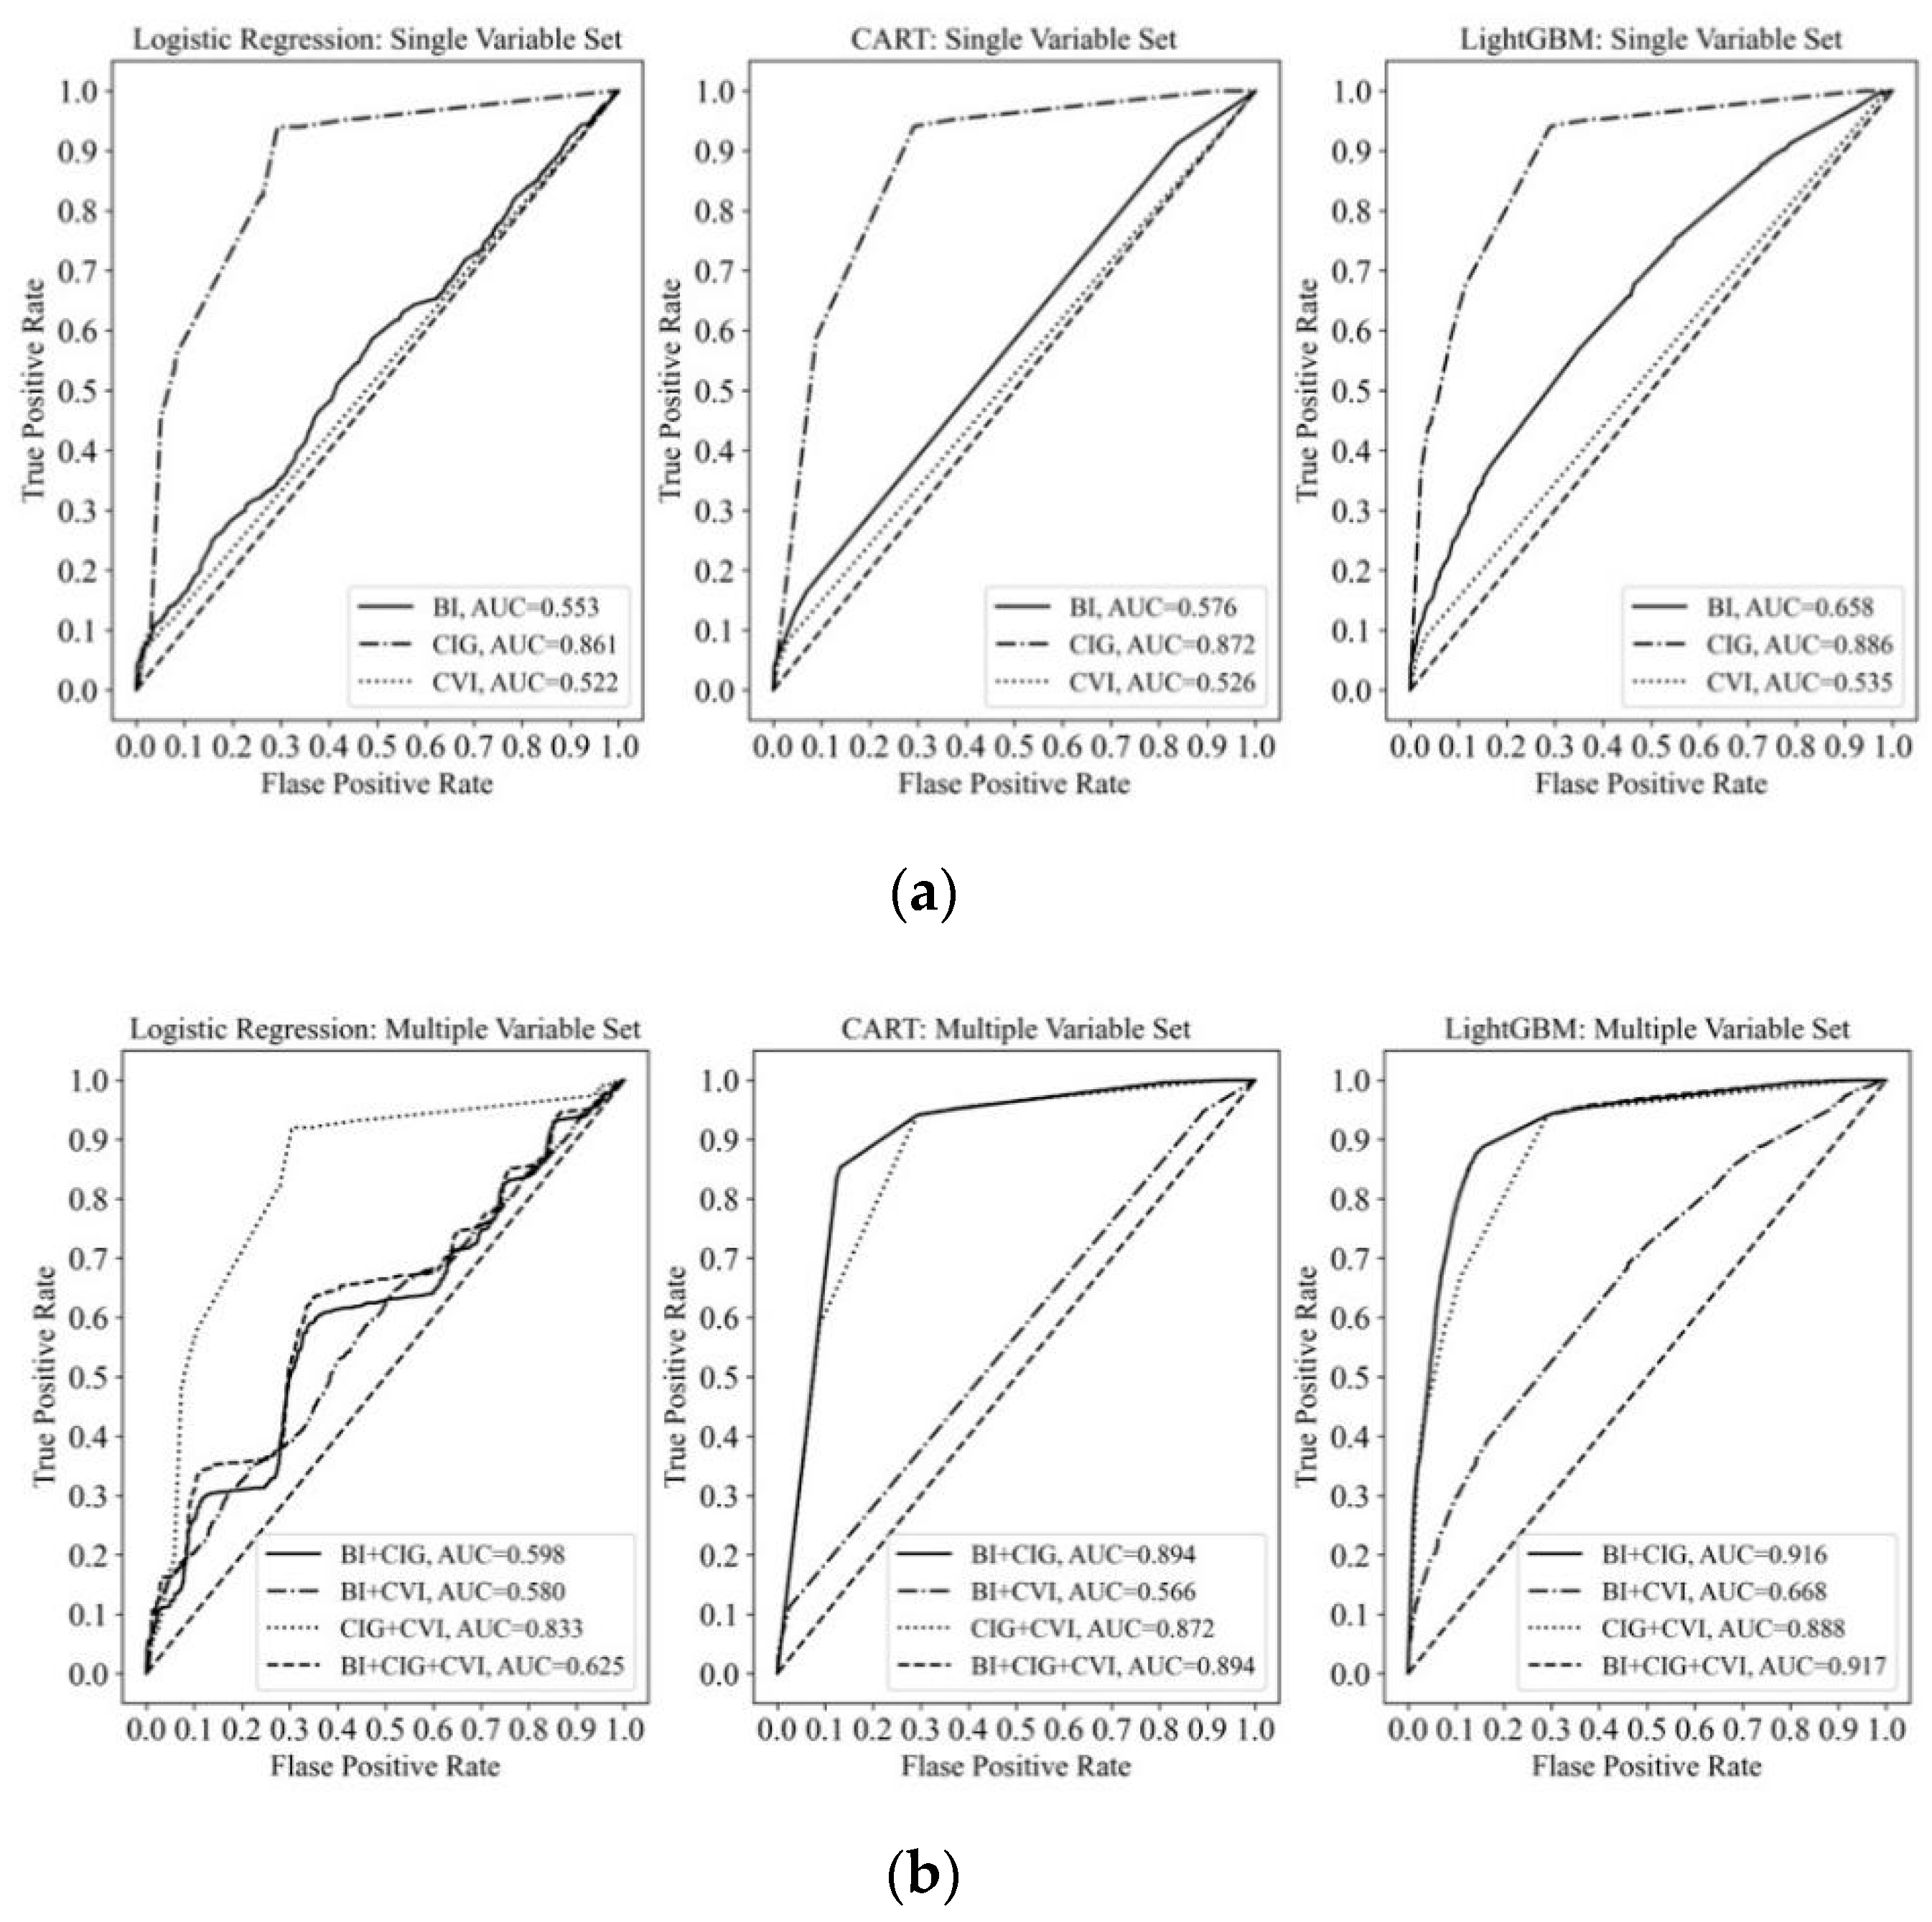
To further verify the effectiveness of variables related to basic information, public credit, and court verdicts, the accuracy of each combination is presented in
Table 5. Results are measured with indicators of accuracy and AUC. The table shows the prediction results for various combinations of three variables: basic information (BI), credit information from the government (CIG), and court verdict information (CVI). Model construction methods verified include logistic regression, CART, and LightGBM.
The results suggest that variables of BI and CIV offer mediocre prediction capabilities while CIG variables have strong prediction capacities. However, the combination of BI and CIG variables can achieve the best results when utilized via the CART model and light GBM.
CVI variables did not manifest high significance in this experiment, possibly because positive cases accounted for only a rather small proportion of the total sample. Less than 10% of the sampled companies were involved in lawsuits, and only 5% received fines.
Of the three methodologies adopted, the model constructed by LightGBM shows the strongest accuracy and AUC of 0.92 and 0.87.
Figure 2 shows AUC of different models (single variable set) and AUC of different models (multiple variable set).
5.3. Feature Importance Analysis
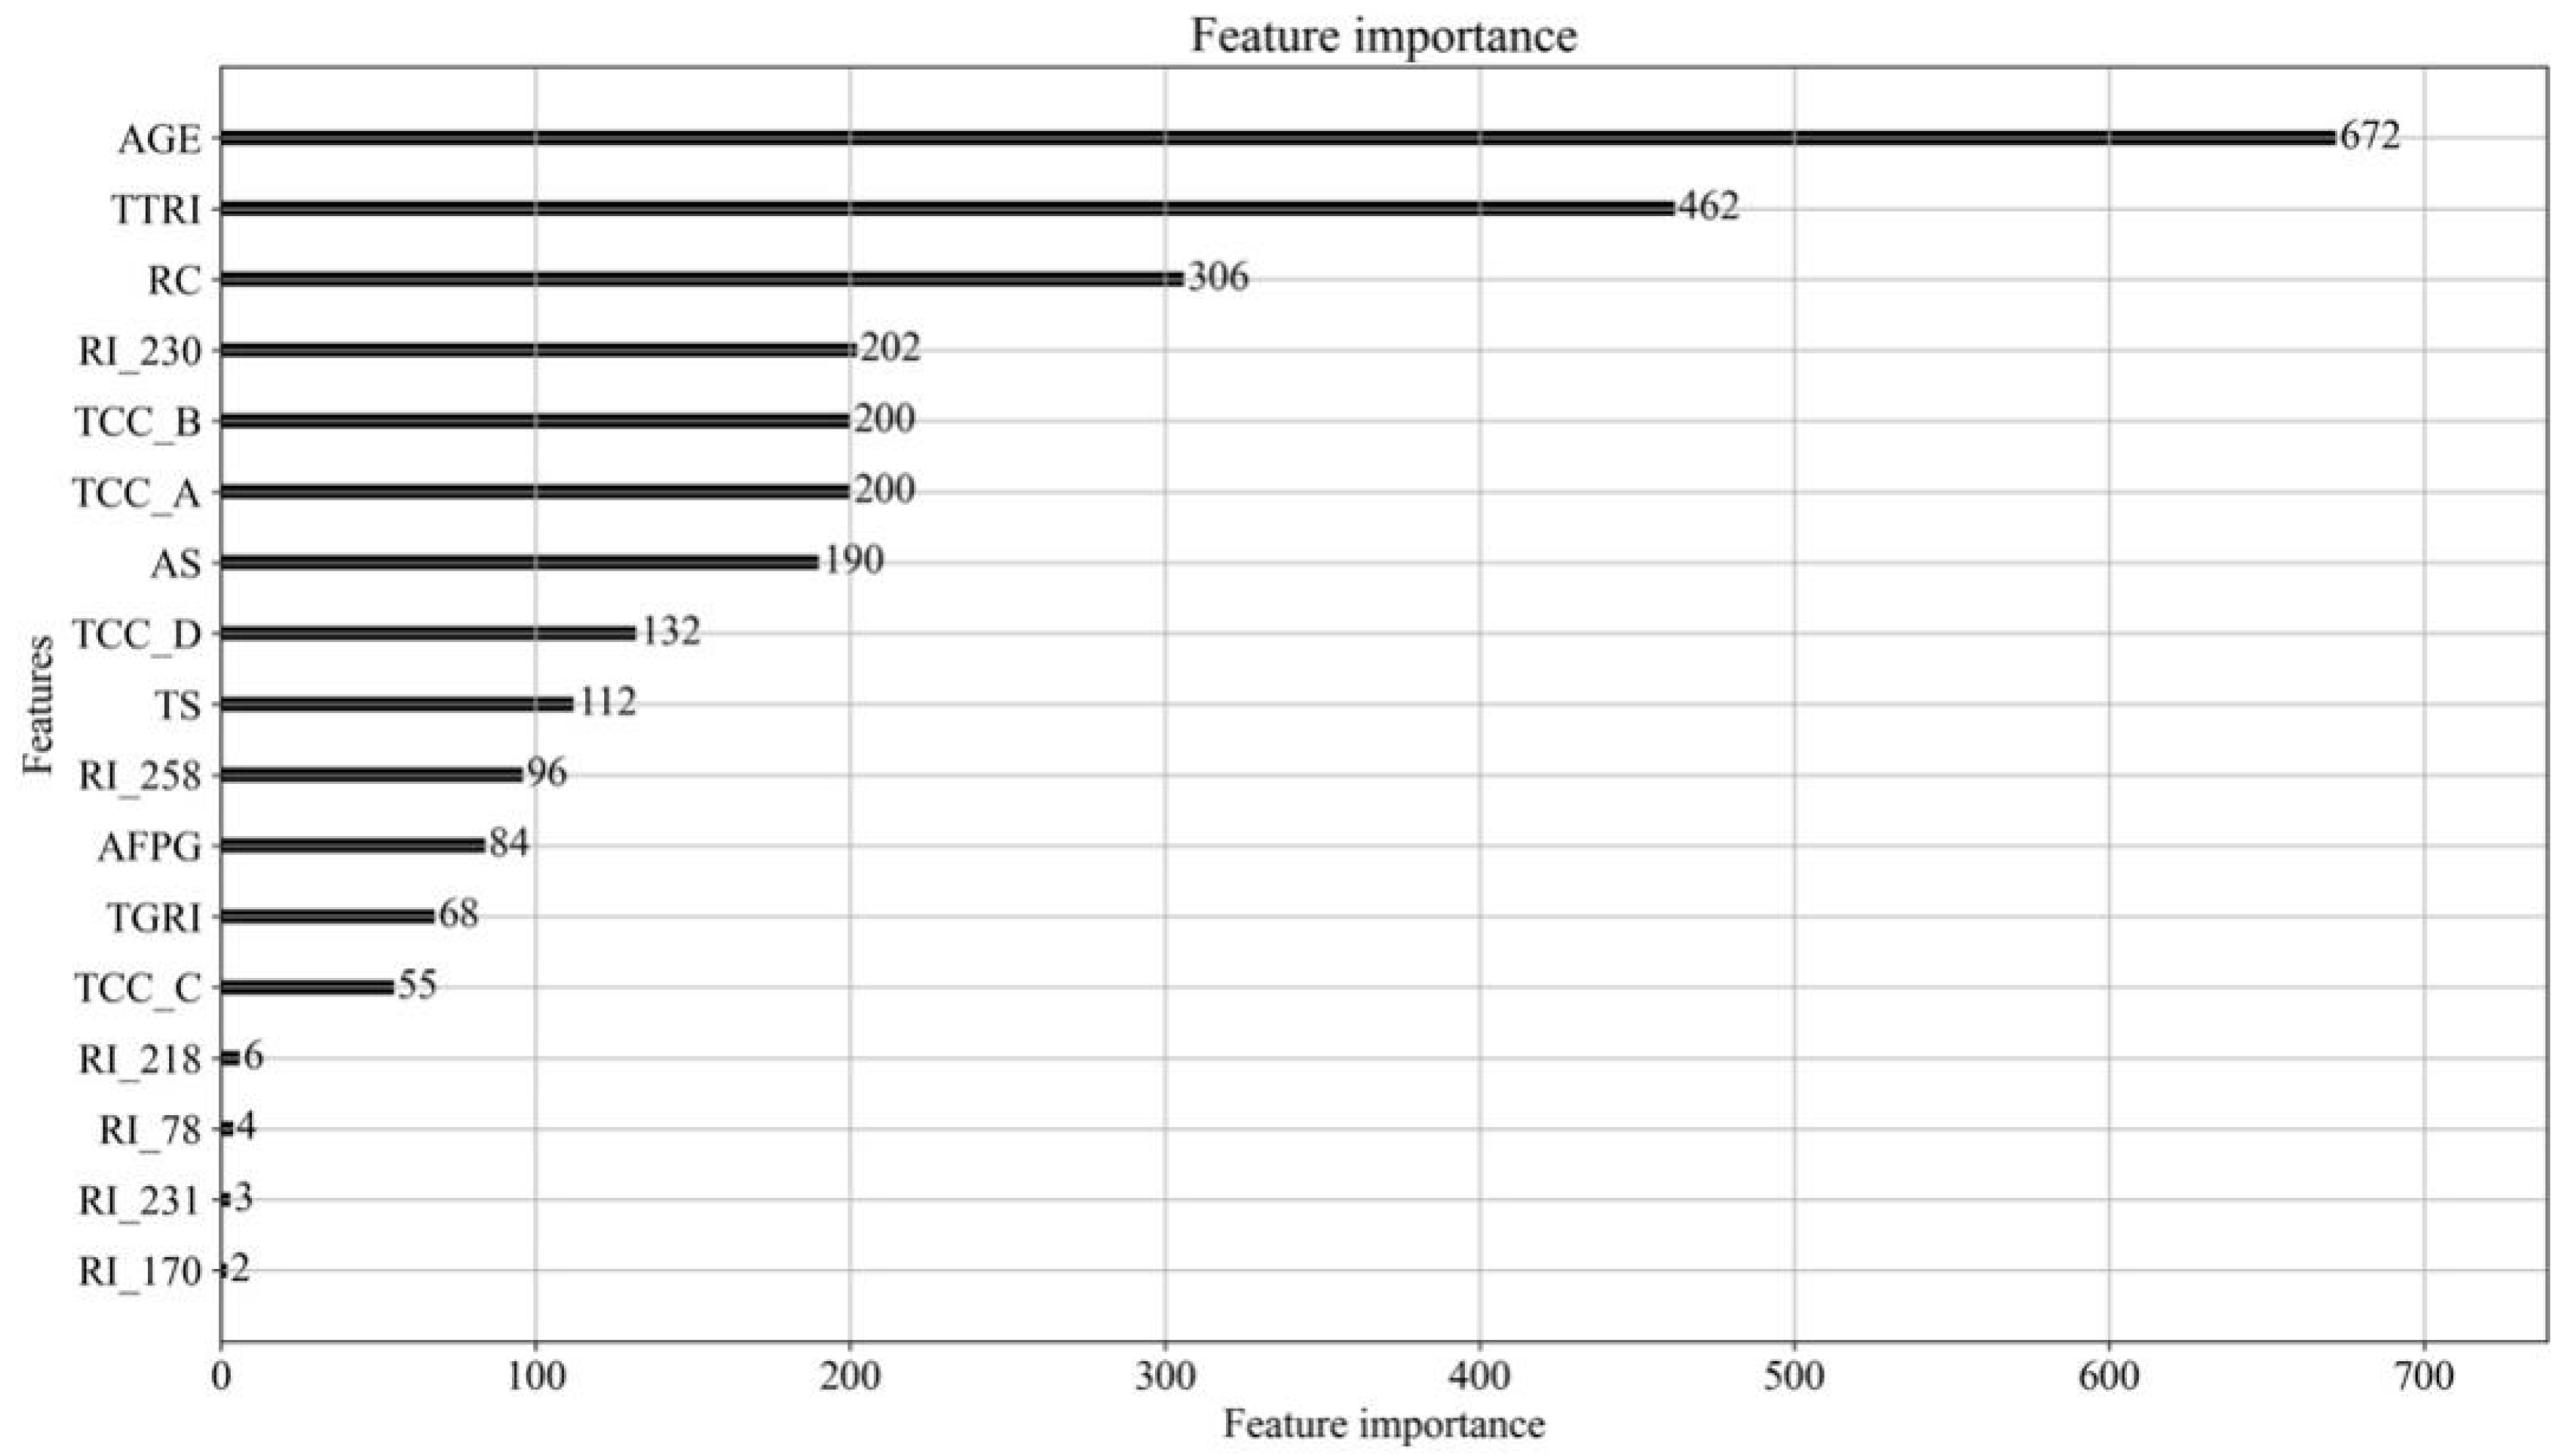
Through the application of LightGBM, the feature importance of explanatory variables can be determined. Feature importance is measured as a score that represents how dominant each feature is within a model. The higher the score is, the larger the forecasting capacity of a variable. The results displayed in
Figure 3 show that company age (Age) exhibits the strongest capacity followed by the number of tax regulation infringements (TTRI), registered capital (RC), the registered industry (RI230: wholesale textile products industry), tax compliance classification (TCC classes B and A), amount sued for (AS), tax compliance classification (TCC class D), number of lawsuits (TS), the registered industry (RI258: farming industry), the sum of fines paid to the government (AFPG), and the number of times that government regulation infringement occurred (TGRI).
5.4. Impacts of Each Variable on SME Defaulting
5.4.1. The impact of Company Age (Age)
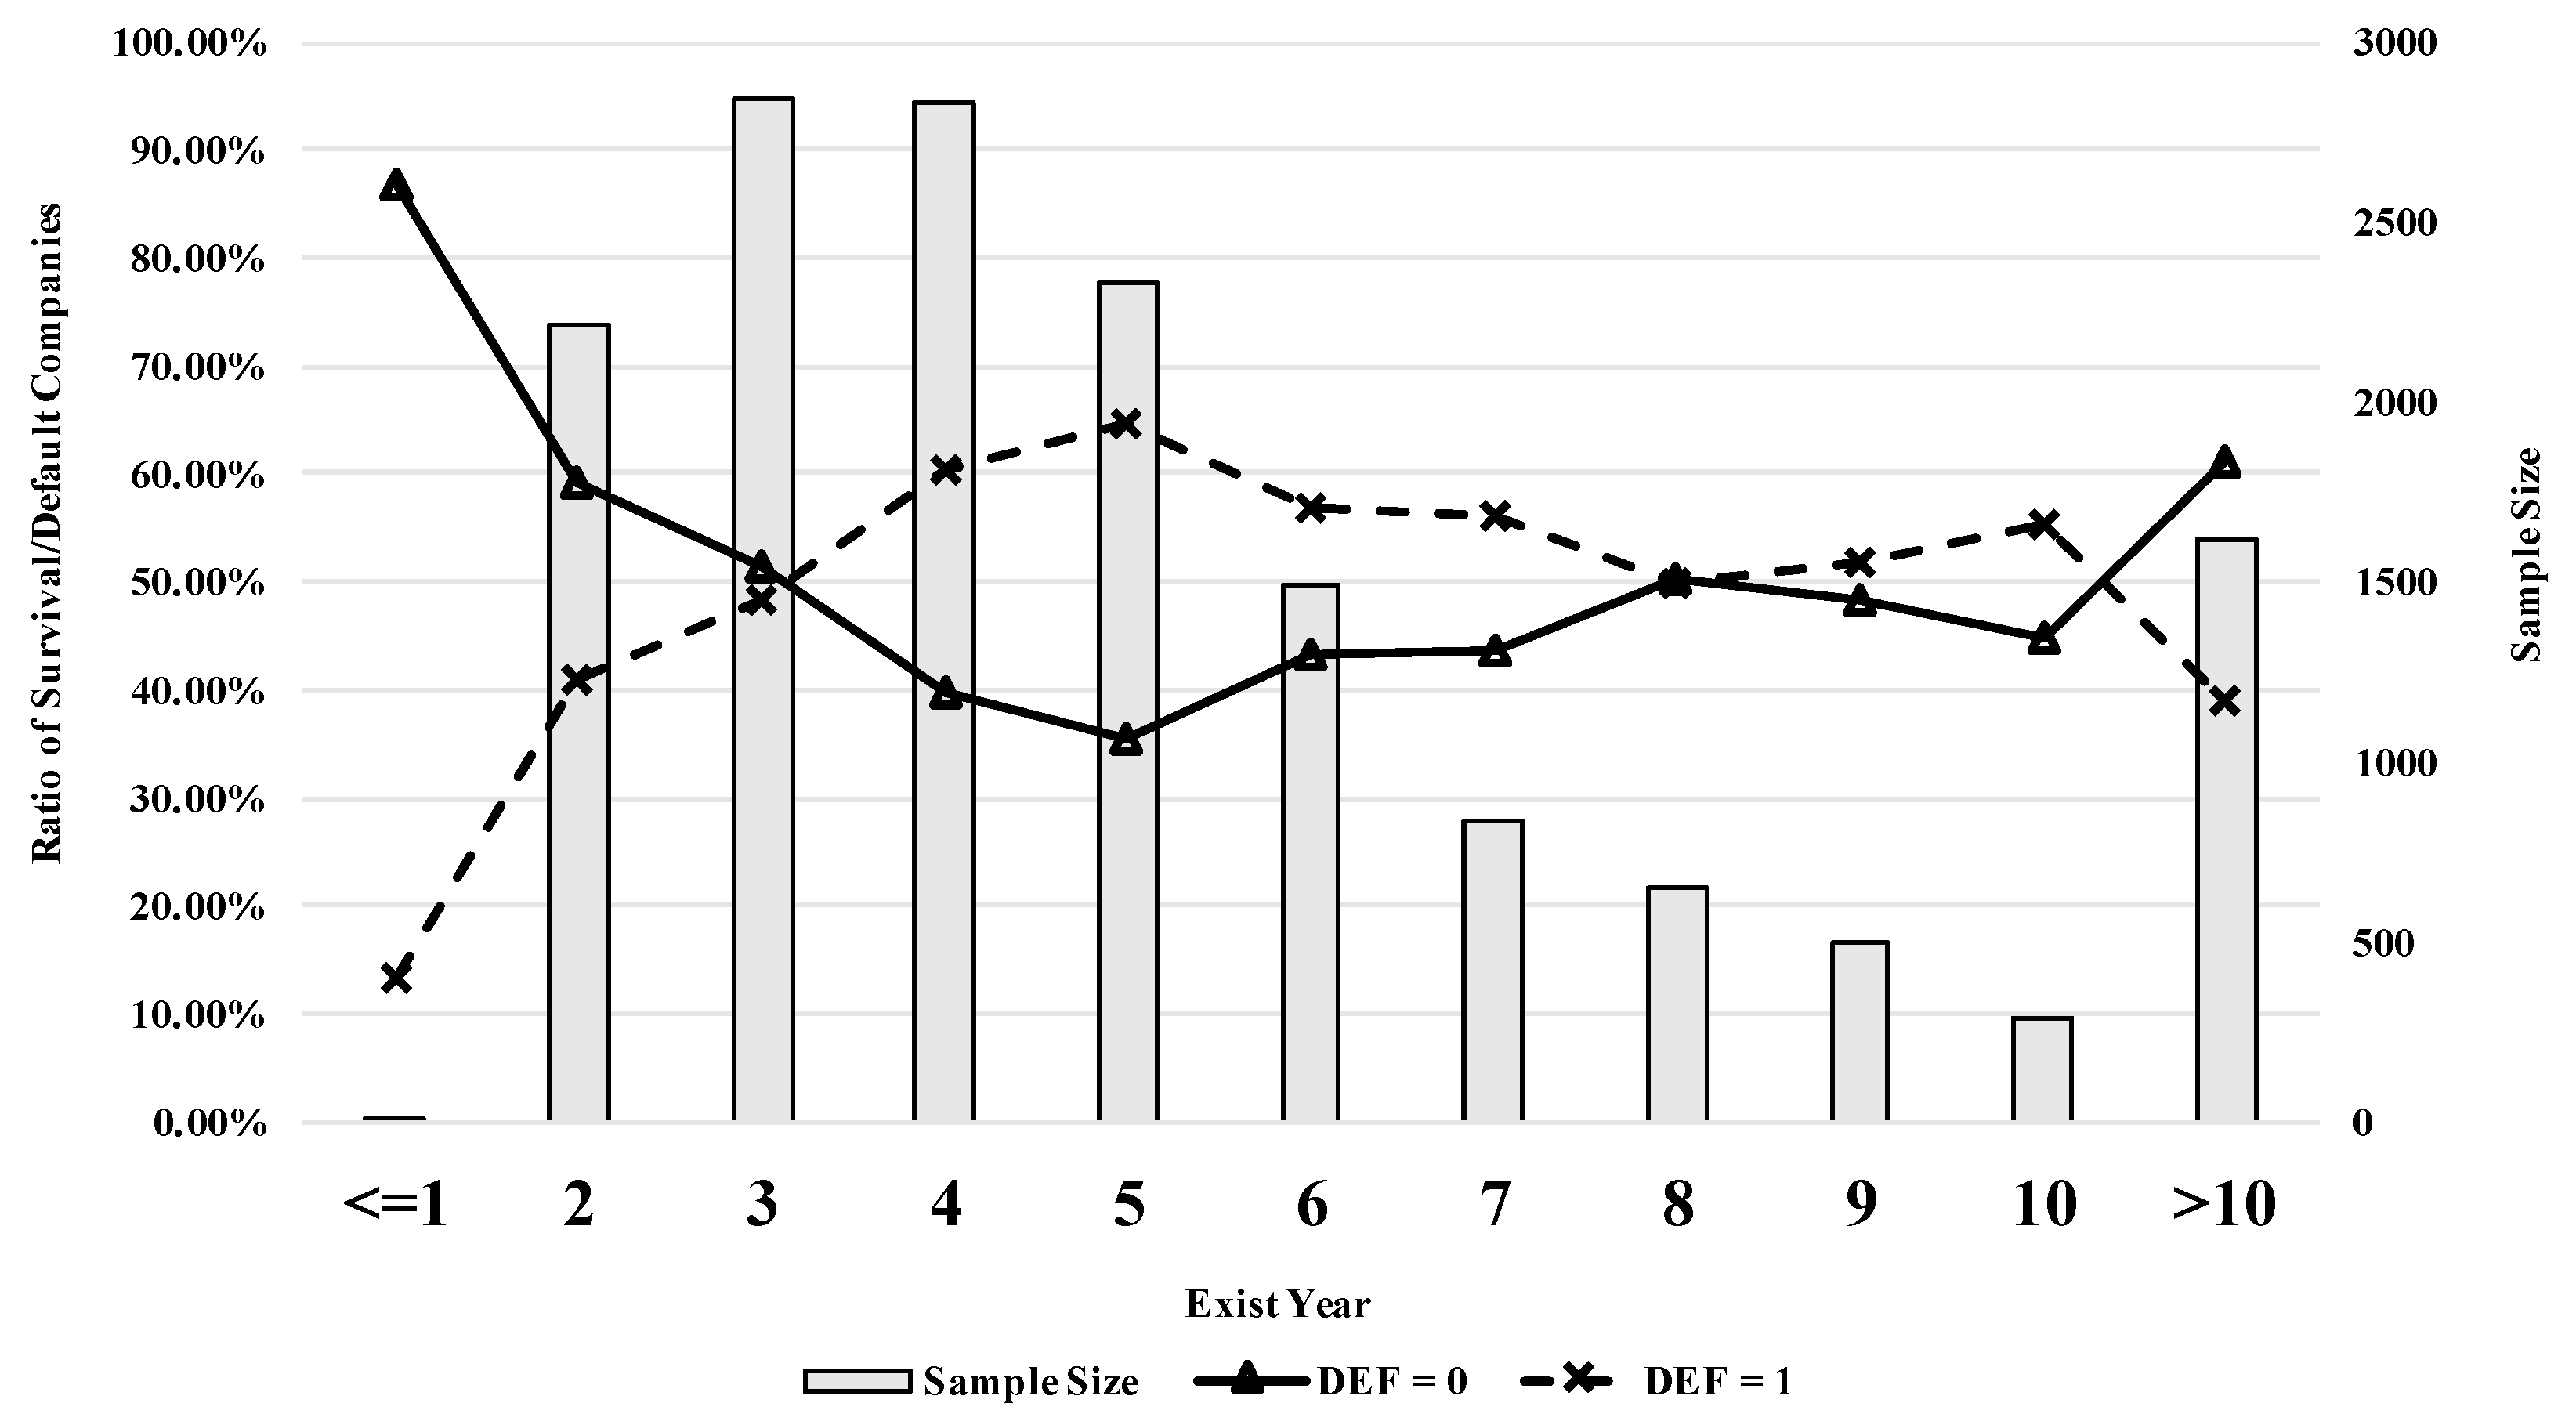
As shown in
Figure 4, relatively few companies default in their inauguration year. However, over the next 1 or 2 years, the default ratio climbs quickly, and by year 5 it peaks with 64.62% of companies having defaulted. This trend then reverses, and the lowest value of 38.82% is reached once SMEs have operated for more than 10 years.
5.4.2. The Impact of Registered Capital (RC) on SME Defaulting
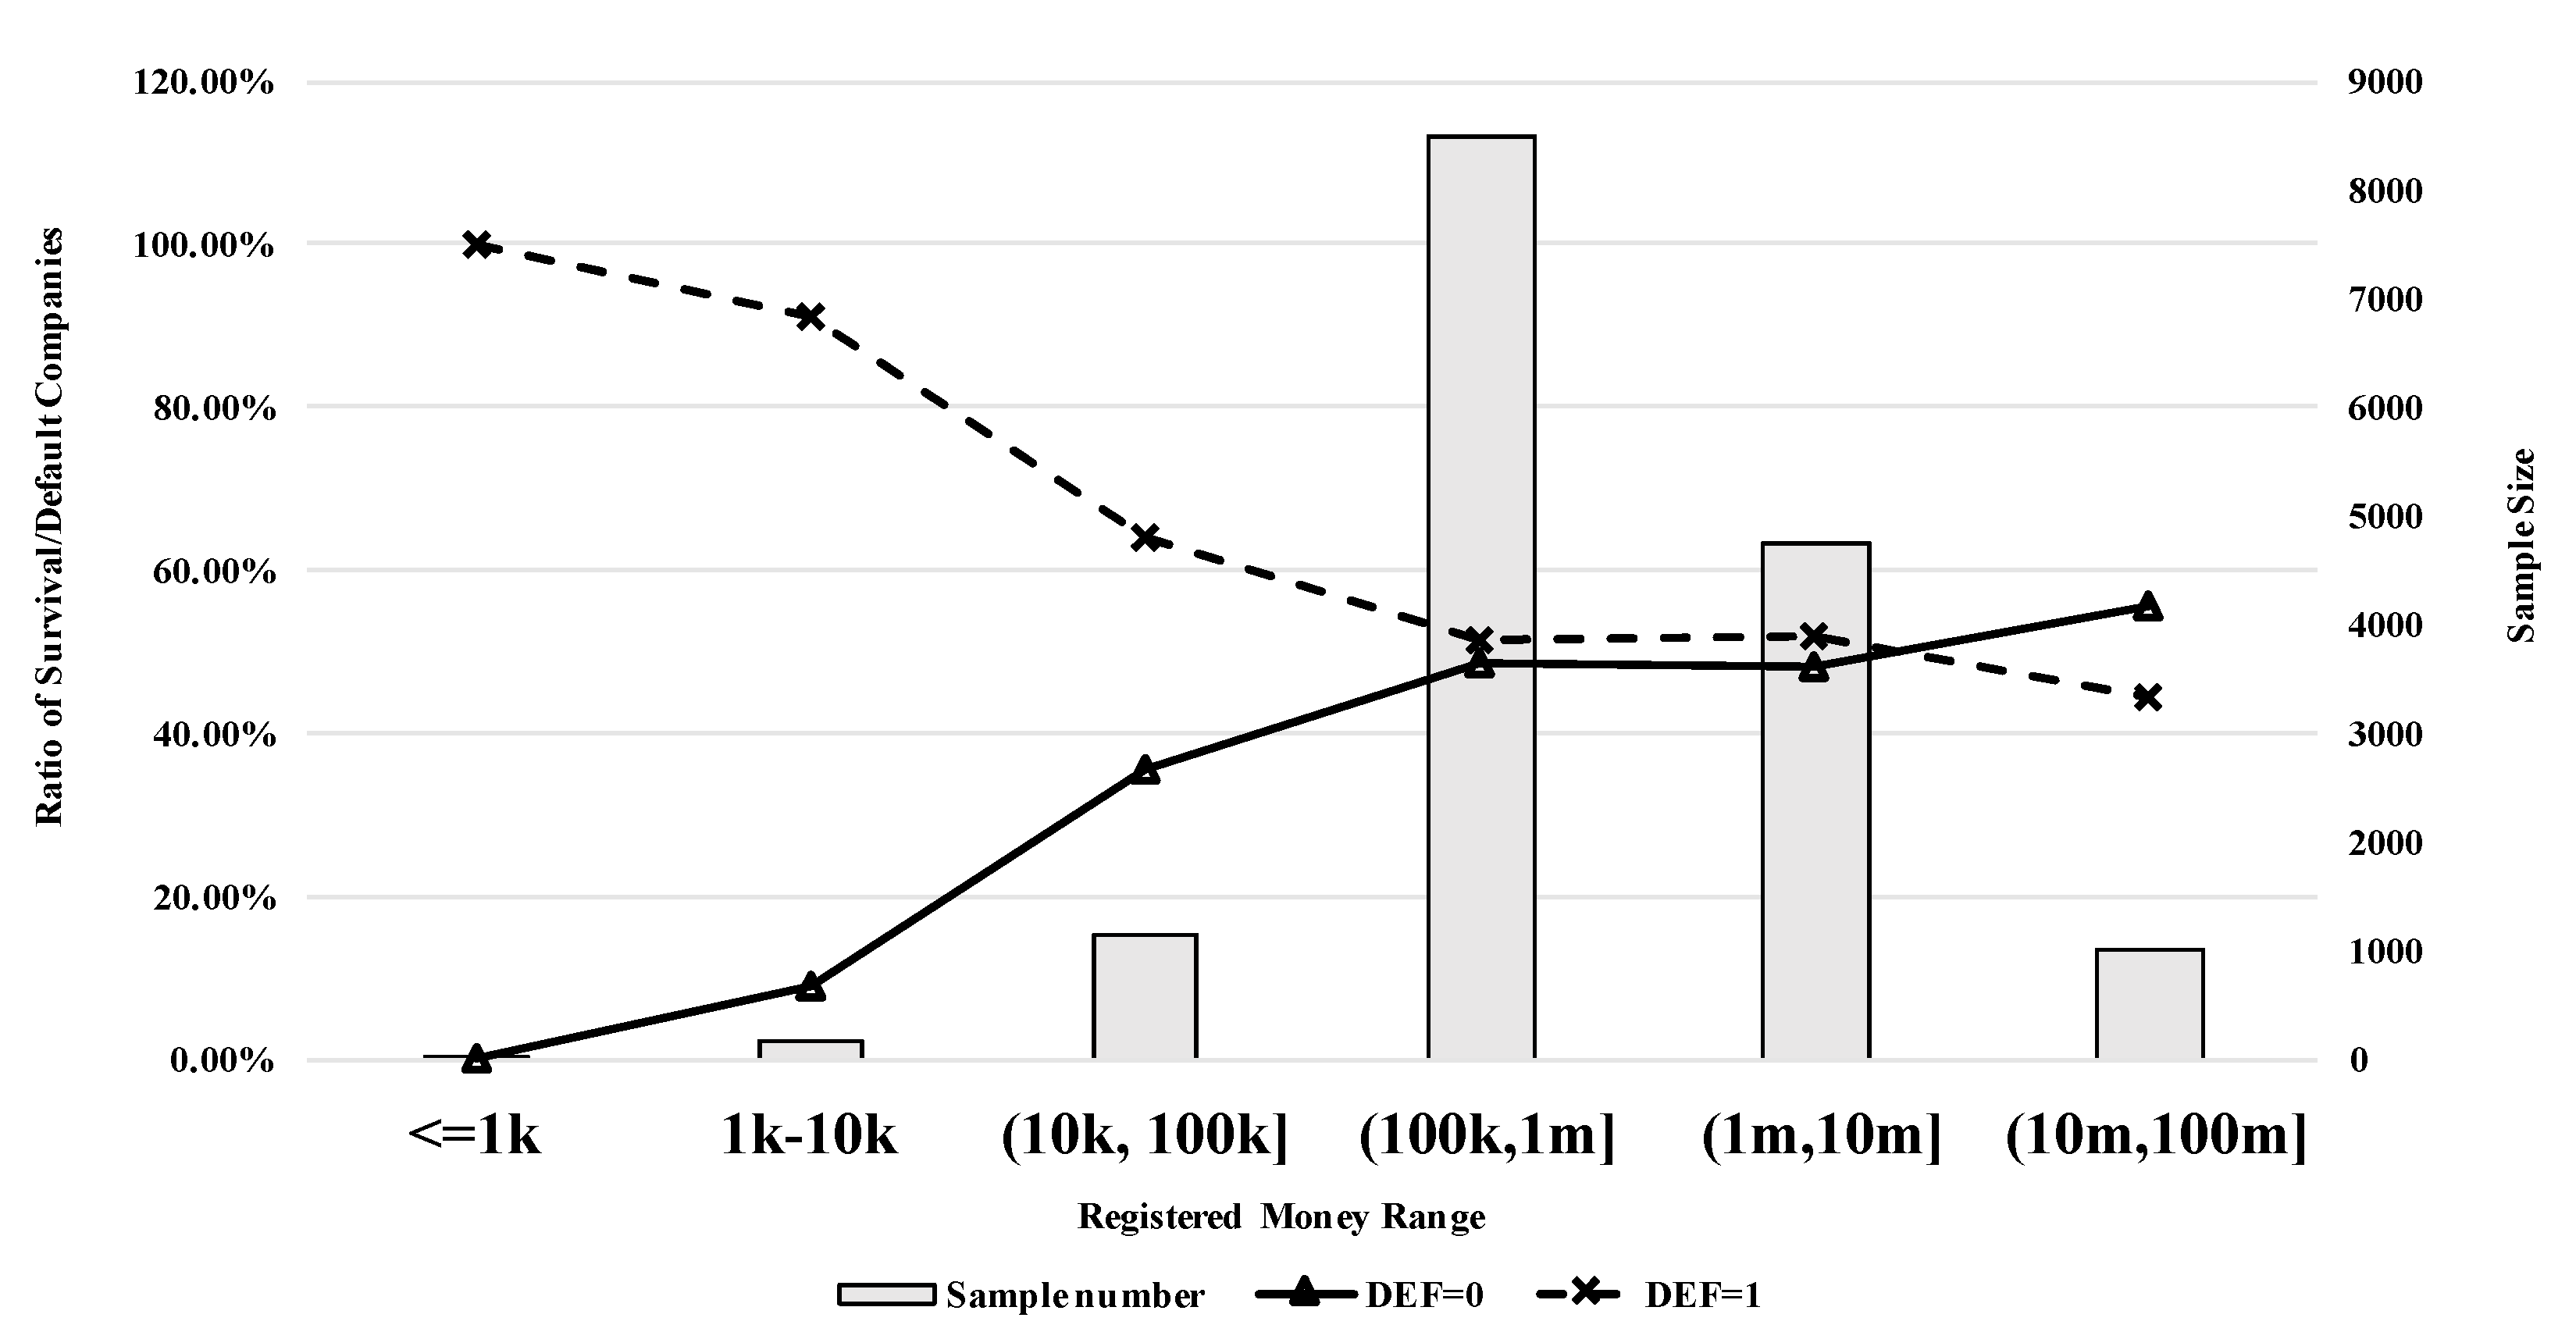
Figure 5 shows that SMEs with registered capital of less than 10,000 RMB are very risky. The default ratio continues to fall as registered capital increases.
5.4.3. Impact of the Number of Lawsuits on SME Defaulting
The study in [
47] identified lawsuits and structural change in a regulated industry as two main causes of bankruptcy. The author in study [
32] asserted that poor corporate governance results in deteriorating financial conditions and may lead to debt. The present study confirms a strong relationship between defaulting and the number of lawsuits faced. As shown in
Figure 6, the rate of defaulting increases steadily with the rising number of lawsuits.
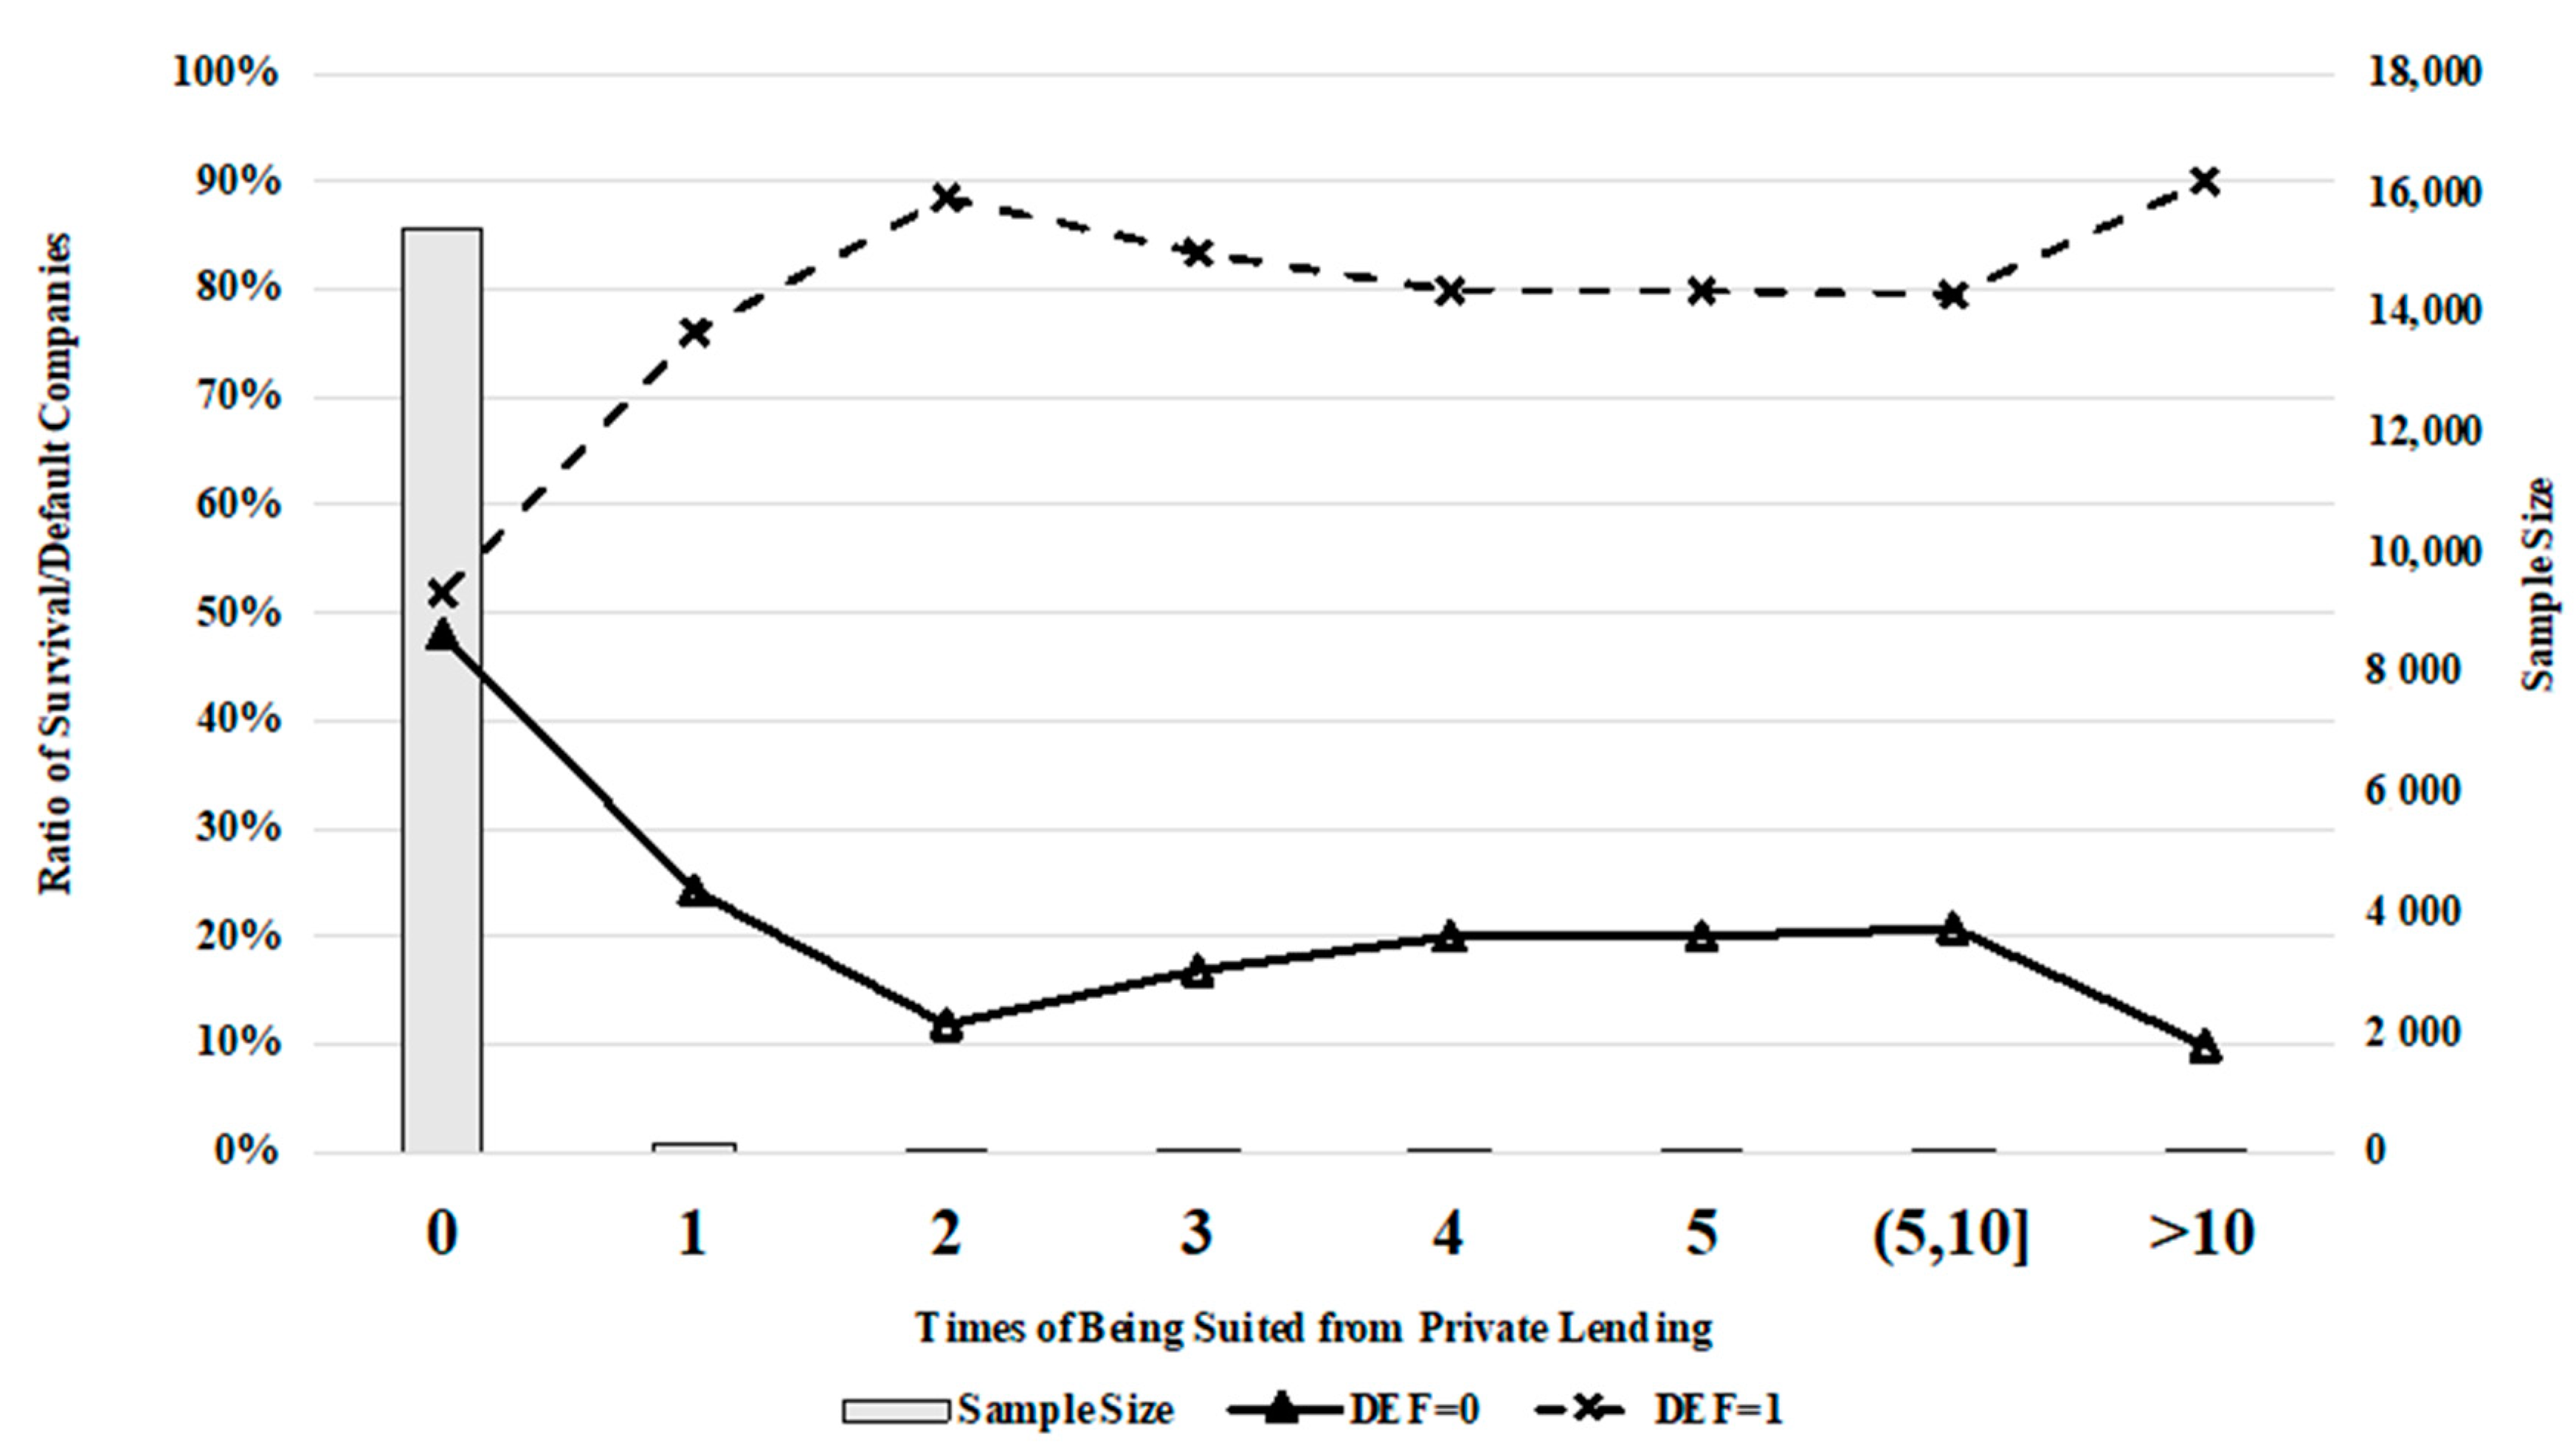
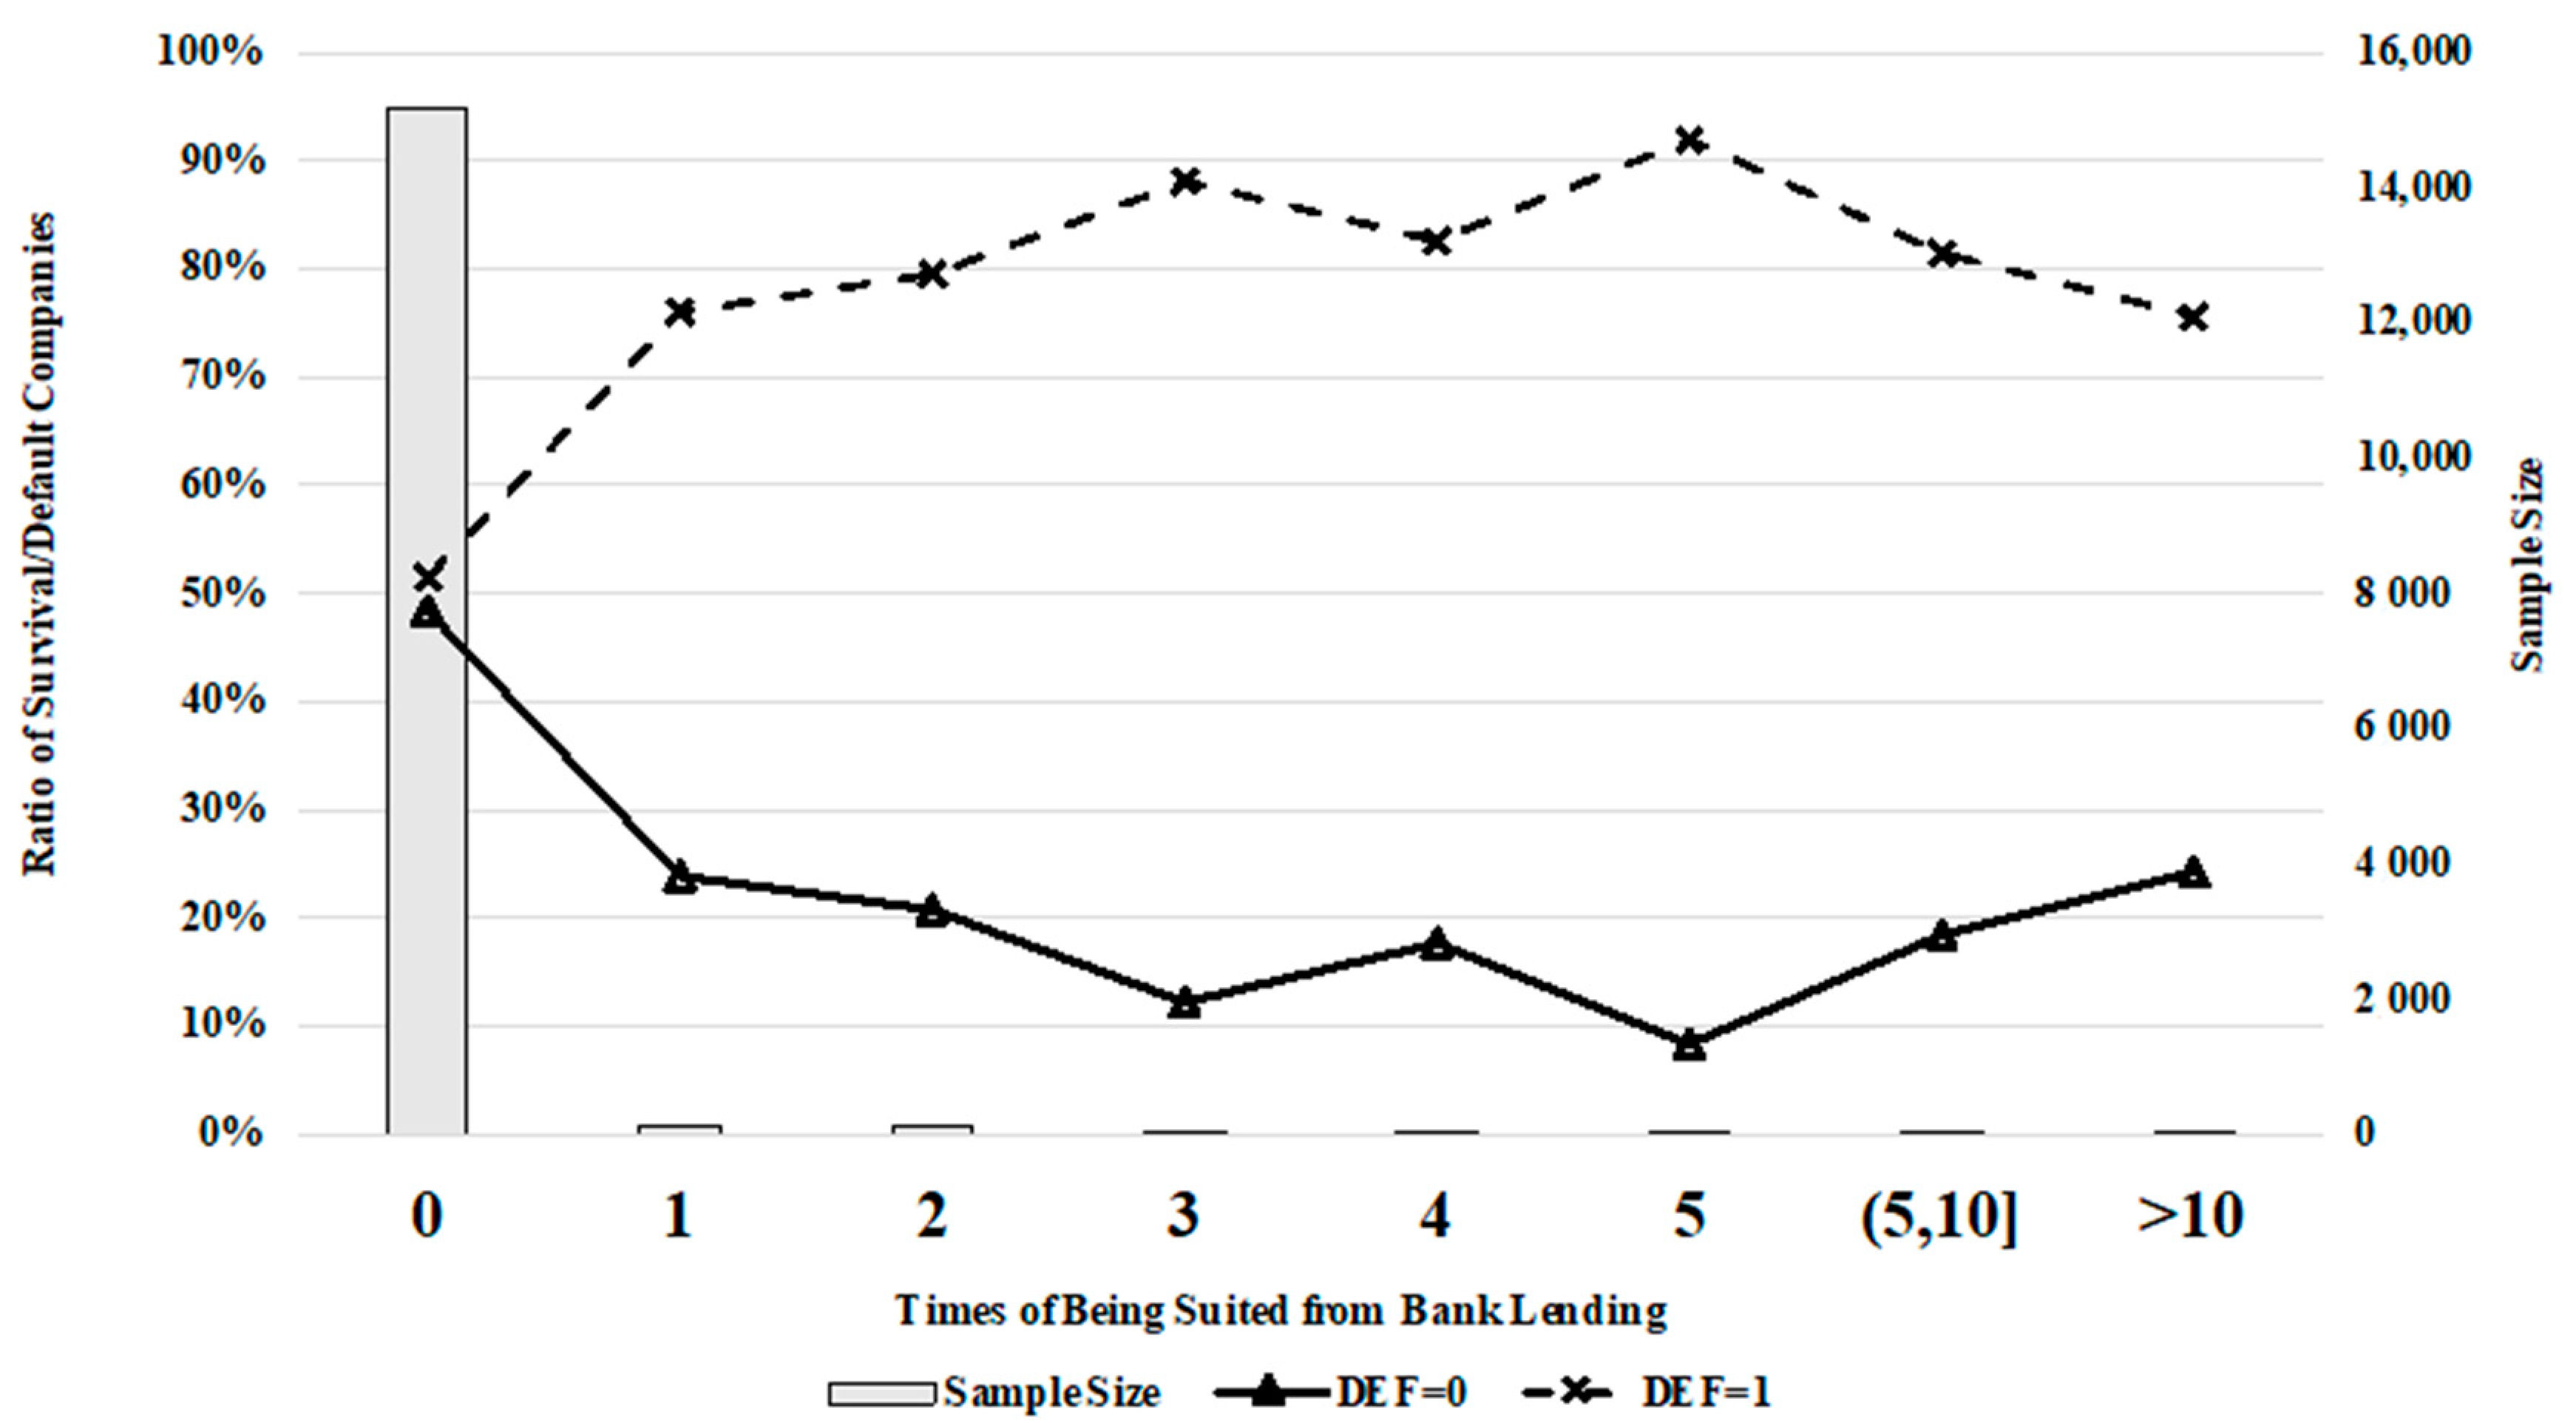
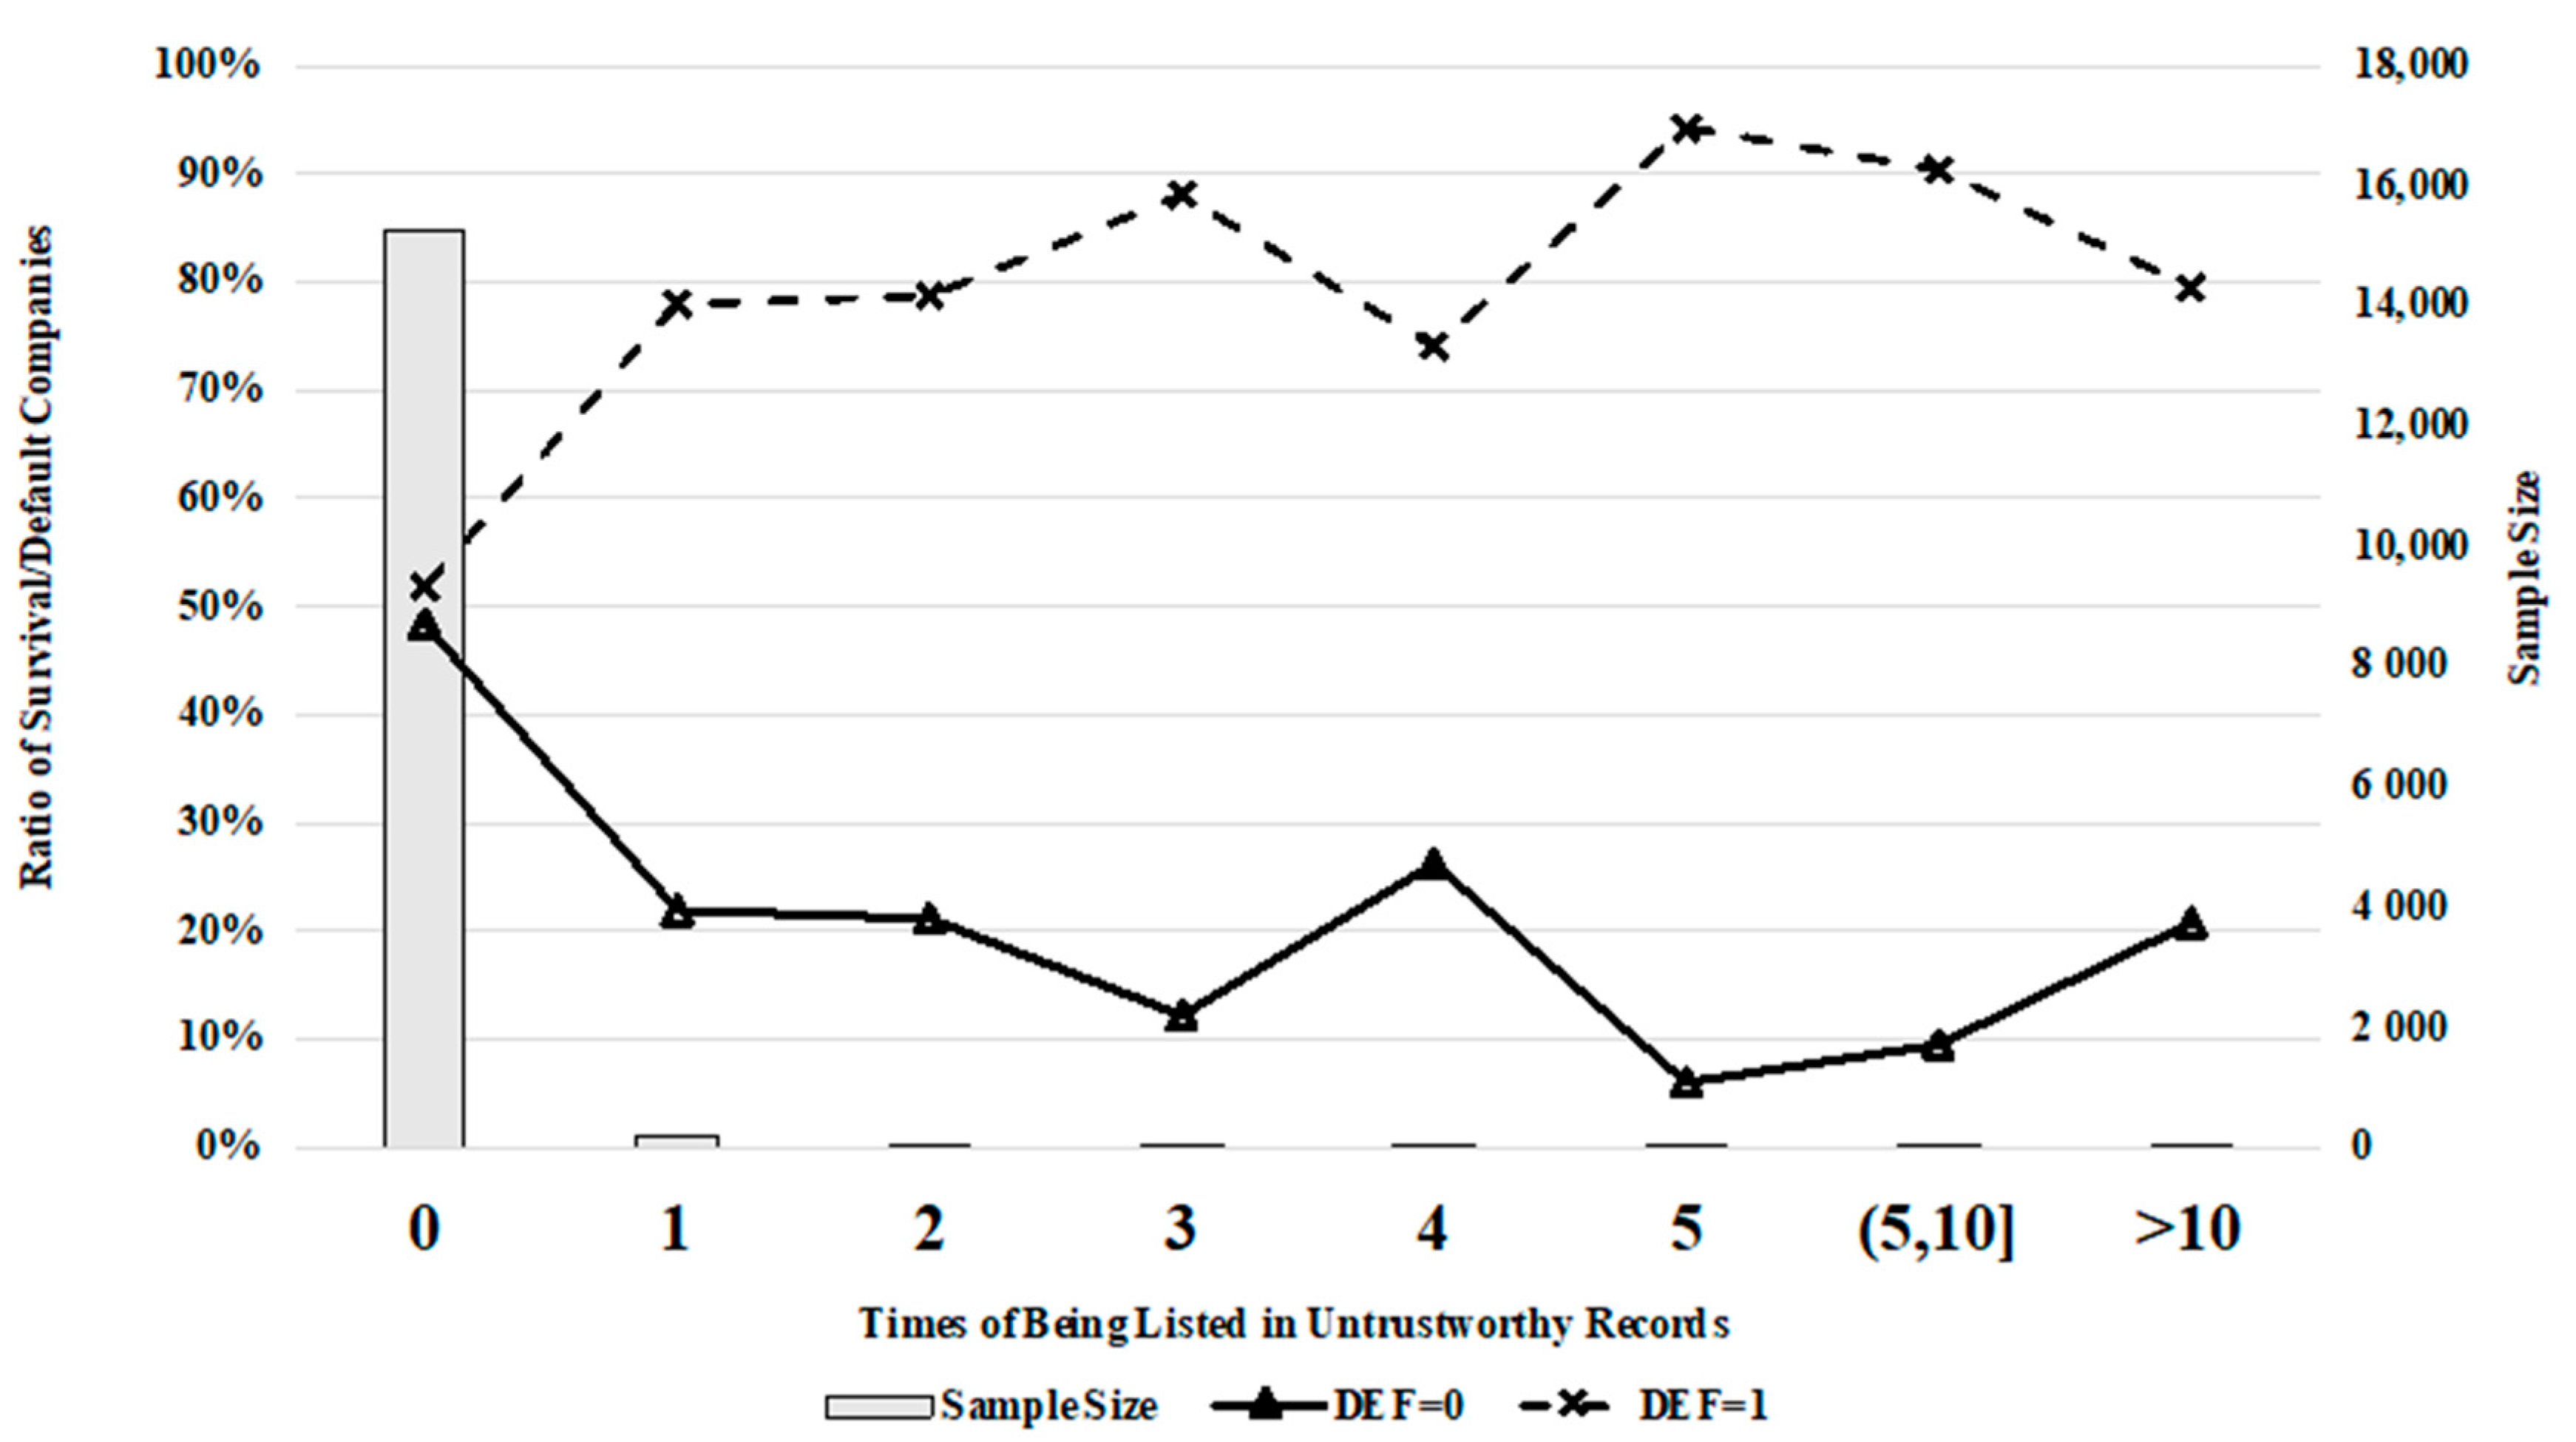
This is the case because default companies can encounter many kinds of lawsuits such as labor disputes, contract disputes, and lawsuits related to financial lending. We were also able to confirm that legal disputes with banks and private lenders have major impacts on SME survival.
Figure 7,
Figure 8 and
Figure 9 show changes in the rate of defaulting with the number of times the company was charged by private lenders, banks declaring lost credit, and number of listings in untrustworthy records.
5.4.4. The Impact of Negative External Credit Events on SMEs
We not only found a strong correlation between external credit variables and defaulting but also that the number of issues SMEs encounter is a predominant indicator of their conditions, which is consistent with the assumption that companies experiencing a large number of problems should suffer in several areas.
Figure 10 presents the distribution of DEF with the number of problems SMEs face. The figure indeed shows that the rate of defaulting increases as the number of different types of negative events encountered increases.
5.5. Discussion
Since the study in [
5], many researchers began to add non-financial data into SME default prediction models and found the prediction ability improved significantly as a result. Compared with previous studies, our study achieved similar results, possibly due to the contribution of non-financial data. The studies of [
31,
36] added company age (AGE), size, and industry sector into prediction models. In this study, we also found a strong relationship between company age, size, industry sectors, and default rate,
Figure 4 and
Figure 5 show the detailed information. The study in [
1] discovered that SMEs entangled in litigation are at a higher risk of defaulting than others, this study not only discover the relationship between litigation and default rate, but also find the difference between different litigation types, and finally discovered that the number of litigation resulting from private lending (TSPL) and number of litigation resulting from bank lending (TSLB) have the most prediction power. Furthermore, we added the number of lawsuits (TS) and amount being sued for (AS) into the prediction model, which resulted in significant value.
As well as the variables mentioned in previous literature, we also added some variables that have never been used by other researchers before. We refer to them as company credit information from the government (CIG), including tax compliance classification (TCC), number of tax regulation infringements (TTRI), sum of fines paid to the government (AFPG), and number of government regulation infringements (TGRI). These types of variables manifest the highest prediction ability in all three models adopted in this study, as shown in
Table 5. Furthermore, we examined the cross effect between these external credit variables, which have not been discussed by other researchers. In this study, we found that the default probability increases along with the increase in the number of types of negative events. For example, if a company does not pay tax on time and is sued and fined by the government, the default rate may increase to 0.70.
Figure 10 shows how the default probability increased along with the number of negative events.
To assist other researchers in replicating this research, we list some websites providing companies’ basic information such as opencorporates.com, Qcc.com, and Duedil.com, as well as law related information such as caselaw.findlaw.com and lexisnexis.com. These websites contain American and British companies’ external credit data. As for practitioners, financial organizations can use this model to test new applicants’ default probability or assess the risk of companies that already have received loans.
6. Conclusions
Since SME loan performance has strong implications for bank profitability and economic development, many researchers and practitioners have focused on predicting SMEs’ prospects. Most previous studies have used financial data to build prediction models. However, SMEs’ financial reports are difficult to access and unreliable. In recent years, some researchers have tried to include non-financial variables in SME default prediction models, such as small business owners’ personal credit histories. However, a large quantity of non-financial data remains inaccessible to researchers.
To address this problem, we propose using publicly available government data on basic information, external credit, and court verdicts. These data cover registered industries (RI), registered capital (RC), company age (Age), tax compliance classifications (TCC), the number of times tax regulation infringement has occurred (TTRI), the sum of fines paid to the government (AFPG), the number of times government regulation infringement occurred (TGRI), number of lawsuits (TS), the amount sued for (AS), number of lawsuits as a result of private lending (TSPL), number of lawsuits as a result of bank lending (TSLB), and the number of listings in untrustworthy records (TLUR).
Upon applying logistic regression, the CART method, and LightGBM to company data derived from public websites, we found that LightGBM can achieve an accuracy level of 0.87. The CART model performs only slightly less effectively than LightGBM at 0.86. Moreover, company age and tax compliance classification are the most important features, and the company credit information from the government (CIG) has the highest prediction power of all these three models.
We also discuss the impact of key features on the prediction of SME defaults. Our figures show that the rate of defaulting is strongly related to these variables. The probability of SME default increases significantly after 4 years of operation. SME default rates are almost linearly correlated with company registered capital where the more capital a company has, the less risky the company is. The tax credit ranking provided by the China Bureau of Tax is a powerful tool for predicting default rates. Four lawsuit-related variables are also strongly correlated with the default rate, confirming the findings of other studies [
32,
47]. When we separate private lending and bank lending from all lawsuits, we found that these two types of lawsuit can have significantly higher predictability. We also verified that SMEs encountering more different types of issues are more prone to defaulting.
The research results demonstrate a strong positive correlation between the default rate and the external negative credit information. The latter is a possible external indication of corporate governance capabilities; companies with healthy and sustainable development are likely to encounter less external negative credit reflection, while counterparts with poor management may be entangled in ongoing external negative events, which eventually result in default. Therefore, from this perspective, the external credit data in turn can be a sign of a company’s operating situation—whether it is healthy and sustainable or it is muddled and short-sighted. In China, banks inspect SMEs’ external credit information upon each loan application. Once the applicants’ credit materials show frequent negative information, the SMEs will be given a low credit score and encounter larger resistance to obtaining the funds from banks. On the contrary, companies with high credit scores experience much more finance availability and form a virtuous circle.
A limitation of the proposed framework is that many SMEs are not exposed to tax code violations and legal troubles. Two-thirds of the collected data fall under this category. As a result, predictions for SMEs with perfect records can only rely on basic information, yielding a 0.62 accuracy rate. Relative to the average accuracy rate of 0.87 derived in this work, this figure is significantly lower. Future research should explore the use of other variables to enhance the accuracy of predictions focused on such SMEs.
In current practice, banks are considerably more prone to declining loan applications due to losses from granting loans to the wrong borrowers. Future studies should thus use the proposed models to refine the calculation of benefits and losses.
Another avenue for future research would involve organizing external public credit data into time series. The sequences of such events may create opportunities to capitalize on the dynamic nature of corporate governance and on interactions with outside environments. Taking the life cycle of an SME into consideration may thus lead to the development of yet more precise prediction models.

