Article

Migration and Food Consumption: The Impact of Culture and Country of Origin on Obesity as an Indicator of Human Health

1
Sir Harry Solomon School of Economics and Management, Western Galilee College, Acre 2412101, Israel
2
Institute of Urban and Regional Studies, Hebrew University of Jerusalem, Mt. Scopus, Jerusalem 9190501, Israel
3
School of Real Estate, Netanya Academic College, 1 University Street, Netanya 4223587, Israel
*
Author to whom correspondence should be addressed.
Sustainability 2020, 12(18), 7567; https://doi.org/10.3390/su12187567
Submission received: 20 July 2020 / Revised: 31 August 2020 / Accepted: 8 September 2020 / Published: 14 September 2020
(This article belongs to the Collection Sustainable Household Behaviors: Consumption and Mobility)

Abstract

:
Previous research demonstrates that the 1965 American immigration wave has tended to attenuate the obesity pandemic in the United States. Based on a survey carried out by the Israeli Central Bureau of Statistics (ICBS) in 2012 and 2016, we observe the correlation between BMI, age, native language, and years-since-migration to Israel. BMI (= k g m 2 ) is a conventional measure of obesity, where BMI ≥ 25 is considered overweight and BMI ≥ 30 as type I obesity. The results indicate that compared to 11 groups of immigrants, the median BMI among native Israelis is lower. While the prevalence of overweight (BMI ≥ 25) among Hebrew speakers is below 50%, in 11 groups of immigrants, the prevalence of overweight is above 50%. A noteworthy exception is the immigrants from Ethiopia, who exhibit lower overweight prevalence compared to native Israelis and all other population groups. Finally, while male Hebrew and Russian speakers cross the overweight benchmark at the same age (35 years), native Israeli women (Hebrew speakers) cross this benchmark only when they reach 50 years (15 years after the males) and Russian women cross this benchmark only five years after the Russian men. These research findings may be of assistance in public health and culture-oriented medicine.

1. Introduction

Obesity and overweight are considered the fourth leading risk factor for global mortality, responsible for an estimated 3.2–5.0 million deaths annually (e.g., [1,2]). Recently, Nyberg et al. [3] estimated the loss of disease-free years associated with class II–III obesity (BMI ≥ 35, BMI = WEIGHT ÷ (HEIGHT2), where WEIGHT is measured in kilograms and HEIGHT in meters) to be between 7.1 and 10.0 years in subgroups of participants of different socioeconomic status, levels of physical activity, and smoking habits. Yet, the previous literature referring to obesity and immigration demonstrates that American and Canadian migration has tended to attenuate the obesity pandemic in the United States and Canada. However, this initial “health migrant effect”—referring to 1965 Hispanic and Asian immigrants in the United States—tended erode over time since arrival in US, Canada, and the UK (e.g., [4,5,6,7,8]).
According to Hao and Kim [5] and Murphy, Robertson, and Oyebode’s review [8], compared to the native population, obesity prevalence is expected to be lower among immigrants from the following reasons: Firstly, migration is stressful and expensive, it can include passing rigorous health checks, and, as recently as 50 years ago, long journeys could be physically demanding. Accordingly, migrants (individuals with the capacity to overcome these challenges) are usually healthier than both the population they leave behind and the one they join (the ‘healthy migrant effect’), with the exception of asylum seekers. Secondly, destination countries are often those that have reached the stage in the nutrition transition, in which there has been increasing fat, sugar, and processed food consumption, while countries of origin are often positioned earlier in this transition (for the five broad nutrition patterns, see for example, [9]). This means that even if migrants were randomly selected from source populations, rather than a healthier self-selecting group, they would be more likely to have a lower BMI on arrival than the native population (although, it should be noted that obesity is increasing worldwide and in some countries, such as Mexico, it is particularly high). Consistent with the hypothesis above, there is evidence that newly arrived migrants have a greater prevalence of healthy weight than native populations.
Following Arbel et al. ([10,11]), the objective of the current study is to investigate the BMI differences between native Jewish Israelis and Jewish immigrants based on native language, while controlling the age effect. Given that more than one-third of the Israeli population are immigrants and that 13 different native languages are included in the sample, Israel provides an interesting case study (According to ICBS: 2018 Statistical Abstract of Israel ([12], p. 19), the number of immigrants until 2017 was 3.2 million persons and the total population is 8.798 million persons. Consequently, the percent of immigrants is: 3.2 8.798 36.372 % > 1 3 ). The analysis is based on the 2012 and 2016 waves of the longitudinal survey conducted by the Israeli Central Bureau of Statistics (ICBS).
The results demonstrate that compared to 11 groups of immigrants, the median BMI among Hebrew speakers, who are native Israelis, is lower. While the prevalence of overweight (BMI ≥ 25) among native Israelis is below 50%, in 11 groups of immigrants, the prevalence of overweight is above 50%. Moreover, while native Israeli and Former Soviet Union (FSU) immigrant males cross the overweight benchmark at the same age (35 years), native Israeli women cross this benchmark only when they reach 50 years (15 years after the males), while women immigrants from FSU cross this benchmark only five years after their male counterparts. Moreover, in average BMI terms, and regardless of gender, insignificant differences were found between native Russian and immigrants from FSU, despite the different weather conditions, namely, the relatively hot ambient weather conditions in Israel and the abundance of sunlight (the main source of vitamin D absorption) compared to the very cold Russian surroundings. Given the approach of Foss [13], according to which obesity provides a survival advantage in the cold ambient temperatures and food scarcity of the winter climate, the latter outcome is surprising. Some of these differences, particularly for native Israeli women, may be attributed to the fifth nutritional pattern of Popkin [9]: Institutional and individual efforts to develop a lifestyle that prolongs health. Apart from male/female hormonal differences, a possible interpretation of these outcomes is the influence of western values and norms regarding a slim body image of women (e.g., [14,15,16]).
Other potential reasons for obesity differences are related to genetics [17], nutrition, lack of physical activity [18] and relationship to the urban environment, and lack of vitamin D absorption [13]. Based on twin studies, Stunkard, Foch, and Hrubec [19] found that the heritability of weight was 0.78–0.81. Heritability is defined as “the proportion of phenotypic variation in a population that is attributable to genetic factors and is only an estimate at best” ([17], p. 14). By comparing siblings who migrated to urban regions and those who remained in rural areas, Kinra et al. [18] found that increased energy intake and reduced energy expenditures contributed equally to greater adiposity among urban migrants in India. Sallis et al. [1] suggest that the design of urban environments has the potential to contribute substantially to physical activity. Similar findings across cities suggests the potential of urban planning, transportation, and open space planning sectors in reducing the health burden of the global physical inactivity pandemic. (For a similar line of research, see, for example, [20,21]).
A noteworthy group of immigrants, from Ethiopia, exhibit lower obesity and overweight prevalence compared to native Israelis and all other groups in the population. This outcome is obtained despite the fact that this immigration wave occurred 20 years before the first survey of 2012 took place. Unlike other migration waves, no erosion of initial “health migrant effect” is observed in this group of immigrants. Indeed, according to the WHO report [22], Ethiopia has the second lowest BMI in the world (an average BMI of 20.6 kg m 2 )
The remainder of this manuscript is organized as follows. Section 2.1 provides the descriptive statistics. Section 2.2 portrays the methodology and Section 3.1 presents the results of the baseline 15-year-old cohort. Section 3.2 provides the estimates obtained for selected groups of immigrants and the age variable. Finally, Section 4 concludes and summarizes.

2. Materials and Methods

2.1. A Description of the Sample

Table 1 reports the descriptive statistics of the pooled sample for 2012 and 2016. The average weight in kilograms is 72.2728–72.2732 (INDWEIGH). The average height in meters is 1.6889–1.6906 (HEIGHT). The average BMI is 25.2549–25.1995 (BMI). In total, 45.63–47.6 percent of the sample are above the benchmark of overweight (BMI ≥ 25).
Figure 1 reports the percent of population whose BMI ≥ 25 among Organization for Economic Cooperation and Development (OECD) countries. According to the graph, the frequency of overweight extends from a minimum of 25 percent in Indonesia to a maximum of 74.2 percent in Chile. However, based on measured rather than self-reported BMI, Japan and South Korea seem to exhibit the lowest frequency of overweight and obesity (25.65 percent and 34.1 percent, respectively), and Mexico, USA, and Chile exhibit the highest frequencies (71 percent, 72.5 percent, and 74.2 percent, respectively). In terms of overweight, Israel is located below the median, with 50% frequency. Unlike other countries, the gap between self-reported and measured BMI is small.
Table 2 gives the 2014 international BMI rankings of selected countries, including Russia, Ethiopia, and Israel, based on the average BMI of each country (source: [22]). The table is divided according to the pooled sample, by gender. The BMI ranking is based on the average BMI of each country, ranging between 1 = the worst and 190 = the best.
According to the report, concerning women, Israel is ranked more favorably than Russia—90th place for Israeli women (mean BMI of 26.2 k g m 2 ) versus 69th place for Russian women (mean BMI of 26.8 k g m 2 ). Moreover, as the mean BMI of the native Israeli women in our representitive sample is lower (below 25 k g m 2 ), this gap in favor of Israeli women rises further. In contrast, the Russian–Israeli BMI ranking gap is smaller for males (ranked 82nd with BMI of 26.3 k g m 2 compared to ranked 85th with BMI of 26.1 k g m 2 ). Finally, Ethiopia has the second lowest BMI ranking in the world (an average BMI of 20.6 k g m 2 )
Table 3 compares the BMI of: (1) native Jewish Israelis (from our dataset) to that of native Russians) from Table 2); and (2) Jewish immigrants from Russia (from our datasets) to native Russians) from Table 2). The outcomes support the conclusion that regardless of gender, the BMI of native Jewish Israelis is lower than that of native Russians. However, the null hypothesis of BMI equality cannot be rejected for Jewish Russian immigrants vs. native Russians.
Two additional variables in Table 1 include age and gender. The sample’s mean for age is 45–46 years and the standard deviation is 18–19. The minimum age is 15 and the maximum is 80 years (AGE). A total of 49.74–50.65% of the sample are females (FEMALE).
Figure 2 reports the distribution of BMI stratified by native language in 2012. The boxplots refer to the BMI of 6836 Jewish persons above 15 years. For each boxplot, Q1 = first quartile (Q3 = third quartile) is the lower (upper) side of the rectangular, and the median (Q2) splits the rectangle. The lower (upper) horizontal line is calculated as Q 1 1.5 I Q R ( Q 3 + 1.5 I Q R ), where I Q R = Q 3 Q 1 . The relative frequency of each native language is given in parentheses.
As can be seen, the two large groups in the sample, which is representative of the Israeli population, are native Israelis and immigrants from FSU. Of the sample, 60.94% are native Jewish Israelis and 14.69% are immigrants from FSU countries.
Referring to the boxplots, which are stratified by native language, while the median among native Hebrew, English, and Amharic speakers (the native language in Ethiopia) is below overweight (BMI < 25), the median among the rest of the sample is above overweight, where the prominent populations that suffer from overweight are Arabic, Russian, Yiddish, and Romanian speakers.
One concern referring to this simple non-adjusted comparison is the potential cohort effect on BMI in the case of age differences among different ethnic groups. Given the two distinctive immigration waves to Israel during the twentieth century: (1) the 1950s—particularly from Asian/African countries; and (2) the 1990s—from FSU countries and Ethiopia (e.g., [1]), such age differences are anticipated. Consequently, in the subsequent section, the analysis controls these age differences via regression analysis.

2.2. Methodology

Consider the following model applied to the pooled sample:
Y j = α j + α 1 , j A R A B I C + α 2 , j R U S S I A N + α 3 , j E N G L I S H + α 4 , j Y I D D I S + α 5 , j F R E N C H + α 6 , j A M H A R I C + α 7 , j H U N G A R I A N + α 8 , j M O R R O C A N + α 9 , j S P A N I S H + α 10 , j P E R S I A N + α 11 , j R O M A N I A N + α 12 , j O T H E R S + α 13 , j A G E + α 14 , j A R A B I C × A G E + α 15 , j R U S S I A N × A G E + α 16 , j E N G L I S H × A G E + α 17 , j Y I D D I S H × A G E + α 18 , j F R E N C H × A G E + α 19 , j A M H A R I C × A G E + α 20 , j H U N G A R I A N × A G E + α 21 , j M O R R O C A N × A G E + α 22 , j S P A N I S H × A G E + α 23 , j P E R S I A N × A G E + α 24 , j R O M A N I A N × A G E + α 25 , j O T H E R S × A G E + μ 1 , j
where for j = 1 , 2 , the dependent variable is Y 1 = B M I and Y 2 = l n B M I . The independent variables: A R A B I C ; R U S S I A N ; E N G L I S H ; Y I D D I S H ; F R E N C H ; A M H A R I C ; H U N G A R I A N ; M O R R O C A N ; S P A N I S H ; P E R S I A N ; R O M A N I A N ; O T H E R S equal one if their mother tongue is Arabic, Russian, English, Yiddish, French, Amharic, Hungarian, Moroccan, Spanish, Persian, Romanian, and others, and zero otherwise. The constant term α j is the baseline parameter, which captures the of-sample projected BMI of a newborn, whose native language is Hebrew. The twelve parameters α 1 , j , α 2 , j , α 3 , j , , α 12 , j   capture the of-sample projected BMI difference between newborns whose native language is Hebrew (the base category) and those whose respective native language is Arabic, Russian, English, Yiddish, French, Amharic, Hungarian, Moroccan, Spanish, Persian, Romanian, and Others. The parameter α 13 , j reflects the projected BMI difference between two individuals whose age difference is one year. Finally, μ 1 , j is the stochastic random disturbance term.
Following Ramanathan [25], we reshape the model so that the constant term would reflect the on-sample minimal age of 15 years old:
Y j = α 0 , j + α 1 , j A R A B I C + α 2 , j R U S S I A N + α 3 , j E N G L I S H + α 4 , j Y I D D I S H + α 5 , j F R E N C H + α 6 , j A M H A R I C + α 7 , j H U N G A R I A N + α 8 , j M O R R O C A N + α 9 , j S P A N I S H + α 10 , j P E R S I A N + α 11 , j R O M A N I A N + α 12 , j O T H E R S + α 13 , j A G E 15 + α 14 , j A R A B I C × A G E 15 + α 15 , j R U S S I A N × A G E 15 + α 16 , j E N G L I S H × A G E 15 + α 17 , j Y I D D I S H × A G E 15 + α 18 , j F R E N C H × A G E 15 + α 19 , j A M H A R I C × A G E 15 + α 20 , j H U N G A R I A N × A G E 15 + α 21 , j M O R R O C A N × A G E 15 + α 22 , j S P A N I S H × A G E 15 + α 23 , j P E R S I A N × A G E 15 + α 24 , j R O M A N I A N × A G E 15 + α 25 , j O T H E R S × A G E 15 + μ 1 , j
By substitution of AGE = 15 (the minimal age in the sample), it may be readily verified that the constant term α 0 , 1 captures the on-sample projected BMI of a 15-year-old individual (the minimum age in the sample), whose native language is Hebrew. Likewise, for i = 1 , 2 , 3 , , 12 , α 0 , 1 + α i , 1 captures the projected BMI of a 15-year-old individual whose native language is Arabic, Russian, English, Yiddish, French, Amharic, Hungarian, Moroccan, Spanish, Persian, Romanian, or Others.

3. Results

3.1. Baseline 15-Year-Old Adolescents

Table 4 reports the regression outcomes based on the model given by Equation (3). Columns (1) and (2) report the estimation results based on the simple OLS procedure, and columns (3) and (4)—based on median regression. The latter procedure has the advantage that the median is unaffected by outliers (e.g., [26], p. 445). While columns (1) and (3) report the estimation results where the dependent variable Y 1 = B M I , columns (2) and (4) report the estimation results where the dependent variable Y 2 = ln B M I . The latter dependent variable provides a percent approximation between projected BMI of Hebrew speakers and that of the twelve languages other than Hebrew. The precise percent difference is given by the formula exp α ^ i , 2 1 , where the circumflex denotes the estimated parameter (e.g., [26], pp. 42–44) (Johnston and Dinardo [26] discuss the following constant growth rate model of a compounded interest: Y t = Y 0 1 + g t where g is the growth rate and t is the time variable. Taking the natural logarithm and estimation of this model gives: p r o j l n Y t = α ^ + β ^ t , where the circumflex denotes estimated coefficients, α ^ = l n Y 0 and β ^ = l n 1 + g ^ . The β ^ is known as “continuous growth rate”, which provides good approximation to g ^ (the discrete growth rate) in the case that g ^ is small. Taking an exponent for both sides yields: e x p β = e x p l n 1 + g = 1 + g . Subtracting one from both sides yields: g ^ = e x p β ^ 1 ).
As can be seen from the table, among the baseline 15-year-old Hebrew speakers, and based on both the average and the median, there are no overweight problems. The 95% confidence interval of projected BMI among this cohort is 22.11–22.58 and 21.52–22.05. Consequently, the null hypothesis of overweight 25 p r o j B M I < 30 is rejected.
Comparing the projected BMI differences between the 15-year-old baseline Hebrew speakers demonstrates that the projected BMI of 15-year-old Arabic language speakers is higher by approximately 22.4% ( p = 4.87 × 10 6 )–26.2% ( p = 5.07 × 10 6 ); Russian speakers—by 3.32% ( p = 0.0063 )–4.08% ( p = 0.00413 ); Yiddish speakers—by 21.1% ( p = 5.88 × 10 6 )–23.7% ( p = 1.37 × 10 5 ); French speakers—by 7.98% ( p = 0.0102 )–10.5% ( p = 0.00385 ); Hungarian speakers—by 25.5% ( p = 0.0124 )–36.4% ( p = 0.00226 ); Persian speakers—by 20.4% ( p = 0.0009 )–21.6% ( p = 0.00264 ); Romanian speakers—by 15.0 ( p = 0.0128 )–11.9% ( p = 0.0895 ); and speakers of other languages—by 9.91% ( p = 6.20 × 10 5 )–9.79% ( p = 0.000716 ) (The discrete growth rates of selected cases are: Arabic: 25.107 % = exp 0.224 1 ; 29.95 % = exp 0.262 1 ; Russian: 3.376 % = exp 0.0332 1 ; 4.164 % = exp 0.0408 1 ; Yiddish: 23.49 % = exp 0.211 1 ; 26.744 % = exp 0.237 1 . Note that the continous and discrete growth rates are similar).
While compared to Hebrew speakers, almost all the immigrants in the 15-year-old cohort exhibit higher or equal projected BMI, with the exception of Ethiopian immigrants. Compared to the 15-year-old baseline Hebrew speakers, the projected BMI of Amharic speakers is 7.71% ( p = 0.0458 )–7.72% ( p = 0.0874 ) lower, even when the age variable is controlled.
At the bottom of Table 4, the projected BMI and 95% confidence intervals for the 15-year-old cohort stratified by native language are reported based on the regression outcomes. The two most left columns give the native language and the minimal age for each group. For the semi-logarithmic model (columns (2) and (4)), p r o j B M I = exp ln p r o j B M I + 1 2 σ ^ 2 . Based on this table, we note that while 15-year-old Hebrew, Russian, English, and Amharic speakers do not suffer from either overweight or obesity (rejection of the null hypothesis BMI = 25 or BMI = 30 where the upper bound of the 95% CI is below the overweight benchmark, namely proj(BMI) < 25, French, Spanish, and Romanian speakers suffer from overweight (the null hypothesis BMI = 25 cannot be rejected at the 5% significance level) and Arabic, Yiddish, Hungarian, Moroccan, and Persian speakers suffer from obesity (the null hypothesis BMI = 30 cannot be rejected at the 5% significance level). Note also, that the minimal age among Arabic speakers is 23 years (8 years above the minimal 15-year-old age); Hungarian speakers—27 years (12 years above the minimal 15-year-old age); Moroccan speakers—42 years (27 years above the minimal 15-year-old age); Spanish speakers—22 years (7 years above the minimal 15-year-old age); and Persian speakers—25 years (10 years above the minimal 15-year-old age).
A possible interpretation of these outcomes is that native Israeli adolescents are more influenced by Western values and norms regarding a slim body image of women. Other examples of this interpretation are given in [15,16].
Other potential reasons to obesity are related to genetics [17], nutrition, lack of physical activity [18] and relationship to urban environment, and lack of vitamin D absorption [13] (Foss [13] suggests that: “Larger body size confers a survival advantage in the cold ambient temperatures and food scarcity of the winter climate by reducing surface area to volume ratio and by providing an energy store in the form of fat mass. In addition, it is suggested that the phenotypic metabolic and physiological changes observed as the metabolic syndrome, including hypertension and insulin resistance, could result from a winter metabolism which increases thermogenic capacity. Common obesity and the metabolic syndrome may therefore result from an anomalous adaptive winter response. The stimulus for the winter response is proposed to be a fall in vitamin D.” (page 314—the abstract). “{...}Common obesity is closely associated with the urban-industrial environment (82). In this environment, the two determinants of vitamin D, i.e., exposure of the skin to UV-B radiation and dietary vitamin D, are reduced. With regard to the first determinant, UV-B irradiance in urban areas is reduced by several factors. Cities often develop in low altitude, sheltered regions and some urban construction is underground. Incident solar UV-B radiation is absorbed and scattered by buildings and concrete ground cover in the built environment. Emissions from industry and transport alter the atmospheric composition and pollutants such as sulphur dioxide, nitrogen dioxide and ozone (SO2, NO2 and O3) absorb in the UV-B spectrum, while black carbon and PM10 can also reduce UV-B irradiance (83,84). The interiors of buildings are designed to reproduce infra-red radiation (heat) and visible radiation (light), but not ultraviolet radiation. In particular, large public buildings such as hospitals, office buildings and factories allow little, if any, penetration of UV radiation. Urbanisation is essentially a trend towards a sheltered, UV-deprived habitat. At a personal level, clothing acts as an effective sunscreen (85) and standard styles of outdoor clothing cover an extensive proportion of the body surface. The most significant cause of vitamin D deficiency in urban developments may be the reduction in time that individuals spend exposed to sunlight, as work and leisure activities are mostly conducted indoors. With regard to the second determinant of Vitamin D status, dietary trends associated with the urban-industrial environment have reduced the quantity of vitamin D obtained from the diet. These include a reduction in the consumption of fish and sea mammals, animal fat, eggs, and dairy fat. In addition, food production methods such as indoor housing of layer hens and increased milk yield per cow may have contributed to lower vitamin D intake. Milk and dairy fat intake have been inversely associated with obesity and with the metabolic syndrome (86,87). The decrease in total milk consumption (88), replacement of whole milk with reduced-fat milks and phasing out of school milk after the 1970s may have contributed to a critical fall in dietary vitamin D intake in the past three decades.” (pp. 319)). In fact, based on twin studies, Stunkard, Foch, and Hrubec [25] found that the heritability of weight was 0.78–0.81. Heritability is defined as “the proportion of phenotypic variation in a population that is attributable to genetic factors and is only an estimate at best” ([17], p. 14). By comparing siblings who migrated to urban regions and those who remained in rural areas, Kinra et al. [18] found that increased energy intake and reduced energy expenditures contributed equally to greater adiposity among urban migrants in India. Sallis et al. [1] suggest that the design of urban environments has the potential to contribute substantially to physical activity. Similar findings across cities suggest the potential of urban planning, transportation, and open space planning in efforts to reduce the health burden of the global physical inactivity pandemic. (For a similar line of research, see, for example, [20,21]) (In a recent conference held in Leeds, Moore and Boesch [24] stated that: “While fundamentally obesity is a disorder of energy balance, several decades of research has demonstrated that maintaining energy balance is much more complex than the ‘energy in equals energy out’ equation that was once touted. The purpose of the 2018 Nutrition Society Summer Conference, ‘Getting energy balance right’ was to provide insight into the numerous factors influencing energy balance, considering varying needs across the lifespan, while highlighting advances and gaps in knowledge. Papers presented in this issue illustrate the wide range of factors involved in maintaining energy balance, including: Epigenetics, the gut microbiome, physical activity and dietary factors including sugar.” (page 259—the abstract)).

3.2. Results

Having demonstrated the cultural projected BMI differences among the 15-year-old cohort, the objective of the current section is: (1) to measure the cohort effect on the projected BMI of selected groups; (2) compare this cohort effect across groups; and (3) compare this cohort effect across gender for females and males who share the same native language.
Consider the following model, which extends the model given by Equation (2) and is applied only to Hebrew and Russian speakers (the largest group of immigrants):
Y j = β 0 , j + β 1 , j R U S S I A N + β 2 , j A G E 15 + β 3 , j R U S S I A N × A G E 15 + β 4 , j A G E 15 2 + β 5 , j R U S S I A N × A G E 15 2 + μ 2 , j
Once again, and following Ramanathan [20], the model is reshaped, so as to capture the baseline of the 15-year-old cohort (AGE = 15) by the constant terms β 0 , j (projected BMI of 15-year-old Hebrew speakers) and β 0 , j + β 1 , j (projected BMI of 15-year-old Russian speakers). Here, we permit the model to vary with the age variable by adding the quadratic element A G E 15 2 , where the age with the maximum BMI is β 2 , j 2 β 4 , j + 15 for Hebrew speakers if β 4 , j < 0 and β 2 , j β 3 , j 2 β 4 , j + 2 β 5 , j + 15 for Russian speakers if β 4 , j + β 5 , j < 0 (This may be demonstrated as follows. For Hebrew speakers (RUSSIAN=0), the model becomes: Y j = β 0 , j + β 2 , j A G E 15 + β 4 , j A G E 15 2 + μ 2 , j . The first derivative yields: β 2 , j + 2 β 4 , j A G E 15 . To find the maximum projected BMI (in the case that β 4 , j < 0 ), the first derivative is equated to zero: β 2 , j + 2 β 4 , j A G E 15 = 0 . Division by 2 β 4 , j and changing sides yield: A G E 15 = β 2 , j 2 β 4 , j . Finally, adding 15 to both sides yields the requested outcome: A G E = β 2 , j 2 β 4 , j + 15 . For Russian speakers (RUSSIAN = 1), the model becomes: Y j = β 0 , j + β 1 , j + β 2 , j A G E 15 + β 3 , j A G E 15 + β 4 , j A G E 15 2 + β 5 , j A G E 15 2 + μ 2 , j . By rearranging terms: Y j = β 0 , j + β 1 , j + β 2 , j + β 3 , j A G E 15 + β 4 , j + β 5 , j A G E 15 2 + μ 2 , j . The first derivative yields: β 2 , j + β 3 , j + 2 β 4 , j + 2 β 5 , j A G E 15 . To find the maximum projected BMI (in the case that β 4 , j + β 5 , j < 0 ), the first derivative is equated to zero: β 2 , j + β 3 , j + 2 β 4 , j + 2 β 5 , j A G E 15 = 0 . Division by 2 β 4 , j + 2 β 5 , j and changing sides yield: A G E 15 = β 2 , j β 3 , j 2 β 4 , j + 2 β 5 , j . Finally, adding 15 to both sides yields the requested outcome:   A G E = β 2 , j β 3 , j 2 β 4 , j + 2 β 5 , j + 15 ).
The estimation results of this model are given in Table 5 for the 2012 and 2016 samples. At the bottom of Table 5, we report the 95% confidence intervals based on the estimation outcomes for the minimal age (= 15 years), the age that Russian speakers cross the BMI = 25 benchmark (=35 years) and the age that yields the maximum projected BMI ( 0.187 0.103 2 × 0.00171 + 2 × 0.00108 + 15 67 years for Russian speakers and 0.187 2 × 0.00171 + 15 70 years for Hebrew speakers). The outcomes show that both coefficients of (AGE-15) and (AGE-15)2 are statistically significant. Consequently, the null hypothesis that compared to the linear model, the quadratic model better fits the data, cannot be rejected empirically.
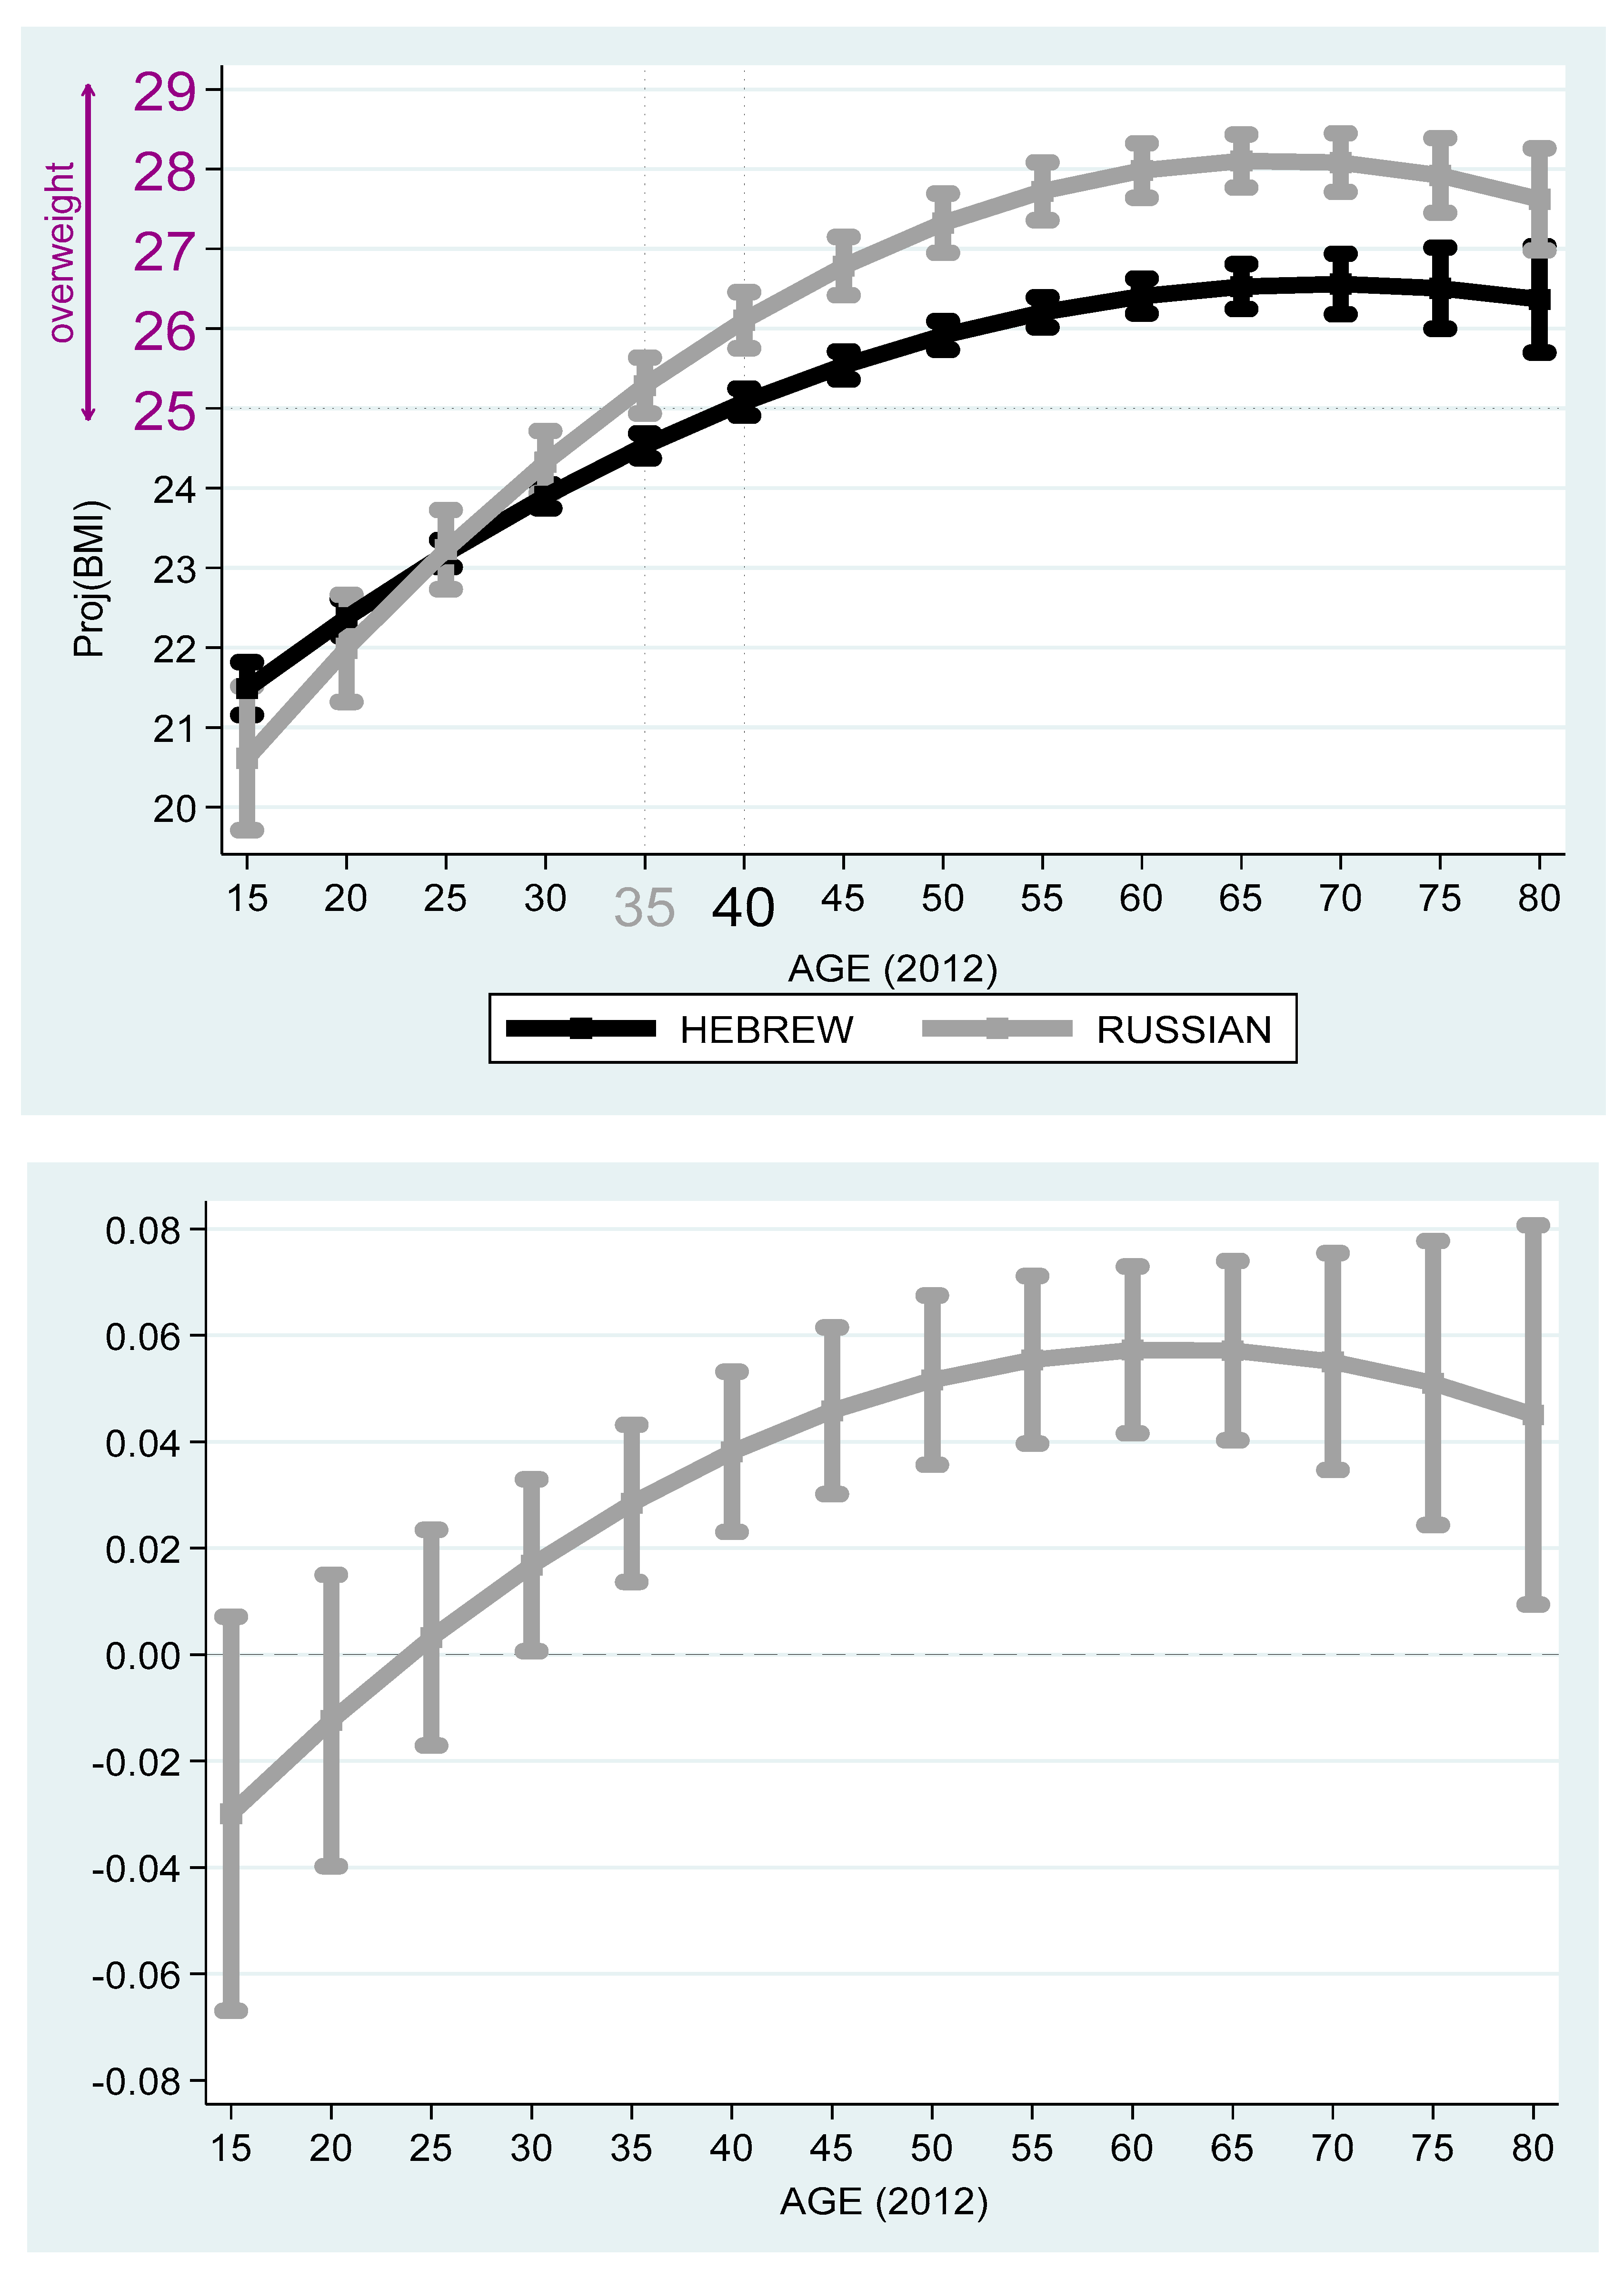
Based on the projected values obtained from Table 4, Figure 3 and Figure 4 compare between Russian and Hebrew speakers by age in 2012 and 2016. The top 2012 graph gives the projected BMI and 95% confidence intervals of individuals whose native language is Hebrew (4166 persons) and Russian (1004 persons), respectively, where the age variable is controlled. The bottom graph gives approximated Russian–Hebrew projected BMI differences in percent and 95% confidence intervals. In both graphs, and in projected BMI terms, the Russian speakers’ 15-year-old benchmark is lower than the Hebrew speakers’. Yet, the growth of projected BMI with age is steeper among Russian speakers. Starting from 30 years in 2012 and 35 years in 2016, the null hypothesis of equality of projected BMI among Russian and Hebrew speakers is rejected at the 5% significance level. While the Russian speakers cross the benchmark of overweight at age 35, the Hebrew speakers cross this benchmark five year later at around 40. Finally, both Hebrew and Russian speakers reach the peak of projected BMI around age 67–70.
Next, consider the following two models applied separately to Hebrew speakers and Russian speakers:
Y j = γ 0 , j + γ 1 , j F E M A L E + γ 2 , j A G E 15 + γ 3 , j F E M A L E × A G E 15 + γ 4 , j A G E 15 2 + γ 5 , j F E M A L E × A G E 15 2 + μ 3 , j
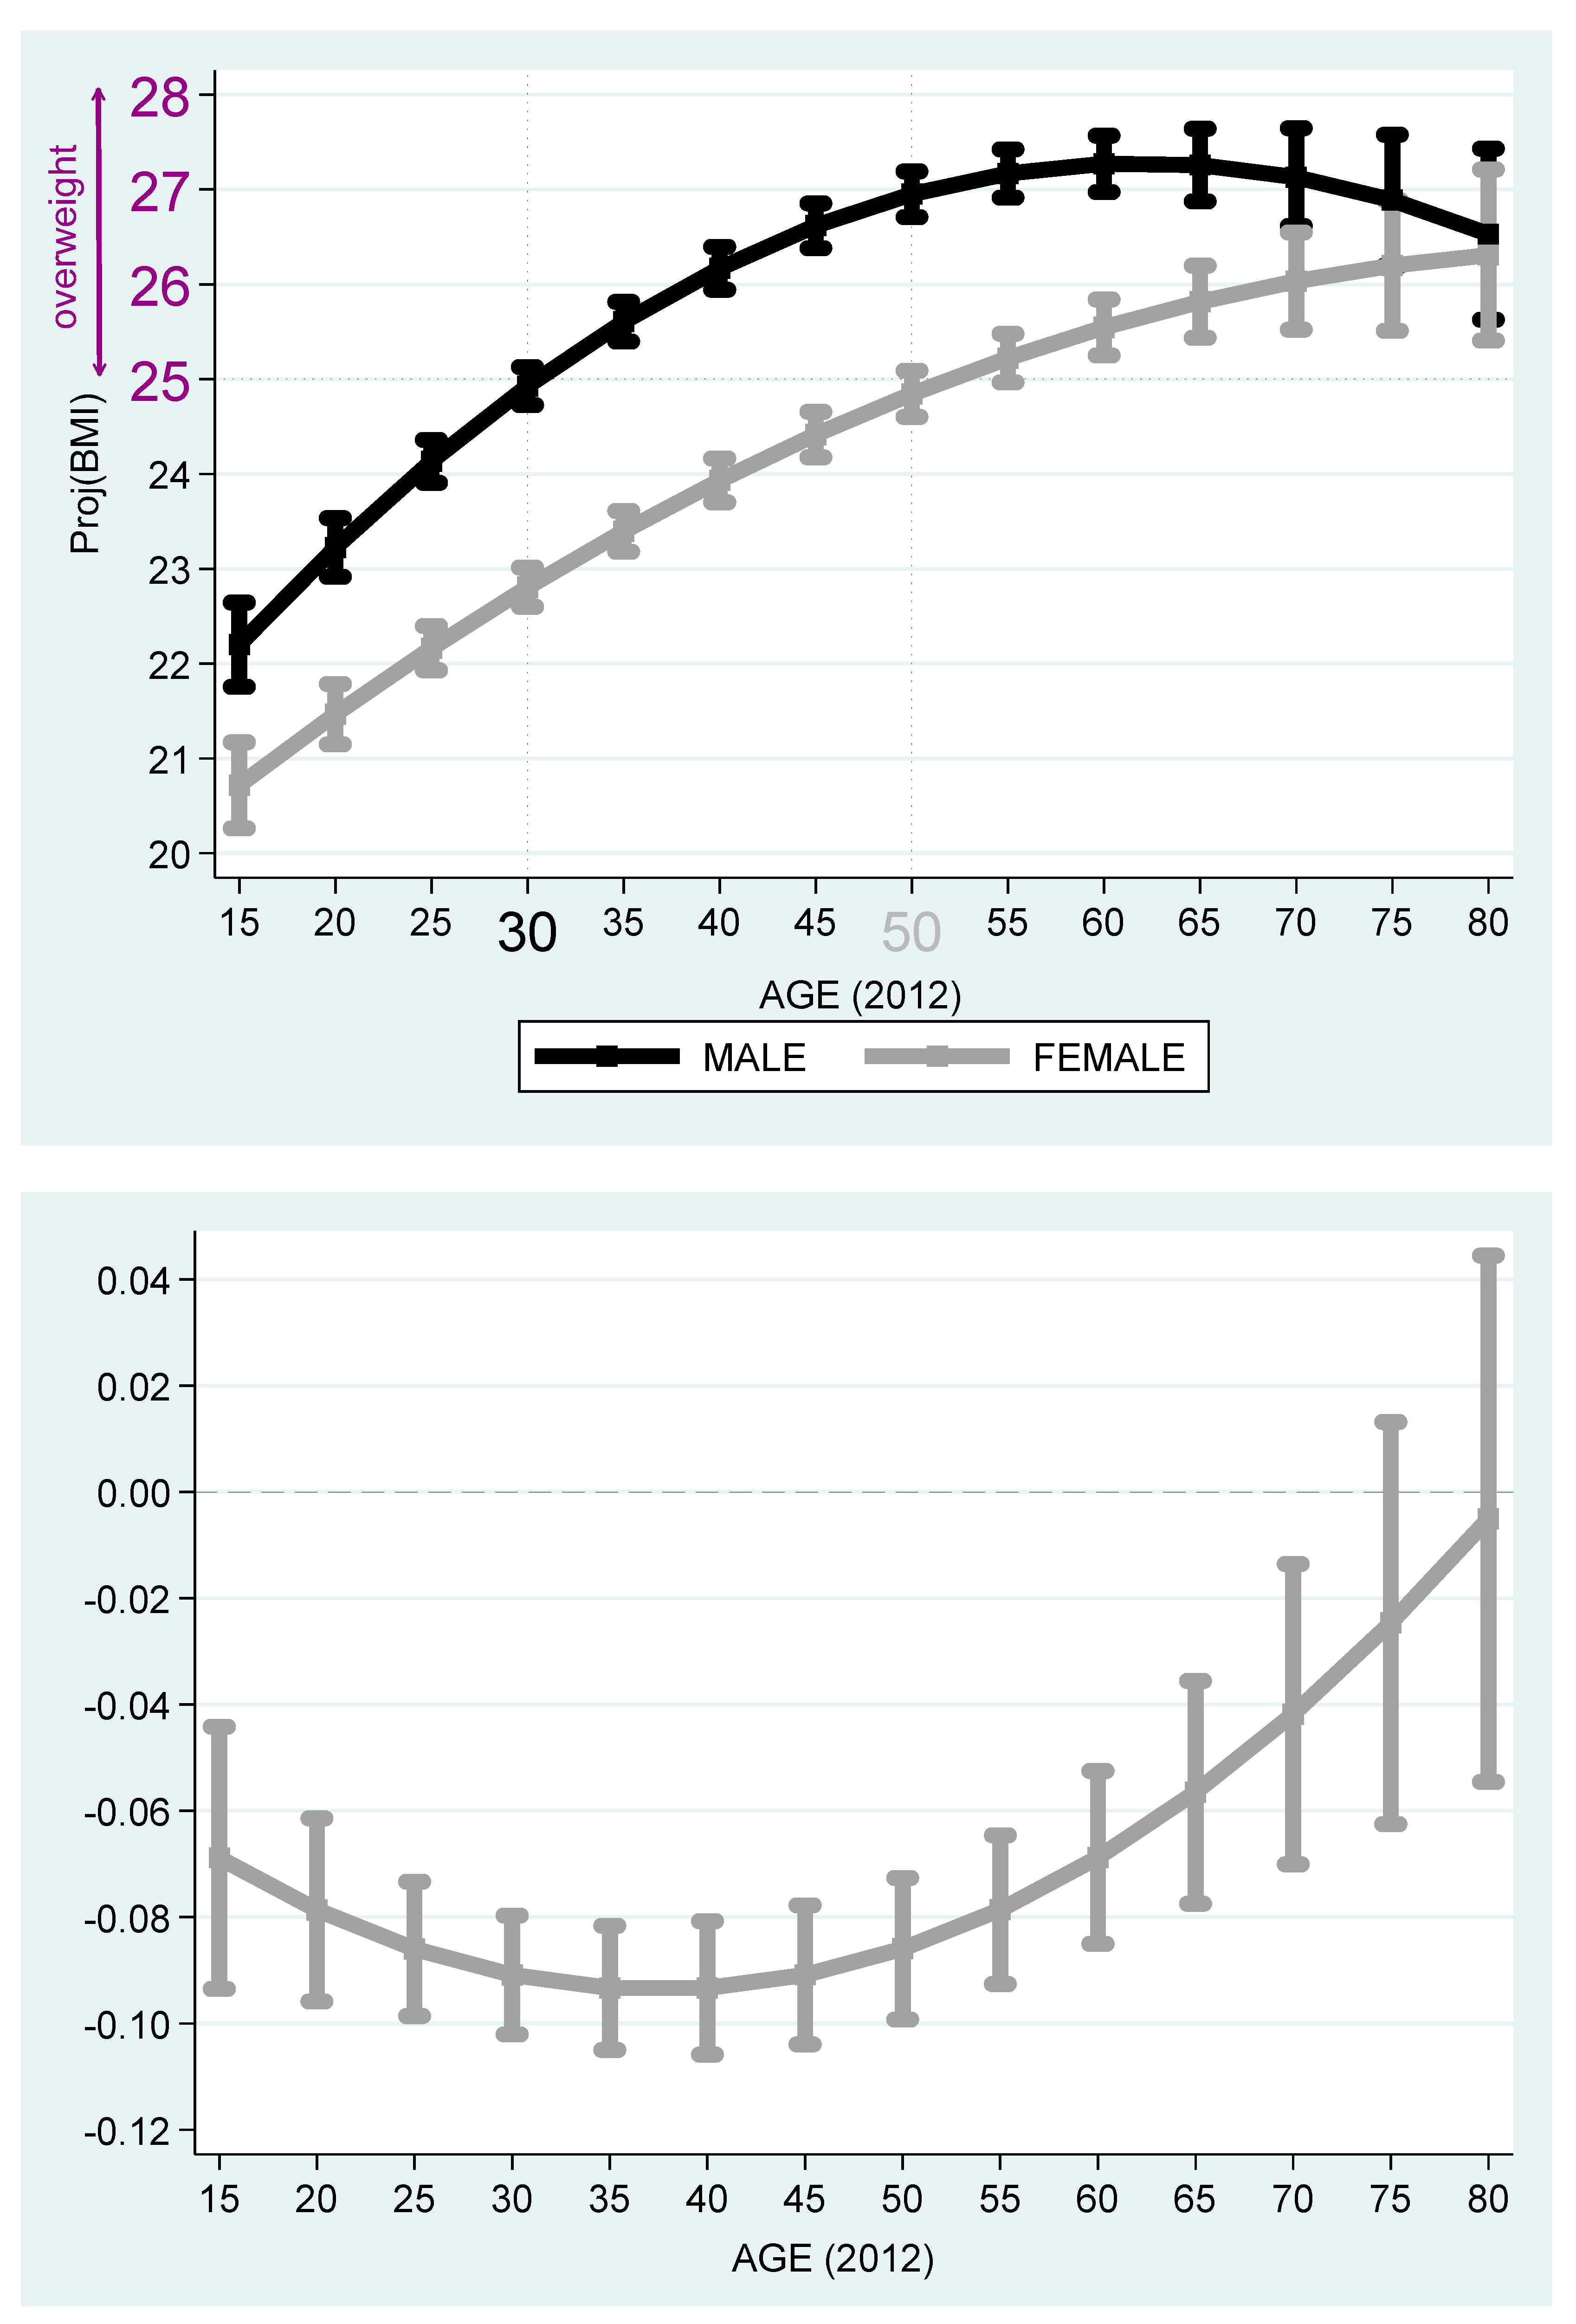
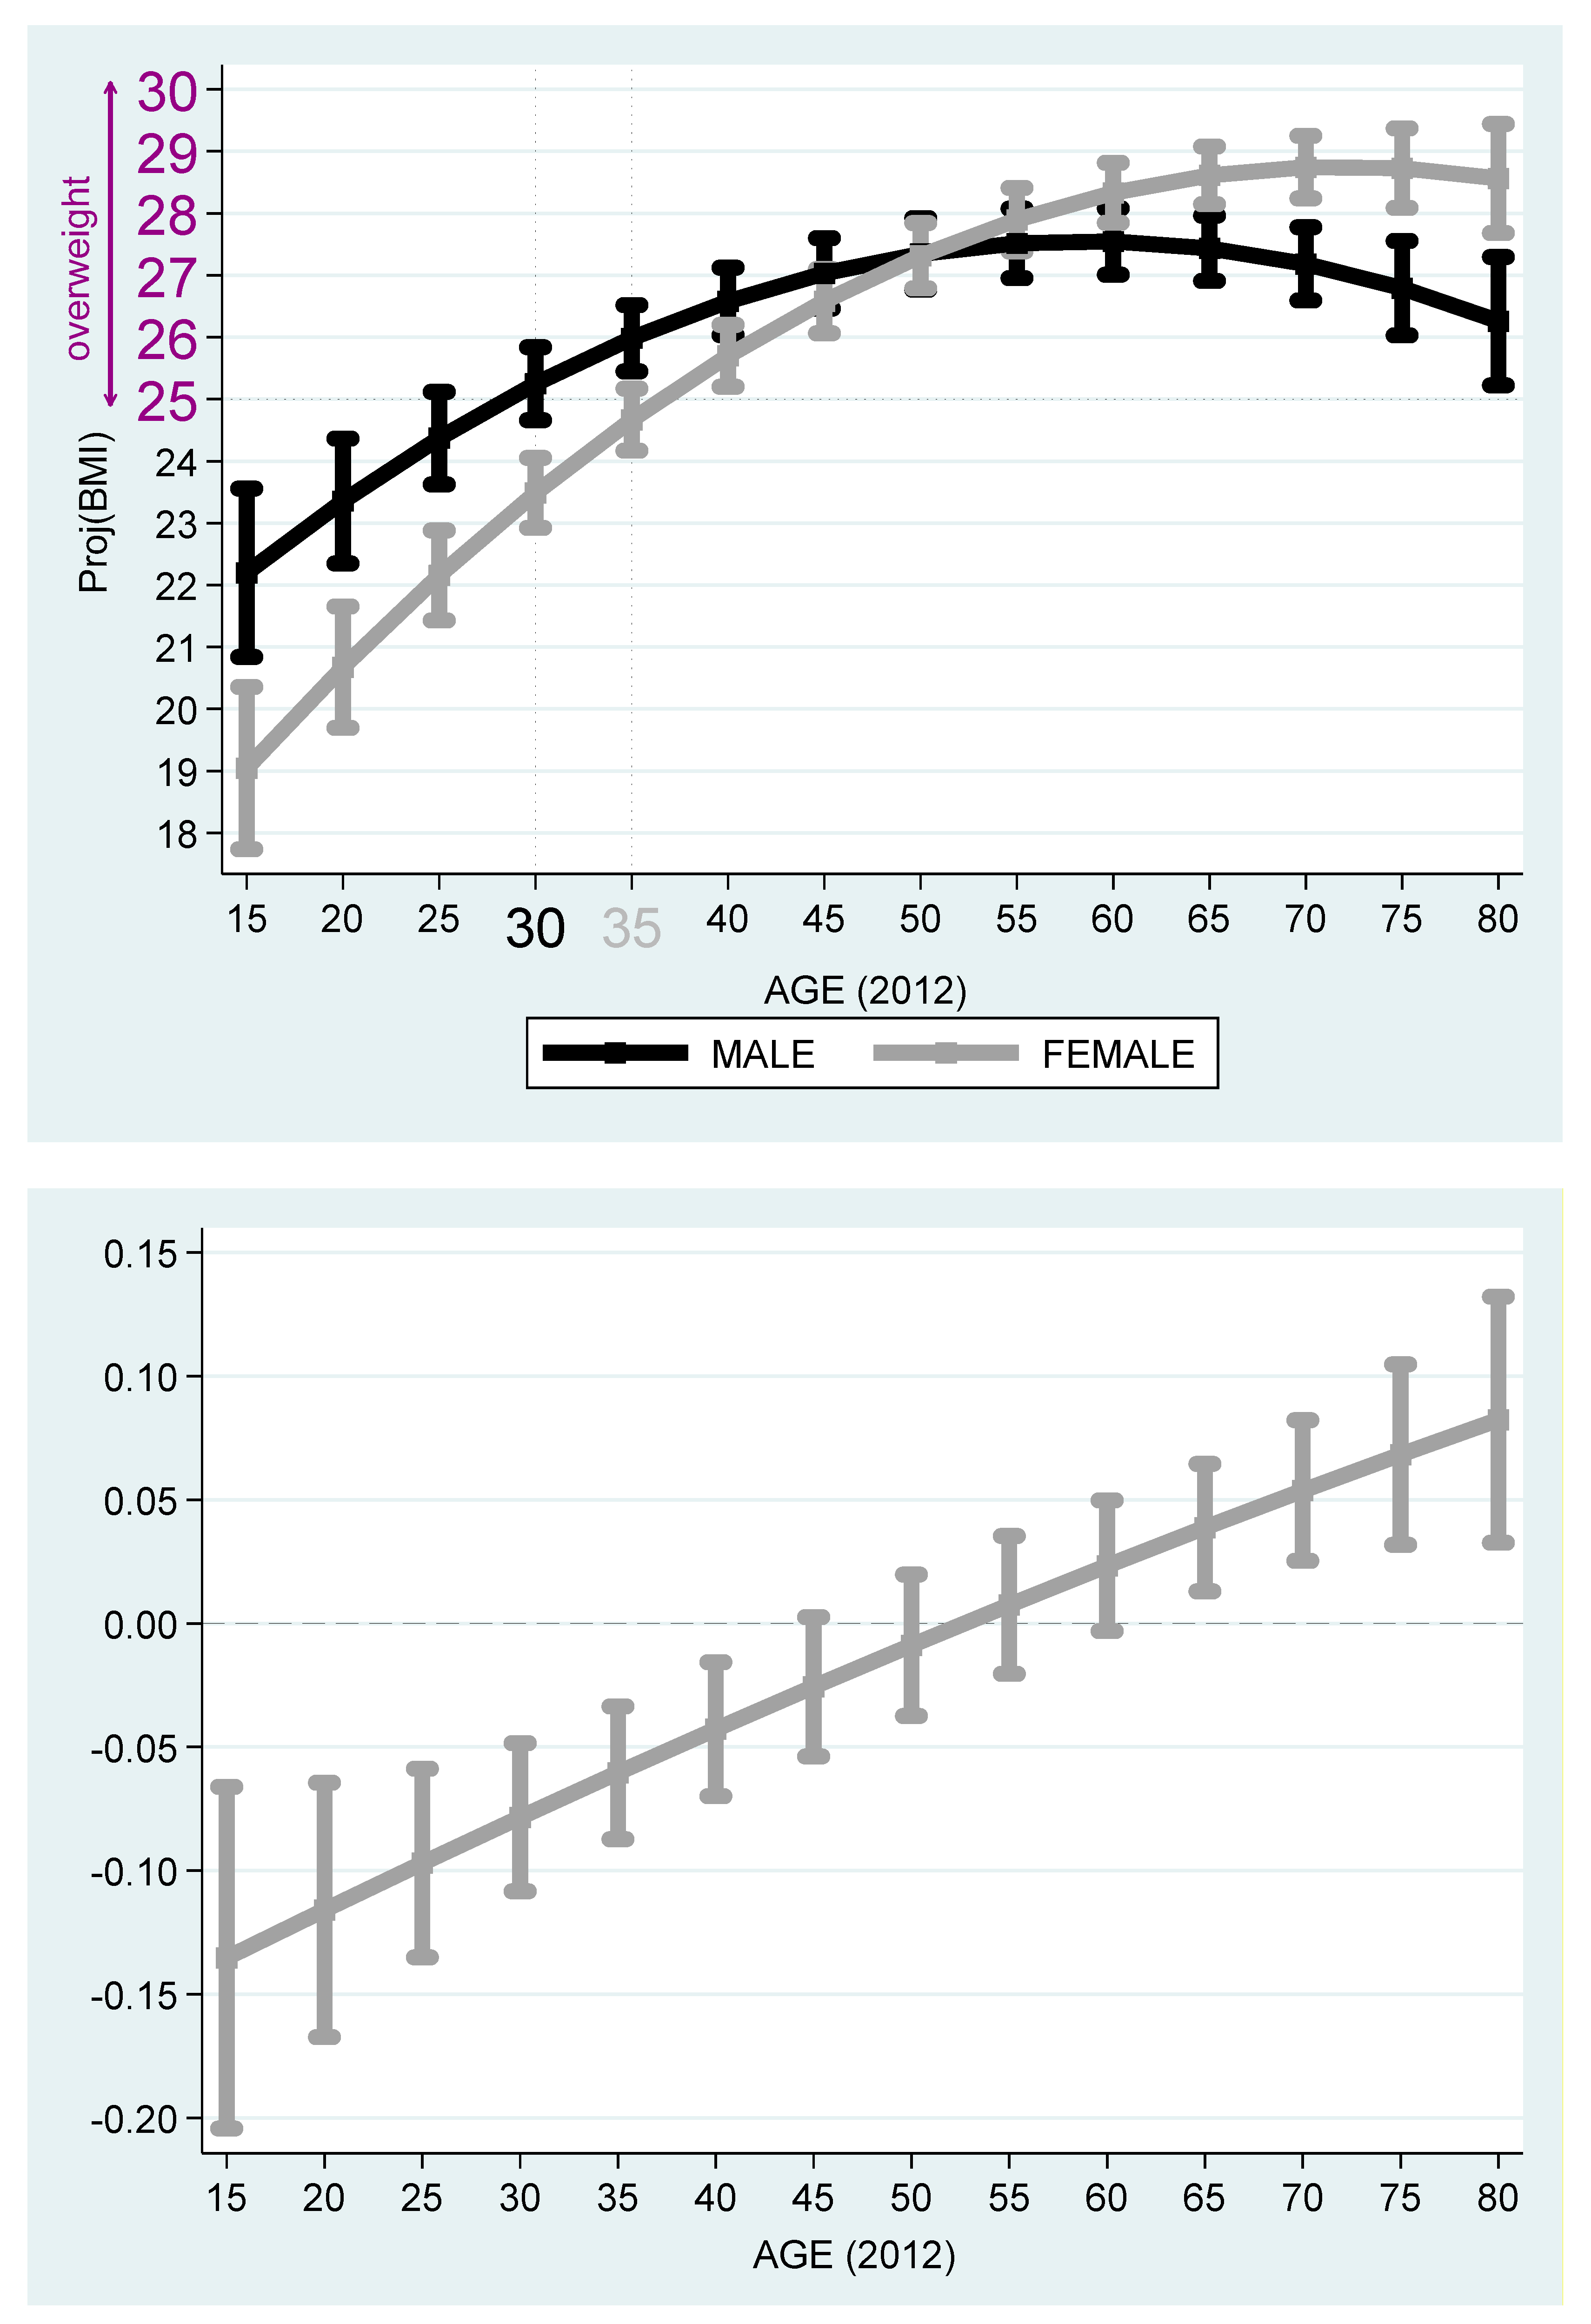
Table 6 reports the estimation outcomes for Hebrew and Russian speakers. Based on the outcomes reported in Table 6, Figure 5 and Figure 6 describe the projected BMI by age and stratified by females and males. It is evident from the figures that among Jewish Native Israelis, the projected BMI of the males is higher than that of the females, even after adjustment for the age cohort. While 30-year-old native Israeli males cross the overweight benchmark at age 30, 50-year-old native Israeli females cross this benchmark, so that the age gap of crossing this benchmark is 20 years in favor of women. The maximum projected BMI is obtained at 0.216 2 × 0.00230 + 15 62   years old for native Israeli males and is equal to 22.20 + 0.216 × 62 15 0.00230 × 62 15 2 27.2713 (below the obesity benchmark of BMI ≥ 30). The same phenomenon exists among Russian speakers. Yet, the gap of crossing this overweight benchmark reduces to only five years in favor of females (age 30 for males and 35 for females). The maximum projected BMI is obtained at 0.246 2 × 0.00282 + 15 59   years old for native Israeli males and is equal to 22.20 + 0.246 × 59 15 0.00282 × 59 15 2 27.5645 (below the obesity benchmark of BMI ≥ 30).
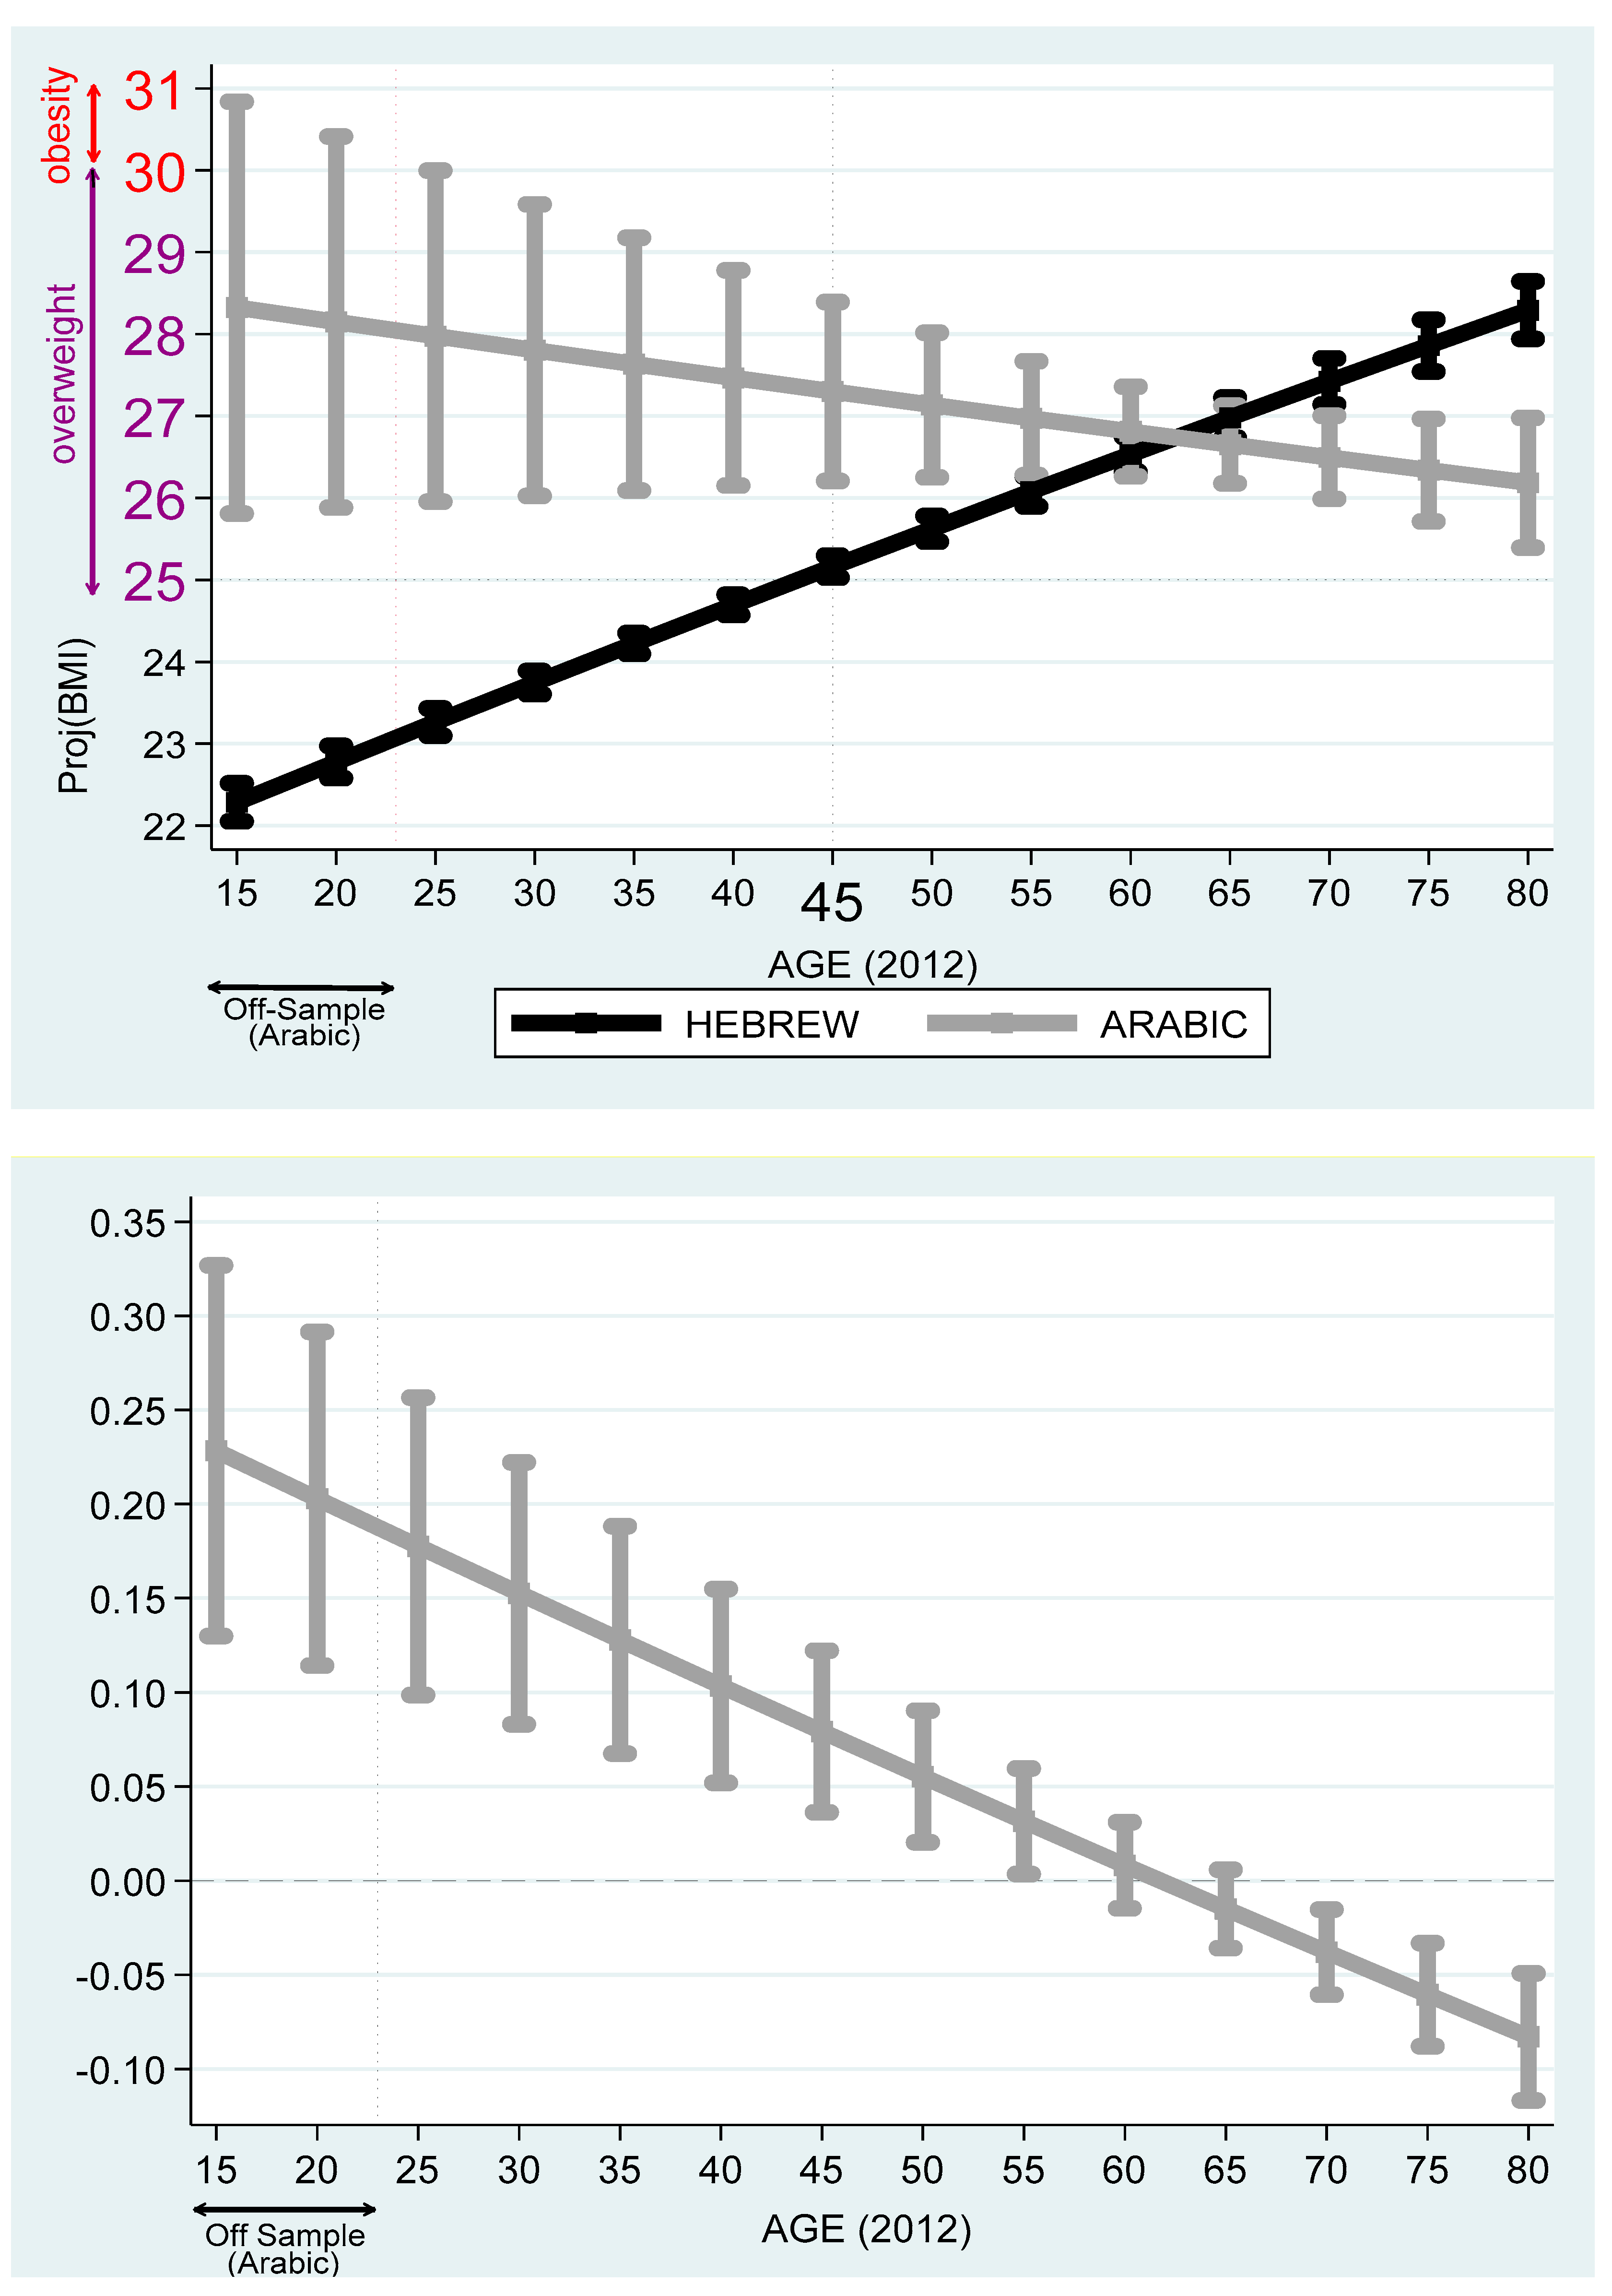
Table 7 reports the projected BMI differences among Hebrew, Arabic, Russian, and Amharic speakers. Based on these outcomes, Figure 7 compares Arabic and Hebrew speakers and Figure 8, Russian and Arabic speakers. It is evident from the figures that Arabic speakers suffer from overweight and obesity problems, particularly for the early age cohorts. Unlike Hebrew or Russian speakers, among Arabic speakers, on the one hand, the projected BMI drops with the age variable. On the other hand, there is a wide spread of projected BMI at the young age cohort.

4. Discussion

Previous research has shown that the American 1965 immigration wave from Asian and South American countries attenuated the obesity pandemic in the United States (e.g., [5,13]). Israel is considered a country with high levels of immigration. It experienced two major immigration waves, which doubled its population: a reactive immigration wave, mainly from Arab States in 1948–1951, and a proactive immigration wave from FSU starting from 1985 (e.g., [10]). Yet, in the Israeli context, the impact of these immigration waves on overweight and obesity has not been previously explored.
In this study, we observe the correlation between the BMI, age, native language, and years-since-migration to Israel, based on a survey carried out by the ICBS in 2012 and 2016. BMI (= k g m 2 ) is a conventional measure of obesity, where BMI ≥ 25 is considered overweight and BMI ≥ 30 as type I obesity.
The results demonstrate that while the prevalence of overweight (BMI ≥ 25) among Hebrew speakers is below 50%, in 11 groups of immigrants, the prevalence of overweight is above 50%. Referring to the Hebrew and Russian speakers (the native language spoken among the largest wave of immigration), our findings suggest that, on the one hand, males cross the overweight benchmark at the same age (35). On the other hand, native Israeli women cross this benchmark much later compared to their female Russian counterpart (50 vs. 35 years). Apart from male/female hormonal differences, a possible interpretation of these outcomes is the influence of western values and norms regarding a slim body image on native Israeli women and cultural differences (e.g., [14,15,16]).
Other potential reasons for obesity differences may be related to genetics [17], nutrition, lack of physical activity [18] and relationship to urban environment, and lack of vitamin D absorption ([1,13,20,21]).
Further results indicate that the Ethiopian immigrants exhibit lower obesity and overweight prevalence compared to native Israelis and all other groups in the population. Unlike other migration waves, no erosion of the initial “health migrant effect” is observed in the group of immigrants from Ethiopia, despite the fact that this immigration wave occurred 20 years before the first survey of 2012 took place.

Author Contributions

Methodology, Y.A., C.F., A.K.; formal analysis, Y.A., C.F., A.K.; investigation, Y.A., C.F., A.K.; writing—original draft preparation, Y.A., C.F., A.K.; writing—review and editing, Y.A., C.F., A.K. All authors have read and agreed to the published version of the manuscript.

Funding

This research received no external funding.

Acknowledgments

The authors are grateful to the Israel Social Sciences Data Center (ISDC), the Hebrew University of Jerusalem for provision of project data, and to Yifat Arbel and Miryam Kerner for helpful comments.

Conflicts of Interest

The authors declare no conflict of interest.

References

  1. Sallis, J.F.; Cerin, E.; Conway, T.L.; Adams, M.A.; Frank, L.D.; Pratt, M.; Salvo, D.; Schipperijn, J.; Smith, G.; Cain, K.L.; et al. Physical activity in relation to urban environments in 14 cities worldwide: A cross-sectional study. Lancet 2016, 387, 2207–2217. [Google Scholar] [CrossRef] [Green Version]
  2. World Health Organization (WHO). Global Strategy on Diet, Physical Activity and Health; World Health Organization: Geneva, Switzerland, 2018; Available online: http://www.who.int/dietphysicalactivity/pa/en/ (accessed on 13 September 2020).
  3. Nyberg, S.T.; Batty, G.D.; Pentti, J.; Virtanen, M.; Alfredsson, L.; I Fransson, E.; Goldberg, M.; Heikkilä, K.; Jokela, M.; Knutsson, A.; et al. Obesity and loss of disease-free years owing to major non-communicable diseases: A multicohort study. Lancet Public Health 2018, 3, e490–e497. [Google Scholar] [CrossRef] [Green Version]
  4. Goel, M.S.; McCarthy, E.P.; Phillips, R.S.; Wee, C.C. Obesity Among US Immigrant Subgroups by Duration of Residence. JAMA 2004, 292, 2860–2867. [Google Scholar] [CrossRef] [PubMed] [Green Version]
  5. Hao, L.; Kim, J.J.H. Immigration and The American Obesity Epidemic. Int. Migr. Rev. 2009, 43, 237–262. [Google Scholar] [CrossRef] [PubMed] [Green Version]
  6. Higgins, V.; Nazroo, J.; Brown, M. Pathways to ethnic differences in obesity: The role of migration, culture and socio-economic position in the UK. SSM Popul. Heal. 2019, 7, 100394. [Google Scholar] [CrossRef] [PubMed]
  7. McDonald, J.T.; Kennedy, S. Is migration to Canada associated with unhealthy weight gain? Overweight and obesity among Canada’s immigrants. Soc. Sci. Med. 2005, 61, 2469–2481. [Google Scholar] [CrossRef] [PubMed]
  8. Murphy, M.; Robertson, W.; Oyebode, O. Obesity in International Migrant Populations. Curr. Obes. Rep. 2017, 6, 314–323. [Google Scholar] [CrossRef] [PubMed] [Green Version]
  9. Popkin, B.M. An overview on the nutrition transition and its health implications: The Bellagio meeting. Public Heal. Nutr. 2002, 5, 93–103. [Google Scholar]
  10. Arbel, Y.; Fialkoff, C.; Amichai, K. Determinants of Ownership Rates among New Immigrants to Israel: Ethnic Origin and Tenure Mode in the Host Country. J. Real Estate Lit. 2019, 27, 189–226. [Google Scholar]
  11. Arbel, Y.; Fialkoff, C.; Kerner, A. The Association of Pension Income with the Incidence of Type I Obesity among Retired Israelis. J. Obes. 2019, 2019, 5101867. [Google Scholar] [CrossRef] [PubMed]
  12. Israel Central Bureau of Statistics (ICBS): Statistical Abstract of Israel 2018; p. 19. Available online: https://www.cbs.gov.il/he/publications/DocLib/2018/shnaton69/shnaton69.pdf (accessed on 13 September 2020).
  13. Foss, Y. Vitamin D deficiency is the cause of common obesity. Med. Hypotheses 2009, 72, 314–321. [Google Scholar] [CrossRef] [PubMed]
  14. Furthner, D.; Ehrenmüller, M.; Biebl, A.; Lanzersdorfer, R.; Halmerbauer, G.; Auer-Hackenberg, L.; Schmitt, K. Gender differences and the role of parental education, school types and migration on the body mass index of 2930 Austrian school children. Wien. Klin. Wochenschr. 2017, 129, 786–792. [Google Scholar] [CrossRef] [PubMed]
  15. Prioreschi, A.; Wrottesley, S.V.; Cohen, E.; Reddy, A.; Said-Mohamed, R.; Twine, R.; Tollman, S.M.; Kahn, K.; Dunger, D.B.; Norris, S.A. Examining the relationships between body image, eating attitudes, BMI, and physical activity in rural and urban South African young adult females using structural equation modeling. PLoS ONE 2017, 12, e0187508. [Google Scholar] [CrossRef] [PubMed] [Green Version]
  16. Torstveit, M.K.; Aagedal-Mortensen, K.; Stea, T.H. More than Half of High School Students Report Disordered Eating: A Cross Sectional Study among Norwegian Boys and Girls. PLoS ONE 2015, 10, e0122681. [Google Scholar] [CrossRef] [PubMed] [Green Version]
  17. Beales, P.R.; Farooqi, I.S.; O’Rahilly, S. Genetics of Obesity Syndromes; Oxford University Press: Oxford, UK, 2009. [Google Scholar]
  18. Kinra, S.; Mallinson, P.A.C.; Cresswell, J.A.; Bowen, L.J.; Lyngdoh, T.; Prabhakaran, D.; Reddy, K.S.; Vaz, M.; Kurpad, A.V.; Smith, G.D.; et al. Relative contribution of diet and physical activity to increased adiposity among rural to urban migrants in India: A cross-sectional study. PLoS Med. 2020, 17, e1003234. [Google Scholar] [CrossRef] [PubMed]
  19. Stunkard, A.J.; Foch, T.T.; Hrubec, Z. A twin study of human obesity. JAMA 1986, 256, 51–54. [Google Scholar] [CrossRef] [PubMed]
  20. Creatore, M.I.; Glazier, R.H.; Moineddin, R.; Fazli, G.S.; Johns, A.; Gozdyra, P.; Matheson, F.I.; Kaufman-Shriqui, V.; Rosella, L.C.; Manuel, D.G.; et al. Association of Neighborhood Walkability With Change in Overweight, Obesity, and Diabetes. JAMA 2016, 315, 2211. [Google Scholar] [CrossRef] [PubMed] [Green Version]
  21. Stark, J.H.; Neckerman, K.; Lovasi, G.S.; Quinn, J.; Weiss, C.C.; Bader, M.D.M.; Konty, K.; Harris, T.G.; Rundle, A.G. The impact of neighborhood park access and quality on body mass index among adults in New York City. Prev. Med. 2014, 64, 63–68. [Google Scholar] [CrossRef] [PubMed] [Green Version]
  22. World Health Organization (WHO). Global Status Report on Noncommunicable Diseases; World Health Organization: Geneva, Switzerland, 2014. [Google Scholar]
  23. OECD Report: Overweight or Obese Population. Available online: https://data.oecd.org/pinboard-editor/ (accessed on 13 September 2020).
  24. Moore, J.B.; Boesch, C. Getting energy balance right in an obesogenic world. Proc. Nutr. Soc. 2019, 78, 259–261. [Google Scholar] [CrossRef] [PubMed] [Green Version]
  25. Ramu, R. Introductory Econometrics with Applications, 5th ed.; South-Western Thomson Learning: Mason, OH, USA, 2002. [Google Scholar]
  26. Johnston, J.; Dinardo, J. Econometric Methods, 4th ed.; McGraw Hill: New York, NY, USA, 1997. [Google Scholar]
Figure 1. Overweight or obese population (measured/self-reported, % of population aged 15+, 2018 or latest available). Source: OECD Report [23]. Overweight is defined as: 25 B M I < 30 and obesity is defined as B M I 30 , where B M I = kg m 2 .
Sustainability 12 07567 g001
Figure 2. Distribution of BMI stratified by native language (2012).
Sustainability 12 07567 g002
Figure 3. Russian vs. Hebrew (2012): pooled sample. Notes: The top graph gives the projected BMI and 95% confidence intervals of individuals whose native language is Hebrew (4166 persons) and Russian (1004 persons), respectively, where the age variable is controlled. The bottom graph gives approximated Russian–Hebrew projected BMI differences in percent and 95% confidence intervals.
Sustainability 12 07567 g003
Figure 4. Russian vs. Hebrew (2016): pooled sample. Notes: The top graph gives the projected BMI and 95% confidence intervals of individuals whose native language is Hebrew (3526 persons) and Russian (805 persons), respectively, where the age variable is controlled. The bottom graph gives approximated Russian–Hebrew projected BMI differences in percent and 95% confidence intervals.
Sustainability 12 07567 g004
Figure 5. Native Israelis (native language: Hebrew): females vs. males (2012). Notes: The top graph gives the projected BMI and 95% confidence intervals of females (2042) and males (2123) whose native language is Hebrew, where the age variable is controlled. The bottom graph gives approximated female–male projected BMI differences in percent and 95% confidence intervals.
Sustainability 12 07567 g005
Figure 6. Russian immigrants: females vs. males (2012). Notes: The top graph gives the projected BMI and 95% confidence intervals of females (552) and males (452) whose native language is Russian, where the age variable is controlled. The bottom graph gives approximated female–male projected BMI differences in percent and 95% confidence intervals.
Sustainability 12 07567 g006
Figure 7. Arabic vs. Hebrew (2012). Notes: The top graph gives the projected BMI and 95% confidence intervals of individuals whose native language is Hebrew (4183 persons) and Arabic (288 persons), respectively, where the age variable is controlled. The bottom graph gives approximated Arabic–Hebrew projected BMI differences in percent and 95% confidence intervals.
Sustainability 12 07567 g007
Figure 8. Arabic vs. Russian (2012): A comparison with Jewish immigrants. Notes: The top graph gives the projected BMI and 95% confidence intervals of individuals whose native language is Arabic and Russian, respectively, where the age variable is controlled. The bottom graph gives approximated Arabic–Russian projected BMI differences in percent and 95% confidence intervals.
Sustainability 12 07567 g008
Table 1. Descriptive statistics of the pooled sample 1.
A. 2012
VARIABLESDescriptionObsMeanMedianSDMinMax
INDWEIGHWeight in kilograms683672.27287215.241644120
HEIGHTHeight in meters68361.68891.670.09321.491.9
BMI B o d y   M a s s = W E I G H T H E I G H T 2 683625.254924.67114.555714.044551.9391
BMI251 = BMI ≥ 25; 0 = BMI < 2568360.47600.00000.499501
AGEAge in years683645.29784318.27441580
FEMALE1 = female, 0 = male68350.50650.00000.500001
B. 2016
VARIABLESDescriptionObsMeanMedianSDMinMax
INDWEIGHWeight in kilograms563772.27327215.335944120
HEIGHTHeight in meters56371.69061.670.09381.491.9
BMI B o d y   M a s s = W E I G H T H E I G H T 2 563725.199524.57794.537214.044551.9391
BMI251 = BMI ≥ 25; 0 = BMI < 2556370.45630.00000.498101
AGEAge in years563745.72724419.01261580
FEMALE1 = female, 0 = male56370.49740.00000.500001
1 Notes: The pooled sample includes 6836 observations in 2012 and 5637 observations in 2016 of adult individuals, where the age of female (male) members is between 15 to 80 years old.
Table 2. International BMI rankings, by country (selected countries). Source: World Health Organization (WHO): “Global status report on noncommunicable diseases 2014” [24].
OverallOverall MeanFemaleFemale MeanMaleMale Mean
FlagCountryRankBMI (kg/m2)RankBMI (kg/m2)RankBMI (kg/m2)
Sustainability 12 07567 i001Egypt1129.2730.72627.6
Sustainability 12 07567 i002Libya2228.41729.64627.2
Sustainability 12 07567 i003Syria2528.124294627.2
Sustainability 12 07567 i004Lebanon2927.84527.61628
Sustainability 12 07567 i005England4027.35727.13327.5
Sustainability 12 07567 i006Spain6326.794263827.4
Sustainability 12 07567 i007Russia6926.56926.88526.1
Sustainability 12 07567 i008Hungary7726.311925.23327.5
Sustainability 12 07567 i009Israel7726.39026.28226.3
Sustainability 12 07567 i010Algeria8226.2662710525.5
Sustainability 12 07567 i011Morocco10925.69925.911325.2
Sustainability 12 07567 i012Romania12025.313124.99825.7
Sustainability 12 07567 i013Ethiopia18920.61882118920.2
Table 3. A comparison to the average BMI of native Russians.
Females:
Native IsraeliNative RussianCalculatedp-Value
23.56 kg m 2 26.8 kg m 2 t2,041 = 33.9806 ***p < 0.0001
Immigrants from RussiaNative Russian
26.54 kg m 2 26.8 kg m 2 t551 = 1.1530p = 0.2494
Males:
Native IsraeliNative RussianCalculatedp-Value
25.48 kg m 2 26.1 kg m 2 t2,122 = 6.942 ***p < 0.0001
Immigrants from RussiaNative Russian
26.39 kg m 2 26.1 kg m 2 t451 = 1.5169p = 0.1300
Notes: *** p < 0.0001.
Table 4. Stratification of BMI by native language and age (2012).
(1)(2)(3)(4)
MedianMedian
MethodologyOLSOLSRegressionRegression
VARIABLESBMI(2012)ln(BMI(2012))BMI(2012)ln(BMI(2012))
Constant22.35 ***3.095 ***21.79 ***3.086 ***
[22.11, 22.58](<0.0001)[21.52, 22.05](<0.0001)
ARABIC5.929 ***0.224 ***6.598 ***0.262 ***
(3.90×10⁻⁶)(4.87×10⁻⁶)(3.63×10⁻⁶)(5.07×10⁻⁶)
RUSSIAN0.769 **0.0332 ***0.911 ***0.0408 ***
(0.0156)(0.00630)(0.00977)(0.00413)
ENGLISH0.2810.0137−0.160−0.00959
(0.666)(0.583)(0.825)(0.742)
YIDDISH5.385 ***0.211 ***5.958 ***0.237 ***
(9.53×10⁻⁶)(5.88×10⁻⁶)(1.00×10⁻⁵)(1.37×10⁻⁵)
FRENCH2.113 ***0.0798 **2.533 ***0.105 ***
(0.00933)(0.0102)(0.00496)(0.00385)
AMHARIC−1.686 *−0.0771 **−1.580−0.0772 *
(0.0952)(0.0458)(0.159)(0.0874)
HUNGARIAN6.465 **0.255 **9.289 ***0.364 ***
(0.0152)(0.0124)(0.00166)(0.00226)
MOROCCAN4.257 *0.1474.1600.170
(0.0792)(0.113)(0.122)(0.118)
SPANISH0.7930.03011.5610.0655
(0.444)(0.448)(0.175)(0.158)
PERSIAN5.260 ***0.204 ***5.378 ***0.216 ***
(0.00104)(0.000884)(0.00251)(0.00264)
ROMANIAN3.727 **0.150 **2.8120.119 *
(0.0179)(0.0128)(0.107)(0.0895)
OTHERS2.391 ***0.0991 ***2.256 ***0.0979 ***
(0.000219)(6.20e-05)(0.00166)(0.000716)
(AGE-15)0.0929 ***0.00382 ***0.0957 ***0.00389 ***
(<0.0001)(<0.0001)(<0.0001)(<0.0001)
ARABIC×(AGE-15)−0.125 ***−0.00480 ***−0.136 ***−0.00544 ***
(5.01×10⁻⁷)(4.88×10⁻⁷)(7.97×10⁻⁷)(1.09×10⁻⁶)
RUSSIAN×(AGE-15)−5.18×10⁻⁶−0.000180−0.00802−0.000478
(0.995)(0.577)(0.391)(0.205)
ENGLISH×(AGE-15)−0.0191−0.000852−0.00263−1.78×10⁻⁵
(0.311)(0.239)(0.900)(0.983)
YIDDISH×(AGE-15)−0.0971 ***−0.00395 ***−0.104 ***−0.00420 ***
(3.10×10⁻⁵)(9.52×10⁻⁶)(5.36×10⁻⁵)(5.53×10⁻⁵)
FRENCH×(AGE-15)−0.0513 ***−0.00201 ***−0.0669 ***−0.00274 ***
(0.00689)(0.00556)(0.00146)(0.00122)
AMHARIC×(AGE-15)0.004960.000710−0.001850.000266
(0.912)(0.678)(0.970)(0.894)
HUNGARIAN×(AGE-15)−0.143 ***−0.00569 ***−0.197 ***−0.00771 ***
(0.00733)(0.00514)(0.000857)(0.00120)
MOROCCAN×(AGE-15)−0.0827−0.00299−0.0892−0.00364
(0.108)(0.128)(0.118)(0.113)
SPANISH×(AGE-15)−0.0226−0.000906−0.0393−0.00163
(0.335)(0.311)(0.130)(0.119)
PERSIAN×(AGE-15)−0.12 6***−0.00500 ***−0.129 ***−0.00514 ***
(0.000343)(0.000199)(0.000980)(0.00110)
ROMANIAN×(AGE-15)−0.0677 **−0.00281 **−0.0507−0.00221
(0.0288)(0.0175)(0.140)(0.111)
OTHERS×(AGE-15)−0.0483 ***−0.00213 ***−0.0435 ***−0.00193 ***
(0.000474)(5.34×10⁻⁵)(0.00446)(0.00181)
Observations6836683668366836
R-squared0.1370.1480.08950.0914
MSE ( σ ^ 2 )17.970.02631.620.0638
BMI Projections and 95% Confidence Intervals for 15-Year-Old Cohort
(1)(2)(3)(4)
NativeMin MedianMedian
LanguageAgeOLSOLSRegressionRegression
HEBREW1522.3522.3921.7922.61
[22.11, 22.58][22.18, 22.59][21.52, 22.05][22.37, 22.85]
ARABIC2328.28 ###28.02 ###28.38 ###29.38 ###
[25.77, 30.78][25.46, 30.84][25.61, 31.16][26.27, 32.87]
RUSSIAN1523.1223.1422.0923.55
[22.54, 23.69][22.64, 23.66][22.06, 23.34][22.95, 24.16]
ENGLISH1622.6222.7021.6322.39
[21.37, 23.88][21.63, 23.81][20.24, 23.02][21.17, 23.69]
YIDDISH1627.73 ###27.64 ###27.74 ###28.64 ###
[25.36, 30.10][25.24, 30.26][25.12, 30.37][25.76, 31.85]
FRENCH1624.46 ##24.25 ##24.32 ##25.11 ##
[22.88, 26.04][22.83, 25.75][22.57, 26.07][23.41, 26.95]
AMHARIC1720.6620.7220.2120.93
[18.69, 22.63][19.22, 22.34][18.03, 22.39][19.17, 22.85]
HUNGARIAN2728.81 ###28.88 ###31.08 ###32.53 ###
[23.60, 34.02][23.66, 35.25][25.29, 36.86][25.76, 41.06]
MOROCCAN4226.60 ###25.93 ###25.95 ###26.79 ###
[21.85, 31.35][21.63, 31.10][20.68, 31.21][21.66, 33.12]
SPANISH2223.14 ##23.0723.35 ##24.14 ##
[21.12, 25.12][21.36, 24.92][21.11, 25.58][22.06, 26.42]
PERSIAN2527.61 ###27.45 ###27.16 ###28.05 ###
[24.47, 30.74][24.35, 30.95][23.69, 30.64][24.38, 32.27]
ROMANIAN1726.07 ##26.00 ##24.60 ##25.48 ##
[23.00, 29.15][23.12, 29.25][21.19, 28.01][22.21, 29.23]
OTHERS1524.74 ##24.72 ##24.04 ##24.93 ##
[23.49, 25.98][23.57, 25.92][22.66, 25.42][23.58, 26.36]
Notes: The baseline 2012 sample refers to 4166 native Jewish Israelis, whose native language is Hebrew (the base category), and 2670 Jewish immigrants, whose native language is different from Hebrew. For the semi-logarithmic model, p r o j B M I = exp ln p r o j B M I + 1 2 σ ^ 2 . The 95% confidence intervals are given in brackets. Minimum age is given in years. P-values are given in parentheses. ## (###) The null hypothesis of Proj(BMI) 25 (Proj(BMI) 30) is not rejected at the 5% level. * p < 0.1; ** p < 0.05; *** p < 0.01.
Table 5. Hebrew vs. Russian: pooled sample (2012, 2016).
Regressions:
(1)(2)(3)(4)
VARIABLESBMI(2012)ln(BMI(2012))BMI(2016)ln(BMI(2016))
Constant21.49 ***3.060 ***21.51 ***3.059 ***
[21.15, 21.82](<0.0001)[21.17, 21.85](<0.0001)
RUSSIAN−0.874 *−0.0299−1.355 **−0.0478 **
(0.0745)(0.113)(0.0197)(0.0326)
(AGE-15)0.187 ***0.00772 ***0.182 ***0.00782 ***
(<0.0001)(<0.0001)(<0.0001)(<0.0001)
RUSSIAN × (AGE-15)0.103 ***0.00370 ***0.133 ***0.00456 ***
(0.00142)(0.00298)(0.000323)(0.00137)
(AGE−15)2−0.00171 *** 7.13 × 10 5 ***−0.00165 *** 7.44 × 10 5 ***
(<0.0001)(<0.0001)(<0.0001)(<0.0001)
RUSSIAN × (AGE-15)2−0.00108 ** 3.92 × 10 5 **−0.00149 *** 4.92 × 10 5 **
(0.0212)(0.0305)(0.00395)(0.0136)
Observations5170517043314331
R-squared0.1530.1650.1600.172
MSE (   σ   ^ 2 )16.99160.025216.69150.0248
BMI Projections and 95% Confidence Intervals:
Projections Definitions(1)(2)(3)(4)
Proj(BMI) if RUSSIAN = 0;21.4921.5921.5121.56
AGE = 15[21.15, 21.82][21.31, 21.87][21.17, 21.85][21.28, 21.85]
Proj(BMI) if RUSSIAN = 1;20.6120.9520.1520.56
AGE = 15[19.71, 21.53][20.24, 21.69][19.07, 21.24][19.71, 21.43]
Proj(BMI) if RUSSIAN = 0;24.5324.4824.4824.47
AGE = 35[24.37, 24.69][24.34, 24.63][24.31, 24.65][24.31, 24.64]
Proj(BMI) if RUSSIAN = 1;25.29 ##25.19 ##25.19 ##25.06 ##
AGE = 35[24.94, 25.64][24.85, 25.53][24.78, 25.59][24.67, 25.45]
Proj(BMI) if RUSSIAN = 0;26.53 ##26.57 ##26.47 ##26.46 ##
AGE = 65 (Maximum[26.24, 26.81][26.28, 26.86][26.20, 26.74][26.19, 26.74]
proj(BMI) for RUSSIAN)
Proj(BMI) if RUSSIAN = 1;28.10 ##28.13 ##28.03##28.02 ##
AGE = 65 (Maximum[27.77, 28.44][27.77, 28.50][27.67, 28.40][27.63, 28.42]
proj(BMI) for RUSSIAN)
Proj(BMI) if RUSSIAN = 0;26.56 ##26.60 ##26.51 ##26.47 ##
AGE = 70 (Maximum[26.18, 26.93][26.21, 26.99][26.15, 26.88][26.10, 26.84]
proj(BMI) for HEBREW)
Proj(BMI) if RUSSIAN = 1;28.08 ##28.11 ##27.96 ##27.94 ##
AGE = 70 (Maximum[27.71, 28.45][27.71, 28.51][27.58, 28.33][27.53, 28.34]
proj(BMI) for HEBREW)
Notes: The 2012 (2016) sample refers to 4166 (3526) native Jewish Israelis, whose native language is Hebrew, and 1004 (805) Jewish immigrants from Russia, whose mother tongue is Russian. For the semi-logarithmic model, p r o j B M I = exp ln p r o j B M I + 1 2 σ ^ 2 . The 95% confidence intervals are given in brackets. ## (###) The null hypothesis of Proj(BMI) 25 (Proj(BMI) 30) is not rejected at the 5% level. P-values are given in parentheses. * p < 0.1; ** p < 0.05; *** p < 0.01.
Table 6. Females vs. Males.
(1)(2)(3)(4)
Native LanguageHebrewHebrewRussianRussian
VARIABLESBMI(2012)ln(BMI(2012))BMI(2012)ln(BMI(2012))
Constant22.20 ***3.093 ***22.20 ***3.098 ***
(<0.0001)(<0.0001)(<0.0001)(<0.0001)
FEMALE−1.483 ***−0.0688 ***−3.154 ***−0.135 ***
( 4.87 × 10 6 )( 4.76 × 10 8 )(0.00107)(0.000130)
(AGE × 15)0.216 ***0.00879 ***0.246 ***0.00961 ***
(<0.0001)(<0.0001)( 4.74 × 10 8 )( 5.52 × 10 9 )
FEMALE × (AGE-15)−0.0612 **−0.00220 **0.09550.00392 *
(0.0211)(0.0324)(0.119)(0.0805)
(AGE-15)2−0.00230 *** 9.46 × 10 5 ***−0.00282 ***−0.000110 ***
(<0.0001)(<0.0001)( 6.95 × 10 6 )( 1.54 × 10 6 )
FEMALE × (AGE-15)20.00124 *** 4.90 × 10 5 ***−0.000177 8.75 × 10 6
(0.00739)(0.00642)(0.834)(0.777)
Observations4165416510041004
R-squared0.1700.1890.1910.214
MSE ( σ ^ 2 )15.520.023418.550.0249
Notes: The 2012 sample refers to 4165 (1004) native Jewish Israelis, whose native language is Hebrew (Jewish immigrants, whose native language is Russian). FEMALE equals 1 for females and 0 for males. For the semi-logarithmic model, p r o j B M I = exp ln p r o j B M I + 1 2 σ ^ 2 . The 95% confidence intervals are given in brackets. P-values are given in parentheses. * p < 0.1; ** p < 0.05; *** p < 0.01.
Table 7. Hebrew, Russian, and Amharic vs. Arabic.
(1)(2)(3)(4)(5)(6)
VARIABLESBMI2012ln(BMI))BMI(2012)ln(BMI))BMI(2012)ln(BMI)
Constant22.35 ***3.095 ***23.12 ***3.129 ***20.66 ***3.018 ***
(<0.0001)(<0.0001)(<0.0001)(<0.0001)(<0.0001)(<0.0001)
ARABIC5.929 ***0.224 ***5.161 ***0.191 ***7.615 ***0.302 ***
(1.69×10⁻⁶)(3.29×10⁻⁵)(1.45×10⁻⁴)(1.38×10⁻⁴)(5.46×10⁻⁷)(2.13×10⁻⁷)
(AGE-15)0.0929 ***0.00382 ***0.0929 ***0.00364 ***0.0979 **0.00454 ***
(<0.0001)(<0.0001)(<0.0001)(<0.0001)(0.0173)(0.00394)
ARABIC×-0.125 ***−0.00480 ***−0.125 ***−0.00462 ***−0.130 ***−0.00551 ***
(AGE-15)( 1.87 × 10 7 )( 3.05 × 10 7 )(2.36×10⁻⁶)(2.49×10⁻⁶)(0.00558)(0.00219)
Observation4452445212901290361361
R-squared0.1130.1240.1080.1200.1670.185
Notes: The base category in columns (1) and (2) ((3) and (4)) ((5) and (6)) is Hebrew (Russian) <Amharic>. The sample includes 4166 (1004) <75> Jewish persons whose native language is Hebrew (Russian) <Amharic> and 286 Jewish persons whose mother tongue is Arabic. Those languages include: Algerian, Libyan, Egyptian, Syrian, and Lebanese.

