A Derivation of Factors Influencing the Diffusion and Adoption of an Open Source Learning Platform


Abstract
1. Introduction
2. Literature Review
- Regarding EU, research has revealed that system quality [31,32,33] has a positive correlation on EU and PU [34]. There are several pre-selected advantages, including reducing unqualified suppliers from the final pre-selected list, reducing the time and effort of decision-makers to collect information and implement the methodology [31], and reducing unqualified suppliers in the selection phase. Thus, pre-selection should be systematic and transparent from both an effectiveness and efficiency perspective [35].
- In terms of TL, the demographic distribution used as a recommendation for the use of indicators is categorized into one indicator/question, especially two similar items, because of the respondents’ cognition and responses. When exploring OS, studies have also demonstrated that experienced users decide whether to use it based on their performance expectancy and website design quality [27]. Socialization positively influences attitude directly as well as the perceived degree of recognition received by users. Research results indicate that acceptance does not directly influence attitude; however, acceptance positively influences the perceived benefits of using this service. The perceived reciprocal benefits have been found to be a strong predictor of attitude toward the service. Indeed, attitude is a strong predictor of intention to continue using and recommend the service to other people [36].
- Chang et al. [22] found that computer self-efficacy is the most important variable affecting behavior when using online learning websites [22]. The level of computer self-efficacy is regarded as a fuzzy set, with the specific cutoffs for placement within a group (i.e., the boundary conditions) being indeterminate but contained [37]. Based on the different user goals (i.e., utilitarian or hedonic) included in the research, users with utilitarian goals value the quality of the services. In contrast, those with hedonic goals value the quality of interaction more [24]. However, when considering PU, it can be inferred from the findings that college students seem to be motivated to adopt new technologies due to social influence rather than the embedded utility-based functions [38]. Researchers studying ubiquitous learning (u-learning) provided participants with a mobile app to access the learning materials. The u-learning and blended learning, combined with an experimental laboratory, helped students improve their academic performance (e.g., Tsai et al. [39] and Manuel et al. [40]).
2.1. Open Innovation
2.2. E-Learning Platform and OSLP
2.3. IDT
2.4. TAM
2.5. Integration of TAM and IDT
3. Research Method
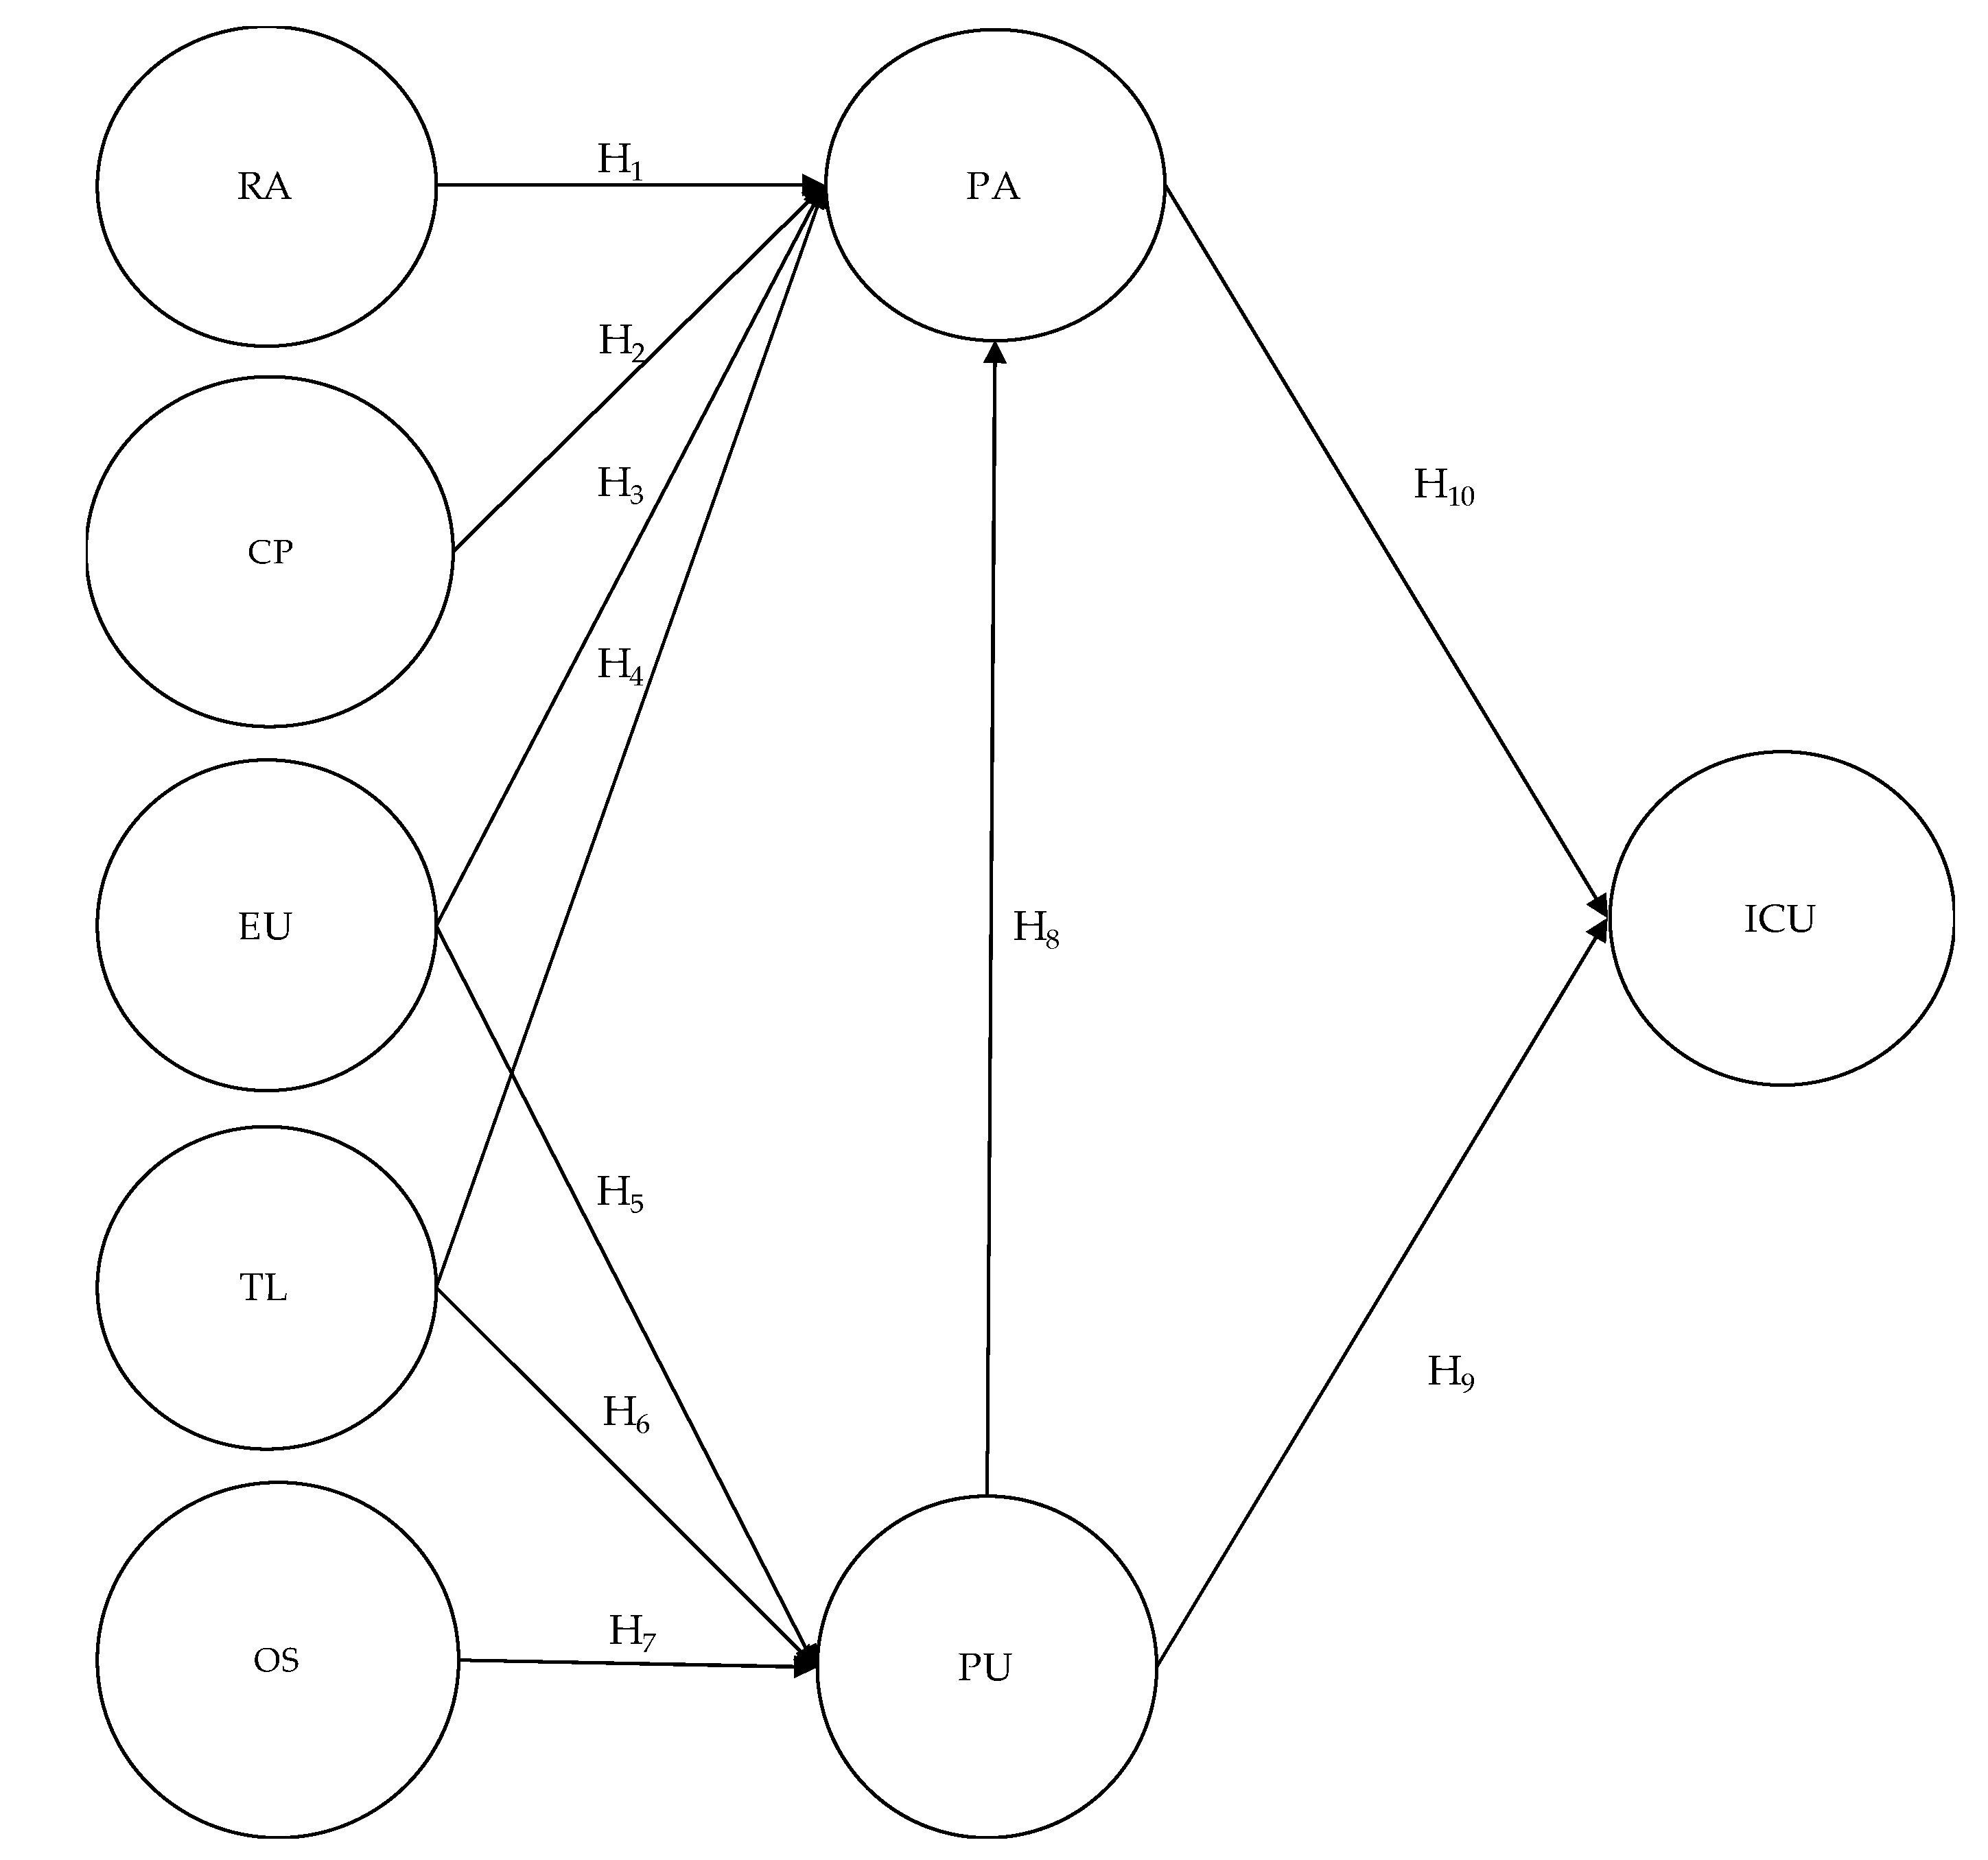
3.1. Research Hypotheses
3.2. PLS-SEM
3.3. Sample and Measures
4. Results
4.1. Measurement Model
4.2. Structural Model

| Latent Variables | Item Code | Descriptions | Source |
|---|---|---|---|
| Relative advantage (RA) | ra1 | OSLP is free of charge and allows me to learn at a lower cost. | Revised from Premkumar and Roberts [29], Moon and Kim [101], Liu and Li [102] |
| ra2 | The scale/granularity of OSLP provides various services to meet different kinds of needs. | ||
| ra3 | OSLP is excellent and suitable for frequent usage. | ||
| ra4 | The visualization techniques and symbolization of OSLP lets me communicate with others easily. | ||
| ra5 | OSLP lets me finish a job more quickly. | ||
| Compatibility (CP) | cp1 | OSLP is compatible with other systems/services I am using and consistent with my habits. | Revised from Chen, J. L. [103] |
| cp2 | OSLP is compatible with MOOC, SPOC, a flipped classroom, and other application scenarios. | ||
| cp3 | Using OSLP is compatible with all aspects of my learning [103]. | ||
| cp4 | Using OSLP is completely compatible with my current learning situation [103]. | ||
| cp5 | I think using OSLP fits well with the way I like to conduct learning activities [103]. | ||
| cp6 | Using OSLP fits into my learning style [103]. | ||
| Ease of use (EU) | eu1 | OSLP meets my own values. | Revised from Moon and Kim [101], Park and Chen [80], Liu and Li [102] |
| eu2 | OSLP is very consistent with my working model. | ||
| eu3 | OSLP is very consistent with needs at work. | ||
| eu4 | I believe OSLP data are guaranteed. | ||
| eu5 | I can use the OSLP system service anytime, anywhere. | ||
| eu6 | I believe OSLP is easy to use. | ||
| eu7 | I can understand the functions of OSLP and think it is not complex when using it, such as the procedures to contribute the data. | ||
| eu8 | It is easy for me to find the usage info or material of OSLP. | ||
| Trialability (TL) | tl1 | I can try any kind of function before using OSLP officially. | Revised from Park and Chen [80,81], Malek [104], Shih [105] |
| tl2 | I know how to try it out before using OSLP officially. | ||
| tl3 | I can quit it if I am not satisfied after trying OSLP. | ||
| tl4 | I can try the technology provided by the OSLP vendor to evaluate if it meets my work or research needs. | ||
| tl5 | I can accumulate useful experiences after trying the OSLP. | ||
| Observability (OS) | os1 | I have seen people around me using OSLP. | Revised from Park and Chen [80,81], Liu and Li [102], Shih [105] |
| os2 | It’s easy for me to find others sharing and discussing the usage of OSLP. | ||
| os3 | I can quickly feel that OSLP could bring me some benefits. | ||
| os4 | I have seen my coworkers or friends using OSLP. | ||
| os5 | I have seen the demonstrations and applications of OSLP. | ||
| Perceived attitude (PA) | pa1 | Overall, I believe it’s a good idea to adopt OSLP. | Revised from Moon and Kim [101], Park and Chen [80,81] |
| pa2 | Overall, I am positive about adopting OSLP. | ||
| pa3 | Overall, I support adopting OSLP | ||
| pa4 | I believe it’s very good to use OSLP at work. | ||
| pa5 | I like the OSLP technology | ||
| Perceived usefulness (PU) | pu1 | I can describe the possible benefits of using OSLP in work or life. | Revised from Premkumar and Roberts [29], Moon and Kim [101], Park and Chen [80,81], Tung et al. [77] |
| pu2 | I believe OSLP makes work or life more efficient. | ||
| pu3 | I believe OSLP can cut costs in work or life. | ||
| pu4 | I believe OSLP is helpful in work or life. | ||
| pu5 | Using OSLP may help improve my home work quickly. | ||
| pu6 | Using OSLP may help me learn easily | ||
| pu7 | OSLP is useful for my learning | ||
| Intention of continuous usage (ICU) | icu1 | I believe OSLP can make people use e-learning more frequently. | Revised from Moon and Kim [101], Liu and Li [102] |
| icu2 | I believe OSLP makes me more willing to use e-learning. | ||
| icu3 | I will increase the frequency of OSLP use. | ||
| icu4 | I will do more to understand the functions and user interface of OSLP. | ||
| icu5 | I will highly recommend OSLP to others. | ||
| icu6 | I look forward to using OSLP to meet the needs of work or life in the future. |
| Profile Category | Frequency | Percentage (%) |
|---|---|---|
| Gender | ||
| Female | 110 | 34.4% |
| Male | 210 | 65.6% |
| Age (years) | ||
| <18 | 2 | 0.6 |
| 18–22 | 284 | 88.8% |
| 23–26 | 24 | 7.5% |
| >26 | 10 | 3.1% |
| Education | ||
| Undergraduate (Day time) | 239 | 70.7% |
| Undergraduate (Evening) | 81 | 29.3% |
| Business | 122 | 38.1% |
| Engineering | 198 | 61.9% |
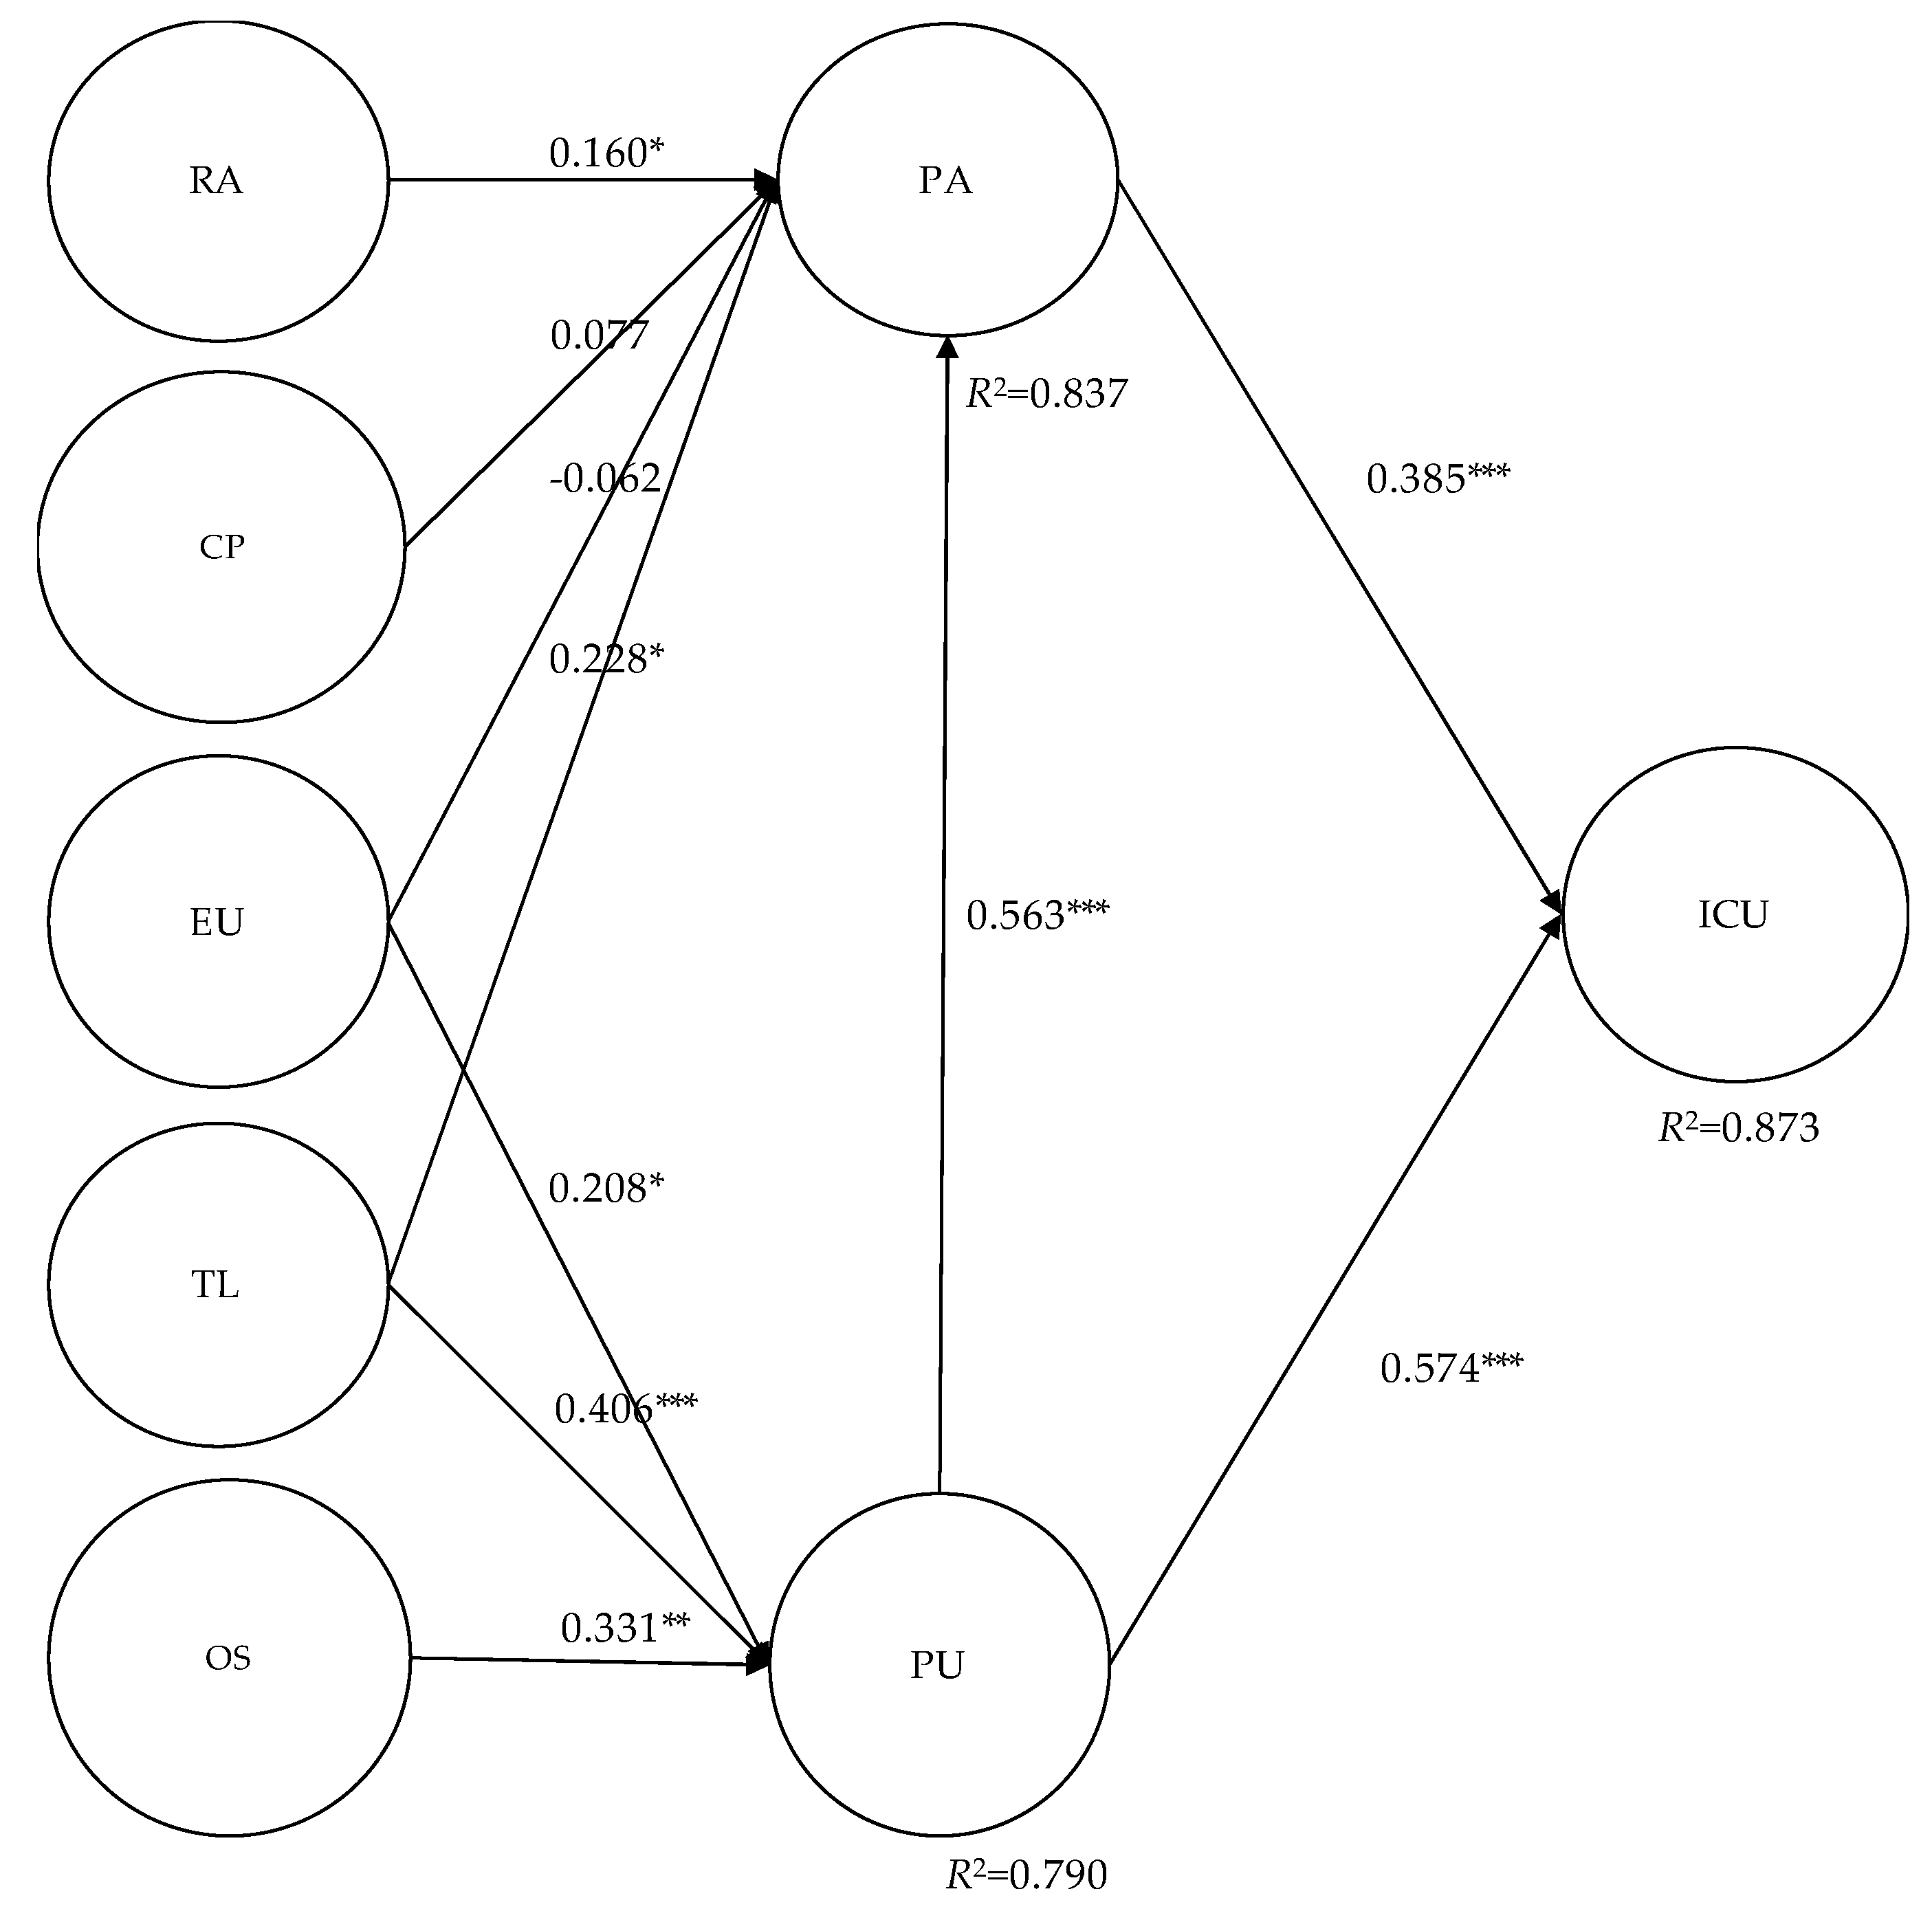
| Hypothesis | Sample Mean (M) | Std. Dev. (STDEV) | Path Coeff. (β) | t Statistics | p-Values | VIF |
|---|---|---|---|---|---|---|
| H1 (RA→PA) | 0.157 | 0.067 | 0.160 | 2.403 | 0.016 | 4.672 |
| H2 (CP→PA) | 0.087 | 0.065 | 0.077 | 1.180 | 0.238 | 4.309 |
| H3 (EU→PA) | −0.061 | 0.081 | −0.062 | 0.761 | 0.447 | 4.105 |
| H4 (TL→PA) | 0.229 | 0.115 | 0.228 | 1.981 | 0.048 | 4.774 |
| H5 (EU→PU) | 0.207 | 0.084 | 0.208 | 2.485 | 0.013 | 3.375 |
| H6 (TL→PU) | 0.411 | 0.094 | 0.406 | 4.314 | 0.000 | 4.204 |
| H7 (OS→PU) | 0.328 | 0.106 | 0.331 | 3.134 | 0.002 | 3.697 |
| H8 (PU→PA) | 0.556 | 0.094 | 0.563 | 6.018 | 0.000 | 4.456 |
| H9 (PU→ICU) | 0.386 | 0.061 | 0.574 | 6.358 | 0.000 | 4.956 |
| H10 (PA→ICU) | 0.574 | 0.060 | 0.385 | 9.555 | 0.000 | 4.956 |
4.3. Hypotheses Test Results
5. Discussion
5.1. Discussion of Non-Significant Hypotheses
5.1.1. The Perspective of H2 (CP→PA)
5.1.2. The Perspective of H3 (EU→PA)
5.2. Discussion of Significant Hypotheses Supported by the Empirical Study Results
5.2.1. The Perspective of H1 (RA→PA)
5.2.2. The Perspective of H4 (TL→PA)
5.2.3. The Perspective of H5 (EU→PU)
5.2.4. The Perspective of H6 (TL→PU)
5.2.5. The Perspective of H7 (OS→PU)
5.2.6. The Perspective of H8 (PU→PA)
5.2.7. The Perspective of H9 (PU→ICU)
5.2.8. The Perspective of H10 (PA→ICU)
5.3. Limitations and Possibilities for Future Study
5.3.1. Non-Significant Hypotheses
5.3.2. Cross Country Analysis of Factors Influencing OSLP Adoption
5.3.3. OSLP Adoption in Educational and Other Fields
6. Conclusions
Author Contributions
Funding
Conflicts of Interest
Appendix A
| Variable | Mean | Median | Min | Max | Standard Deviation | Excess Kurtosis | Skewness |
|---|---|---|---|---|---|---|---|
| ra1 | 3.944 | 4.000 | 2.000 | 5.000 | 0.785 | −1.105 | −0.018 |
| ra2 | 3.816 | 4.000 | 2.000 | 5.000 | 0.750 | −0.868 | 0.139 |
| ra3 | 3.725 | 4.000 | 1.000 | 5.000 | 0.829 | 0.152 | −0.210 |
| ra4 | 3.728 | 4.000 | 1.000 | 5.000 | 0.793 | −0.225 | −0.002 |
| cp1 | 3.722 | 4.000 | 1.000 | 5.000 | 0.795 | 0.390 | −0.208 |
| cp2 | 3.647 | 4.000 | 1.000 | 5.000 | 0.812 | −0.061 | 0.028 |
| cp3 | 3.684 | 4.000 | 1.000 | 5.000 | 0.801 | −0.176 | −0.029 |
| cp4 | 3.731 | 4.000 | 1.000 | 5.000 | 0.808 | 0.306 | −0.222 |
| eu1 | 3.825 | 4.000 | 1.000 | 5.000 | 0.810 | 0.738 | −0.448 |
| eu2 | 3.781 | 4.000 | 1.000 | 5.000 | 0.772 | −0.287 | −0.092 |
| eu3 | 3.700 | 4.000 | 1.000 | 5.000 | 0.785 | −0.104 | −0.038 |
| icu1 | 3.656 | 4.000 | 1.000 | 5.000 | 0.863 | 0.286 | −0.271 |
| icu2 | 3.678 | 4.000 | 1.000 | 5.000 | 0.810 | 0.260 | −0.164 |
| icu3 | 3.663 | 4.000 | 1.000 | 5.000 | 0.825 | 0.150 | −0.142 |
| icu4 | 3.691 | 4.000 | 1.000 | 5.000 | 0.811 | 0.238 | −0.155 |
| icu5 | 3.663 | 4.000 | 1.000 | 5.000 | 0.854 | 0.482 | −0.258 |
| icu6 | 3.669 | 4.000 | 1.000 | 5.000 | 0.842 | 0.583 | −0.257 |
| os1 | 3.819 | 4.000 | 1.000 | 5.000 | 0.839 | 0.590 | −0.507 |
| os2 | 3.650 | 4.000 | 1.000 | 5.000 | 0.842 | 0.224 | −0.180 |
| os3 | 3.675 | 4.000 | 1.000 | 5.000 | 0.822 | 0.391 | −0.216 |
| os4 | 3.862 | 4.000 | 1.000 | 5.000 | 0.818 | 0.160 | −0.361 |
| os5 | 3.684 | 4.000 | 1.000 | 5.000 | 0.812 | 0.214 | −0.135 |
| pa1 | 3.697 | 4.000 | 1.000 | 5.000 | 0.821 | 0.149 | −0.136 |
| pa2 | 3.709 | 4.000 | 1.000 | 5.000 | 0.810 | 0.782 | −0.343 |
| pa3 | 3.700 | 4.000 | 1.000 | 5.000 | 0.809 | 0.313 | −0.220 |
| pu1 | 3.737 | 4.000 | 1.000 | 5.000 | 0.825 | 0.454 | −0.316 |
| pu2 | 3.706 | 4.000 | 1.000 | 5.000 | 0.807 | 0.523 | −0.240 |
| pu3 | 3.744 | 4.000 | 1.000 | 5.000 | 0.846 | 0.272 | −0.293 |
| pu4 | 3.694 | 4.000 | 1.000 | 5.000 | 0.840 | 0.505 | −0.324 |
| pu5 | 3.716 | 4.000 | 1.000 | 5.000 | 0.827 | 0.380 | −0.259 |
| tl1 | 3.763 | 4.000 | 1.000 | 5.000 | 0.787 | 0.483 | −0.250 |
| tl2 | 3.741 | 4.000 | 1.000 | 5.000 | 0.821 | 0.518 | −0.340 |
| tl3 | 3.744 | 4.000 | 1.000 | 5.000 | 0.812 | 0.591 | −0.343 |
| tl4 | 3.678 | 4.000 | 1.000 | 5.000 | 0.802 | 0.122 | −0.156 |
| Latent Variables | Items | Factor Loading | Cronbach’s Alpha | Dijkstra-Henseler’s Rho | CR | AVE | Redundancy |
|---|---|---|---|---|---|---|---|
| RA | 0.915 | 0.920 | 0.940 | 0.797 | N.A. | ||
| ra1 | 0.846 | ||||||
| ra2 | 0.910 | ||||||
| ra3 | 0.897 | ||||||
| ra4 | 0.917 | ||||||
| CP | 0.943 | 0.944 | 0.959 | 0.853 | N.A. | ||
| cp1 | 0.916 | ||||||
| cp2 | 0.942 | ||||||
| cp3 | 0.925 | ||||||
| cp4 | 0.912 | ||||||
| EU | 0.917 | 0.917 | 0.948 | 0.858 | N.A. | ||
| eu1 | 0.927 | ||||||
| eu2 | 0.939 | ||||||
| eu3 | 0.912 | ||||||
| TL | 0.913 | 0.914 | 0.939 | 0.793 | N.A. | ||
| tl1 | 0.917 | ||||||
| tl2 | 0.903 | ||||||
| tl3 | 0.873 | ||||||
| tl4 | 0.867 | ||||||
| OS | 0.933 | 0.935 | 0.949 | 0.789 | N.A. | ||
| os1 | 0.873 | ||||||
| os2 | 0.919 | ||||||
| os3 | 0.916 | ||||||
| os4 | 0.857 | ||||||
| os5 | 0.874 | ||||||
| PA | 0.936 | 0.937 | 0.959 | 0.887 | 0.658 | ||
| pa1 | 0.933 | ||||||
| pa2 | 0.944 | ||||||
| pa3 | 0.984 | ||||||
| PU | 0.953 | 0.953 | 0.964 | 0.842 | 0.697 | ||
| pu1 | 0.889 | ||||||
| pu2 | 0.915 | ||||||
| pu3 | 0.922 | ||||||
| pu4 | 0.931 | ||||||
| pu5 | 0.930 | ||||||
| ICU | 0.954 | 0.954 | 0.963 | 0.812 | 0.619 | ||
| icu1 | 0.900 | ||||||
| icu2 | 0.922 | ||||||
| icu3 | 0.914 | ||||||
| icu4 | 0.900 | ||||||
| icu5 | 0.903 | ||||||
| icu1 | 0.900 |
| Latent Variables | RA | CP | EU | ICU | OS | PA | PU | TL |
|---|---|---|---|---|---|---|---|---|
| RA | 0.893 | |||||||
| CP | 0.850 | 0.924 | ||||||
| EU | 0.787 | 0.796 | 0.926 | |||||
| ICU | 0.768 | 0.753 | 0.760 | 0.901 | ||||
| OS | 0.773 | 0.747 | 0.788 | 0.846 | 0.888 | |||
| PA | 0.802 | 0.765 | 0.764 | 0.898 | 0.867 | 0.942 | ||
| PU | 0.787 | 0.759 | 0.801 | 0.918 | 0.834 | 0.893 | 0.918 | |
| TL | 0.795 | 0.759 | 0.816 | 0.818 | 0.834 | 0.844 | 0.853 | 0.890 |
| RA | CP | EU | ICU | OS | PA | PU | TL | |
|---|---|---|---|---|---|---|---|---|
| ra1 | 0.846 | 0.653 | 0.658 | 0.586 | 0.630 | 0.642 | 0.619 | 0.642 |
| ra2 | 0.910 | 0.733 | 0.697 | 0.673 | 0.678 | 0.726 | 0.689 | 0.698 |
| ra3 | 0.897 | 0.804 | 0.700 | 0.718 | 0.703 | 0.711 | 0.715 | 0.734 |
| ra4 | 0.917 | 0.833 | 0.750 | 0.753 | 0.742 | 0.777 | 0.776 | 0.758 |
| cp1 | 0.785 | 0.916 | 0.728 | 0.657 | 0.671 | 0.671 | 0.667 | 0.666 |
| cp2 | 0.796 | 0.942 | 0.751 | 0.698 | 0.702 | 0.708 | 0.694 | 0.730 |
| cp3 | 0.785 | 0.925 | 0.703 | 0.692 | 0.664 | 0.700 | 0.693 | 0.699 |
| cp4 | 0.775 | 0.912 | 0.756 | 0.731 | 0.721 | 0.744 | 0.745 | 0.707 |
| eu1 | 0.739 | 0.732 | 0.927 | 0.681 | 0.725 | 0.700 | 0.721 | 0.732 |
| eu2 | 0.723 | 0.738 | 0.939 | 0.716 | 0.758 | 0.706 | 0.754 | 0.775 |
| eu3 | 0.724 | 0.740 | 0.912 | 0.714 | 0.705 | 0.715 | 0.750 | 0.759 |
| tl1 | 0.672 | 0.662 | 0.680 | 0.900 | 0.767 | 0.810 | 0.813 | 0.733 |
| tl2 | 0.731 | 0.713 | 0.728 | 0.922 | 0.818 | 0.857 | 0.829 | 0.765 |
| tl3 | 0.700 | 0.704 | 0.725 | 0.914 | 0.757 | 0.805 | 0.852 | 0.752 |
| tl4 | 0.720 | 0.689 | 0.672 | 0.900 | 0.775 | 0.858 | 0.844 | 0.803 |
| os1 | 0.673 | 0.652 | 0.672 | 0.903 | 0.738 | 0.750 | 0.812 | 0.691 |
| os2 | 0.650 | 0.646 | 0.628 | 0.866 | 0.712 | 0.769 | 0.811 | 0.671 |
| os3 | 0.610 | 0.578 | 0.649 | 0.699 | 0.873 | 0.704 | 0.676 | 0.691 |
| os4 | 0.718 | 0.676 | 0.687 | 0.771 | 0.919 | 0.801 | 0.741 | 0.754 |
| os5 | 0.719 | 0.693 | 0.720 | 0.819 | 0.916 | 0.821 | 0.791 | 0.769 |
| pa1 | 0.682 | 0.646 | 0.692 | 0.692 | 0.857 | 0.729 | 0.708 | 0.713 |
| pa2 | 0.695 | 0.714 | 0.743 | 0.763 | 0.874 | 0.785 | 0.779 | 0.768 |
| pa3 | 0.763 | 0.728 | 0.689 | 0.830 | 0.811 | 0.933 | 0.814 | 0.786 |
| pu1 | 0.765 | 0.711 | 0.737 | 0.867 | 0.834 | 0.944 | 0.865 | 0.805 |
| pu2 | 0.738 | 0.723 | 0.731 | 0.839 | 0.804 | 0.948 | 0.844 | 0.795 |
| pu3 | 0.725 | 0.684 | 0.712 | 0.821 | 0.756 | 0.805 | 0.889 | 0.795 |
| pu4 | 0.725 | 0.706 | 0.717 | 0.854 | 0.761 | 0.855 | 0.915 | 0.777 |
| pu5 | 0.698 | 0.692 | 0.764 | 0.812 | 0.756 | 0.806 | 0.922 | 0.779 |
| icu1 | 0.730 | 0.713 | 0.766 | 0.848 | 0.783 | 0.807 | 0.931 | 0.794 |
| icu2 | 0.731 | 0.686 | 0.717 | 0.875 | 0.771 | 0.825 | 0.930 | 0.768 |
| icu3 | 0.741 | 0.697 | 0.748 | 0.735 | 0.765 | 0.787 | 0.779 | 0.917 |
| icu4 | 0.698 | 0.660 | 0.741 | 0.706 | 0.715 | 0.731 | 0.721 | 0.903 |
| icu5 | 0.675 | 0.644 | 0.715 | 0.672 | 0.726 | 0.705 | 0.742 | 0.873 |
| icu6 | 0.713 | 0.697 | 0.702 | 0.793 | 0.760 | 0.778 | 0.790 | 0.867 |
References
- Daradoumis, T.; Bassi, R.; Xhafa, F.; Caballé, S. A review on massive e-learning (mooc) design, delivery and assessment. In Proceedings of the 2013 Eighth International Conference on P2P, Parallel, Grid, Cloud and Internet Computing, Compiegne, France, 28–30 October 2013. [Google Scholar]
- Kravari, K.; Bassiliades, N. A survey of agent platforms. J. Artif. Soc. Soc. Simul. 2015, 18, 11. [Google Scholar] [CrossRef]
- Alharbi, S.; Drew, S. Using the technology acceptance model in understanding academics’ behavioural intention to use learning management systems. Int. J. Adv. Comput. Sci. Appl. 2014, 5, 143–155. [Google Scholar]
- Paulsen, M.F. Online education systems: Discussion and definition of terms. NKI Distance Educ. 2002, 202, 1–8. [Google Scholar]
- The Moodle Project. Moodle docs 3.9. Available online: https://docs.moodle.org/39/en/Main_page (accessed on 9 June 2020).
- Luk, C.H.; Ng, K.K.; Lam, W.M. The Acceptance of Using Open-Source Learning platform (Moodle) for Learning in Hong Kong’s Higher Education. In International Conference on Technology in Education, Proceedings of the ICTE: International Conference on Technology in Education, Hong Kong, China, 9–11 January 2018; Cheung, S.K.S., Lam, J., Li, K.C., Au, O., Ma, W.K.W., Ho, W.S., Eds.; Springer: Berlin/Heidelberg, Germany, 2018. [Google Scholar]
- Sarrab, M.; Elbasir, M.; Alnaeli, S. Towards a quality model of technical aspects for mobile learning services: An empirical investigation. Comput. Hum. Behav. 2016, 55, 100–112. [Google Scholar] [CrossRef]
- Durana, P.; Valaskova, K.; Vagner, L.; Zadnanova, S.; Podhorska, I.; Siekelova, A. Disclosure of strategic managers’ factotum: Behavioral incentives of innovative business. Int. J. Fin. Stud. 2020, 8, 17. [Google Scholar] [CrossRef]
- Rogers, E.M. Diffusion of Innovations, 4th ed.; Simon and Schuster: New York, NY, USA, 2010; pp. 1–519. [Google Scholar]
- Moore, G.C.; Benbasat, I. Development of an instrument to measure the perceptions of adopting an information technology innovation. Inf. Syst. Res. 1991, 2, 192–222. [Google Scholar] [CrossRef]
- Davis, F.D. A Technology Acceptance Model. for Empirically Testing New End-User Information Systems: Theory and Results. Ph.D. Thesis, Sloan School of Management, Massachusetts Institute of Technology, Cambridge, MA, USA, 1985. [Google Scholar]
- Lee, Y.; Kozar, K.A.; Larsen, K.R. The technology acceptance model: Past, present, and future. Commun. Assoc. Inf. Syst. 2003, 12, 752–780. [Google Scholar] [CrossRef]
- Pattanayak, D.; Koilakuntla, M.; Punyatoya, P. Investigating the influence of TQM, service quality and market orientation on customer satisfaction and loyalty in the indian banking sector. Int. J. Qual. Rel. Mgt. 2017, 34, 362–377. [Google Scholar] [CrossRef]
- Durana, P.; Zauskova, A.; Vagner, L.; Zadnanova, S. Earnings drivers of Slovak manufacturers: Efficiency assessment of innovation management. Appl. Sci. 2020, 10, 4251. [Google Scholar] [CrossRef]
- Ringle, C.M.; Wende, S.; Becker, J.M. Smartpls 3. Bönningstedt: SmartPLS. Available online: http://www.smartpls.com (accessed on 31 July 2020).
- Bonardi, J.P.; Durand, R. Managing network effects in high-tech markets. Acad. Manag. Perspect. 2003, 17, 40–52. [Google Scholar] [CrossRef]
- Boudreau, K.J.; Jeppesen, L.B. Unpaid crowd complementors: The platform network effect mirage. Strateg. Manag. J. 2015, 36, 1761–1777. [Google Scholar] [CrossRef]
- Yoffie, D.B.; Kwak, M. With friends like these: The art of managing complementors. Harv. Bus. Rev. 2006, 84, 88–98. [Google Scholar] [PubMed]
- Goldie, J.G.S. Connectivism: A knowledge learning theory for the digital age? Med. Teach. 2016, 38, 1064–1069. [Google Scholar] [CrossRef] [PubMed]
- Mante-Meijer, E.; Haddon, L.; Concejero, P.; Klamer, L.; Heres, J.; Ling, R.; Thomas, F.; Smoreda, Z.; Vrieling, I. Checking it Out with the People–ICT Markets and Users in Europe; EURESCOM: Heidelberg, Germany, 2001. [Google Scholar]
- Potkonjak, V.; Gardner, M.; Callaghan, V.; Mattila, P.; Guetl, C.; Petrović, V.M. and Jovanović, K. Virtual laboratories for education in science, technology, and engineering: A review. Comput Educ 2016, 95, 309–327. [Google Scholar] [CrossRef]
- Chang, S.C.; Tung, F.C. An empirical investigation of students’ behavioural intentions to use the online learning course websites. Br. J. Educ. Technol. 2008, 39, 71–83. [Google Scholar] [CrossRef]
- Kuo, Y.F.; Yen, S.N. Towards an understanding of the behavioral intention to use 3G mobile value-added services. Comput. Hum. Behav. 2009, 25, 103–110. [Google Scholar] [CrossRef]
- Chae, M.; Kim, J.; Kim, H.; Ryu, H. Information quality for mobile internet services: A theoretical model with empirical validation. Electron. Mark. 2002, 12, 38–46. [Google Scholar] [CrossRef]
- Lien, C.H.; Wen, M.J.; Huang, L.C.; Wu, K.L. Online hotel booking: The effects of brand image, price, trust and value on purchase intentions. Asia Pac. Manag. Rev. 2015, 20, 210–218. [Google Scholar]
- Mohammadyari, S.; Singh, H. Understanding the effect of e-learning on individual performance: The role of digital literacy. Comput. Educ. 2015, 82, 11–25. [Google Scholar] [CrossRef]
- Al-Qeisi, K.; Dennis, C.; Alamanos, E.; Jayawardhena, C. Website design quality and usage behavior: Unified theory of acceptance and use of technology. J. Bus. Res. 2014, 67, 2282–2290. [Google Scholar] [CrossRef]
- Oh, S.; Ahn, J.; Kim, B. Adoption of broadband internet in Korea: The role of experience in building attitudes. J. Inf. Technol. 2003, 18, 267–280. [Google Scholar] [CrossRef]
- Premkumar, G.; Roberts, M. Adoption of new information technologies in rural small businesses. Omega 1999, 27, 467–484. [Google Scholar] [CrossRef]
- Venkatesh, V.; Bala, H. Technology acceptance model 3 and a research agenda on interventions. Decis. Sci. 2008, 39, 273–315. [Google Scholar] [CrossRef]
- Gefen, D.; Rigdon, E.E.; Straub, D. Editor’s comments: An update and extension to SEM guidelines for administrative and social science research. Manag. Inf. Syst. Q. 2011, 35, 3–4. [Google Scholar] [CrossRef]
- Hair Jr, J.F.; Hult, G.T.M.; Ringle, C.; Sarstedt, M. A Primer on Partial Least Squares Structural Equation Modeling (PLS-SEM), 2nd ed.; Sage Publications: Thousand Oaks, CA, USA, 2017. [Google Scholar]
- Ringle, C.M.; Sarstedt, M.; Straub, D. Editor’s comments: A critical look at the use of PLS-SEM in "mis quarterly". Manag. Inf. Syst. Q. 2012, 36, 3–4. [Google Scholar] [CrossRef]
- Fathema, N.; Shannon, D.; Ross, M. Expanding the technology acceptance model (TAM) to examine faculty use of learning management systems (LMSS) in higher education institutions. J. Online Learn. Teach. 2015, 11, 210–232. [Google Scholar]
- Rezaei, J.; Nispeling, T.; Sarkis, J.; Tavasszy, L. A supplier selection life cycle approach integrating traditional and environmental criteria using the best worst method. J. Clean. Prod. 2016, 135, 577–588. [Google Scholar] [CrossRef]
- Hamari, J.; Koivisto, J. Social motivations to use gamification: An empirical study of gamifying exercise. In Proceedings of the 21st European Conference on Information Systems, Utrecht, The Netherlands, 6–8 June 2013. [Google Scholar]
- Scott, J.E.; Walczak, S. Cognitive engagement with a multimedia ERP training tool: Assessing computer self-efficacy and technology acceptance. Inform. Manag. 2009, 46, 221–232. [Google Scholar] [CrossRef]
- Kim, D.; Chun, H.; Lee, H. Determining the factors that influence college students’ adoption of smartphones. J. Assoc. Inf. Sci. Technol. 2014, 65, 578–588. [Google Scholar] [CrossRef]
- Tsai, C.W.; Shen, P.D.; Tsai, M.C.; Chen, W.Y. Exploring the effects of web-mediated computational thinking on developing students’ computing skills in a ubiquitous learning environment. Interact. Learn. Environ. 2017, 25, 762–777. [Google Scholar] [CrossRef]
- Manuel, P.M.; Pilar, A.M.; Dolores, R.M.M.; Dorado, M.; Sara, P.; Pilar, M.J.M. Characterization of biodiesel using virtual laboratories integrating social networks and web app following a ubiquitous-and blended-learning. J. Clean. Prod. 2019, 215, 399–409. [Google Scholar] [CrossRef]
- Conrad, C.; Poole, M.S. Strategic Organizational Communication: In a Global Economy, 7th ed.; John Wiley & Sons: West Sussex, UK, 2012. [Google Scholar]
- Mayntz, R.; Hughes, T. The Development of Large Technical Systems; Routledge: New York, NY, USA, 2019. [Google Scholar]
- Hwang, G.J.; Lai, C.L.; Liang, J.C.; Chu, H.C.; Tsai, C.C. A long-term experiment to investigate the relationships between high school students’ perceptions of mobile learning and peer interaction and higher-order thinking tendencies. Educ. Technol. Res. Dev. 2018, 66, 75–93. [Google Scholar] [CrossRef]
- Bhattacherjee, A. Understanding information systems continuance: An expectation-confirmation model. Manag. Inf. Syst. Q. 2001, 25, 351–370. [Google Scholar] [CrossRef]
- Davis, F.D. Perceived usefulness, perceived ease of use, and user acceptance of information technology. Manag. Inf. Syst. Q. 1989, 13, 319–340. [Google Scholar] [CrossRef]
- Fishbein, M.; Ajzen, I. Belief, Attitude, Intention, and Behavior: An Introduction to Theory and Research; Addison-Wesley: Reading, MA, USA, 1977. [Google Scholar]
- Yan, Z. Encyclopedia of Cyber Behavior; IGI Global: Hershey, PA, USA, 2012. [Google Scholar]
- Torres-Coronas, T. Social E-Enterprise: Value Creation through ICT: Value Creation through ICT; Information Science Reference: Hershey, PA, USA, 2012. [Google Scholar]
- Chesbrough, H.; Vanhaverbeke, W.; West, J. Open Innovation: Researching a New Paradigm; Oxford University Press: Oxford, UK, 2006. [Google Scholar]
- Bogers, M.; Zobel, A.K.; Afuah, A.; Almirall, E.; Brunswicker, S.; Dahlander, L.; Frederiksen, L.; Gawer, A.; Gruber, M.; Haefliger, S.J.I.; et al. The open innovation research landscape: Established perspectives and emerging themes across different levels of analysis. Ind. Innov. 2017, 24, 8–40. [Google Scholar] [CrossRef]
- Bogers, M.; Afuah, A.; Bastian, B. Users as innovators: A review, critique, and future research directions. J. Manag. 2010, 36, 857–875. [Google Scholar] [CrossRef]
- Piller, F.; West, J. Firms, users, and innovation. New Front. Open Innov. 2014, 29, 29–49. [Google Scholar]
- Fleming, L.; Waguespack, D.M. Brokerage, boundary spanning, and leadership in open innovation communities. Organ. Sci. 2007, 18, 165–180. [Google Scholar] [CrossRef]
- West, J.; Lakhani, K.R. Getting clear about communities in open innovation. Ind. Innov. 2008, 15, 223–231. [Google Scholar] [CrossRef]
- Saebi, T.; Foss, N.J. Business models for open innovation: Matching heterogeneous open innovation strategies with business model dimensions. Eur. Manag. J. 2015, 33, 201–213. [Google Scholar] [CrossRef]
- Han, K.; Oh, W.; Im, K.S.; Chang, R.M.; Oh, H.; Pinsonneault, A. Value cocreation and wealth spillover in open innovation alliances. Manag. Inf. Syst. Q. 2012, 36, 291–315. [Google Scholar] [CrossRef]
- Kozaris, I.A. Platforms for e-learning. Anal. Bioanal. Chem. 2010, 397, 893–898. [Google Scholar] [CrossRef] [PubMed]
- Boggs, S.; Shore, M.; Shore, J. Using e-learning platforms for mastery learning in developmental mathematics courses. Math. Comp. Edu. 2004, 38, 213. [Google Scholar]
- Traylor, R.L.; Heer, D.; Fiez, T.S. Using an integrated platform for learning/spl trade/to reinvent engineering education. IEEE Trans. Educ. 2003, 46, 409–419. [Google Scholar] [CrossRef]
- Othman, C.N.; Bakar, M.S.N.A.; Muda, M.R.; Farooqui, M.; Muhsain, S.N.F. Development of a One Stop Distance Virtual Learning (DVL) Program for Diploma of Pharmacy Students During Hospital Attachment. In Envisioning the Future of Online Learning; Springer: Singapore, 2016; pp. 433–445. [Google Scholar]
- Ahn, J.Y.; Edwin, A. An e-learning model for teaching mathematics on an open source learning platform. Int. Rev. Res. Open Distrib. Learn. 2018, 19, 255–267. [Google Scholar] [CrossRef]
- Matotek, J. Using Moodle in Teaching Mathematics in Croatian Education System. In Higher Goals in Mathematics Education; Kolar-Begovic, Z., Kolar-Super, R., Eds.; Element: Zagreb, Croatia, 2015; pp. 130–140. [Google Scholar]
- Claudy, M.C.; Garcia, R.; O’Driscoll, A. Consumer resistance to innovation—A behavioral reasoning perspective. J. Acad. Mark. Sci. 2015, 43, 528–544. [Google Scholar] [CrossRef]
- Shiau, W.L.; Chau, P.Y. Understanding behavioral intention to use a cloud computing classroom: A multiple model comparison approach. Inf. Manag. 2016, 53, 355–365. [Google Scholar] [CrossRef]
- Zhang, X.; Yu, P.; Yan, J.; Spil, I.T.A. Using diffusion of innovation theory to understand the factors impacting patient acceptance and use of consumer e-health innovations: A case study in a primary care clinic. BMC Health Serv. Res. 2015, 15, 71. [Google Scholar] [CrossRef]
- Taherdoost, H. A review of technology acceptance and adoption models and theories. Procedia Manuf. 2018, 22, 960–967. [Google Scholar] [CrossRef]
- Wang, X.; Yuen, K.F.; Wong, Y.D.; Teo, C.C. An innovation diffusion perspective of e-consumers’ initial adoption of self-collection service via automated parcel station. Int. J. Logist. Manag. 2018, 29, 237–260. [Google Scholar] [CrossRef]
- Agarwal, R.; Prasad, J. The role of innovation characteristics and perceived voluntariness in the acceptance of information technologies. Decis. Sci. 1997, 28, 557–582. [Google Scholar] [CrossRef]
- Davis, F.D.; Bagozzi, R.P.; Warshaw, P.R. User acceptance of computer technology: A comparison of two theoretical models. Manag. Sci. 1989, 35, 982–1003. [Google Scholar] [CrossRef]
- Agag, G.; El-Masry, A.A. Understanding consumer intention to participate in online travel community and effects on consumer intention to purchase travel online and WOM: An integration of innovation diffusion theory and tam with trust. Comput. Hum. Behav. 2016, 60, 97–111. [Google Scholar] [CrossRef]
- Scherer, R.; Siddiq, F.; Tondeur, J. The technology acceptance model (TAM): A meta-analytic structural equation modeling approach to explaining teachers’ adoption of digital technology in education. Comput. Educ. 2019, 128, 13–35. [Google Scholar] [CrossRef]
- Marangunić, N.; Granić, A. Technology acceptance model: A literature review from 1986 to 2013. Univ. Access Inf. Soc. 2015, 14, 81–95. [Google Scholar] [CrossRef]
- Legris, P.; Ingham, J.; Collerette, P. Why do people use information technology? A critical review of the technology acceptance model. Inf. Manag. 2003, 40, 191–204. [Google Scholar] [CrossRef]
- King, W.R.; He, J. A meta-analysis of the technology acceptance model. Inform. Manag. 2006, 43, 740–755. [Google Scholar] [CrossRef]
- Sharp, J.H. Development, extension, and application: A review of the technology acceptance model. Inf. Syst. Educ. J. 2006, 5, 3–11. [Google Scholar]
- Shiau, S.J.H.; Huang, C.Y.; Yang, C.L.; Juang, J.N. A derivation of factors influencing the innovation diffusion of the OpenStreetMap in STEM education. Sustainability 2018, 10, 1–29. [Google Scholar] [CrossRef]
- Tung, F.C.; Chang, S.C.; Chou, C.M. An extension of trust and TAM model with IDT in the adoption of the electronic logistics information system in his in the medical industry. Int. J. Med. Inform. 2008, 77, 324–335. [Google Scholar] [CrossRef]
- De Sousa Monteiro, B.; Gomes, A.S.; Neto, F.M.M. Youubi: Open software for ubiquitous learning. Comput. Hum. Behav. 2016, 55, 1145–1164. [Google Scholar] [CrossRef]
- Shaikh, A.A.; Karjaluoto, H. Mobile banking adoption: A literature review. Telemat. Inform. 2015, 32, 129–142. [Google Scholar] [CrossRef]
- Park, Y.; Chen, J.V. Acceptance and adoption of the innovative use of smartphone. Ind. Manag. Data Syst. 2007, 107, 1349–1365. [Google Scholar] [CrossRef]
- Al-Hujran, O.; Al-Debei, M.M.; Chatfield, A.; Migdadi, M. The imperative of influencing citizen attitude toward e-government adoption and use. Comput. Hum. Behav. 2015, 53, 189–203. [Google Scholar] [CrossRef]
- Nor, K.M.; Pearson, J.M. The influence of trust on internet banking acceptance. J. Internet Bank. Commer. 2015, 12, 1–10. [Google Scholar]
- Abdullah, F.; Ward, R.; Ahmed, E. Investigating the influence of the most commonly used external variables of tam on students’ perceived ease of use (PEOU) and perceived usefulness (PU) of e-portfolios. Comput. Hum. Behav. 2016, 63, 75–90. [Google Scholar] [CrossRef]
- Sánchez-Prieto, J.C.; Olmos-Migueláñez, S.; García-Peñalvo, F.J. MLearning and pre-service teachers: An assessment of the behavioral intention using an expanded TAM model. Comput. Hum. Behav. 2017, 72, 644–654. [Google Scholar]
- Lee, Y.H.; Hsieh, Y.C.; Hsu, C.N. Adding innovation diffusion theory to the technology acceptance model: Supporting employees’ intentions to use e-learning systems. J. Educ. Technol. 2011, 14, 124–137. [Google Scholar]
- Chen, J.V.; Yen, D.C.; Chen, K. The acceptance and diffusion of the innovative smart phone use: A case study of a delivery service company in logistics. Inf. Manag. 2009, 46, 241–248. [Google Scholar] [CrossRef]
- Ali, F.; Rasoolimanesh, S.M.; Sarstedt, M.; Ringle, C.M.; Ryu, K. An assessment of the use of partial least squares structural equation modeling (PLS-SEM) in hospitality research. Int. J. Contemp. Hosp. Manag. 2018, 30, 514–538. [Google Scholar] [CrossRef]
- Hair, J.F.; Risher, J.J.; Sarstedt, M.; Ringle, C.M. When to use and how to report the results of PLS-SEM. Eur. Bus. Rev. 2019, 31, 2–24. [Google Scholar] [CrossRef]
- Seluakumaran, K.; Jusof, F.F.; Ismail, R.; Husain, R. Integrating an open-source course management system (Moodle) into the teaching of a first-year medical physiology course: A case study. Adv. Physiol. Educ. 2011, 35, 369–377. [Google Scholar] [CrossRef] [PubMed]
- Kock, N.; Hadaya, P. Minimum sample size estimation in PLS-SEM: The inverse square root and gamma-exponential methods. Inf. Syst. J. 2018, 28, 227–261. [Google Scholar] [CrossRef]
- Faul, F.; Erdfelder, E.; Buchner, A.; Lang, A.G. Statistical power analyses using g* power 3.1: Tests for correlation and regression analyses. Behav. Res. Methods 2009, 41, 1149–1160. [Google Scholar] [CrossRef] [PubMed]
- Valls Martínez, M.D.C.; Ramírez-Orellana, A. Patient satisfaction in the Spanish national health service: Partial least squares structural equation modeling. Int. J. Environ. Res. Public Health 2019, 16, 4886. [Google Scholar] [CrossRef] [PubMed]
- Kim, H.Y. Statistical notes for clinical researchers: Assessing normal distribution (2) using skewness and kurtosis. Restor. Dent. Endod. 2013, 38, 52–54. [Google Scholar] [CrossRef]
- Jarvis, C.B.; MacKenzie, S.B.; Podsakoff, P.M. A critical review of construct indicators and measurement model misspecification in marketing and consumer research. J. Consum. Res. 2003, 30, 199–218. [Google Scholar] [CrossRef]
- Gudergan, S.P.; Ringle, C.M.; Wende, S.; Will, A. Confirmatory tetrad analysis in PLS path modeling. J. Bus. Res. 2008, 61, 1238–1249. [Google Scholar] [CrossRef]
- Barclay, D.; Higgins, C.; Thompson, R. The partial least squares (PLS) approach to causal modeling: Personal computer adoption and use as an illustration. Tech. Stud. 1995, 2, 285–309. [Google Scholar]
- Bagozzi, R.P.; Yi, Y. On the evaluation of structural equation models. J. Acad. Mark. Sci. 1988, 16, 74–94. [Google Scholar] [CrossRef]
- Gefen, D.; Straub, D.; Boudreau, M.C. Structural equation modeling and regression: Guidelines for research practice. Commun. Assoc. Inf. Syst. 2000, 4, 7. [Google Scholar] [CrossRef]
- Ali, Z.; Sun, H. and Ali, M. The impact of managerial and adaptive capabilities to stimulate organizational innovation in SMEs: A complementary PLS–SEM approach. Sustainability 2017, 9, 2157. [Google Scholar] [CrossRef]
- Chin, W.W. How to Write Up and Report PLS Analyses. In Handbook of Partial Least Squares; Esposito, V.V., Chin, W., Eds.; Springer: Berlin/Heidelberg, Germany, 2010; pp. 655–690. [Google Scholar]
- Moon, J.W.; Kim, Y.G. Extending the TAM for a world-wide-web context. Inform. Manag. 2001, 38, 217–230. [Google Scholar] [CrossRef]
- Liu, Y.; Li, H. Mobile internet diffusion in china: An empirical study. Ind. Manag. Data Syst. 2010, 110, 309–324. [Google Scholar] [CrossRef]
- Chen, J.L. The effects of education compatibility and technological expectancy on e-learning acceptance. Comput. Educ. 2011, 57, 1501–1511. [Google Scholar] [CrossRef]
- Malek, A.M.; Mat, N.K.N. Modeling the antecedents of internet banking service adoption (IBSA) in Jordan: A structural equation modeling (SEM) approach. J. Internet Bank. Commer. 1970, 16, 1–15. [Google Scholar]
- Shih, T.Y. Key factors of marketing strategies of mobile service innovations. Int. J. Innov. Learn. 2014, 16, 448–466. [Google Scholar] [CrossRef]
- O’brien, R.M. A caution regarding rules of thumb for variance inflation factors. Qual. Quant. 2007, 41, 673–690. [Google Scholar] [CrossRef]
- Montgomery, D.C.; Peck, E.A.; Vining, G.G. Introduction to Linear Regression Analysis, 4th ed.; John Wiley & Sons: Hoboken, NJ, USA, 2012. [Google Scholar]
- Hair Jr, J.F.; Sarstedt, M.; Hopkins, L.; Kuppelwieser, V.G. Partial least squares structural equation modeling (PLS-SEM). Eur. Bus. Rev. 2014, 2, 106–121. [Google Scholar] [CrossRef]
- Hu, L.T.; Bentler, P.M. Fit. indices in covariance structure modeling: Sensitivity to underparameterized model misspecification. Psychol. Methods 1998, 3, 424. [Google Scholar] [CrossRef]
- Wu, J.-H. and Wang, Y.-M. Measuring kms success: A respecification of the Delone and Mclean’s model. Inform Manag. 2006, 43, 728–739. [Google Scholar] [CrossRef]
- Tao, Z.; Zhang, B.; Lai, I.K.W. Perceived online learning environment and students’ learning performance in higher education: Mediating role of student engagement. In Proceedings of the International Conference on Technology in Education, Hong Kong, China, 9–11 January 2018. [Google Scholar]
- Gillenson, M.L.; Sherrell, D.L. Enticing online consumers: An extended technology acceptance perspective. Inf. Manag. 2002, 39, 705–719. [Google Scholar]
- Lau, A.S. Strategies to motivate brokers adopting on-line trading in Hong Kong financial market. Rev. Pacific Basin Financ. Mark. Policies 2002, 5, 471–489. [Google Scholar] [CrossRef]
- Taylor, S.; Todd, P. Decomposition and crossover effects in the theory of planned behavior: A study of consumer adoption intentions. Int. J. Res. Mark. 1995, 12, 137–155. [Google Scholar] [CrossRef]
- Moses, P.; Wong, S.L.; Bakar, K.A.; Mahmud, R. Perceived usefulness and perceived ease of use: Antecedents of attitude towards laptop use among science and mathematics teachers in Malaysia. Asia Pac. Educ. Res. 2013, 22, 293–299. [Google Scholar] [CrossRef]
- Nor, K.M.; Pearson, J.M.; Ahmad, A. Adoption of internet banking theory of the diffusion of innovation. Int. J. Mgt. Stud. 2010, 17, 69–85. [Google Scholar]
- Kolodinsky, J.M.; Hogarth, J.M.; Hilgert, M.A. The adoption of electronic banking technologies by us consumers. J. Mark. 2004, 22, 238–259. [Google Scholar] [CrossRef]
- Chen, N.S.; Huang, H.Y.; Shih, Y.C. Factors affecting usage of web-based teachers’ training in elementary and high school. In Proceedings of the International Conference on Computers in Education, Auckland, New Zealand, 3–6 December 2002. [Google Scholar]
- Taylor, S.; Todd, P. Assessing it usage: The role of prior experience. Manag. Inf. Syst. Q. 1995, 19, 561–570. [Google Scholar] [CrossRef]
- Al-Rahmi, W.M.; Yahaya, N.; Alamri, M.M.; Alyoussef, I.Y.; Al-Rahmi, A.M.; Kamin, Y.B. Integrating innovation diffusion theory with technology acceptance model: Supporting students’ attitude towards using a massive open online courses (MOOCs) systems. Interact. Learn. Environ. 2019, 27, 1–13. [Google Scholar] [CrossRef]
- John, S.P. The integration of information technology in higher education: A study of faculty’s attitude towards it adoption in the teaching process. Contad. Adm. 2015, 60, 230–252. [Google Scholar]
- Gao, L.; Waechter, K.A. Examining the role of initial trust in user adoption of mobile payment services: An empirical investigation. Inform. Syst. Front. 2017, 19, 525–548. [Google Scholar] [CrossRef]
- Karahanna, E.; Straub, D.W.; Chervany, N.L. Information technology adoption across time: A cross-sectional comparison of pre-adoption and post-adoption beliefs. Manag. Inf. Syst. Q. 1999, 23, 183–213. [Google Scholar] [CrossRef]
- Tan, M.; Teo, T.S. Factors influencing the adoption of internet banking. J. Assoc. Inf. Syst. 2000, 1, 5. [Google Scholar] [CrossRef]
- Plouffe, C.R.; Hulland, J.S.; Vandenbosch, M. Richness versus parsimony in modeling technology adoption decisions—Understanding merchant adoption of a smart card-based payment system. Inf. Syst. Res. 2001, 12, 208–222. [Google Scholar] [CrossRef]
- Lee, Y.C. The role of perceived resources in online learning adoption. Comput. Educ. 2008, 50, 1423–1438. [Google Scholar] [CrossRef]
- Al-Rahmi, W.M.; Yahaya, N.; Aldraiweesh, A.A.; Alamri, M.M.; Aljarboa, N.A.; Alturki, U.; Aljeraiwi, A.A. Integrating technology acceptance model with innovation diffusion theory: An empirical investigation on students’ intention to use e-learning systems. IEEE Access 2019, 7, 26797–26809. [Google Scholar] [CrossRef]
- Chau, P.Y.; Hu, P.J.H. Information technology acceptance by individual professionals: A model comparison approach. Decis. Sci. 2001, 32, 699–719. [Google Scholar] [CrossRef]
- Ma, M. A study on factors affecting consumers’ attitude towards online shopping and online shopping intention in Bangkok, Thailand. In Proceedings of the 7th International Conference on Innovation and Management, Wuhan, China, 4–5 December 2010. [Google Scholar]
- Yaghoubi, N.M.; Bahmani, E. Factors affecting the adoption of online banking: An integration of technology acceptance model and theory of planned behavior. Int. J. Bus. Manag. 2010, 5, 159–165. [Google Scholar] [CrossRef]
- Bagozzi, R.P. On the concept of intentional social action in consumer behavior. J. Consum. Res. 2000, 27, 388–396. [Google Scholar] [CrossRef]
- Johnson, D.H. The insignificance of statistical significance testing. J. Wildl. Manag. 1999, 63, 763–772. [Google Scholar] [CrossRef]
- Ljung, G.M.; Box, G.E. Analysis of variance with autocorrelated observations. Scand. J. Stat. 1980, 7, 172–180. [Google Scholar]
- Anderson, T.B.; Stanley, R.G. Field Trip Road Log: Geology and Tectonics of the Gualala Block. In Geology and Tectonics of the Gualala Block, Northern California; Elder, W.P., Ed.; The Pacific Section, SEPM Society for Sedimentary Geology: Los Angeles, CA., USA, 1998; pp. 213–222. [Google Scholar]
- Van Ark, B.; Inklaar, R.; McGuckin, R.H. ICT and productivity in Europe and the united states where do the differences come from? CESifo Econ. Stud. 2003, 49, 295–318. [Google Scholar] [CrossRef]
- Erumban, A.A.; De Jong, S.B. Cross-country differences in ICT adoption: A consequence of culture? J. World Bus. 2006, 41, 302–314. [Google Scholar] [CrossRef]
- Kaware, S.S.; Sain, S.K. ICT application in education: An overview. Int. J. Mult. App. Stud. 2015, 2, 25–32. [Google Scholar]


| Abbreviation | Explanations |
|---|---|
| CP | Compatibility (CP) [21] refers to the degree to which innovation is consistent with the current value, needs, and experience of potential adopters. |
| EU | Ease of use (EU) refers to students’ perceptions of the ease with which they can use the OSLP [43]. |
| ICU | Intention of continuous usage (ICU) refers to an individual’s intention to continue to use the OSLP after the initial usage [44]. |
| IDT | Rogers [9] defined innovation diffusion theory (IDT) as “the process by which an innovation is communicated through certain channels over time among the members of a social system.” |
| OS | Observability (OS) refers to the degree to which others can perceive the results of an innovation. |
| OSLP | Open source learning platforms (OSLP) are information systems where users can download and use source codes, write new features, fix bugs, improve performances, and learn from others about how specific problems can be solved. They have attracted a large population of registered users. |
| PA | PA is the abbreviation of perceived attitude. Attitude refers to a physical tendency that is expressed by evaluating a particular entity with some degree of favor or disfavor [45]. Attitude has a direct effect on intention to use technology [45,46]. |
| PU | Perceived usefulness (PU) [13] means that a learner thinks that it is beneficial to use the OSLP in completing their work. |
| RA | Relative advantage (RA) refers to an individual’s belief that the OSLP is better than traditional learning platforms and can be related to diverse economic, social, convenience, and satisfaction dimensions of learning platforms [47]. |
| TAM | Originally developed by Davis [11], the technology acceptance model (TAM) proposes that actual system use is influenced by an individual’s behavioral intention to use that system, which in turn is motivated by their attitudes towards using the technology [48]. |
| TL | Trialability (TL) refers to the degree to which an innovation is considered trialable before it is accepted whereas perceived OS refers to the degree to which others can perceive the results of an innovation. |
| Hypotheses | Results |
|---|---|
| H1 (RA→PA) | Supported |
| H2 (CP→PA) | Not Supported |
| H3 (EU→PA) | Not Supported |
| H4 (TL→PA) | Supported |
| H5 (EU→PU) | Supported |
| H6 (TL→PU) | Supported |
| H7 (OS→PU) | Supported |
| H8 (PU→PA) | Supported |
| H9 (PU→ICU) | Supported |
| H10 (PA→ICU) | Supported |
| Relationships | Direct | Indirect | Total |
|---|---|---|---|
| RA→ICU | - | 0.062 | 0.062 |
| RA→PA | 0.160 | - | 0.160 |
| CP→ICU | - | 0.030 | 0.030 |
| CP→PA | 0.077 | - | 0.077 |
| EU→ICU | - | 0.164 | 0.164 |
| EU→PA | −0.062 | 0.117 | 0.056 |
| EU→PU | 0.208 | - | 0.208 |
| OS→ICU | - | 0.262 | 0.262 |
| OS→PA | - | 0.187 | 0.187 |
| OS→PU | 0.331 | - | 0.331 |
| PA→ICU | 0.385 | - | 0.385 |
| PU→ICU | 0.574 | 0.217 | 0.791 |
| PU→PA | 0.563 | - | 0.563 |
| TL→ICU | - | 0.409 | 0.409 |
| TL→PA | 0.228 | 0.229 | 0.457 |
| TL→PU | 0.406 | - | 0.406 |
© 2020 by the authors. Licensee MDPI, Basel, Switzerland. This article is an open access article distributed under the terms and conditions of the Creative Commons Attribution (CC BY) license (http://creativecommons.org/licenses/by/4.0/).
Share and Cite
Huang, C.-Y.; Wang, H.-Y.; Yang, C.-L.; Shiau, S.J.H. A Derivation of Factors Influencing the Diffusion and Adoption of an Open Source Learning Platform. Sustainability 2020, 12, 7532. https://doi.org/10.3390/su12187532
Huang C-Y, Wang H-Y, Yang C-L, Shiau SJH. A Derivation of Factors Influencing the Diffusion and Adoption of an Open Source Learning Platform. Sustainability. 2020; 12(18):7532. https://doi.org/10.3390/su12187532
Chicago/Turabian StyleHuang, Chi-Yo, Hui-Ya Wang, Chia-Lee Yang, and Steven J. H. Shiau. 2020. "A Derivation of Factors Influencing the Diffusion and Adoption of an Open Source Learning Platform" Sustainability 12, no. 18: 7532. https://doi.org/10.3390/su12187532
APA StyleHuang, C.-Y., Wang, H.-Y., Yang, C.-L., & Shiau, S. J. H. (2020). A Derivation of Factors Influencing the Diffusion and Adoption of an Open Source Learning Platform. Sustainability, 12(18), 7532. https://doi.org/10.3390/su12187532